Section 7B
QRA for Shell LPG Depot
(PHI Assessment)

CONTENTS
1 INTRODUCTION 1
1.1 PURPOSE OF THE STUDY 1
1.2 GENERAL METHODOLOGY 2
2 SITE DESCRIPTION 4
2.1 SHELL’S FACILITIES AT AP LEI CHAU 4
2.2 SURROUNDING POPULATION 6
2.3 METEOROLOGICAL CONDITIONS 9
3 HAZARD IDENTIFICATION 11
3.1 REVIEW OF PAST ACCIDENTS 11
3.2 HAZARD IDENTIFICATION 24
4 FREQUENCY ANALYSIS 27
4.1 BASE EVENT FREQUENCIES 27
4.2 EVENT TREE ANALYSIS 28
4.3 PROJECTILES 32
4.4 SUMMARY 39
5 CONSEQUENCE ANALYSIS 42
5.1 OVERVIEW 42
5.2 SOURCE TERM MODELLING 42
5.3 PHYSICAL EFFECTS MODELLING 42
5.4 HAZARD IMPACT ON OFFSITE POPULATION 45
5.5 GAS INGRESS INTO SOUTH HORIZONS MTR STATION 45
5.6 CONSEQUENCE RESULTS 46
6 RISK RESULTS 53
6.1 RISK SUMMATION 53
6.2 SOCIETAL RISK 53
6.3 INDIVIDUAL RISK 59
6.4 THE LPG DEPOT AND EXPLOSIVES DELIVERIES VIA LEE NAM ROAD 63
7 CONCLUSIONS 65
8 REFERENCES 66
ERM-HONG KONG LTD WEEK 30 - JULY 2010
A7B-1
1 INTRODUCTION
1.1 PURPOSE OF THE STUDY
The South Island Line (East) project (SIL(E)) is planned to be a medium
capacity railway with stations at South Horizons (SOH), Lei Tung, Wong
Chuk Hang, Ocean Park and Admiralty. Under Section 5(7) of the
Environmental Impact Assessment (EIA) Ordinance (Cap. 499) (EIAO), the
Director of Environmental Protection (Director) from the Environmental
Protection Department (EPD) has issued a Study Brief No. ESB-181/2008 for
this project (EIA Study Brief). Section 3.4.5 of the EIA Study Brief specifies
Hazard to Life assessments to be conducted for the Project.
In Section 3.4.5.3 of the EIA Study Brief, it is stated that a hazard assessment
should be carried out for aspects of the Project that fall within the
Consultation Zone of the LPG Transit Depot/Bulk Domestic Supply at Lee
Nam Road (the LPG Depot). For completeness, these requirements are
repeated in Table 1.1. This Appendix addresses these requirements.
Table 1.1 EIA Study Brief - Hazard to Life Requirement
3.4.5 Hazard to Life
3.4.5.3 The Applicant shall carry out hazard assessment to evaluate potential hazard to life due to the construction and operation of those parts of the Project which fall within the Consultation Zone of the LPG Transit Depot/Bulk Domestic Supply at Lee Nam Road.
The hazard assessment shall include the following:
(i) Identify hazardous scenarios associated with the facilities/activities of the LPG Transit Depot/Bulk Domestic Supply at Lee Nam Road and then determine a set of relevant scenarios to be included in a Quantitative Risk Assessment (QRA);
(ii) Execute a QRA of the set of hazardous scenarios determined in (i), expressing population risks in both individual and societal terms;
(iii) Compare individual and societal risks with the criteria for evaluating hazard to life stipulated in Annex 4 of the TM; and
(iv) Identify and assess practicable and cost-effective risk mitigation measures.
The methodology of the hazard assessment shall be agreed and approved by the Director.
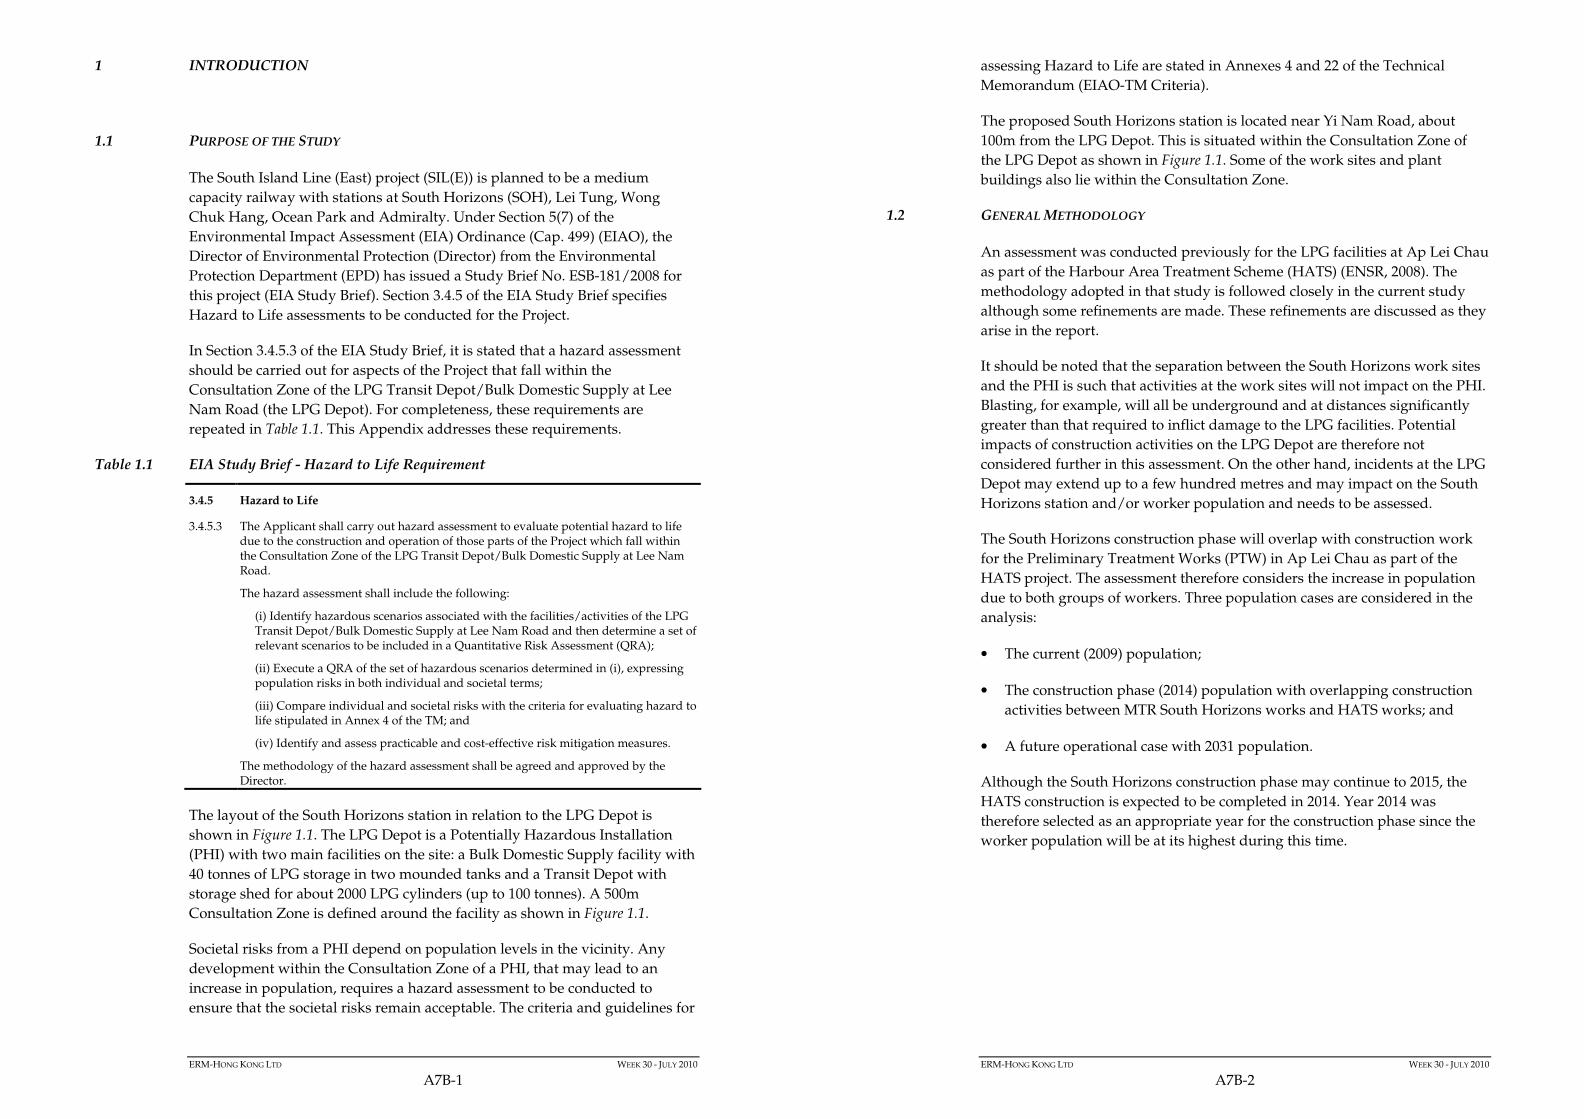
The layout of the South Horizons station in relation to the LPG Depot is
shown in Figure 1.1. The LPG Depot is a Potentially Hazardous Installation
(PHI) with two main facilities on the site: a Bulk Domestic Supply facility with
40 tonnes of LPG storage in two mounded tanks and a Transit Depot with
storage shed for about 2000 LPG cylinders (up to 100 tonnes). A 500m
Consultation Zone is defined around the facility as shown in Figure 1.1.
Societal risks from a PHI depend on population levels in the vicinity. Any
development within the Consultation Zone of a PHI, that may lead to an
increase in population, requires a hazard assessment to be conducted to
ensure that the societal risks remain acceptable. The criteria and guidelines for
ERM-HONG KONG LTD WEEK 30 - JULY 2010
A7B-2
assessing Hazard to Life are stated in Annexes 4 and 22 of the Technical
Memorandum (EIAO-TM Criteria).
The proposed South Horizons station is located near Yi Nam Road, about
100m from the LPG Depot. This is situated within the Consultation Zone of
the LPG Depot as shown in Figure 1.1. Some of the work sites and plant
buildings also lie within the Consultation Zone.
1.2 GENERAL METHODOLOGY
An assessment was conducted previously for the LPG facilities at Ap Lei Chau
as part of the Harbour Area Treatment Scheme (HATS) (ENSR, 2008). The
methodology adopted in that study is followed closely in the current study
although some refinements are made. These refinements are discussed as they
arise in the report.
It should be noted that the separation between the South Horizons work sites
and the PHI is such that activities at the work sites will not impact on the PHI.
Blasting, for example, will all be underground and at distances significantly
greater than that required to inflict damage to the LPG facilities. Potential
impacts of construction activities on the LPG Depot are therefore not
considered further in this assessment. On the other hand, incidents at the LPG
Depot may extend up to a few hundred metres and may impact on the South
Horizons station and/or worker population and needs to be assessed.
The South Horizons construction phase will overlap with construction work
for the Preliminary Treatment Works (PTW) in Ap Lei Chau as part of the
HATS project. The assessment therefore considers the increase in population
due to both groups of workers. Three population cases are considered in the
analysis:
• The current (2009) population;
• The construction phase (2014) population with overlapping construction
activities between MTR South Horizons works and HATS works; and
• A future operational case with 2031 population.
Although the South Horizons construction phase may continue to 2015, the
HATS construction is expected to be completed in 2014. Year 2014 was
therefore selected as an appropriate year for the construction phase since the
worker population will be at its highest during this time.
ERM-HONG KONG LTD WEEK 30 - JULY 2010
A7B-3
Figure 1.1 South Horizons Station Location
Shell Depot
Consultation Zone
LPG Depot
Location of proposed South
Horizons Station

ERM-HONG KONG LTD WEEK 30 - JULY 2010
A7B-4
2 SITE DESCRIPTION
2.1 SHELL’S FACILITIES AT AP LEI CHAU
Shell’s LPG site is defined in the 2000 PHI Register (Planning & Lands Bureau,
2000) as a PHI (Potentially Hazardous Installation) on account of storing
Liquefied Petroleum Gas (LPG) in excess of 25 tonnes. The facility consists of
an LPG Bulk Domestic Supply (LPG Compound) and a Transit Depot (Figure
2.1). The LPG Compound is located on the south side of the site while the
Transit Depot (LPG Storage Shed) is situated on the north side. Deliveries are
made by road tankers and cylinder wagons using Dangerous Goods ferries
that berth at a jetty on the northwest of the site. An area for parking LPG road
tankers and cylinder wagons is provided in front of the Storage Shed.
Figure 2.1 LPG Depot Layout
2.1.1 LPG Bulk Domestic Supply
A process flow diagram for the LPG compound is shown in Figure 2.2. LPG is
stored in two 20 tonne mounded tanks. These tanks are filled to at most 85%,
giving a maximum storage of 34 tonnes. LPG is vaporised in 5 water heated
vaporisers and the pressure let down to 1 psi for send out to domestic
customers in the area. 2 electrically heated vaporisers are available on
standby. An unloading bay is provided for unloading LPG road tankers.
Three LPG road tanker deliveries are made per day, on a single DG ferry
round trip.
ERM-HONG KONG LTD WEEK 30 - JULY 2010
A7B-5
Figure 2.2 Storage Compound Process Flow Diagram
A summary of the Bulk Compound operating data is provided in Table 2.1.
Table 2.1 Bulk Domestic Supply Facility Operating Data
Description Number
LPG road tanker deliveries 3 per day (1 ro-ro ferry round trip)
LPG road tanker size 9 tonne
LPG storage 2 × 20 tonne mounded tanks (filled to 85% = 34 tonnes)
Storage pressure ~ 3.5 barg
Unloading time 2 hours
Vaporisers 5 hot water heaters + 2 electric heaters
2.1.2 LPG Transit Depot
The Transit Depot provides storage and transit for LPG cylinders. Cylinders
are delivered to the store by ferry services. Cylinder capacities range from 2 kg
V
5 hot water vaporizers
2 electric vaporizers
2 storage vessels
filling point
hose
tanker
PT
V
V
V
V
V
PT
PT
send out V

ERM-HONG KONG LTD WEEK 30 - JULY 2010
A7B-6
to 49 kg, with 13.5 kg being the most common size. Typically, around 2200
filled cylinders are stored within the shed at any time, with a further 900
empty cylinders. The LPG storage platform, near the waterfront, is used for
temporary handling of cylinders.
Throughput at the Transit Depot amounts to 900 (max) cylinders per day,
delivered on 3 cylinder wagons and a single DG ferry round trip. The depot
operators also load/unload cylinder wagons of local distributors for delivery
to customers in Hong Kong Island South. These distributors’ wagons may be
5.5 tonne or 8 tonne in size.
Apart from LPG cylinder wagons, the ro-ro ferry pier is also the landing place
for LPG tankers supplying the LPG Compound and bulk diesel /petrol
tankers (4 ~ 5 trucks per day) serving public filling stations on Hong Kong
Island. 5 cylinder wagons are parked on site overnight, with a further 2 LPG
tankers on stand-by overnight during typhoons.
A summary of the Transit Deport operating data (Shell, 2009) is provided in
Table 2.2.
Table 2.2 Transit Depot Operating Data
Description Number
LPG cylinder wagon deliveries 3 per day (1 ro-ro ferry round trip)
Cylinder throughput 900 per day max (277,000 average per year)
Cylinder storage Max 4,300, average 2,200
Cylinder transport to customers Distributors’ wagons. 5.5 tonne (65 cylinders) or 8 tonne
(125 cylinders)
Cylinder size distribution 2kg – 8%
8kg – 24%
10.5kg – 5%
13.5kg – 39%
15kg – 8%
49kg – 16%
Storage pressure ~ 3.5 barg
Construction Storage shed with open walls and natural ventilation
Safety systems 4 gas detectors with automatic water sprinklers and
hydrants.
2.2 SURROUNDING POPULATION
Population in the vicinity of the LPG Depot is summarized in Table 2.3 and
Figure 2.3. Population was based on the HATS study (ENSR, 2008), data from
the Census and Statistics Department for mid 2006 and site surveys. A
population growth of 1% per year was assumed, consistent with previous
studies in Hong Kong (ERM, 2009).
The future 2031 case considers the South Horizons MTR station during
operational phase. Operation of the MTR will likely shift patronage away
from buses and onto the trains. This may change outdoor population
distributions at street level. Bus stops are currently distributed around the
South Horizons residential development and considering that some waiting at
ERM-HONG KONG LTD WEEK 30 - JULY 2010
A7B-7
bus stops is necessary, the shift to usage of the MTR will likely cause a
reduction in outdoor population. For simplicity, the analysis conservatively
assumes outdoor population will grow at the same rate as indoor population
i.e. by 1% per year. No redistribution in population is imposed due to
construction of the MTR station.
It is possible the population in Horizon Plaza may increase beyond the 1%
growth rate assumed in Table 2.3 since visiting the area will be more
convenient once SIL is operational. However, it was found in the analysis that
none of the accident consequences have sufficient range to reach Horizon
Plaza except for projectiles which are shielded by the neighbouring residential
blocks. Therefore, increasing the Horizon Plaza population further to allow for
increasing visitors will have no impact on the results.
Table 2.3 Population in Vicinity of Shell Depot
Population Group Current
Population
(Year 2009)
Construction
Phase Population
(2014)
Future
Population
(2031)
South Horizons Blocks 21 to 23A 3915 4074 4873
South Horizons Blocks 25 to 28 3270 3402 4070
South Horizons Blocks 29 to 33A 4508 4691 5611
South Horizons Blocks 17 to 20 4430 4610 5514
South Horizons Blocks 13A,15,16 3236 3366 4026
Horizon Plaza 3180 3309 3958
Dah Chon Hong 795 827 990
Driving School 50 50 50
Highway Dept. Material Store 2 2 2
Lee Nam Road Vehicle Pass. 20 21 25
Lee Nam Road Pedestrians 8 8 10
Sea population within 500m 10 10 12
PTW – DSD Operators* 4 3 4
PTW Construction Site 0 61 0
MTR Works Site A 0 200 0
MTR Works Site B 0 150 0
MTR Works Site C 0 250 0
MTR Works Site W2 0 100 0
MTR Barging Point B2a 0 100 0
South Horizons Station 0 0 280†
* DSD = Drainage Services Department
† Based on MTRC forecast of 63,600 passengers per day and assuming each person spends 5
minutes within the station and operations run for 19 hours per day. The station population is,
however, all underground and will be unaffected by any incidents at the LPG Depot.

ERM-HONG KONG LTD WEEK 30 - JULY 2010
A7B-8
Figure 2.3 Ap Lei Chau Population
In order to reflect different populations at different times of the day, 4 time
periods are used and the occupancy specified for each (Table 2.4). Daytime is
defined as 07:00 to 19:00 and night-time from 19:00 to 07:00.
Since persons indoors will be offered some protection from fires and
explosions, the analysis makes a distinction between those indoors and
outdoors. The HATS study (ENSR, 2008) considered 5% of the population to
be outdoors. This is refined in this study by adopting a more detailed
breakdown for different types of population (Table 2.4), which is consistent
with other studies in Hong Kong (ERM, 2006 for example).
Table 2.4 Population Occupancy and Indoor/Outdoor Fractions
Occupancy % Outdoors
Weekday Weekend Weekday Weekend
Population Type
day night day night day night day night
Residential 20 % 100 % 80 % 100 % 10 % 0 % 20 % 0 %
Industrial/Commercial 100 % 10 % 10 % 10 % 10 % 5 % 10 % 5 %
Shopping Centre 50 % 10 % 100 % 10 % 10 % 0 % 10 % 0 %
Road 100 % 20 % 100 % 20 % 0 % 0 % 0 % 0 %
Sea 100 % 0 % 100 % 0 % 100 % 100 % 100 % 100 %
PTW Construction 100 % 10 % 100 % 10 % 90% 5 % 90 % 5 %
MTR works sites 100 % 50 % 100 % 50 % 100 % 100 % 100% 100 %
Horizon Plaza
Dah Chong
Hong
21 22 23 23A
26
25
28
27 33A 17 18
19 20
13A 15 16
South Horizons
Driving
School Highway Dept.
Material Store
PTW Construction
Site
PTW DSD
Operators
LPG Bulk
Domestic Supply
LPG Transit
Depot
Works Site A
Works Site B
Works Site C
Lee N
am
Rd
.
29 30 31
32
33
Works Site W2
MTR Barging Point B2a
ERM-HONG KONG LTD WEEK 30 - JULY 2010
A7B-9
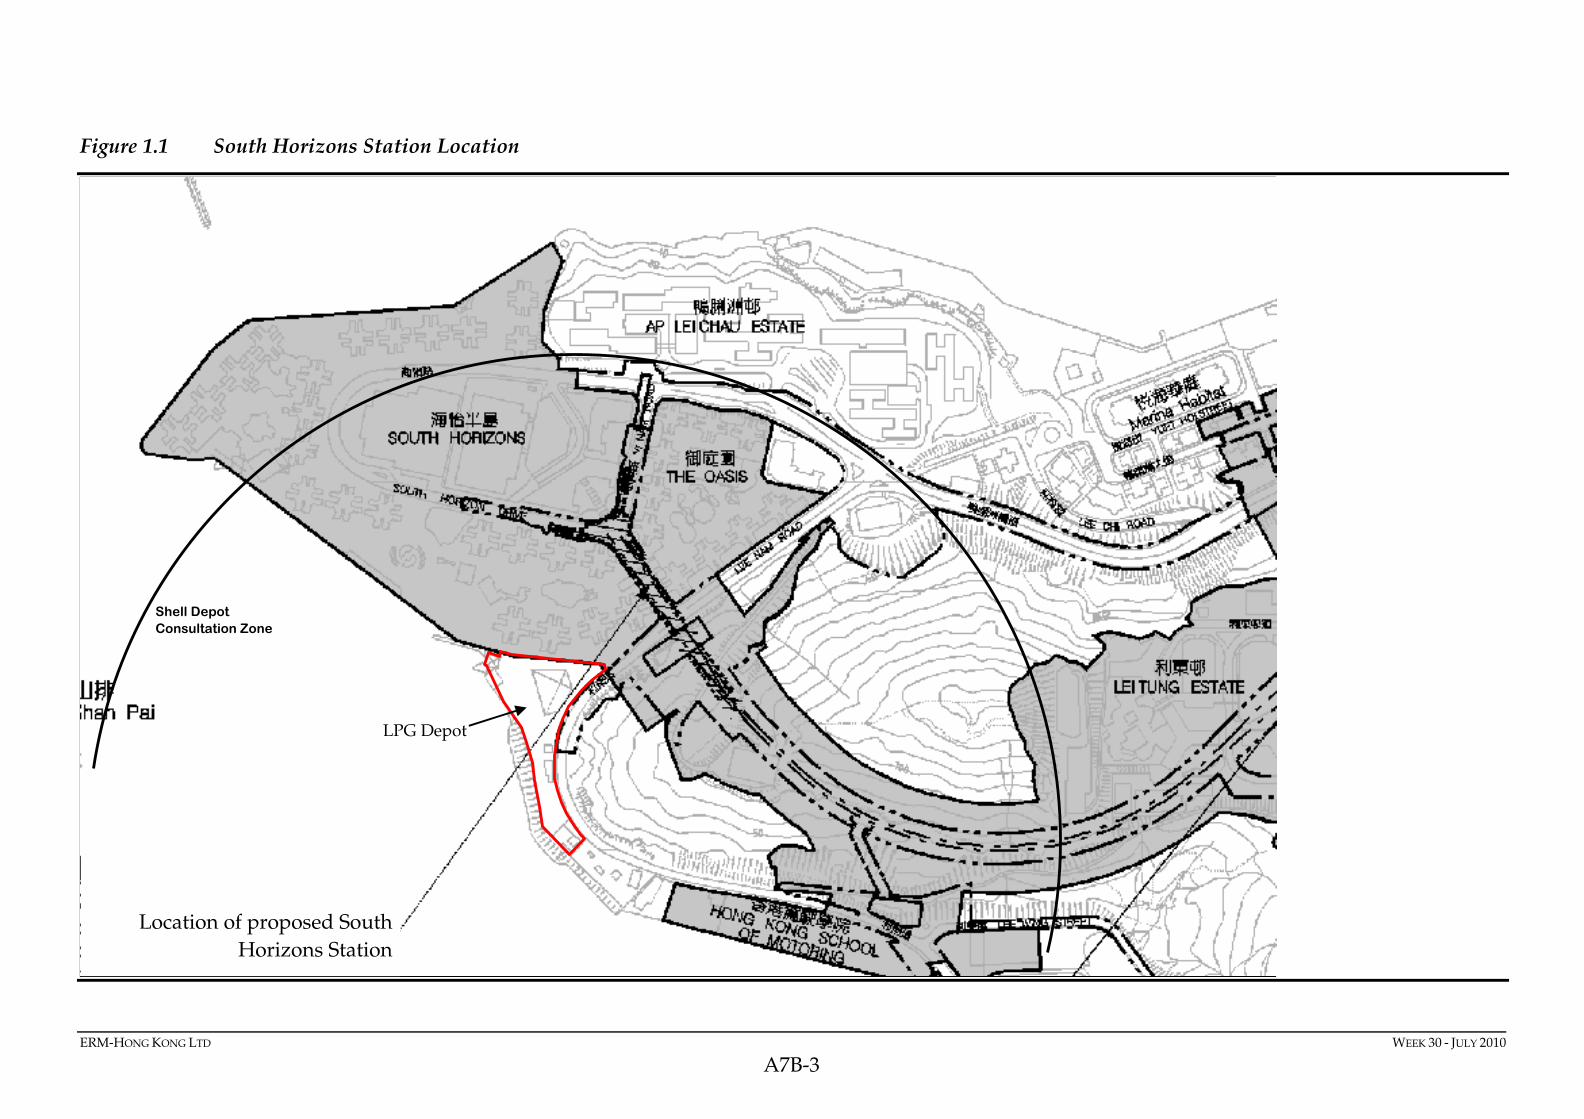
2.3 METEOROLOGICAL CONDITIONS
Meteorological conditions affect the dispersion behaviour of gas releases,
particularly the wind speed, wind direction and atmospheric stability class.
Weather data from the most recent 5 years (2004 to 2008) from Wong Chuk
Hang weather station of the Hong Kong Observatory were used in the
analysis. This weather data were rationalised into 5 categories to represent the
range of weather conditions expected at the site. These categories were
selected by reference to the HATS study (ENSR, 2008) and are denoted as 3B,
3D, 7D, 3E and 1.4F, where ‘3B’ for example refers to a wind speed of 3 m/s
and Pasquill atmospheric stability class of B.
The resulting probability of occurrence for each combination of wind speed,
direction and stability class is summarised in Table 2.5 and a wind rose plot is
shown in Figure 2.4.
Table 2.5 Meteorological Data
Wind Direction Weather Category – Probability of Occurrence
3B 3D 7D 3E 1.4F Total
Day
0° 0.021 0.015 0.001 0.005 0.016 0.059
30° 0.014 0.012 0.002 0.006 0.006 0.040
60° 0.027 0.016 0.001 0.010 0.009 0.062
90° 0.080 0.050 0.020 0.022 0.016 0.189
120° 0.143 0.064 0.021 0.026 0.022 0.276
150° 0.099 0.026 0.001 0.010 0.018 0.154
180° 0.015 0.007 0.000 0.001 0.009 0.033
210° 0.008 0.005 0.000 0.001 0.007 0.022
240° 0.032 0.008 0.000 0.003 0.009 0.052
270° 0.022 0.006 0.000 0.003 0.005 0.035
300° 0.016 0.007 0.000 0.003 0.004 0.029
330° 0.020 0.012 0.001 0.009 0.006 0.048
Total 0.497 0.228 0.048 0.099 0.128 1.000
Night
0° 0.000 0.008 0.002 0.014 0.116 0.140
30° 0.000 0.013 0.005 0.021 0.025 0.064
60° 0.000 0.013 0.002 0.021 0.032 0.068
90° 0.000 0.069 0.030 0.067 0.067 0.232
120° 0.000 0.058 0.028 0.062 0.072 0.220
150° 0.000 0.004 0.001 0.008 0.046 0.058
180° 0.000 0.000 0.000 0.001 0.026 0.027
210° 0.000 0.001 0.000 0.002 0.032 0.034
240° 0.000 0.001 0.000 0.004 0.035 0.040
270° 0.000 0.000 0.000 0.004 0.025 0.030
300° 0.000 0.003 0.000 0.006 0.022 0.031
330° 0.000 0.007 0.002 0.016 0.030 0.054
Total 0.000 0.179 0.069 0.224 0.528 1.000
ERM-HONG KONG LTD WEEK 30 - JULY 2010
A7B-10
Figure 2.4 Wind Rose
0.05 0.1
0.15 0.2
0.25
30
210
60
240
90270
120
300
150
330
180
0
>6 m/s
(4-6) m/s
(2-4) m/s
(0-2) m/s
ERM-HONG KONG LTD WEEK 30 - JULY 2010
A7B-11
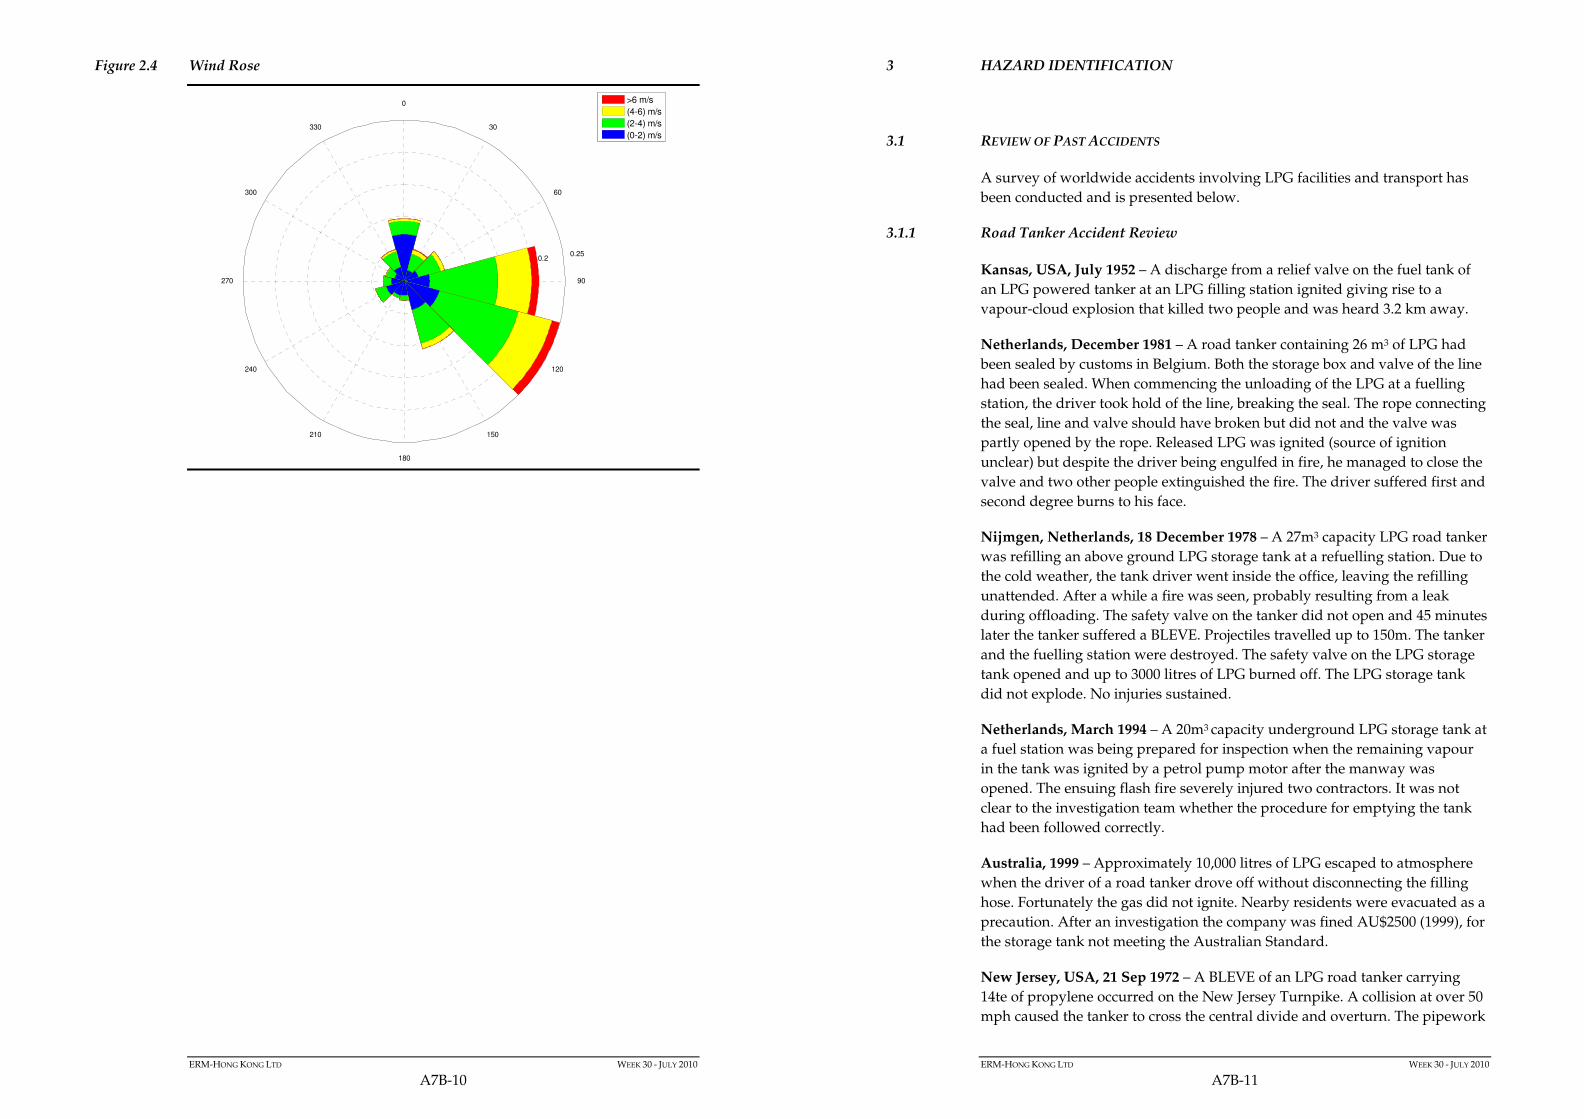
3 HAZARD IDENTIFICATION
3.1 REVIEW OF PAST ACCIDENTS
A survey of worldwide accidents involving LPG facilities and transport has
been conducted and is presented below.
3.1.1 Road Tanker Accident Review
Kansas, USA, July 1952 – A discharge from a relief valve on the fuel tank of
an LPG powered tanker at an LPG filling station ignited giving rise to a
vapour-cloud explosion that killed two people and was heard 3.2 km away.
Netherlands, December 1981 – A road tanker containing 26 m3 of LPG had
been sealed by customs in Belgium. Both the storage box and valve of the line
had been sealed. When commencing the unloading of the LPG at a fuelling
station, the driver took hold of the line, breaking the seal. The rope connecting
the seal, line and valve should have broken but did not and the valve was
partly opened by the rope. Released LPG was ignited (source of ignition
unclear) but despite the driver being engulfed in fire, he managed to close the
valve and two other people extinguished the fire. The driver suffered first and
second degree burns to his face.
Nijmgen, Netherlands, 18 December 1978 – A 27m3 capacity LPG road tanker
was refilling an above ground LPG storage tank at a refuelling station. Due to
the cold weather, the tank driver went inside the office, leaving the refilling
unattended. After a while a fire was seen, probably resulting from a leak
during offloading. The safety valve on the tanker did not open and 45 minutes
later the tanker suffered a BLEVE. Projectiles travelled up to 150m. The tanker
and the fuelling station were destroyed. The safety valve on the LPG storage
tank opened and up to 3000 litres of LPG burned off. The LPG storage tank
did not explode. No injuries sustained.
Netherlands, March 1994 – A 20m3 capacity underground LPG storage tank at
a fuel station was being prepared for inspection when the remaining vapour
in the tank was ignited by a petrol pump motor after the manway was
opened. The ensuing flash fire severely injured two contractors. It was not
clear to the investigation team whether the procedure for emptying the tank
had been followed correctly.
Australia, 1999 – Approximately 10,000 litres of LPG escaped to atmosphere
when the driver of a road tanker drove off without disconnecting the filling
hose. Fortunately the gas did not ignite. Nearby residents were evacuated as a
precaution. After an investigation the company was fined AU$2500 (1999), for
the storage tank not meeting the Australian Standard.
New Jersey, USA, 21 Sep 1972 – A BLEVE of an LPG road tanker carrying
14te of propylene occurred on the New Jersey Turnpike. A collision at over 50
mph caused the tanker to cross the central divide and overturn. The pipework

ERM-HONG KONG LTD WEEK 30 - JULY 2010
A7B-12
on the tanker was not isolated and started to leak. The excess flow valve failed
to isolate the leak because the leak was small. The trucks diesel tank was also
damaged in the crash and the leaking diesel fuel ignited. This ignited the
leaking propylene to form a jet fire that engulfed the tanker.
The fire caused the PRVs to lift but because the tanker was on its side, liquid
propylene was released which ignited and spread across the highway. After
25 minutes had elapsed, with an estimated 10te of propylene still in the tank, a
BLEVE occurred. The fireball extended at least 100m and passed over one
occupied vehicle but the occupant was not injured. 28 bystanders were
injured, including 7 policemen. One of the injuries occurred 180m from the
tanker and the force of the blast propelled the main tank section 400m.
Ref: HCB, Sep 1984
Saint-Amand-les-Eaux, France, 1 Feb 1973 – A BLEVE of a road tanker
carrying 20te of propane. An articulated tanker travelling at 30 mph
overturned in a traffic accident. Propane leaked from a PRV damaged in the
accident. The gas ignited within a minute forming a jet fire 10-30m long,
which deflected from the ground and spread to nearby houses. Fire services
tried to cool the tanker but after 10-15 minutes a BLEVE occurred. The tank
disintegrated, destroying a house and sending fragments 450m. There were a
total of 9 fatalities (some from the crash rather than related to the propane
release), 23 serious injuries, 22 minor injuries and 9 vehicles and 13 houses
destroyed. 100 spectators only 40m from the tanker survived.
Ref: OECD 1988, “Transporting hazardous Goods by Road”
Hubert P., 1989, “Sequence and Implications of the Accident at Saint-
Amand-les-Eaux” (ACDS/MHT/TWP/44)
Casula, NSW, Australia, 21 Oct 1976 – Leak from an LPG road tanker. The
vehicle’s tail shaft broke and hit the liquid outlet line, breaking it and causing
liquid LPG to escape. The damage to the pipe also prevented the excess flow
valve from functioning and the shut-off valve only reduced the flow but did
not stop it. The tank contents were transferred to other tankers but 2te of LPG
was released. There was no ignition and no injuries reported.
Ref: Department of Environment and Planning, 1983, “hazard Study of
Liquefied Petroleum Gas in Automotive retail Outlets”, New South Wales,
Australia.
San Carlos, Spain, 11 Jul 1978 – A fire occurred in an articulated propylene
road tanker due to overfilling. The tanker was overloaded with 23.5te of
propylene, compared to its permitted load of 19.4te and the tanker was not
fitted with a PRV. The tank disintegrated, due to thermal expansion of the
propylene, into 3 parts which were projected up to 220m. Ignition occurred
after 1 minute leading to a flash fire (although some reports describe it as a
BLEVE).
The incident occurred next to a camp site. The fire destroyed several buildings
and killed 217 people with an additional 67 injuries.
ERM-HONG KONG LTD WEEK 30 - JULY 2010
A7B-13
Ref: Hymes I., 1983, “The Physiological and Pathological Effects of Thermal
radiation”, SRD Report R275.
Wispertal, Germany, 4 Jul 1985 – Controlled flaring from a propane tanker.
An LPG road tanker overturned on a sharp bend and fell down a steep slope,
coming to rest in a tree. The accident killed the driver but there was no leak.
Recovering the tanker intact was deemed to be too dangerous and the nozzle
of the filling valve only reached the vapour space. Thus the vapour had to be
flared with vaporisation aided by spraying warm water on the tank. The
operation lasted 2.5 days.
Ref: Droste B. and Mallon M., 1989, ‘A statistical Review of the Reasons
Leading to LPG Accidents”, BAM, Berlin.
Memphis, Tennessee, USA, 23 Dec 1988 – Fireball after propane tanker
collision with a bridge. A 36m3 propane tanker overturned on a highway and
slid along the road for 60m before colliding with a bridge buttress. The tank
ruptured forming a vapour cloud that drifted 460m and then ignited in a
fireball. Several vehicles on both carriageways were caught in the fire and
most of their occupants died. Several buildings also caught fire and one
occupant died. The tank shell was projected 120m, crushing a house and
leading to secondary fires and 2 fatalities. There were a total of 9 fatalities and
12 injuries.
Ref: Loss Prevention Bulletin 094
MHIDAS
Candasnos, Spain, 31 Jan 1990 – Fireball after collision with bridge. An
articulated tanker carrying 18te of propane veered off the highway after the
driver fell asleep. The tanker struck a bridge buttress. Propane escaped and
ignited forming a 500m radius fireball. The fireball enveloped 4 vehicles
killing 6 people.
Ref: MHIDAS
Bangkok, Thailand, 24 Sep 1990 – Fire following road accident. A flat bed
truck had been adapted into a tanker using 2 pressure vessels designed for
static use. The tanker was unlicensed and was carrying 1.5te of LPG. The
driver was under the influence of alcohol and drugs and was speeding when
the vehicle overturned in an accident. LPG was released from the tanks and
ignited in a flash fire that destroyed 40 vehicles. The fire also spread to
adjacent shops and buildings and a squatter camp. A total of 68 people died
and over 100 were injured. 48 shops and 57 cars were destroyed.
Ref: HCB, Nov 90
Toronto, Canada, 8 Apr 1991 – Leak after collision with a bridge. A 45m3
propane road tanker tried to pass under a low bridge following a diversion
around a road accident. The bridge was too low and sheared off the 2 PRVs.
Propane jets 3m high were formed above each valve. Over 2000 residents were

ERM-HONG KONG LTD WEEK 30 - JULY 2010
A7B-14
evacuated and a water curtain used to disperse the gas. The release was not
ignited and there were no injuries.
Ref: HCB, Oct 91
Wandong, Victoria, Australia, 26 Jun 1991 – BLEVE of an LPG road tanker.
The tanker was hit from behind in a road accident, causing a leak from the
drain valve. The driver used his radio to warn on-coming traffic and stopped
other vehicles and persuaded them to block the traffic. These actions ensured
that when the BLEVE occurred, nobody was within range. There were no
injuries or fatalities.
Ref: HCB, Oct 1991.
Agen, France, 25 Aug 1992 – Leak after road accident. An LPG road tanker
was hit from behind in a road accident causing a rupture of the tankers
pipework. 16m3 of LPG was released but no ignition occurred. Nearby
residents were evacuated for 10 hours.
Ref: HCB, Nov 1992.
New York, USA, 27 Jul 1994 – Fireball after collision with bridge. A tanker
carrying 35m3 of propane veered off the road and struck a bridge support
column. The tank ruptured and caught fire. The main part of the tank was
projected 100m and crushed 2 homes. The fireball set fire to 8 nearby homes.
23 people were injured.
Ref: HCB, Oct 1994.
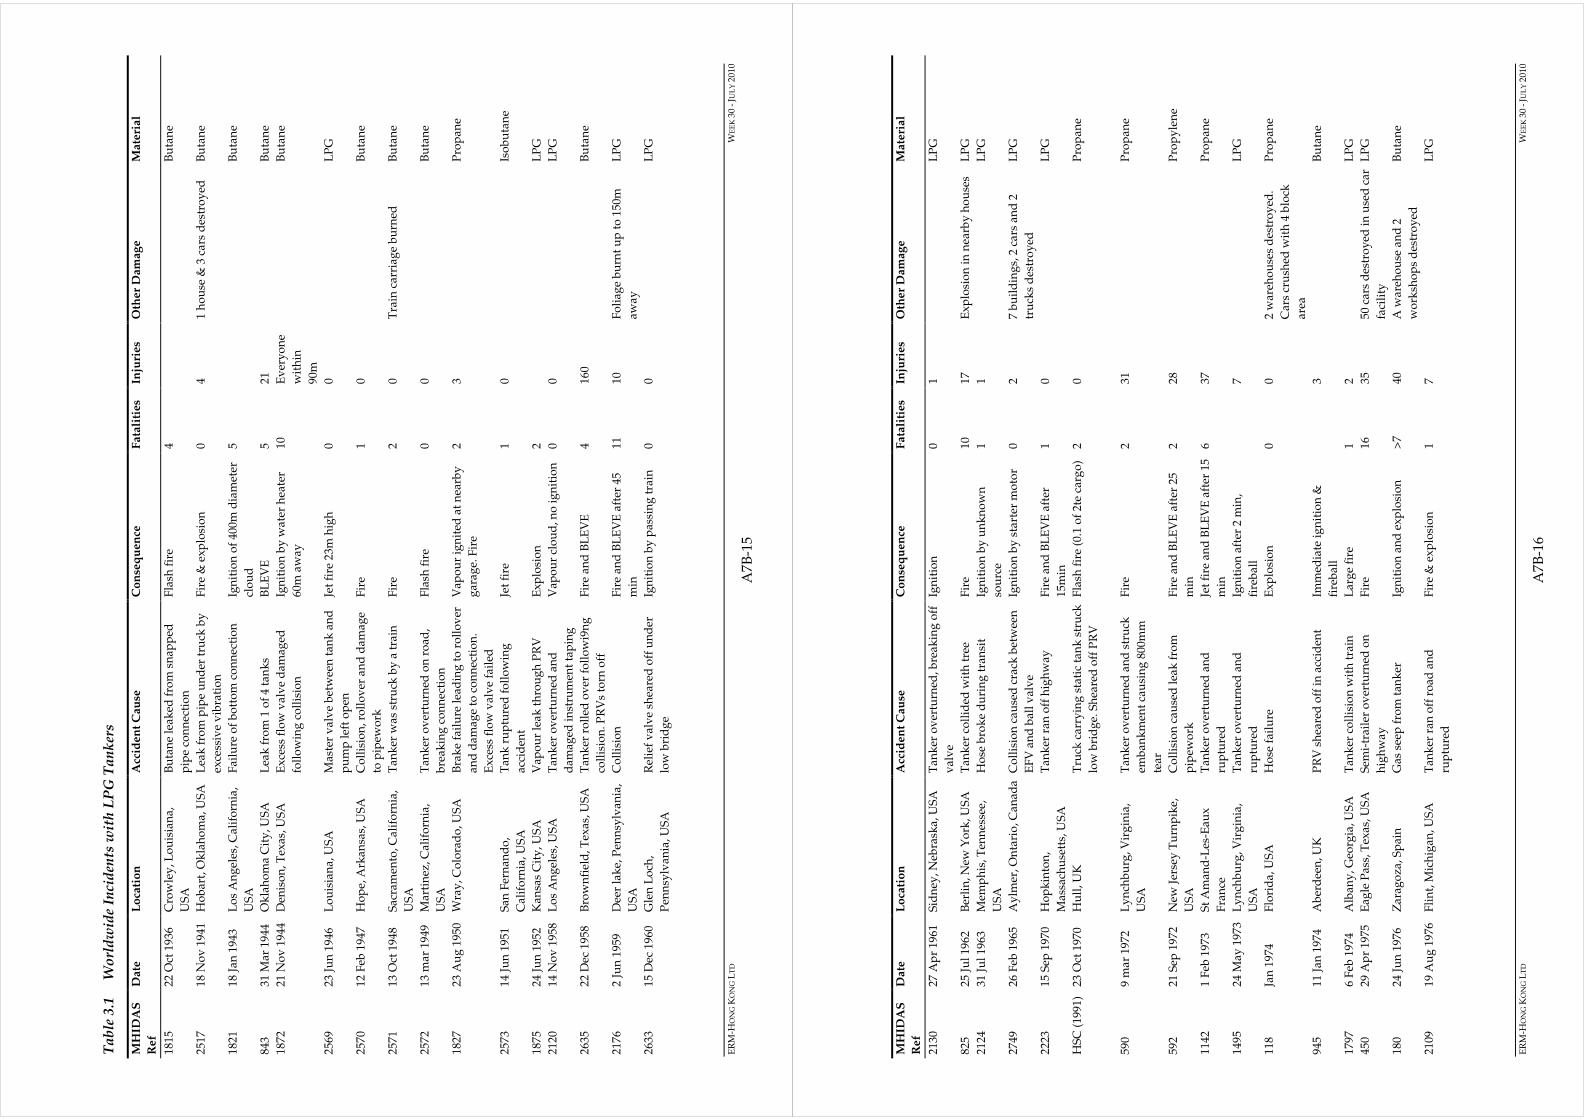
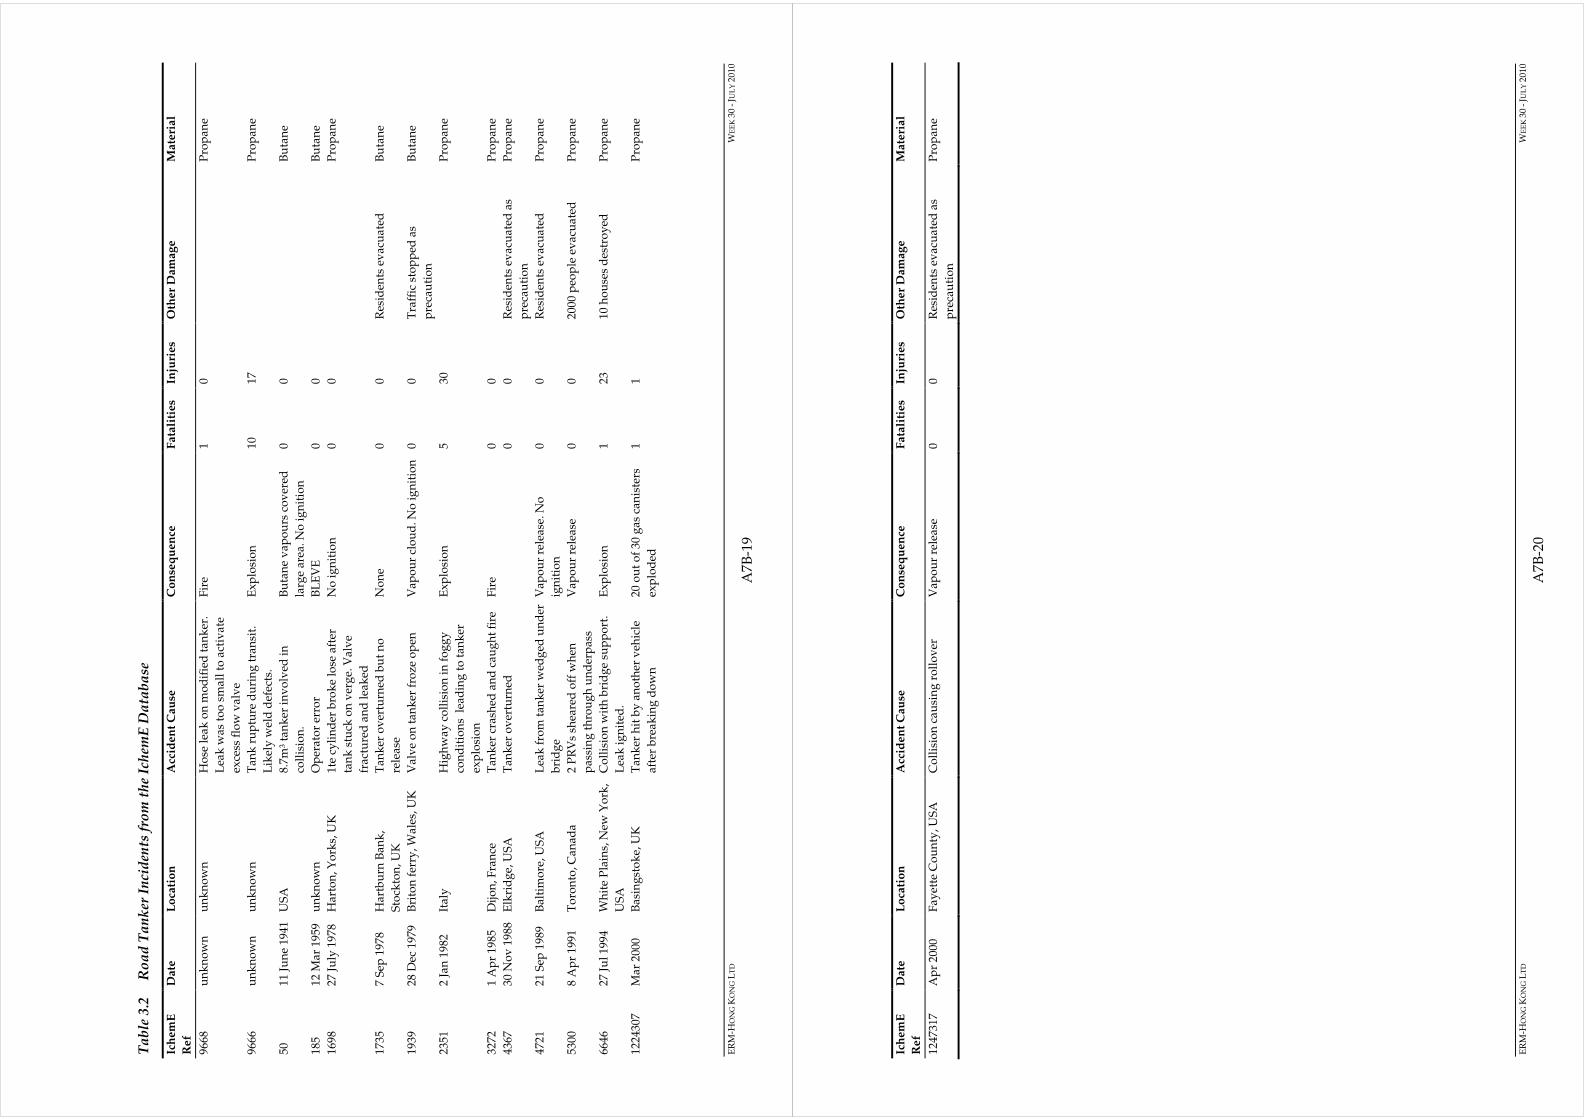
Other incidents listed in MHIDAS for LPG are summarised in Table 3.1 and in
Table 3.2 for the IchemE database. Table 3.3 lists incidents specifically related to
LPG cylinder vehicles.
ER
M-H
ON
G K
ON
G L
TD
W
EE
K 3
0 -
JU
LY
20
10
A7
B-1
5
Ta
ble
3.1
W
orl
dw
ide
Inci
den
ts w
ith
LP
G T
an
ker
s
MH
IDA
S
Ref
Date
L
oca
tio
n
Acc
ide
nt
Cau
se
Co
nse
qu
en
ce
Fa
tali
ties
Inju
ries
Oth
er
Dam
ag
e
Mate
rial
1815
22
Oct
193
6 C
row
ley
, Lo
uis
ian
a,
US
A
Bu
tan
e le
aked
fro
m s
nap
ped
pip
e co
nn
ecti
on
Fla
sh f
ire
4
B
uta
ne
2517
18
No
v 1
941
Ho
bar
t, O
kla
ho
ma,
US
A
Lea
k f
rom
pip
e u
nd
er t
ruck
by
exce
ssiv
e v
ibra
tio
n
Fir
e &
ex
plo
sio
n
0 4
1 h
ou
se &
3 c
ars
des
tro
yed
B
uta
ne
1821
18
Jan
194
3 L
os
An
gel
es, C
alif
orn
ia,
US
A
Fai
lure
of
bo
tto
m c
on
nec
tio
n
Ign
itio
n o
f 40
0m d
iam
eter
clo
ud
5
B
uta
ne
843
31 M
ar 1
944
Ok
lah
om
a C
ity
, US
A
Lea
k f
rom
1 o
f 4
tan
ks
BL
EV
E
5 21
Bu
tan
e
1872
21
No
v 1
944
Den
iso
n, T
exas
, US
A
Ex
cess
flo
w v
alv
e d
amag
ed
foll
ow
ing
co
llis
ion
Ign
itio
n b
y w
ater
hea
ter
60m
aw
ay
10
Ev
ery
on
e
wit
hin
90m
B
uta
ne
2569
23
Ju
n 1
946
Lo
uis
ian
a, U
SA
M
aste
r v
alv
e b
etw
een
tan
k a
nd
pu
mp
lef
t o
pen
Jet
fire
23m
hig
h
0 0
L
PG
2570
12
Feb
194
7 H
op
e, A
rkan
sas,
US
A
Co
llis
ion
, ro
llo
ver
an
d d
amag
e
to p
ipew
ork
Fir
e 1
0
Bu
tan
e
2571
13
Oct
194
8 S
acra
men
to, C
alif
orn
ia,
US
A
Tan
ker
was
str
uck
by
a t
rain
F
ire
2 0
Tra
in c
arri
age
bu
rned
B
uta
ne
2572
13
mar
194
9 M
arti
nez
, Cal
ifo
rnia
,
US
A
Tan
ker
ov
ertu
rned
on
ro
ad,
bre
akin
g c
on
nec
tio
n
Fla
sh f
ire
0 0
B
uta
ne
1827
23
Au
g 1
950
Wra
y, C
olo
rad
o, U
SA
B
rak
e fa
ilu
re l
ead
ing
to
ro
llo
ver
and
dam
age
to c
on
nec
tio
n.
Ex
cess
flo
w v
alv
e fa
iled
Vap
ou
r ig
nit
ed a
t n
earb
y
gar
age.
Fir
e
2 3
P
rop
ane
2573
14
Ju
n 1
951
San
Fer
nan
do
,
Cal
ifo
rnia
, US
A
Tan
k r
up
ture
d f
oll
ow
ing
acci
den
t
Jet
fire
1
0
Iso
bu
tan
e
1875
24
Ju
n 1
952
Kan
sas
Cit
y, U
SA
V
apo
ur
leak
th
rou
gh
PR
V
Ex
plo
sio
n
2
L
PG
2120
14
No
v 1
958
Lo
s A
ng
eles
, US
A
Tan
ker
ov
ertu
rned
an
d
dam
aged
in
stru
men
t ta
pin
g
Vap
ou
r cl
ou
d, n
o i
gn
itio
n
0 0
L
PG
2635
22
Dec
195
8 B
row
nfi
eld
, Tex
as, U
SA
T
ank
er r
oll
ed o
ver
fo
llo
wi9
ng
coll
isio
n. P
RV
s to
rn o
ff
Fir
e an
d B
LE
VE
4
160
B
uta
ne
2176
2
Jun
195
9 D
eer
lak
e, P
enn
sylv
ania
,
US
A
Co
llis
ion
F
ire
and
BL
EV
E a
fter
45
min
11
10
Fo
liag
e b
urn
t u
p t
o 1
50m
away
LP
G
2633
15
Dec
196
0 G
len
Lo
ch,
Pen
nsy
lvan
ia, U
SA
Rel
ief
val
ve
shea
red
off
un
der
low
bri
dg
e
Ign
itio
n b
y p
assi
ng
tra
in
0 0
L
PG
ER
M-H
ON
G K
ON
G L
TD
W
EE
K 3
0 -
JU
LY
20
10
A7
B-1
6
MH
IDA
S
Ref
Date
L
oca
tio
n
Acc
ide
nt
Cau
se
Co
nse
qu
en
ce
Fa
tali
ties
Inju
ries
Oth
er
Dam
ag
e
Mate
rial
2130
27
Ap
r 19
61
Sid
ney
, Neb
rask
a, U
SA
T
ank
er o
ver
turn
ed, b
reak
ing
off
val
ve
Ign
itio
n
0 1
L
PG
825
25 J
ul
1962
B
erli
n, N
ew Y
ork
, US
A
Tan
ker
co
llid
ed w
ith
tre
e F
ire
10
17
Ex
plo
sio
n i
n n
earb
y h
ou
ses
LP
G
2124
31
Ju
l 19
63
Mem
ph
is, T
enn
esse
e,
US
A
Ho
se b
rok
e d
uri
ng
tra
nsi
t Ig
nit
ion
by
un
kn
ow
n
sou
rce
1 1
L
PG
2749
26
Feb
196
5 A
ylm
er, O
nta
rio
, Can
ada
Co
llis
ion
cau
sed
cra
ck b
etw
een
EF
V a
nd
bal
l v
alv
e
Ign
itio
n b
y s
tart
er m
oto
r 0
2 7
bu
ild
ing
s, 2
car
s an
d 2
tru
cks
des
tro
yed
LP
G
2223
15
Sep
197
0 H
op
kin
ton
,
Mas
sach
use
tts,
US
A
Tan
ker
ran
off
hig
hw
ay
Fir
e an
d B
LE
VE
aft
er
15m
in
1 0
L
PG
HS
C (
1991
) 23
Oct
197
0 H
ull
, UK
T
ruck
car
ryin
g s
tati
c ta
nk
str
uck
low
bri
dg
e. S
hea
red
off
PR
V
Fla
sh f
ire
(0.1
of
2te
carg
o)
2 0
P
rop
ane
590
9 m
ar 1
972
Ly
nch
bu
rg, V
irg
inia
,
US
A
Tan
ker
ov
ertu
rned
an
d s
tru
ck
emb
ank
men
t ca
usi
ng
800
mm
tear
Fir
e 2
31
P
rop
ane
592
21 S
ep 1
972
New
Jer
sey
Tu
rnp
ike,
US
A
Co
llis
ion
cau
sed
lea
k f
rom
pip
ewo
rk
Fir
e an
d B
LE
VE
aft
er 2
5
min
2 28
Pro
py
len
e
1142
1
Feb
197
3 S
t A
man
d-L
es-E
aux
Fra
nce
Tan
ker
ov
ertu
rned
an
d
rup
ture
d
Jet
fire
an
d B
LE
VE
aft
er 1
5
min
6 37
Pro
pan
e
1495
24
May
197
3 L
yn
chb
urg
, Vir
gin
ia,
US
A
Tan
ker
ov
ertu
rned
an
d
rup
ture
d
Ign
itio
n a
fter
2 m
in,
fire
bal
l
7
L
PG
118
Jan
197
4 F
lori
da,
US
A
Ho
se f
ailu
re
Ex
plo
sio
n
0 0
2 w
areh
ou
ses
des
tro
yed
.
Car
s cr
ush
ed w
ith
4 b
lock
area
Pro
pan
e
945
11 J
an 1
974
Ab
erd
een
, UK
P
RV
sh
eare
d o
ff i
n a
ccid
ent
Imm
edia
te i
gn
itio
n &
fire
bal
l
3
B
uta
ne
1797
6
Feb
197
4 A
lban
y, G
eorg
ia, U
SA
T
ank
er c
oll
isio
n w
ith
tra
in
Lar
ge
fire
1
2
LP
G
450
29 A
pr
1975
E
agle
Pas
s, T
exas
, US
A
Sem
i-tr
aile
r o
ver
turn
ed o
n
hig
hw
ay
Fir
e 16
35
50
car
s d
estr
oy
ed i
n u
sed
car
faci
lity
LP
G
180
24 J
un
197
6 Z
arag
oza
, Sp
ain
G
as s
eep
fro
m t
ank
er
Ign
itio
n a
nd
ex
plo
sio
n
>7
40
A w
areh
ou
se a
nd
2
wo
rksh
op
s d
estr
oy
ed
Bu
tan
e
2109
19
Au
g 1
976
Fli
nt,
Mic
hig
an, U
SA
T
ank
er r
an o
ff r
oad
an
d
rup
ture
d
Fir
e &
ex
plo
sio
n
1 7
L
PG

ER
M-H
ON
G K
ON
G L
TD
W
EE
K 3
0 -
JU
LY
20
10
A7
B-1
7
MH
IDA
S
Ref
Date
L
oca
tio
n
Acc
ide
nt
Cau
se
Co
nse
qu
en
ce
Fa
tali
ties
Inju
ries
Oth
er
Dam
ag
e
Mate
rial
1986
28
Dec
197
7 G
old
on
na,
Lo
uis
ian
a,
US
A
Co
llis
ion
wit
h t
rain
cau
sed
tan
k
rup
ture
Fir
ebal
l 2
10
L
PG
1999
11
Ju
l 19
78
San
Car
los,
Sp
ain
T
ank
er r
up
ture
du
e to
ov
erfi
llin
g &
no
PR
V
Fla
sh f
ire
217
67
Bu
ild
ing
s d
estr
oy
ed
Pro
py
len
e
2040
16
Ju
l 19
78
Tu
la, M
exic
o C
ity
,
Mex
ico
Tan
ker
ov
ertu
rned
an
d
rup
ture
d
Ex
plo
sio
n &
fir
e 10
-15
>15
0
Bu
tan
e
830
27 J
ul
1979
H
ayfi
eld
, Der
by
shir
e,
UK
Lea
k f
rom
ov
ertu
rned
tan
ker
N
o i
gn
itio
n
0 0
Vil
lag
e ev
acu
ated
L
PG
2303
10
Ap
r 19
80
Po
nt
A M
ou
sso
n, F
ran
ce
Rel
ease
aft
er t
ank
er c
rash
ed
do
wn
em
ban
km
ent
No
ig
nit
ion
0
1 N
eig
hb
ou
rho
od
ev
acu
ated
L
PG
1728
2
May
198
0 P
atri
ng
ton
, Hu
mb
ersi
de,
UK
Tan
ker
ov
ertu
rned
F
ire
1 0
C
on
den
sate
1981
7
Au
g 1
980
New
Yo
rk C
ity
, US
A
Fai
lure
of
PR
V
No
ig
nit
ion
0
0 50
km
tra
ffic
jam
P
rop
ane
3264
20
Ap
r 19
84
Wes
tvil
le, I
nd
ian
a, U
SA
T
ank
er s
tru
ck b
y t
rain
F
ireb
all
>2
6 12
rai
lcar
s d
erai
led
L
PG
1025
13
Ju
n 1
984
Sal
mo
n A
rm, B
riti
sh
Co
lum
bia
, Can
ada
Tan
ker
fel
l d
ow
n e
mb
ank
men
t
afte
r co
llis
ion
Ex
plo
sio
n
1 23
Pro
pan
e
3618
6
Sep
198
5 P
rin
ce G
eorg
e’s
Co
un
ty,
Mar
yla
nd
, US
A
Tan
ker
ov
ertu
rned
& b
urs
t in
to
flam
es
Fir
e
40
0 ev
acu
ated
& r
oad
clo
sed
for
17 h
ou
rs
Pro
pan
e
1906
1
May
198
6 S
ever
na
Par
k, M
ary
lan
d,
US
A
Tan
ker
ov
ertu
rned
on
to 2
pet
rol
pu
mp
s. L
eak
fro
m t
ank
er’s
pro
pan
e fu
el t
ank
, no
t ca
rgo
Fir
e o
f p
etro
l &
pro
pan
e.
Fla
mes
8m
hig
h
1 2
Fu
mes
ov
erca
me
per
son
800m
aw
ay
Pro
pan
e
2057
1
Jul
1986
V
alle
y F
alls
, Kan
sas,
US
A
Co
llis
ion
wit
h t
rain
E
xp
losi
on
3
2 13
tra
in c
ars
der
aile
d
Pro
pan
e
2593
16
Feb
198
7 W
inst
on
-Sal
em, N
ort
h
Car
oli
na,
US
A
Tan
ker
cra
sh
Fir
e 0
0 50
res
iden
ts e
vac
uat
ed
LP
G
2751
6
Ap
r 19
87
Tre
nto
n, n
ew J
erse
y,
US
A
Tan
ker
ov
ertu
rned
on
hig
hw
ay
Ex
plo
sio
n
0 7
L
PG
3093
24
May
198
8 S
eafo
rd, L
on
g I
slan
d,
US
A
Tan
ker
ov
ertu
rned
aft
er r
ear
axle
fai
led
Fir
e b
urn
ed f
or
2 d
ays
0
2000
peo
ple
ev
acu
ated
L
PG
3430
23
Dec
198
8 M
emp
his
, Ten
nes
see,
US
A
Tan
ker
acc
iden
t &
ru
ptu
re
Fir
ebal
l 9
4 F
ire
eng
ulf
ed s
ever
al o
ther
veh
icle
s
Pro
pan
e
3695
4
Ap
r 19
89
Mu
swel
lbro
ok
, NS
W,
Au
stra
lia
Tan
ker
lea
k f
rom
wel
d
No
ig
nit
ion
0
0
LP
G
ER
M-H
ON
G K
ON
G L
TD
W
EE
K 3
0 -
JU
LY
20
10
A7
B-1
8
MH
IDA
S
Ref
Date
L
oca
tio
n
Acc
ide
nt
Cau
se
Co
nse
qu
en
ce
Fa
tali
ties
Inju
ries
Oth
er
Dam
ag
e
Mate
rial
3884
25
Sep
198
9 A
qu
idn
eck
Isl
and
,
Mar
yla
nd
, US
A
Tan
ker
str
uck
lo
w b
rid
ge
and
leak
ed
No
ig
nit
ion
0
0 H
ou
ses
wit
hin
400
m
evac
uat
ed
Pro
pan
e
4287
17
Oct
198
9 K
ang
ero
o V
alle
y,
Qu
een
slan
d, A
ust
rali
a
Tan
ker
ov
ertu
rned
on
sh
arp
ben
d
No
ig
nit
ion
0
0 R
oad
clo
sed
C
on
den
sate
4141
5
Jan
199
0 M
elb
ou
rne,
Vic
tori
a,
Au
stra
lia
Lea
k f
rom
tan
ker
N
o i
gn
itio
n
0 0
P
rop
ane
4156
30
Jan
199
0 C
and
asn
os,
Hu
esca
,
Sp
ain
Tan
ker
co
llid
ed w
ith
bri
dg
e N
o r
elea
se
0 6
P
rop
ane
4127
24
Sep
199
0 B
ang
ko
k, T
hai
lan
d
Tru
ck c
arry
ing
2 L
PG
tan
ks
ov
ertu
rned
Fir
e 63
10
0 57
car
s &
48
sho
ps
LP
G
4711
9
Mar
199
1 L
e R
oy
, new
Yo
rk, U
SA
T
ank
er o
ver
turn
ed. N
o l
eak
0 0
Ro
ad c
lose
d f
or
10 h
ou
rs
Pro
pan
e
5411
29
Feb
199
2 G
reen
wic
h, N
ew J
erse
y,
US
A
Tan
ker
str
uck
tra
in &
ov
ertu
rned
No
sp
ill
0 0
60 h
om
es e
vac
uat
ed
Pro
pan
e
5465
3
Ap
r 19
92
War
ren
, Ver
mo
nt,
US
A
Tan
ker
fel
l d
ow
n s
teep
emb
ank
men
t
No
ig
nit
ion
0
0 R
esid
ents
ev
acu
ated
B
uta
ne
5651
23
Ju
l 19
92
Mu
thil
l, S
cotl
and
, UK
E
mp
ty t
ank
er c
oll
ided
wit
h l
ow
arch
way
. Sh
eare
d o
ff P
RV
No
ig
nit
ion
0
0
LP
G
5931
27
Oct
199
2 S
arn
ia, O
nta
rio
, Can
ada
Lea
k f
rom
pac
kin
g g
lan
d n
ut
of
emp
ty t
ank
er
No
ig
nit
ion
0
0
LP
G
5969
1
Dec
199
2 A
nk
ara,
Tu
rkey
R
oad
tra
ffic
acc
iden
t L
arg
e fi
re a
nd
ex
plo
sio
n
22
LP
G
6003
29
Dec
199
2 P
ort
Co
qu
itca
m, B
riti
sh
Co
lum
bia
, Can
ada
Lea
k f
rom
val
ve
No
ig
nit
ion
0
0
LP
G
6095
11
Mar
199
3 S
hak
esp
eare
, On
tari
o,
Can
ada
Co
llis
ion
wit
h t
rain
N
o s
pil
l 0
0
LP
G
1076
26
Feb
199
3 F
aken
ham
, No
rfo
lk, U
K
Em
pty
tan
ker
co
llis
ion
N
o s
pil
l 0
0
Pro
pan
e
1231
8 14
Ju
l 20
03
Vel
dh
ov
en, N
eth
erla
nd
s C
ab o
f ro
adta
nk
er c
aug
ht
fire
foll
ow
ing
acc
iden
t.
No
sp
ill
0 0
Off
ices
wit
hin
500
m
evac
uat
ed a
s p
reca
uti
on
LP
G
1251
3 13
No
v 2
003
Bre
db
ury
, Ch
esh
ire,
UK
L
PG
car
go
was
fo
un
d t
o b
e
leak
ing
aft
er r
oad
tan
ker
bro
ke
do
wn
on
hig
hw
ay.
0
0 R
oad
in
bo
th d
irec
tio
ns
clo
sed
wh
ile
leak
rep
aire
d
LP
G
1268
5 4
Feb
200
4 P
un
e, I
nd
ia
Tan
ker
ex
plo
ded
fo
llo
win
g
acci
den
t an
d r
oll
ov
er
Ex
plo
sio
n
3 15
LP
G
ER
M-H
ON
G K
ON
G L
TD
W
EE
K 3
0 -
JU
LY
20
10
A7
B-1
9
Ta
ble
3.2
R
oa
d T
an
ker
In
cid
ents
fro
m t
he
Ich
emE
Da
tab
ase
Ich
em
E
Ref
Date
L
oca
tio
n
Acc
ide
nt
Cau
se
Co
nse
qu
en
ce
Fa
tali
ties
Inju
ries
Oth
er
Dam
ag
e
Mate
rial
9668
u
nk
no
wn
u
nk
no
wn
H
ose
lea
k o
n m
od
ifie
d t
ank
er.
Lea
k w
as t
oo
sm
all
to a
ctiv
ate
exce
ss f
low
val
ve
Fir
e 1
0
Pro
pan
e
9666
u
nk
no
wn
u
nk
no
wn
T
ank
ru
ptu
re d
uri
ng
tra
nsi
t.
Lik
ely
wel
d d
efec
ts.
Ex
plo
sio
n
10
17
P
rop
ane
50
11 J
un
e 19
41
US
A
8.7m
3 ta
nk
er i
nv
olv
ed i
n
coll
isio
n.
Bu
tan
e v
apo
urs
co
ver
ed
larg
e ar
ea. N
o i
gn
itio
n
0 0
B
uta
ne
185
12 M
ar 1
959
un
kn
ow
n
Op
erat
or
erro
r B
LE
VE
0
0
Bu
tan
e
1698
27
Ju
ly 1
978
Har
ton
, Yo
rks,
UK
1t
e cy
lin
der
bro
ke
lose
aft
er
tan
k s
tuck
on
ver
ge.
Val
ve
frac
ture
d a
nd
lea
ked
No
ig
nit
ion
0
0
Pro
pan
e
1735
7
Sep
197
8 H
artb
urn
Ban
k,
Sto
ckto
n, U
K
Tan
ker
ov
ertu
rned
bu
t n
o
rele
ase
No
ne
0 0
Res
iden
ts e
vac
uat
ed
Bu
tan
e
1939
28
Dec
197
9 B
rito
n f
erry
, Wal
es, U
K
Val
ve
on
tan
ker
fro
ze o
pen
V
apo
ur
clo
ud
. No
ig
nit
ion
0
0 T
raff
ic s
top
ped
as
pre
cau
tio
n
Bu
tan
e
2351
2
Jan
198
2 It
aly
H
igh
way
co
llis
ion
in
fo
gg
y
con
dit
ion
s l
ead
ing
to
tan
ker
exp
losi
on
Ex
plo
sio
n
5 30
Pro
pan
e
3272
1
Ap
r 19
85
Dij
on
, Fra
nce
T
ank
er c
rash
ed a
nd
cau
gh
t fi
re
Fir
e 0
0
Pro
pan
e
4367
30
No
v 1
988
Elk
rid
ge,
US
A
Tan
ker
ov
ertu
rned
0 0
Res
iden
ts e
vac
uat
ed a
s
pre
cau
tio
n
Pro
pan
e
4721
21
Sep
198
9 B
alti
mo
re, U
SA
L
eak
fro
m t
ank
er w
edg
ed u
nd
er
bri
dg
e
Vap
ou
r re
leas
e. N
o
ign
itio
n
0 0
Res
iden
ts e
vac
uat
ed
Pro
pan
e
5300
8
Ap
r 19
91
To
ron
to, C
anad
a 2
PR
Vs
shea
red
off
wh
en
pas
sin
g t
hro
ug
h u
nd
erp
ass
Vap
ou
r re
leas
e 0
0 20
00 p
eop
le e
vac
uat
ed
Pro
pan
e
6646
27
Ju
l 19
94
Wh
ite
Pla
ins,
New
Yo
rk,
US
A
Co
llis
ion
wit
h b
rid
ge
sup
po
rt.
Lea
k i
gn
ited
.
Ex
plo
sio
n
1 23
10
ho
use
s d
estr
oy
ed
Pro
pan
e
1224
307
Mar
200
0 B
asin
gst
ok
e, U
K
Tan
ker
hit
by
an
oth
er v
ehic
le
afte
r b
reak
ing
do
wn
20 o
ut
of
30 g
as c
anis
ters
exp
lod
ed
1 1
P
rop
ane
ER
M-H
ON
G K
ON
G L
TD
W
EE
K 3
0 -
JU
LY
20
10
A7
B-2
0
Ich
em
E
Ref
Date
L
oca
tio
n
Acc
ide
nt
Cau
se
Co
nse
qu
en
ce
Fa
tali
ties
Inju
ries
Oth
er
Dam
ag
e
Mate
rial
1247
317
Ap
r 20
00
Fay
ette
Co
un
ty, U
SA
C
oll
isio
n c
ausi
ng
ro
llo
ver
V
apo
ur
rele
ase
0 0
Res
iden
ts e
vac
uat
ed a
s
pre
cau
tio
n
Pro
pan
e

ER
M-H
ON
G K
ON
G L
TD
W
EE
K 3
0 -
JU
LY
20
10
A7
B-2
1
Ta
ble
3.3
A
ccid
ents
wit
h L
PG
Cy
lin
der
Wa
go
ns
So
urc
e
Date
L
oca
tio
n
Desc
rip
tio
n
Co
nse
qu
en
ce
Fata
liti
es
Inju
ries
Oth
er
Dam
ag
e
Mate
rial
MH
IDA
S
7 D
ec 1
960
Nas
hu
a, N
ew H
amp
shir
e, U
SA
T
ruck
co
llid
ed w
ith
tra
in l
ead
ing
to
cy
lin
der
rup
ture
s
Fir
e 6
30
L
PG
MH
IDA
S
7 M
ay 1
985
Po
nty
pri
dd
, Wes
t G
lam
org
an,
UK
Tru
ck c
arry
ing
102
cy
lin
der
s ex
plo
ded
. Th
e
ensu
ing
fir
e ca
use
d 1
2 cy
lin
der
s to
ru
ptu
re.
Fir
e, B
LE
VE
0
0 D
amag
e to
su
per
mar
ket
L
PG
Fir
e
Pre
ven
tio
n O
ct
1988
15 F
eb 1
987
Old
bu
ry, U
K
A p
ort
able
bo
iler
ov
ertu
rned
an
d h
eate
d 3
LP
G c
yli
nd
ers.
2 r
up
ture
d f
rom
th
e h
eat.
BL
EV
E
3 4
L
PG
HC
B
2 N
ov
198
7 P
ine
Gro
ve,
Pen
nsy
lvan
ia, U
SA
F
ire
in t
ruck
cau
sed
pro
pan
e cy
lin
der
to
rup
ture
BL
EV
E
0 0
P
rop
ane
MH
IDA
S
22 D
ec 1
987
Ex
eter
, UK
C
oll
isio
n c
ause
d t
ruck
to
ov
ertu
rn. S
ever
al
cyli
nd
ers
frac
ture
d
Vap
ou
r re
leas
e 0
0
LP
G
MH
IDA
S
21 M
ar 1
989
Mar
yb
oro
ug
h, Q
uee
nsl
and
,
Au
stra
lia
Tra
iler
car
ryin
g 1
90 c
yli
nd
ers
inv
olv
ed i
n
acci
den
t.
No
ig
nit
ion
6
(co
llis
ion
)
L
PG
MH
IDA
S
20 S
ep 1
990
Bla
ckw
ater
, Qu
een
slan
d,
Au
stra
lia
Co
llis
ion
wit
h t
rain
cau
sed
cy
lin
der
to
rup
ture
& e
xp
lod
e.
Fir
ebal
l 0
1
LP
G
MH
IDA
S
14 J
un
199
1 P
atch
am, U
K
5 cy
lin
der
s fe
ll f
rom
a t
ruck
. 1 c
yli
nd
er
leak
ed b
ut
no
ig
nit
ion
Vap
ou
r re
leas
e 0
0
LP
G
MH
IDA
S
30 S
ep 1
992
Tsi
ng
Hh
ang
Pat
h, T
uen
Mu
n,
Ho
ng
Ko
ng
Van
dal
ism
– s
etti
ng
fir
e to
LP
G t
ruck
wh
ile
par
ked
ov
ern
igh
t
Mu
ltip
le B
LE
VE
0
5 (d
uri
ng
evac
uat
ion
)
14 c
ars,
5 t
ruck
s, 3
tax
is,
bu
ild
ing
s d
amag
ed
LP
G

ERM-HONG KONG LTD WEEK 30 - JULY 2010
A7B-22
3.1.2 LPG Storage Accidents
New South Wales, Australia, 19 Sep 2001 – LPG bottles led to a series of
explosions in an industrial estate. Firecrews responded and no injuries were
reported.
Zambia, 1996 – Human error during special operations led to leak and
explosion from an LPG storage tank. 5 fatalities and 3 injuries resulted.
Guangdong, China, 5 Aug 1993 – A fire and explosion at a warehouse spread
to a storage tank at a nearby LPG storage depot. 15 fatalities and 160 injuries
reported.
South Korea, 7 Jan 1993 – A fire detonated LPG storage tanks in basement of 4
storey apartment block and levelled the building. No injuries or fatalities.
Kuwait, 7 Dec 1987 – Act of sabotage led to a fire in an LPG storage depot.
Fire fighting was effective and safety devices functioned, preventing
escalation to the storage tanks. No injuries reported.
Mexico City, 18 Nov 1984 – A leak of LPG formed a vapour cloud which was
ignited by a plant flare. A fierce fire developed engulfing the LPG spheres and
bullets, with 4 spheres and many bullets failing one after the other in a series
of BLEVEs. 50 (out of 54) vessels were destroyed. 540 people died, 7000
injured, 200,000 evacuated. A projectile hit and killed a person 1 km away.
Cleveland, UK, 1984 – A shrub fire spread to a chemical waste disposal site
and caused a BLEVE of an LPG storage tank. No injuries or fatalities.
Rhode Island, USA, 6 Jun 1983 – 30 tanks of propane exploded at an LPG
storage facility. 2 fire fighters injured.
Barking, Essex, UK, 21 Jan 1980 – Fire at a warehouse spread to LPG cylinder
and numerous chemicals. 9 injured.
Turkey, 1979 – An LPG storage tank exploded at an oil refinery, showering a
nearby town with flaming debris. 2 fatalities and 20 injuries reported.
Belgium, May 1979 – A release of LPG from a rail tanker resulted in an
explosion at a railway station. The tanker is believed to have burst when the
train arrived at the station. The dispersing vapour cloud reached 300m by
400m and was ignited by sparks from the overhead power lines when the
train started to pull out of the station. The resulting explosion caused the
tanker to rise 10m into the air and blew the manhole cover 100m. No injuries
or fatalities were reported.
USA, 15 Sep 1977 – An LPG storage vessel was overfilled due to a faulty level
gauge. The relief valve failed to open and the vessel ruptured. The resulting
vapours ignited leading to fires and explosions involving 2 other vertical tanks
and 4 horizontal bullet tanks. 2 fatalities reported.
ERM-HONG KONG LTD WEEK 30 - JULY 2010
A7B-23
Florida, USA, 6 Feb 1977 – A train derailed and crashed into a LPG cylinder
store. The fire destroyed 9 cylinders. No injuries or fatalities.
Brazil, 30 March 1972 – An LPG tank constructed in 1961 was being filled
with relatively high temperature LPG. The tank was fitted with only a single
pressure relief valve and a single drain valve. Due to the temperature, the
pressure within the tank rose rapidly above the safe working pressure but the
relief valve failed to work. It was speculated that operators noticed the high
pressure and opened the drain valve. LPG was released and the drain valve
froze, preventing it from being closed. The gas spread and ignited, killing 37
people and inuring a further 37.
1972 – A high wall surrounding an LPG cylinder storage depot collapsed,
crushing some 12 kg cylinders. A large quantity of gas escaped and ignited
causing a fire. Three explosions occurred within the building and some
cylinders exploded, scattering fragments over a distance of 100m. No injuries
reported.
22 Oct 1971 – A butane sphere was overfilled due to a faulty level gauge. The
pressure relief lifted and released liquid butane with formed a vapour cloud.
Fortunately, the valve reseated and the vapour cloud was not ignited. No
injuries were reported.
France, 4 Jan 1966 – An operator failed to follow procedures during the
draining of water from an LPG sphere. The resulting vapour cloud spread
until it reached a road and was ignited by a passing car. The fire spread back
to the liquid pool that had formed within the bund, resulting in a BLEVE of
the sphere. The incident escalated to cause a BLEVE of a neighbouring tank
and rupture 3 other spheres. 21 fatalities and 52 injuries were reported.
California, USA, 1961 – During the draining of water from a horizontal LPG
tank, a connection failed and released LPG through a 1” hole. The cloud was
ignited within a minute resulting in a fire that caused the failure of all six
storage tanks on site within 35 minutes, some failing violently. 2 injuries.
Kentucky, USA, Oct 1961 – A substandard installation of a 1,000 gallon LPG
storage tank fell from its concrete block foundation. This damaged the outlet
connection and produced a vapour cloud that spread over a large area. After
15 minutes, the cloud was ignited resulting in an explosion. No injuries or
fatalities reported.
California, USA, 13 July 1954 – The driver of an LPG delivery tanker had
filled his tanks from a storage tank and drove away without disconnecting the
transfer and vent lines. LPG flooded the area and was ignited 10 minutes later.
The flash fire caused secondary fires including one on top of the storage tank
where the vapour connection had cracked. The storage tank eventually
ruptured from the heat of the fire. 4 fatalities resulted from the flash fire.
USA, 27 Jan 1952 – A buried tank leaked into the surrounding earth through a
threaded connection. The resulting fires and explosion damaged 216
buildings. Fortunately, occupancy was low and only 1 injury was reported.

ERM-HONG KONG LTD WEEK 30 - JULY 2010
A7B-24
Georgia, USA, 7 Oct 1950 – A transfer line between an LPG tanker and 1000
gall storage tank broke at the tank. The vapours were ignited. No injuries or
fatalities.
USA, 25 April 1945 – Escaping vapours from a 100 tonne LPG storage tank
ignited. The explosion shattered buildings and caused 5 fatalities.
3.2 HAZARD IDENTIFICATION
Based on the above review, the main hazard associated with an LPG facility is
an uncontrolled release of LPG resulting in a fire or explosion upon ignition.
There is also the potential for escalation of a fire event to cause a Boiling
Liquid Expanding Vapour Explosion (BLEVE) of the LPG road tanker or the
cylinders and this may produce fragments that can travel hundreds of metres.
Connection/ disconnection errors and tanker drive away during unloading
can also lead to leaks.
The initiating events leading to an LPG release could occur due to one of the
following:
• Spontaneous failure of pressurised LPG equipment, i.e.:
− Storage vessel failure;
− Road tanker failure;
− Pipework failure;
− Hose failure;
− Flange failure;
− Valve leak; and
− LPG cylinder failure.
• Loading failures, i.e. an LPG release that occurs as a direct result of the
road tanker unloading operation.
− Hose Failure;
− connection/disconnection error (during tanker unloading);
− Tanker drive away error;
− Tanker impact;
− Loading pipework overpressurisation; and
− Storage tank overfilling/overpressurisation.
• External events, such as:
− Earthquake;
− Aircraft crash;
− High wind loading;
ERM-HONG KONG LTD WEEK 30 - JULY 2010
A7B-25
− External fire; and
− Subsidence.
The following events could result from a release of LPG:
• Jet fire;
• Flash fire;
• Vapour Cloud Explosion (VCE);
• Fireball; and
• BLEVE
The likelihood or frequency of these events is discussed in Section 4.
Based on the considerations above, representative LPG release events
considered in the assessment are as summarised in Table 3.4.
Rupture of vessels may result in fireballs, flash fires or vapour cloud
explosions (VCE). Leaks may cause jet fires, flash fires or VCE, or may escalate
leading to catastrophic failure of a vessel in a Boiling Liquid Expanding
Vapour Explosion (BLEVE). BLEVE of the LPG Compound storage vessel is
not considered possible since these are mounded tanks. BLEVE of road
tankers and LPG cylinders is considered in the analysis however.
Leaks from all equipment are piping are taken to be 1” or 2”, depending on
the size of connections. Leaks from LPG cylinders are taken to be 1mm since
anything larger would effectively lead to emptying of a cylinder in a matter of
seconds and would essentially be the same as a rupture scenario.
VCE from LPG cylinders is not considered possible because of the very
limited inventory in a cylinder. CCPS (1999) suggests that the minimum
flammable mass required to allow transition from flash fire to VCE, based on
experimental studies, is 100 kg. The inventory of all cylinders is less than this.
Additional risks potentially arise from the transit of petrol/diesel tankers
through the site from the jetty. Petrol/diesel could be released from the
tankers to form a liquid pool on the ground and a pool fire if ignited. These
scenarios are included in the analysis.

ER
M-H
ON
G K
ON
G L
TD
W
EE
K 3
0 -
JUL
Y 2
010
A7B
-26
Ta
ble
3.4
R
elea
se E
ven
ts C
on
sid
ered
Eq
uip
.
ID
Eq
uip
men
t D
esc
rip
tio
n
Ev
en
t D
esc
rip
tio
n
Rele
ase
Ty
pe
Ho
le S
ize
Po
ten
tial
Hazard
ou
s E
ven
t O
utc
om
es*
1 S
tora
ge
ves
sel
Cat
astr
op
hic
fai
lure
In
stan
tan
eou
s R
up
ture
F
ireb
all,
VC
E, f
lash
fir
e
Par
tial
fai
lure
C
on
tin
uo
us
1” l
eak
Je
t fi
re, V
CE
, fla
sh f
ire
2 L
PG
ro
ad t
ank
er
Cat
astr
op
hic
fai
lure
In
stan
tan
eou
s R
up
ture
F
ireb
all,
VC
E, f
lash
fir
e
Par
tial
fai
lure
C
on
tin
uo
us
2” l
eak
Je
t fi
re, V
CE
, fla
sh f
ire,
BL
EV
E
Par
tial
fai
lure
C
on
tin
uo
us
1” l
eak
Je
t fi
re, V
CE
, fla
sh f
ire,
BL
EV
E
3 F
illi
ng
lin
e to
sto
rag
e v
esse
l G
uil
loti
ne
fail
ure
C
on
tin
uo
us
Pip
e fu
ll b
ore
Je
t fi
re, V
CE
, fla
sh f
ire
Par
tial
fai
lure
C
on
tin
uo
us
1” l
eak
Je
t fi
re, V
CE
, fla
sh f
ire
4 F
lex
ible
ho
se
Gu
illo
tin
e fa
ilu
re
Co
nti
nu
ou
s H
ose
fu
ll b
ore
Je
t fi
re, V
CE
, fla
sh f
ire
Par
tial
fai
lure
C
on
tin
uo
us
1” l
eak
Je
t fi
re, V
CE
, fla
sh f
ire
5 L
ine
fro
m s
tora
ge
ves
sel
to v
apo
rize
rs
Gu
illo
tin
e fa
ilu
re
Co
nti
nu
ou
s P
ipe
full
bo
re
Jet
fire
, VC
E, f
lash
fir
e
Par
tial
fai
lure
C
on
tin
uo
us
1” l
eak
Je
t fi
re, V
CE
, fla
sh f
ire
6 V
apo
rize
r G
uil
loti
ne
fail
ure
C
on
tin
uo
us
Pip
e fu
ll b
ore
Je
t fi
re, V
CE
, fla
sh f
ire
7 S
end
-ou
t p
ipin
g d
ow
nst
ream
of
vap
ori
zers
G
uil
loti
ne
fail
ure
C
on
tin
uo
us
Pip
e fu
ll b
ore
Je
t fi
re, V
CE
, fla
sh f
ire
Par
tial
fai
lure
C
on
tin
uo
us
1” l
eak
Je
t fi
re, V
CE
, fla
sh f
ire
8 L
PG
cy
lin
der
C
atas
tro
ph
ic f
ailu
re
Inst
anta
neo
us
Ru
ptu
re
Fir
ebal
l, f
lash
fir
e
Par
tial
fai
lure
C
on
tin
uo
us
1mm
lea
k
Jet
fire
, fla
sh f
ire,
BL
EV
E
9 P
etro
l/d
iese
l ro
ad t
ank
er
Cat
astr
op
hic
fai
lure
In
stan
tan
eou
s R
up
ture
P
oo
l fi
re
Par
tial
fai
lure
C
on
tin
uo
us
1” l
eak
P
oo
l fi
re

ERM-HONG KONG LTD WEEK 30 - JULY 2010
A7B-27
4 FREQUENCY ANALYSIS
4.1 BASE EVENT FREQUENCIES
The previous HATS study (ENSR, 2008) performed a detailed Fault Tree
Analysis (FTA) to assess the frequency of each failure listed in Table 3.4. This
included consideration of causes such as spontaneous failures, overfilling,
truck collisions, connection/disconnection errors etc. and took credit for safety
systems such as operator intervention, check valves, excess flow valves,
pressure relief valves etc. The frequencies reported for this FTA were checked
and found to be broadly consistent with those of previously approved studies
in Hong Kong (for example, Maunsell 2006, ERM 2003, 2008). For conciseness,
the FTA analysis has not been repeated here, since the frequencies have been
largely adopted unaltered. Minor changes were made to scale frequencies to
reflect updated information provided by the depot operators (Shell, 2009):
• Failure rates for LPG road tankers were increased to allow for 3 tanker
deliveries per day instead of 2;
• Failure rates for LPG cylinders on wagons have been increased to allow
for 3 wagon deliveries per day instead of 2. Also, the parking of 5 cylinder
wagons on site overnight has been taken into account in the frequency
calculations;
• Failure rates for 5 loaded bulk tankers (assumed to be three 20-tonne
petrol tankers and two 20-tonne diesel tankers) have been included, and
• The number of cylinders in the Transit Depot has increased from 2000 to
2200. These cylinders have been further divided as 25% at 49kg and 75% at
13.5kg to reflect the actual size distribution (Table 2.2);
Base event frequencies adopted in this study are summarised in Table 4.1 and
Table 4.2 for the LPG Compound and LPG Transit Depot respectively.
Table 4.1 Base Event Frequencies for the LPG Compound
Event Description Failure Rate (per year)
Cold catastrophic failure of storage vessel 6.72 × 10⁻⁷
Cold partial failure of storage vessel 1.17 × 10⁻⁵
Cold catastrophic failure of road tanker 1.48 × 10⁻⁷
Cold partial failure of road tanker 3.62 × 10⁻⁷
Rupture of filling line to storage vessel 5.14 × 10⁻⁷
Leak of filling line to storage vessel 7.69 × 10⁻⁷
Rupture of flexible hose 3.82 × 10⁻⁵
Leak of flexible hose 3.92 × 10⁻⁵
Rupture of line from storage vessel to vaporizers 4.00 × 10⁻⁶
Leak of line from storage vessel to vaporizers 1.30 × 10⁻⁵
Rupture of vaporizer 3.64 × 10⁻⁸
Rupture of send-out piping downstream of vaporizers 4.00 × 10⁻⁶
Leak of send-out piping downstream of vaporizers 1.30 × 10⁻⁵
Rupture of LPG cylinder in storage shed 2.20 × 10⁻³
ERM-HONG KONG LTD WEEK 30 - JULY 2010
A7B-28
Event Description Failure Rate (per year)
Leak of LPG cylinder in storage shed 5.72 × 10⁻³
Table 4.2 Base Event Frequencies for the Transit Depot
Event Description Failure Rate (per year)
Road Tanker / Cylinder Wagon Transport Events
Cold rupture of road tanker 5.69 × 10⁻⁷
Large liquid release from road tanker 3.94 × 10⁻⁶
Large vapour release from road tanker 4.60 × 10⁻⁷
Medium liquid release from road tanker 1.49 × 10⁻⁶
Rupture of LPG cylinder on wagon 6.13 × 10⁻⁶
Cold rupture of petrol tanker(1) 1.25 × 10⁻⁷
Liquid release due to leak from petrol tanker(1) 3.13 × 10⁻⁷
Cold rupture of diesel tanker(1) 8.33 × 10⁻⁸
Liquid release due to leak from diesel tanker(1) 2.08 × 10⁻⁷
Road Tanker/Cylinder Wagon Stationary Events
Cold rupture of road tanker 2.08 × 10⁻⁹
Large liquid release from road tanker 1.88 × 10⁻⁹
Large vapour release from road tanker 1.88 × 10⁻⁹
Medium liquid release from road tanker 1.88 × 10⁻⁹
Rupture of LPG cylinder on wagon 3.54 × 10⁻⁷
Rupture of LPG cylinder on wagon while parked overnight(2) 1.70 × 10⁻⁵
• (1) Frequency calculated based on failure rate of 5×10⁻⁶ per tanker-year for a 1” leak, 2×10⁻⁶
per tanker-year for rupture (Crossthwaite, Fitzpatrick, and Hurst, 1988) and presence time
of half an hour for each tanker.
• (2) Frequency calculated based on failure rate of 6.8×10⁻⁶ per vehicle-year, for 5 wagons
parked overnight for 12 hours per day.
It may be noted that, following the HATS methodology, scenarios involving
LPG cylinders are grouped with the LPG Compound (Table 4.1) to represent
effectively the static facilities. LPG tankers during unloading are also included
in Table 4.1. Events involving tankers and cylinder wagons during transit or
parking outside the storage shed are listed under the Transit Depot (Table 4.2).
Separate risk results are shown in Section 6 for the Compound and Transit
depot, in addition to results for the overall risks.
4.2 EVENT TREE ANALYSIS
Event tree analysis (ETA) is used to model the evolution of an event from the
initial release through to the final outcome such as jet fire, fireball, flash fire
etc. This may depend on factors such as whether immediate or delayed
ignition occurs, or whether there is sufficient congestion to cause a vapour
cloud explosion.
4.2.1 Storage Vessel Scenarios
The event tree for rupture of a storage vessel is shown in Figure 4.1. Immediate
ignition is assigned a probability of 0.3 for large releases following Cox, Lees
and Ang (Lees, 1996), see Table 4.3. Immediate ignition results in a fireball.
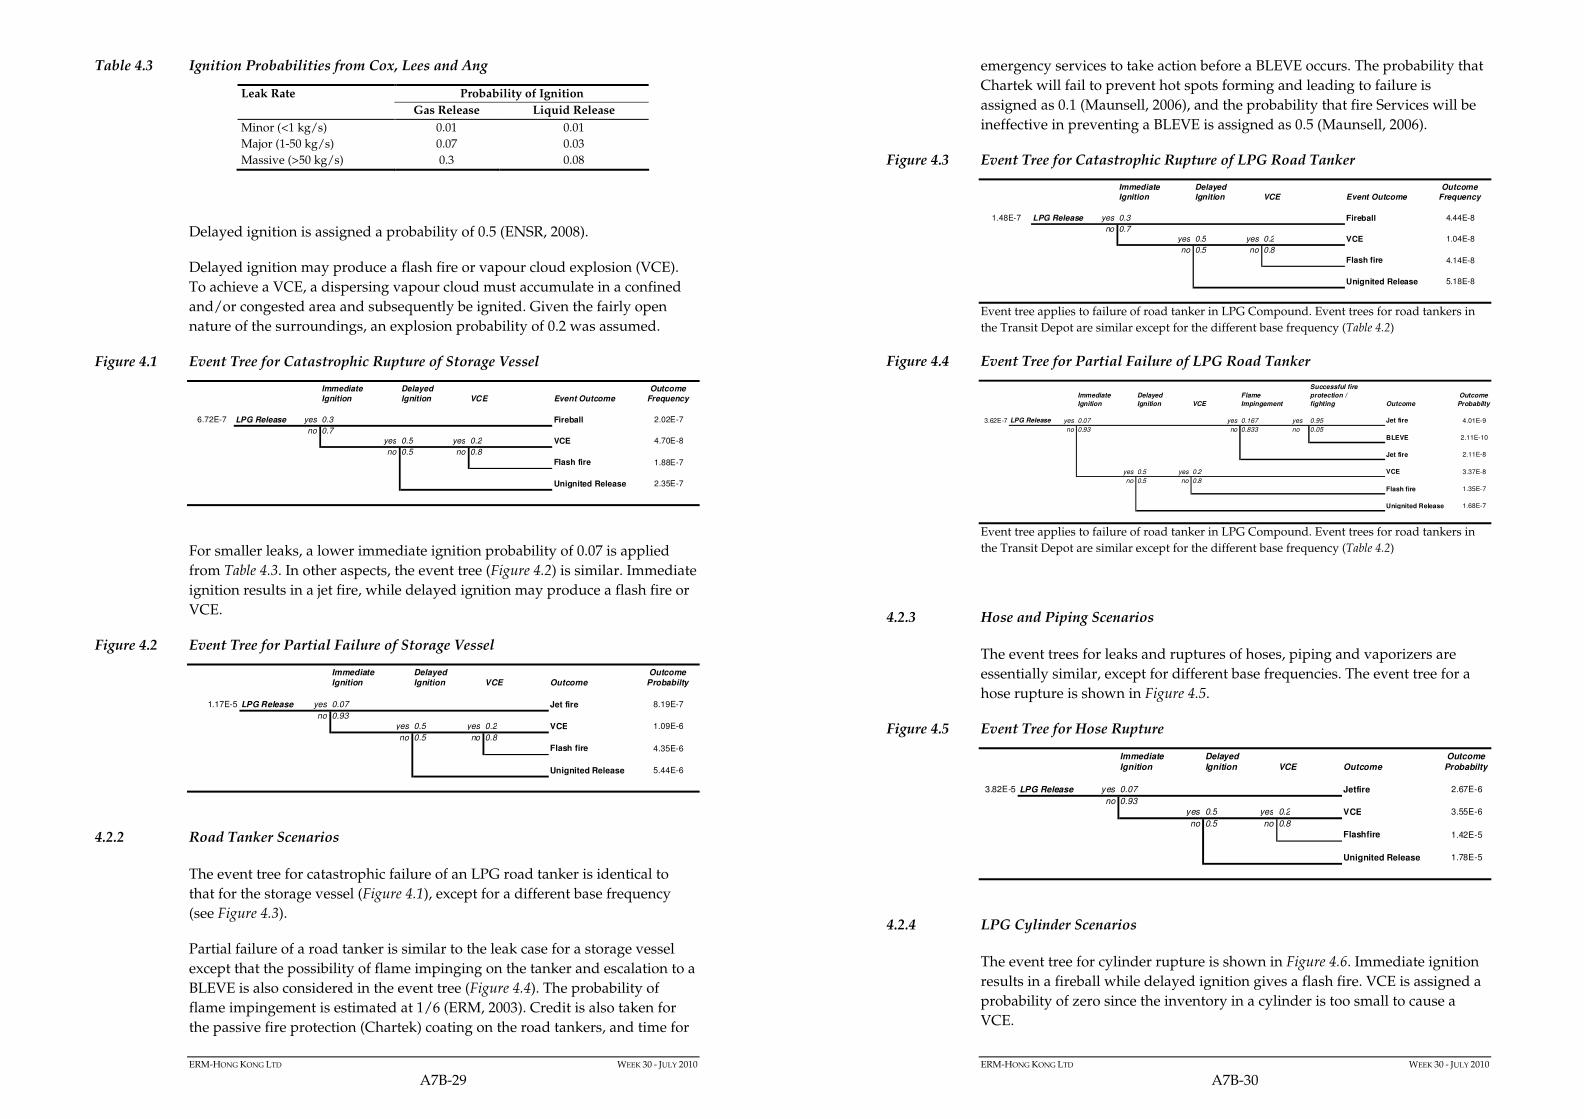
ERM-HONG KONG LTD WEEK 30 - JULY 2010
A7B-29
Table 4.3 Ignition Probabilities from Cox, Lees and Ang
Leak Rate Probability of Ignition
Gas Release Liquid Release
Minor (<1 kg/s) 0.01 0.01
Major (1-50 kg/s) 0.07 0.03
Massive (>50 kg/s) 0.3 0.08
Delayed ignition is assigned a probability of 0.5 (ENSR, 2008).
Delayed ignition may produce a flash fire or vapour cloud explosion (VCE).
To achieve a VCE, a dispersing vapour cloud must accumulate in a confined
and/or congested area and subsequently be ignited. Given the fairly open
nature of the surroundings, an explosion probability of 0.2 was assumed.
Figure 4.1 Event Tree for Catastrophic Rupture of Storage Vessel
For smaller leaks, a lower immediate ignition probability of 0.07 is applied
from Table 4.3. In other aspects, the event tree (Figure 4.2) is similar. Immediate
ignition results in a jet fire, while delayed ignition may produce a flash fire or
VCE.
Figure 4.2 Event Tree for Partial Failure of Storage Vessel
4.2.2 Road Tanker Scenarios
The event tree for catastrophic failure of an LPG road tanker is identical to
that for the storage vessel (Figure 4.1), except for a different base frequency
(see Figure 4.3).
Partial failure of a road tanker is similar to the leak case for a storage vessel
except that the possibility of flame impinging on the tanker and escalation to a
BLEVE is also considered in the event tree (Figure 4.4). The probability of
flame impingement is estimated at 1/6 (ERM, 2003). Credit is also taken for
the passive fire protection (Chartek) coating on the road tankers, and time for
Immediate Ignition
Delayed Ignition VCE Event Outcome
Outcome Frequency
6.72E-7 LPG Release yes 0.3 Fireball 2.02E-7
no 0.7
yes 0.5 yes 0.2 VCE 4.70E-8
no 0.5 no 0.8
Flash fire 1.88E-7
Unignited Release 2.35E-7
Immediate Ignition
Delayed Ignition VCE Outcome
Outcome Probabilty
1.17E-5 LPG Release yes 0.07 Jet fire 8.19E-7
no 0.93
yes 0.5 yes 0.2 VCE 1.09E-6
no 0.5 no 0.8
Flash fire 4.35E-6
Unignited Release 5.44E-6
ERM-HONG KONG LTD WEEK 30 - JULY 2010
A7B-30
emergency services to take action before a BLEVE occurs. The probability that
Chartek will fail to prevent hot spots forming and leading to failure is
assigned as 0.1 (Maunsell, 2006), and the probability that fire Services will be
ineffective in preventing a BLEVE is assigned as 0.5 (Maunsell, 2006).
Figure 4.3 Event Tree for Catastrophic Rupture of LPG Road Tanker
Event tree applies to failure of road tanker in LPG Compound. Event trees for road tankers in
the Transit Depot are similar except for the different base frequency (Table 4.2)
Figure 4.4 Event Tree for Partial Failure of LPG Road Tanker
Event tree applies to failure of road tanker in LPG Compound. Event trees for road tankers in
the Transit Depot are similar except for the different base frequency (Table 4.2)
4.2.3 Hose and Piping Scenarios
The event trees for leaks and ruptures of hoses, piping and vaporizers are
essentially similar, except for different base frequencies. The event tree for a
hose rupture is shown in Figure 4.5.
Figure 4.5 Event Tree for Hose Rupture
4.2.4 LPG Cylinder Scenarios
The event tree for cylinder rupture is shown in Figure 4.6. Immediate ignition
results in a fireball while delayed ignition gives a flash fire. VCE is assigned a
probability of zero since the inventory in a cylinder is too small to cause a
VCE.
Immediate Ignition
Delayed Ignition VCE Event Outcome
Outcome Frequency
1.48E-7 LPG Release yes 0.3 Fireball 4.44E-8
no 0.7
yes 0.5 yes 0.2 VCE 1.04E-8
no 0.5 no 0.8
Flash fire 4.14E-8
Unignited Release 5.18E-8
Immediate
Ignition
Delayed
Ignition VCE
Flame
Impingement
Successful fire
protection /
fighting Outcome
Outcome
Probabilty
3.62E-7 LPG Release yes 0.07 yes 0.167 yes 0.95 Jet fire 4.01E-9
no 0.93 no 0.833 no 0.05
BLEVE 2.11E-10
Jet fire 2.11E-8
yes 0.5 yes 0.2 VCE 3.37E-8
no 0.5 no 0.8
Flash fire 1.35E-7
Unignited Release 1.68E-7
Immediate Ignition
Delayed Ignition VCE Outcome
Outcome Probabilty
3.82E-5 LPG Release yes 0.07 Jetfire 2.67E-6
no 0.93
yes 0.5 yes 0.2 VCE 3.55E-6
no 0.5 no 0.8
Flashfire 1.42E-5
Unignited Release 1.78E-5

ERM-HONG KONG LTD WEEK 30 - JULY 2010
A7B-31
Figure 4.6 Event Tree for LPG Cylinder Rupture
Event tree applies to failure of cylinders in storage shed. Event trees for cylinders on wagons
are similar except for the different base frequency (Table 4.2).
For leaks from a cylinder, the probability of impinging on a neighbouring
cylinder is taken to be 0.5. This is a rather high probability to reflect that
cylinders are stored in stacks. To escalate to a BLEVE, however, would require
fire protection systems (gas detectors and water sprinklers) to fail which has
been assigned a probability of 0.015 (Maunsell, 2006).
Figure 4.7 Event Tree for LPG Cylinder Leak
Event tree applies to failure of cylinders in storage shed. Event trees for cylinders on wagons
are similar except for the different base frequency (Table 4.2).
4.2.5 Transit Depot Scenarios
The event trees for the LPG release at the Transit Depot are essentially similar
to those for the bulk compound except for the different base frequencies (see
Table 4.2).
Petrol/Diesel Tanker Scenarios
The event tree for petrol tankers is shown in Figures 4.8. Ignition probabilities
are adopted from the values for liquids in Table 4.3, namely 0.08 for ruptures
and 0.03 for leaks. Ignition of a spill will lead to a pool fire. The event tree for
diesel tankers is shown in Figure 4.9. Given the high flash point of diesel, it is
relatively more difficult to ignite. Diesel is actually classified as combustible
rather than flammable. As such, a lower ignition probability is appropriate
and a values ten times lower is assumed in the analysis.
Immediate Ignition
Delayed Ignition VCE Event Outcome
Outcome Frequency
2.20E-3 LPG Release yes 0.005 Fire ball 1.10E-5
no 0.995
yes 0.005 yes 0 VCE 0.00E+0
no 0.995 no 1
Flash fire 1.09E-5
Unignited Release 2.18E-3
Immediate
Ignition
Delayed
Ignition VCE
Flame
Impingement
Successful Water Spray
System Outcome
Outcome
Probabilty
5.72E-3 LPG Release yes 0.005 yes 0.5 yes 0.985 Jetfire 1.41E-5
no 0.995 no 0.5 no 0.015
BLEVE 2.15E-7
Jetfire 1.43E-5
yes 0.005 yes 0 VCE 0.00E+0
no 0.995 no 1
Flashfire 2.85E-5
Unignited Release 5.66E-3
ERM-HONG KONG LTD WEEK 30 - JULY 2010
A7B-32
Figure 4.8 Event Tree for Petrol Tankers
Figure 4.9 Event Tree for Diesel Tankers
4.3 PROJECTILES
Rupture of an LPG cylinder, due either to spontaneous failure or a BLEVE,
may produce fragments that can cause fatal injuries hundreds of metres away.
This is discussed further in this section.
4.3.1 Cylinder Rupture Frequency
Rupture of an LPG cylinder may be caused by spontaneous failures (material
defects, overpressurisation, external damage etc. or by engulfment in a fire
leading to a BLEVE.
Spontaneous failure of a cylinder is assigned a frequency of 1×10⁻⁶ per
cylinder-year (Purple Book; ENSR, 2008). With 2200 cylinders in the store on
average, the spontaneous rupture frequency is estimated at 2.2×10⁻³ per year.
An event tree for escalation of leaks to cause a major fire and multiple BLEVEs
was shown in Figure 4.7. A cylinder leak frequency of 2.6×10⁻⁶ per cylinder-
year (ENSR, 2008) is applied, which amounts to 5.72×10⁻³ per year for 2200
cylinders. An immediate ignition probability of 0.005 is used, based on
ignition probabilities for small leaks from Table 4.3, assuming an even split
between immediate and delayed ignition. If a leak is ignited, a jet fire will
result. This will need to impinge directly on a neighbouring cylinder in order
for the event to escalate (either by causing that cylinder to fail in a BLEVE or
by causing its safety valve to open and add more fuel to the fire). Given that
cylinders are stored in stacks, a relatively high flame impingement probability
of 0.5 is assumed. The storage shed is equipped with gas detectors and
automatic sprinkler systems. These would need to fail for the event to escalate
Rupture Ignition Event Outcome Outcome Frequency
1.25E-7 Petrol Release yes 0.08 Pool fire 1.00E-8
no 0.92
Unignited Release 1.15E-7 Leak Ignition Event Outcome Outcome Frequency
3.13E-7 Petrol Release yes 0.03 Pool fire 9.38E-9
no 0.97
Unignited Release 3.03E-7
Rupture Ignition Event Outcome Outcome Frequency
8.33E-8 Diesel Release yes 0.008 Pool fire 6.67E-10
no 0.992
Unignited Release 8.27E-8 Leak Ignition Event Outcome Outcome Frequency
2.08E-7 Diesel Release yes 0.003 Pool fire 6.25E-10
no 0.997
Unignited Release 2.08E-7

ERM-HONG KONG LTD WEEK 30 - JULY 2010
A7B-33
to a major fire. The probability of failure of the fire protection system is taken
as 0.015 (Maunsell, 2006). This gives an overall frequency of major fire of
2.15×10⁻⁷ per year.
A major fire could lead to multiple, sequential BLEVEs. LPG cylinders,
however, are fitted with safety valves to release the gas in case of
overpressurisation. Not all cylinders will fail in a BLEVE. Conservatively
assuming that 10% of cylinders will fail in a BLEVE gives 220 BLEVE events
with a frequency of 2.2×10⁻⁷ per year. This is equivalent to one BLEVE with a
frequency of 4.8×10⁻⁵ per year. This is small compared to the spontaneous
failure rate, suggesting a total rupture frequency of 2.2×10⁻³ per year.
Number of Fragments
Brittle failure of LPG storage tanks have been known to produce up to 30
fragments in a catastrophic failure. However, brittle failures are not relevant
to the current study since they generally occur under low temperatures. For
ductile failures, Baum (1988) has reported that less than five projectiles will be
produced. Holden and Reeves (1985) report that there is an 80% chance that a
rupture will produce fragments and there will be 2 to 4 fragments for each
failure. Most scenarios involve the valve being ejected so that there are 2
fragments (the valve and the cylinder). Assuming that 90% of incidents
produce 2 fragments, 10% of incidents produce 5 fragments and only 80% of
incidents produce any fragments, the average number of fragments may be
estimated as 0.8×(0.9×2 + 0.1×5) = 2.
Cylinders are stored in stacks so that fragments produced from failure of inner
cylinders are likely shielded by the outer cylinders. It is assumed that 50% of
fragments will escape the stack and launch as a projectile (ENSR, 2008).
Fragment Range
In order to determine the range of the fragment, the initial velocity of the
fragment must be determined. Range can then be found by solving equations
for trajectory motion, allowing for the effects of drag.
Several models have been proposed to estimate the initial velocity of a
fragment. The Brode and Baum models are described by Lees (1996) and the
Center for Chemical Process Safety (CCPS, 1999) and were applied in this
study.
Brode assumed that a portion of the total internal energy of a storage vessel is
translated into kinetic energy of the fragment:
1
1
−
=
γ
VkpEk
−−+
−=
−− )/1(
11
)/1(
1
1)1(1
γγγ
γ
p
p
p
p
p
pk ooo
ERM-HONG KONG LTD WEEK 30 - JULY 2010
A7B-34
M
Ev k
i
2=
where
iv = initial fragment velocity (m/s)
Ek = kinetic energy (J)
M = total mass of the empty cylinder (kg)
k = fraction of internal energy converted to fragment kinetic energy
p1 = absolute pressure in cylinder (Pa)
po = ambient pressure (Pa)
V = volume of the vessel (m3)
γ = ratio of specific heats of the gas
The weakness of the Brode model is that it does not take into account the
fragment size.
Baum developed empirical correlations for the initial velocity for an end cap
breaking away from a cylindrical vessel, a cylindrical vessel breaking into two
parts, and a single small fragment ejected from the vessel. As an example, the
model for a single small fragment is presented in the equations below. The
model for end cap and cylinder breaking into 2 parts are similar.
2
1)(
of
o
aM
ArppF
−=
m
RTao
γ=
5.0
2
=
r
Fsav oi
where
F = parameter for calculation of initial velocity
A = area of the detached portion of the cylinder wall (m2)
r = radius of the vessel
Mf = mass of fragment (kg)
ao = speed of sound (m/s)
T = temperature of the gas inside cylinder at failure (K)
R = ideal gas constant (J/kmol-K)
m = molecular mass of cylinder contents (kg/kmol)
s = dimension of the fragment
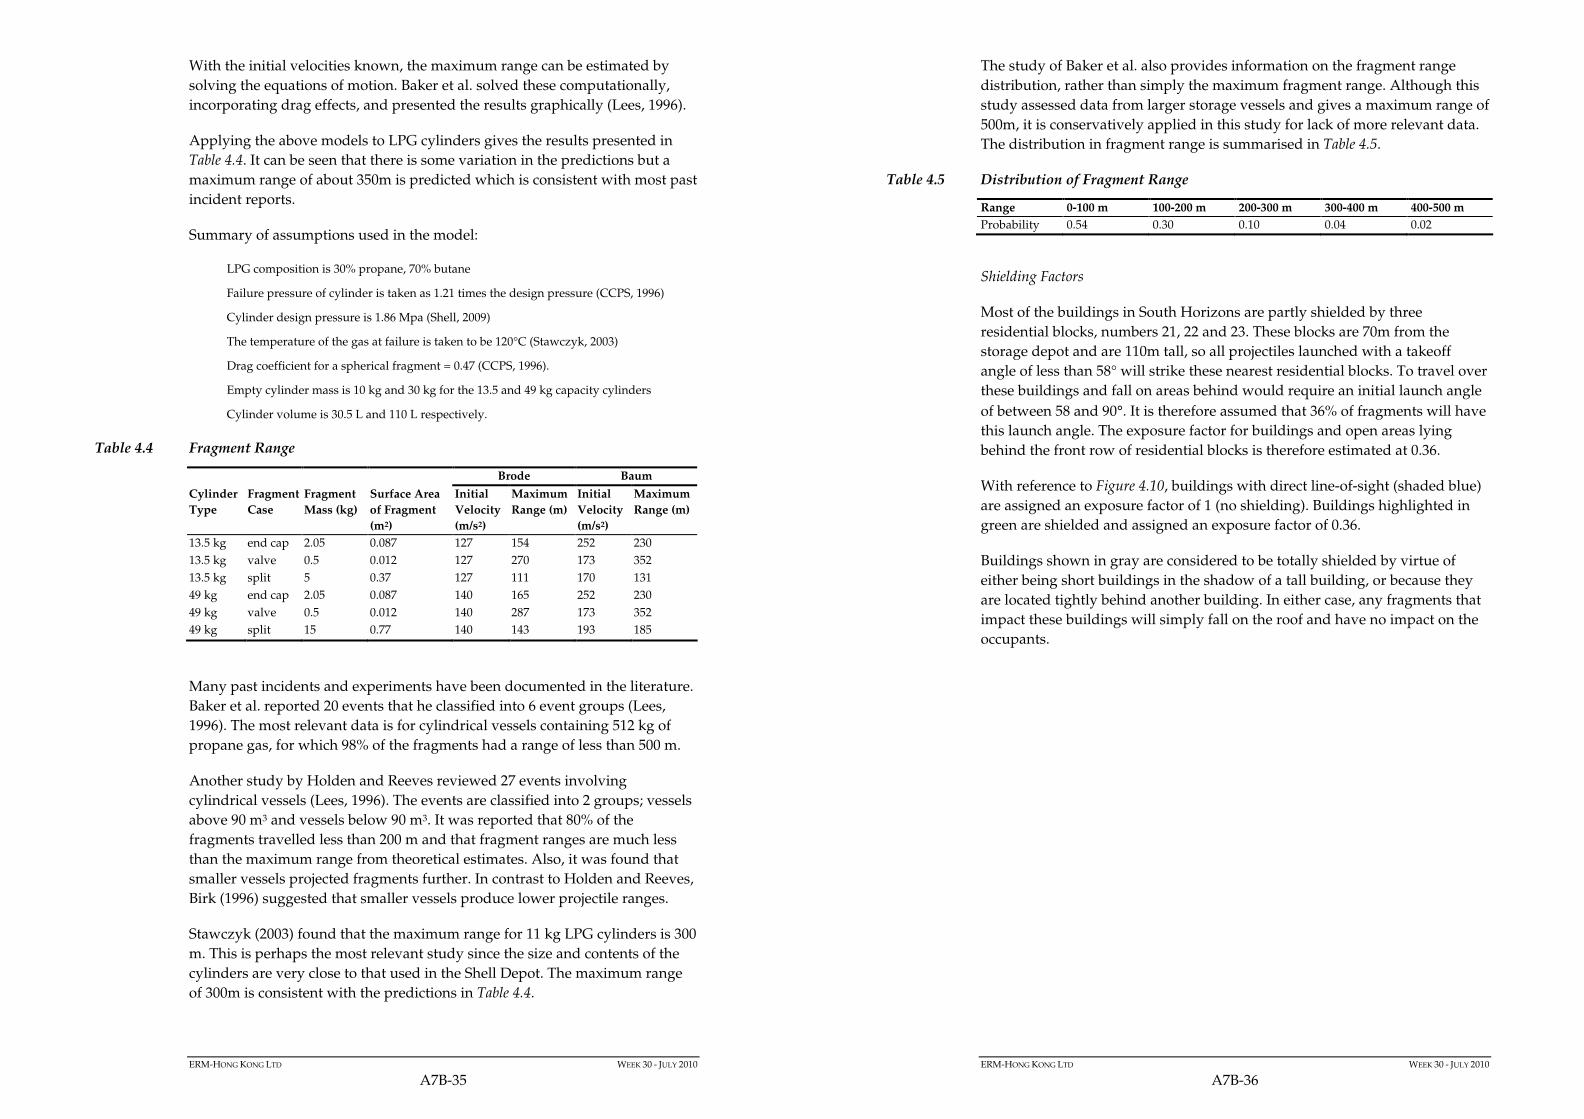
ERM-HONG KONG LTD WEEK 30 - JULY 2010
A7B-35
With the initial velocities known, the maximum range can be estimated by
solving the equations of motion. Baker et al. solved these computationally,
incorporating drag effects, and presented the results graphically (Lees, 1996).
Applying the above models to LPG cylinders gives the results presented in
Table 4.4. It can be seen that there is some variation in the predictions but a
maximum range of about 350m is predicted which is consistent with most past
incident reports.
Summary of assumptions used in the model:
LPG composition is 30% propane, 70% butane
Failure pressure of cylinder is taken as 1.21 times the design pressure (CCPS, 1996)
Cylinder design pressure is 1.86 Mpa (Shell, 2009)
The temperature of the gas at failure is taken to be 120°C (Stawczyk, 2003)
Drag coefficient for a spherical fragment = 0.47 (CCPS, 1996).
Empty cylinder mass is 10 kg and 30 kg for the 13.5 and 49 kg capacity cylinders
Cylinder volume is 30.5 L and 110 L respectively.
Table 4.4 Fragment Range
Brode Baum
Cylinder
Type
Fragment
Case
Fragment
Mass (kg)
Surface Area
of Fragment
(m2)
Initial
Velocity
(m/s2)
Maximum
Range (m)
Initial
Velocity
(m/s2)
Maximum
Range (m)
13.5 kg end cap 2.05 0.087 127 154 252 230
13.5 kg valve 0.5 0.012 127 270 173 352
13.5 kg split 5 0.37 127 111 170 131
49 kg end cap 2.05 0.087 140 165 252 230
49 kg valve 0.5 0.012 140 287 173 352
49 kg split 15 0.77 140 143 193 185
Many past incidents and experiments have been documented in the literature.
Baker et al. reported 20 events that he classified into 6 event groups (Lees,
1996). The most relevant data is for cylindrical vessels containing 512 kg of
propane gas, for which 98% of the fragments had a range of less than 500 m.
Another study by Holden and Reeves reviewed 27 events involving
cylindrical vessels (Lees, 1996). The events are classified into 2 groups; vessels
above 90 m3 and vessels below 90 m3. It was reported that 80% of the
fragments travelled less than 200 m and that fragment ranges are much less
than the maximum range from theoretical estimates. Also, it was found that
smaller vessels projected fragments further. In contrast to Holden and Reeves,
Birk (1996) suggested that smaller vessels produce lower projectile ranges.
Stawczyk (2003) found that the maximum range for 11 kg LPG cylinders is 300
m. This is perhaps the most relevant study since the size and contents of the
cylinders are very close to that used in the Shell Depot. The maximum range
of 300m is consistent with the predictions in Table 4.4.
ERM-HONG KONG LTD WEEK 30 - JULY 2010
A7B-36
The study of Baker et al. also provides information on the fragment range
distribution, rather than simply the maximum fragment range. Although this
study assessed data from larger storage vessels and gives a maximum range of
500m, it is conservatively applied in this study for lack of more relevant data.
The distribution in fragment range is summarised in Table 4.5.
Table 4.5 Distribution of Fragment Range
Range 0-100 m 100-200 m 200-300 m 300-400 m 400-500 m
Probability 0.54 0.30 0.10 0.04 0.02
Shielding Factors
Most of the buildings in South Horizons are partly shielded by three
residential blocks, numbers 21, 22 and 23. These blocks are 70m from the
storage depot and are 110m tall, so all projectiles launched with a takeoff
angle of less than 58° will strike these nearest residential blocks. To travel over
these buildings and fall on areas behind would require an initial launch angle
of between 58 and 90°. It is therefore assumed that 36% of fragments will have
this launch angle. The exposure factor for buildings and open areas lying
behind the front row of residential blocks is therefore estimated at 0.36.
With reference to Figure 4.10, buildings with direct line-of-sight (shaded blue)
are assigned an exposure factor of 1 (no shielding). Buildings highlighted in
green are shielded and assigned an exposure factor of 0.36.
Buildings shown in gray are considered to be totally shielded by virtue of
either being short buildings in the shadow of a tall building, or because they
are located tightly behind another building. In either case, any fragments that
impact these buildings will simply fall on the roof and have no impact on the
occupants.

ERM-HONG KONG LTD WEEK 30 - JULY 2010
A7B-37
Figure 4.10 Shielding Factors
No shielding was applied to road and pedestrian population on Lee Nam
Road, although the LPG Depot perimeter wall is about 2m tall and may
provide some protection.
The analysis also neglects any shielding effects from the storage shed roof.
This is a corrugated iron structure and is assumed to provide little protection.
Target Area
If a fragment strikes a critical part of the body such as head or torso, a fatality
may result. Assuming a cylindrical shaped torso, about 1m long and 12”
diameter (the chest size for the average Chinese male is 35” circumference
(Alvanon, 2008), gives a target area of 0.3m2.
The probability of a building being hit is estimated from the solid angle
subtended by the building compared to the solid angle of a hemisphere (2π),
taking into account the exposure (shielding) factor and the fraction of
fragments that have sufficient range to reach the building (Table 4.6). Rupture
fragments will not have sufficient energy to penetrate the concrete walls of
residential buildings in Hong Kong, such that a person can only be hurt if the
Populated buildings/areas with direct line-of-sight to LPG depot
Partly shielded buildings/areas
Fully shielded buildings/areas
ERM-HONG KONG LTD WEEK 30 - JULY 2010
A7B-38
fragment flies through a window. The ratio of window area to total wall area
of the building in South Horizons is about 50% (Centamap, 2009).
The probability of a person being struck by a fragment is therefore calculated
based on:
• The probability that the building will be hit, based on solid angles,
shielding factor and the fraction of fragments that have sufficient range to
reach the building;
• A probability of 0.5 that a fragment will pass through a window;
• A persons target area of 0.3m2;
• The number of persons in a building estimated from number of units
facing the LPG Depot and assuming 3 persons per unit; and
• A time average occupancy of 66% (from Table 2.4);
Calculations for outdoor population are a little more straightforward. The
probability of a target being struck is calculation from the target area, fraction
of fragments that have sufficient range to reach the target and the shielding
(exposure) factors.
The results of this analysis are summarised in Table 4.6. It can be seen that for
each projectile emanating from the LPG Depot, the probability of a person
being struck and fatally injured is about 2×10⁻³. This includes the construction
phase population for MTR and PTW.
Table 4.6 Summary of Cylinder Projectile Analysis
Area/Building Exposure
Factor
Probability of
Area/Building being
Hit
Probability of a
Person being Hit
South Horizons Block 13A 0.36 1.30E-04 1.04E-06
South Horizons Block 15 0.36 4.33E-04 3.25E-06
South Horizons Block 16 1 1.56E-03 1.15E-05
South Horizons Block 17 0.36 2.75E-03 2.51E-05
South Horizons Block 18 0.36 2.99E-03 3.11E-05
South Horizons Block 19 0.36 3.31E-03 3.60E-05
South Horizons Block 20 0.36 3.33E-03 3.55E-05
South Horizons Block 21 1 4.75E-02 4.05E-04
South Horizons Block 22 1 5.65E-02 5.64E-04
South Horizons Block 23 1 4.65E-02 4.07E-04
South Horizons Block 23A 0.36 6.21E-03 4.80E-05
South Horizons Block 29 0.36 8.54E-05 6.41E-07
South Horizons Block 30 0.36 8.64E-05 7.29E-07
South Horizons Block 33A 0.36 1.63E-03 1.33E-05
Horizon Plaza 1 4.99E-05 3.46E-06
Dah Chong Hong 1 4.92E-05 6.61E-07
Outdoor Population (0 to 100 m) 1 3.41E-02 7.01E-05
Outdoor Population (100 to 200 m) 0.36 1.04E-02 1.17E-04
Outdoor Population (200 to 300 m) 0.36 2.00E-03 2.25E-05
Outdoor Population (300 to 400 m) 0.36 1.35E-03 1.51E-05
Outdoor Population (400 to 500 m) 0.36 3.29E-04 3.70E-06
Ap Lei Chau PTW 1 9.56E-03 2.86E-06
Driving School 1 4.40E-04 5.31E-07
Maine Population 1 4.00E-01 1.91E-06

ERM-HONG KONG LTD WEEK 30 - JULY 2010
A7B-39
Area/Building Exposure
Factor
Probability of
Area/Building being
Hit
Probability of a
Person being Hit
MTR Works Site A 1 3.63E-03 3.18E-05
MTR Works Site B 1 1.79E-03 1.59E-05
MTR Works Site C 1 2.13E-04 3.98E-06
MTR Works Site W2 1 2.17E-04 1.06E-06
Total 1.87E-03
Summary of Projectile Analysis
The frequency of cylinder ruptures was estimated at 2.2×10⁻³ per year. Each
rupture was estimated to produce 2 fragments on average, but 50% of these
will be trapped within cylinder stacks. This gives a frequency for fragments
leaving the LPG Depot of 2.2×10⁻³ per year.
The probability that a fragment will cause a fatality was estimated at 1.87×10⁻³.
This is likely conservative since the analysis assumes all projectile impacts on
a person will lead to a fatality. Combining the fragment frequency of 2.2×10⁻³
per year with the probability of 1.87×10⁻³ that a fragment will lead to fatality
gives a projectile fatality rate of 4.1×10⁻⁶ per year.
A single point is therefore added to the FN curves at N=1 and F=4.1×10⁻⁶.
4.4 SUMMARY
The frequencies of hazardous outcomes assessed in this study are summarised
in Table 4.7 and Table 4.8.
Table 4.7 Event Outcome Frequencies for the LPG Compound
Equip.
ID
Equipment Description Event Description Outcome Outcome Frequency
(per year)
1 Storage vessel Rupture Fireball 2.02×10⁻⁷
VCE 4.70×10⁻⁸
Flash fire 1.88×10⁻⁷
Leak Jet fire 8.19×10⁻⁷
VCE 1.09×10⁻⁷
Flash fire 4.35×10⁻⁶
2 Road tanker Rupture Fireball 4.44×10⁻⁸
VCE 1.04×10⁻⁸
Flash Fire 4.14×10⁻⁸
Leak Jet fire 2.51×10⁻⁸
VCE 3.37×10⁻⁸
Flash fire 1.35×10⁻⁷
Escalation events BLEVE 2.11×10⁻¹⁰
3 Filling line to storage vessel Full bore rupture Jet fire 3.60×10⁻⁸
VCE 4.78×10⁻⁸
Flash fire 1.91×10⁻⁷
Leak Jet fire 5.33×10⁻⁸
VCE 7.15×10⁻⁸
Flash fire 2.86×10⁻⁷
ERM-HONG KONG LTD WEEK 30 - JULY 2010
A7B-40
Equip.
ID
Equipment Description Event Description Outcome Outcome Frequency
(per year)
4 Flexible hose Full bore rupture Jet fire 2.67×10⁻⁶
VCE 3.55×10⁻⁶
Flash fire 1.42×10⁻⁵
Leak Jet fire 2.74×10⁻⁶
VCE 3.65×10⁻⁶
Flash fire 1.46×10⁻⁵
5 Full bore rupture Jet fire 2.80×10⁻⁷
Line from storage vessel to
vaporisers VCE 3.72×10⁻⁷
Flash fire 1.49×10⁻⁶
Leak Jet fire 9.10×10⁻⁷
VCE 1.21×10⁻⁶
Flash fire 4.84×10⁻⁶
6 Vaporisers Full bore rupture Jet fire 2.55×10⁻⁹
VCE 3.39×10⁻⁹
Flash fire 1.35×10⁻⁸
7 Full bore rupture Jet fire 2.80×10⁻⁷
Send-out piping downstream
of vaporisers VCE 3.72×10⁻⁷
Flash fire 1.49×10⁻⁶
Leak Jet fire 9.10×10⁻⁷
VCE 1.21×10⁻⁶
Flash fire 4.84×10⁻⁶
8 LPG Cylinder * Rupture Fireball 1.10×10⁻⁵
Flash fire 1.09×10⁻⁵
Leak Jet fire 2.84×10⁻⁵
Flash fire 2.85×10⁻⁵
Escalation events BLEVE 2.15×10-7
* 25% of cylinders are assumed to be 13.5kg and 75% are 49kg (see Table 2.2). Outcome
frequencies are assigned proportionally
Table 4.8 Event Outcome Frequencies for the Transit Depot
Equipment Description Event Description Outcome Outcome Frequency
(per year)
Road Tanker/Cylinder Wagon Transport Events
Road tanker Rupture Fireball 1.71×10⁻⁷
VCE 3.98×10⁻⁸
Flash Fire 1.59×10⁻⁷
Large liquid leak Jet fire 2.74×10⁻⁷
VCE 3.66×10⁻⁷
Flash fire 1.47×10⁻⁶
Large vapour leak Jet fire 3.22×10⁻⁸
VCE 4.28×10⁻⁸
Flash fire 1.71×10⁻⁷
Medium liquid leak Jet fire 1.03×10⁻⁷
VCE 1.39×10⁻⁷
Flash fire 5.54×10⁻⁷
Escalation events BLEVE 3.17×10⁻⁹
Cylinder wagons * Rupture Fireball 3.07×10⁻⁸
Flash fire 3.05×10⁻⁸
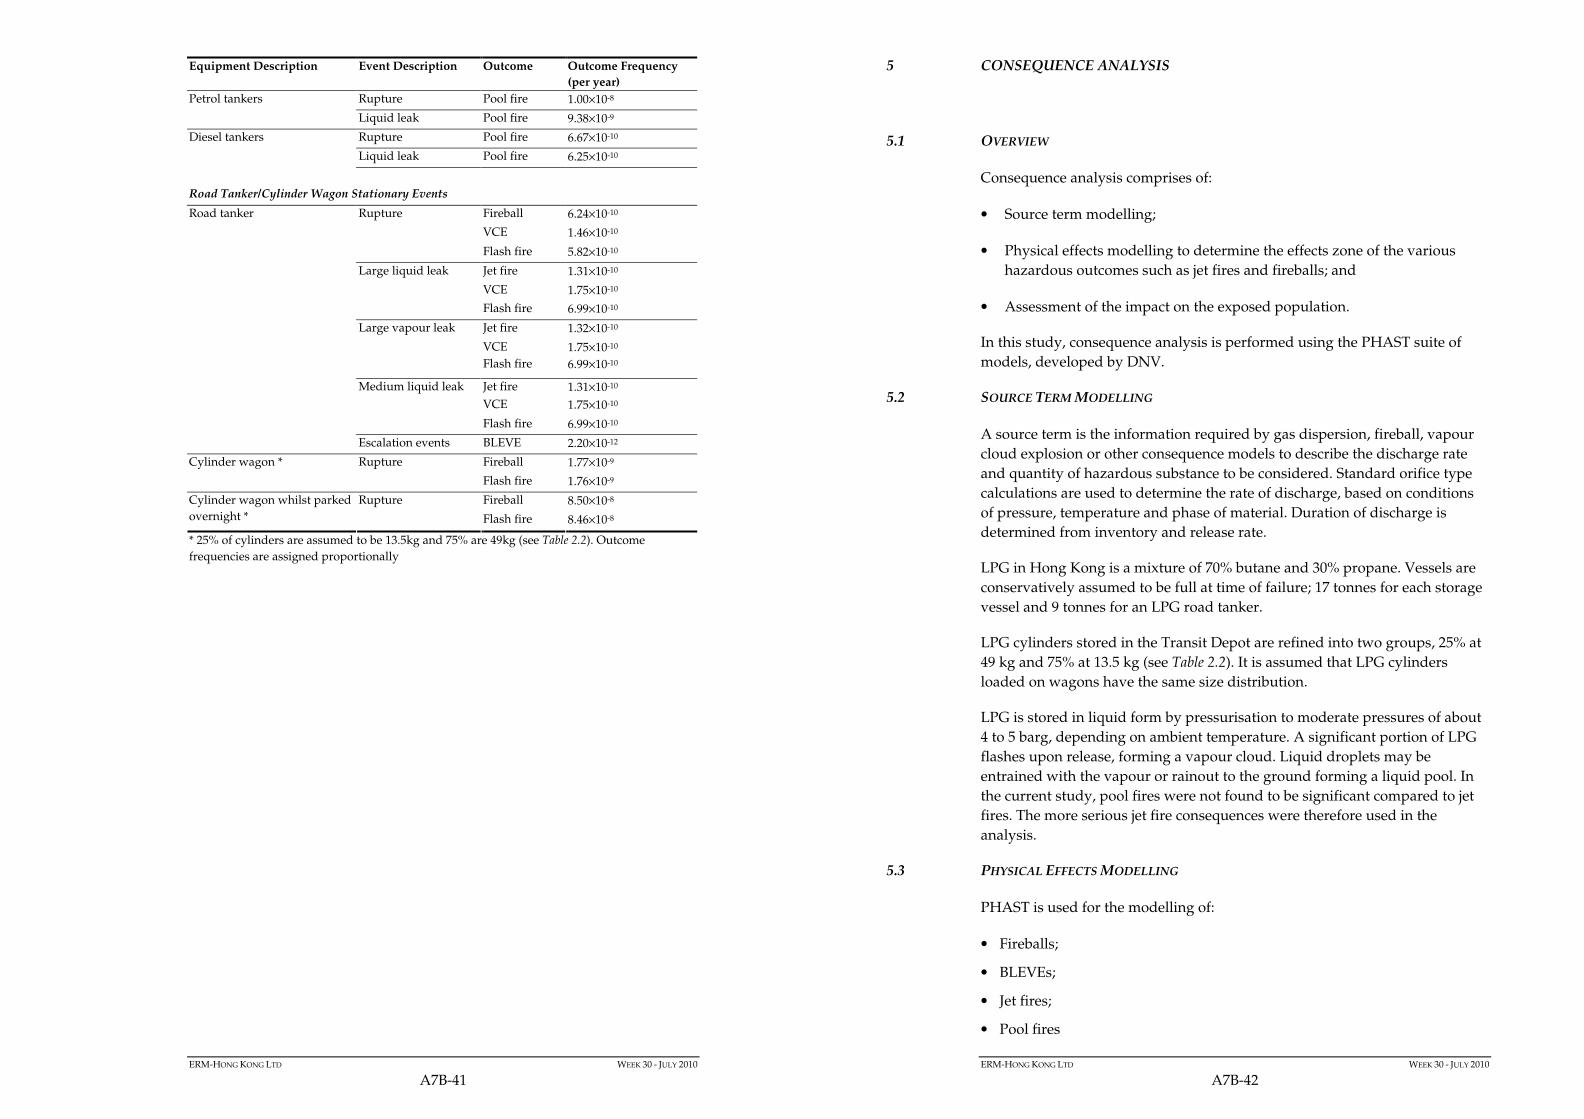
ERM-HONG KONG LTD WEEK 30 - JULY 2010
A7B-41
Equipment Description Event Description Outcome Outcome Frequency
(per year)
Petrol tankers Rupture Pool fire 1.00×10⁻⁸
Liquid leak Pool fire 9.38×10⁻⁹
Diesel tankers Rupture Pool fire 6.67×10⁻¹⁰
Liquid leak Pool fire 6.25×10⁻¹⁰
Road Tanker/Cylinder Wagon Stationary Events
Road tanker Rupture Fireball 6.24×10⁻¹⁰
VCE 1.46×10⁻¹⁰
Flash fire 5.82×10⁻¹⁰
Large liquid leak Jet fire 1.31×10⁻¹⁰
VCE 1.75×10⁻¹⁰
Flash fire 6.99×10⁻¹⁰
Large vapour leak Jet fire 1.32×10⁻¹⁰
VCE 1.75×10⁻¹⁰
Flash fire 6.99×10⁻¹⁰
Medium liquid leak Jet fire 1.31×10⁻¹⁰
VCE 1.75×10⁻¹⁰
Flash fire 6.99×10⁻¹⁰
Escalation events BLEVE 2.20×10⁻¹²
Cylinder wagon * Rupture Fireball 1.77×10⁻⁹
Flash fire 1.76×10⁻⁹
Rupture Fireball 8.50×10⁻⁸ Cylinder wagon whilst parked
overnight * Flash fire 8.46×10-8
* 25% of cylinders are assumed to be 13.5kg and 75% are 49kg (see Table 2.2). Outcome
frequencies are assigned proportionally
ERM-HONG KONG LTD WEEK 30 - JULY 2010
A7B-42
5 CONSEQUENCE ANALYSIS
5.1 OVERVIEW
Consequence analysis comprises of:
• Source term modelling;
• Physical effects modelling to determine the effects zone of the various
hazardous outcomes such as jet fires and fireballs; and
• Assessment of the impact on the exposed population.
In this study, consequence analysis is performed using the PHAST suite of
models, developed by DNV.
5.2 SOURCE TERM MODELLING
A source term is the information required by gas dispersion, fireball, vapour
cloud explosion or other consequence models to describe the discharge rate
and quantity of hazardous substance to be considered. Standard orifice type
calculations are used to determine the rate of discharge, based on conditions
of pressure, temperature and phase of material. Duration of discharge is
determined from inventory and release rate.
LPG in Hong Kong is a mixture of 70% butane and 30% propane. Vessels are
conservatively assumed to be full at time of failure; 17 tonnes for each storage
vessel and 9 tonnes for an LPG road tanker.
LPG cylinders stored in the Transit Depot are refined into two groups, 25% at
49 kg and 75% at 13.5 kg (see Table 2.2). It is assumed that LPG cylinders
loaded on wagons have the same size distribution.
LPG is stored in liquid form by pressurisation to moderate pressures of about
4 to 5 barg, depending on ambient temperature. A significant portion of LPG
flashes upon release, forming a vapour cloud. Liquid droplets may be
entrained with the vapour or rainout to the ground forming a liquid pool. In
the current study, pool fires were not found to be significant compared to jet
fires. The more serious jet fire consequences were therefore used in the
analysis.
5.3 PHYSICAL EFFECTS MODELLING
PHAST is used for the modelling of:
• Fireballs;
• BLEVEs;
• Jet fires;
• Pool fires
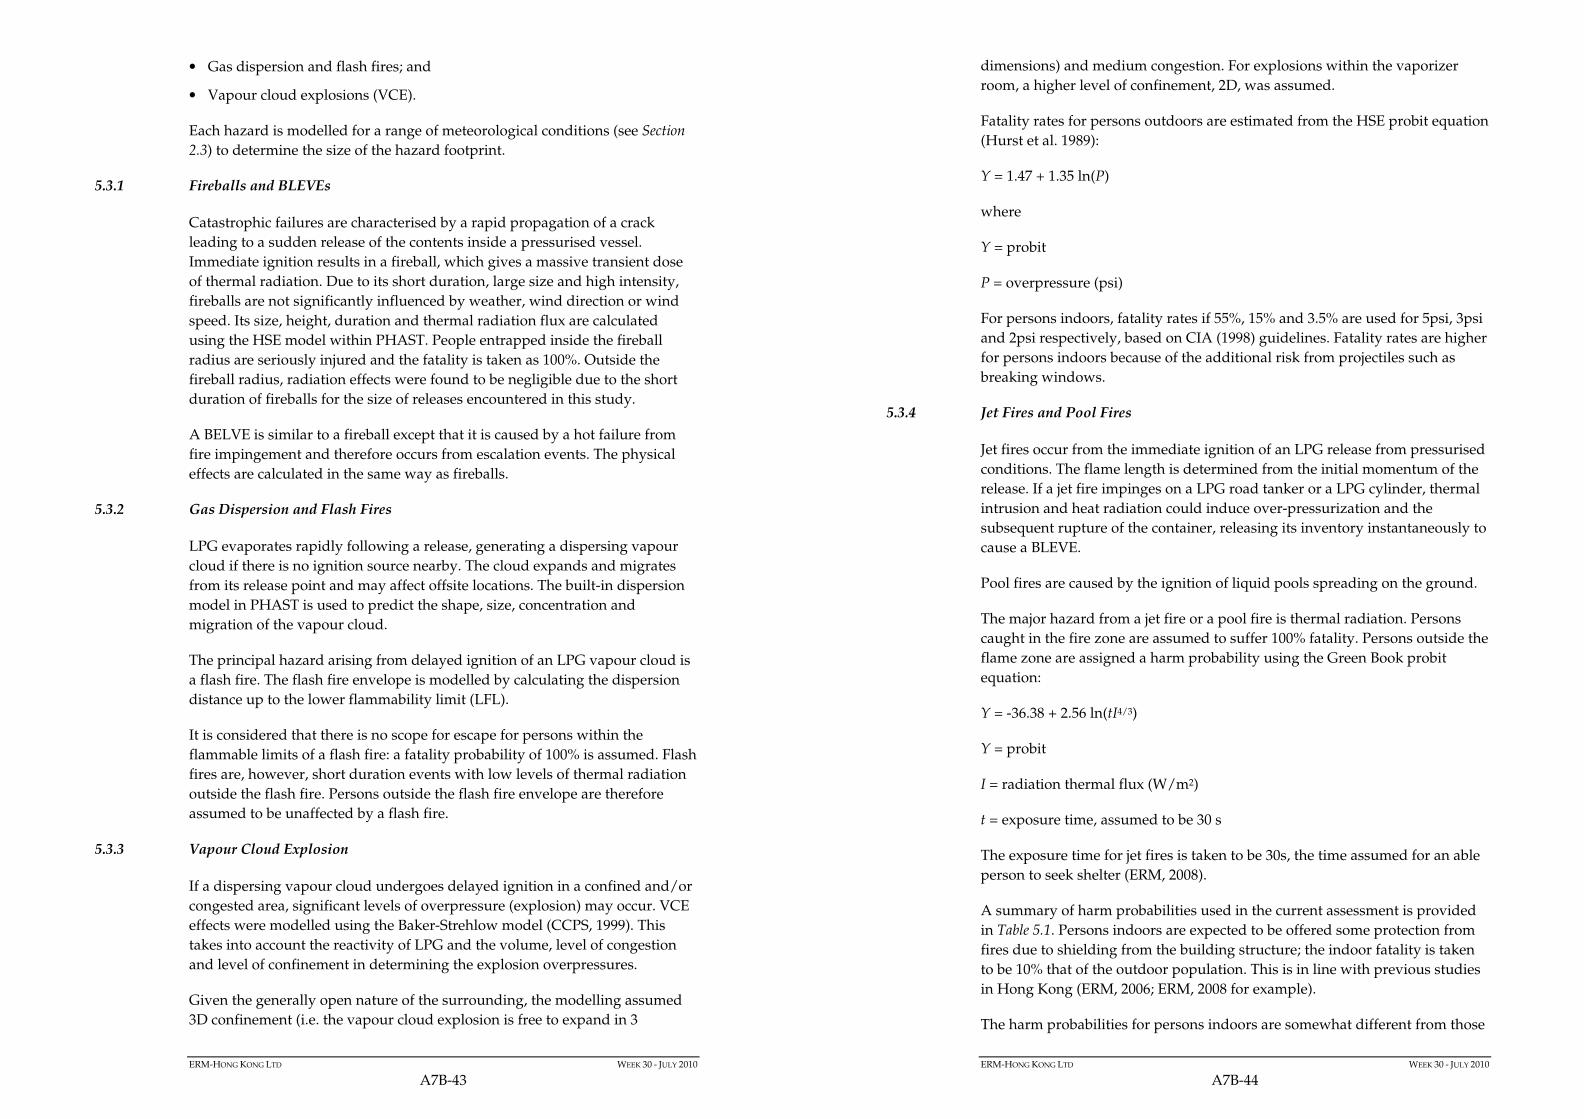
ERM-HONG KONG LTD WEEK 30 - JULY 2010
A7B-43
• Gas dispersion and flash fires; and
• Vapour cloud explosions (VCE).
Each hazard is modelled for a range of meteorological conditions (see Section
2.3) to determine the size of the hazard footprint.
5.3.1 Fireballs and BLEVEs
Catastrophic failures are characterised by a rapid propagation of a crack
leading to a sudden release of the contents inside a pressurised vessel.
Immediate ignition results in a fireball, which gives a massive transient dose
of thermal radiation. Due to its short duration, large size and high intensity,
fireballs are not significantly influenced by weather, wind direction or wind
speed. Its size, height, duration and thermal radiation flux are calculated
using the HSE model within PHAST. People entrapped inside the fireball
radius are seriously injured and the fatality is taken as 100%. Outside the
fireball radius, radiation effects were found to be negligible due to the short
duration of fireballs for the size of releases encountered in this study.
A BELVE is similar to a fireball except that it is caused by a hot failure from
fire impingement and therefore occurs from escalation events. The physical
effects are calculated in the same way as fireballs.
5.3.2 Gas Dispersion and Flash Fires
LPG evaporates rapidly following a release, generating a dispersing vapour
cloud if there is no ignition source nearby. The cloud expands and migrates
from its release point and may affect offsite locations. The built-in dispersion
model in PHAST is used to predict the shape, size, concentration and
migration of the vapour cloud.
The principal hazard arising from delayed ignition of an LPG vapour cloud is
a flash fire. The flash fire envelope is modelled by calculating the dispersion
distance up to the lower flammability limit (LFL).
It is considered that there is no scope for escape for persons within the
flammable limits of a flash fire: a fatality probability of 100% is assumed. Flash
fires are, however, short duration events with low levels of thermal radiation
outside the flash fire. Persons outside the flash fire envelope are therefore
assumed to be unaffected by a flash fire.
5.3.3 Vapour Cloud Explosion
If a dispersing vapour cloud undergoes delayed ignition in a confined and/or
congested area, significant levels of overpressure (explosion) may occur. VCE
effects were modelled using the Baker-Strehlow model (CCPS, 1999). This
takes into account the reactivity of LPG and the volume, level of congestion
and level of confinement in determining the explosion overpressures.
Given the generally open nature of the surrounding, the modelling assumed
3D confinement (i.e. the vapour cloud explosion is free to expand in 3
ERM-HONG KONG LTD WEEK 30 - JULY 2010
A7B-44
dimensions) and medium congestion. For explosions within the vaporizer
room, a higher level of confinement, 2D, was assumed.
Fatality rates for persons outdoors are estimated from the HSE probit equation
(Hurst et al. 1989):
Y = 1.47 + 1.35 ln(P)
where
Y = probit
P = overpressure (psi)
For persons indoors, fatality rates if 55%, 15% and 3.5% are used for 5psi, 3psi
and 2psi respectively, based on CIA (1998) guidelines. Fatality rates are higher
for persons indoors because of the additional risk from projectiles such as
breaking windows.
5.3.4 Jet Fires and Pool Fires
Jet fires occur from the immediate ignition of an LPG release from pressurised
conditions. The flame length is determined from the initial momentum of the
release. If a jet fire impinges on a LPG road tanker or a LPG cylinder, thermal
intrusion and heat radiation could induce over-pressurization and the
subsequent rupture of the container, releasing its inventory instantaneously to
cause a BLEVE.
Pool fires are caused by the ignition of liquid pools spreading on the ground.
The major hazard from a jet fire or a pool fire is thermal radiation. Persons
caught in the fire zone are assumed to suffer 100% fatality. Persons outside the
flame zone are assigned a harm probability using the Green Book probit
equation:
Y = -36.38 + 2.56 ln(tI4/3)
Y = probit
I = radiation thermal flux (W/m2)
t = exposure time, assumed to be 30 s
The exposure time for jet fires is taken to be 30s, the time assumed for an able
person to seek shelter (ERM, 2008).
A summary of harm probabilities used in the current assessment is provided
in Table 5.1. Persons indoors are expected to be offered some protection from
fires due to shielding from the building structure; the indoor fatality is taken
to be 10% that of the outdoor population. This is in line with previous studies
in Hong Kong (ERM, 2006; ERM, 2008 for example).
The harm probabilities for persons indoors are somewhat different from those
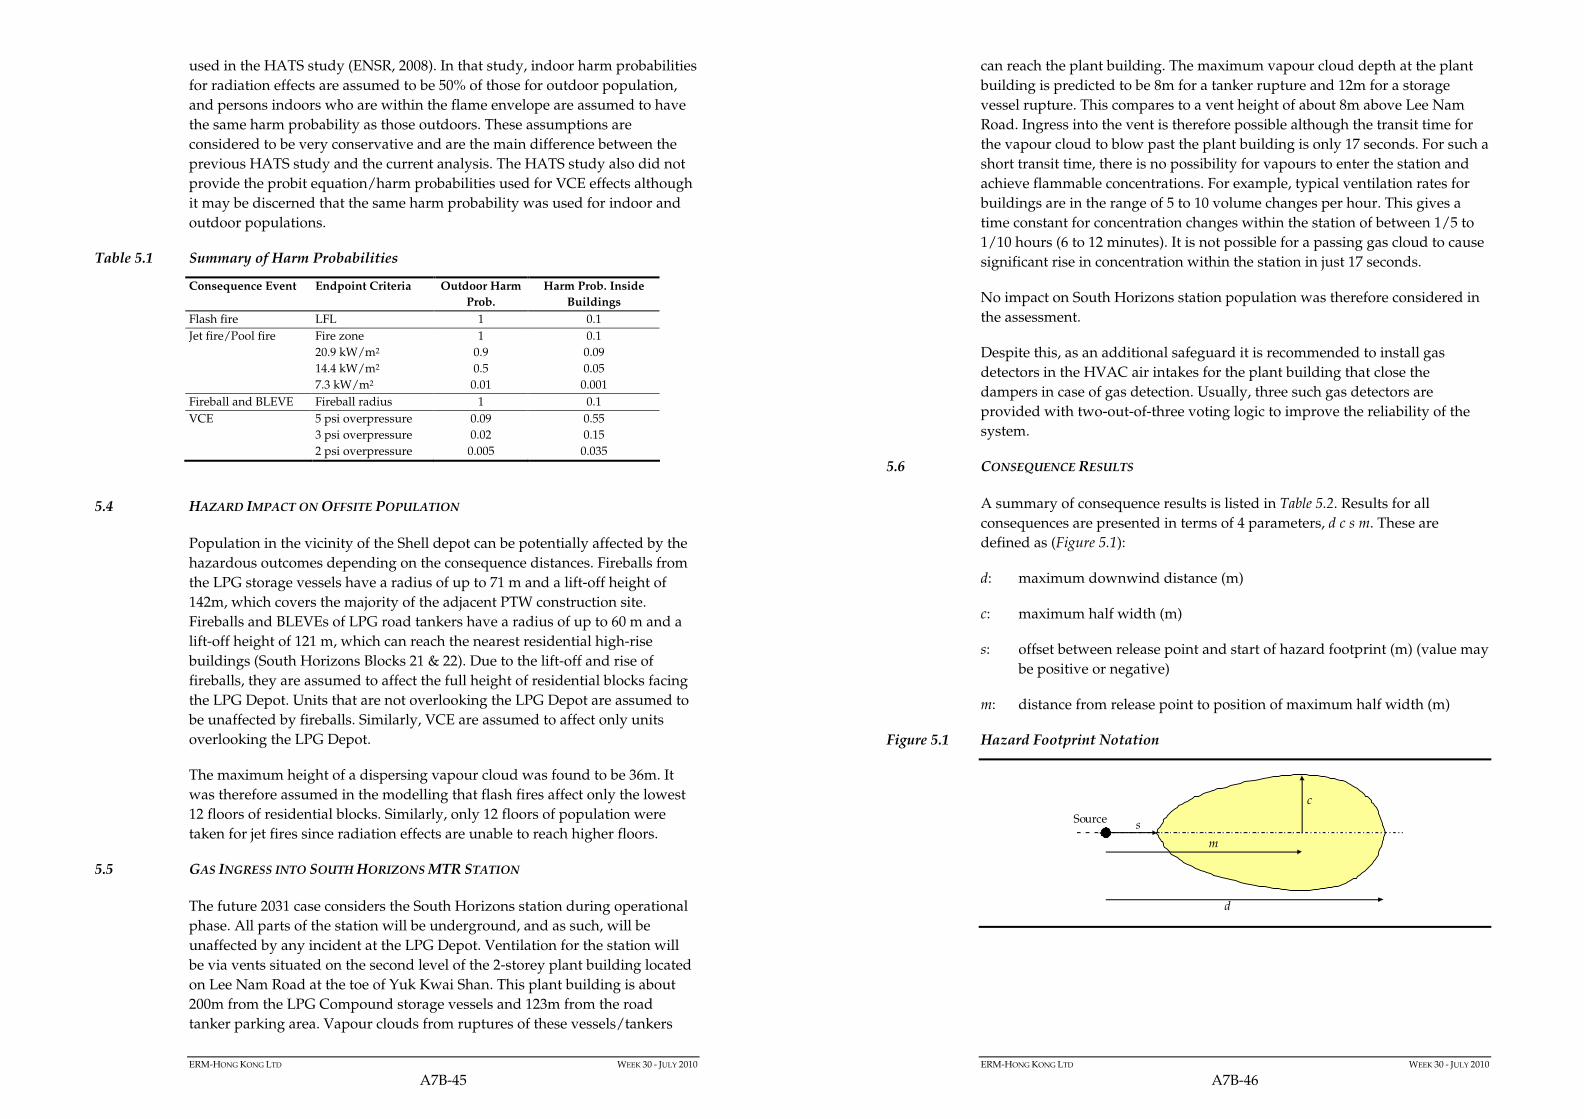
ERM-HONG KONG LTD WEEK 30 - JULY 2010
A7B-45
used in the HATS study (ENSR, 2008). In that study, indoor harm probabilities
for radiation effects are assumed to be 50% of those for outdoor population,
and persons indoors who are within the flame envelope are assumed to have
the same harm probability as those outdoors. These assumptions are
considered to be very conservative and are the main difference between the
previous HATS study and the current analysis. The HATS study also did not
provide the probit equation/harm probabilities used for VCE effects although
it may be discerned that the same harm probability was used for indoor and
outdoor populations.
Table 5.1 Summary of Harm Probabilities
Consequence Event Endpoint Criteria Outdoor Harm
Prob.
Harm Prob. Inside
Buildings
Flash fire LFL 1 0.1
Jet fire/Pool fire Fire zone 1 0.1
20.9 kW/m2 0.9 0.09
14.4 kW/m2 0.5 0.05
7.3 kW/m2 0.01 0.001
Fireball and BLEVE Fireball radius 1 0.1
VCE 5 psi overpressure 0.09 0.55
3 psi overpressure 0.02 0.15
2 psi overpressure 0.005 0.035
5.4 HAZARD IMPACT ON OFFSITE POPULATION
Population in the vicinity of the Shell depot can be potentially affected by the
hazardous outcomes depending on the consequence distances. Fireballs from
the LPG storage vessels have a radius of up to 71 m and a lift-off height of
142m, which covers the majority of the adjacent PTW construction site.
Fireballs and BLEVEs of LPG road tankers have a radius of up to 60 m and a
lift-off height of 121 m, which can reach the nearest residential high-rise
buildings (South Horizons Blocks 21 & 22). Due to the lift-off and rise of
fireballs, they are assumed to affect the full height of residential blocks facing
the LPG Depot. Units that are not overlooking the LPG Depot are assumed to
be unaffected by fireballs. Similarly, VCE are assumed to affect only units
overlooking the LPG Depot.
The maximum height of a dispersing vapour cloud was found to be 36m. It
was therefore assumed in the modelling that flash fires affect only the lowest
12 floors of residential blocks. Similarly, only 12 floors of population were
taken for jet fires since radiation effects are unable to reach higher floors.
5.5 GAS INGRESS INTO SOUTH HORIZONS MTR STATION
The future 2031 case considers the South Horizons station during operational
phase. All parts of the station will be underground, and as such, will be
unaffected by any incident at the LPG Depot. Ventilation for the station will
be via vents situated on the second level of the 2-storey plant building located
on Lee Nam Road at the toe of Yuk Kwai Shan. This plant building is about
200m from the LPG Compound storage vessels and 123m from the road
tanker parking area. Vapour clouds from ruptures of these vessels/tankers
ERM-HONG KONG LTD WEEK 30 - JULY 2010
A7B-46
can reach the plant building. The maximum vapour cloud depth at the plant
building is predicted to be 8m for a tanker rupture and 12m for a storage
vessel rupture. This compares to a vent height of about 8m above Lee Nam
Road. Ingress into the vent is therefore possible although the transit time for
the vapour cloud to blow past the plant building is only 17 seconds. For such a
short transit time, there is no possibility for vapours to enter the station and
achieve flammable concentrations. For example, typical ventilation rates for
buildings are in the range of 5 to 10 volume changes per hour. This gives a
time constant for concentration changes within the station of between 1/5 to
1/10 hours (6 to 12 minutes). It is not possible for a passing gas cloud to cause
significant rise in concentration within the station in just 17 seconds.
No impact on South Horizons station population was therefore considered in
the assessment.
Despite this, as an additional safeguard it is recommended to install gas
detectors in the HVAC air intakes for the plant building that close the
dampers in case of gas detection. Usually, three such gas detectors are
provided with two-out-of-three voting logic to improve the reliability of the
system.
5.6 CONSEQUENCE RESULTS
A summary of consequence results is listed in Table 5.2. Results for all
consequences are presented in terms of 4 parameters, d c s m. These are
defined as (Figure 5.1):
d: maximum downwind distance (m)
c: maximum half width (m)
s: offset between release point and start of hazard footprint (m) (value may
be positive or negative)
m: distance from release point to position of maximum half width (m)
Figure 5.1 Hazard Footprint Notation
d
c
s
m
Source

ER
M-H
ON
G K
ON
G L
TD
W
EE
K 3
0 -
JU
LY
20
10
A7
B-4
7
Ta
ble
5.2
C
on
seq
uen
ce R
esu
lts
Wea
ther
Co
nd
itio
ns
3B
3D
7D
3E
1.4F
Sec
tio
n
No
.
Des
crip
tio
n
Lea
k S
ize
Ou
tco
me
Cri
teri
a
d
c s
m
d
c s
m
d
c s
m
d
c s
m
d
c s
m
1 S
tora
ge
ves
sel
Ru
ptu
re
Fla
sh f
ire
LF
L
153
51
-20
70
179
60
-24
88
264
54
-15
160
182
60
-20
90
120
62
-30
50
V
CE
5
psi
12
2 53
16
69
14
3 54
35
89
22
3 47
12
9 17
6 14
8 49
50
99
11
5 68
-2
1 47
3 p
si
203
134
-65
69
225
136
-47
89
303
127
49
176
230
131
-32
99
183
136
-89
47
2 p
si
273
204
-135
69
29
7 20
8 -1
19
89
384
208
-32
176
298
199
-100
99
25
5 20
8 -1
61
47
F
ireb
all
Fir
ebal
l ra
diu
s 71
71
-7
1 0
71
71
-71
0 71
71
-7
1 0
71
71
-71
0 71
71
-7
1 0
Lea
k
Fla
sh f
ire
LF
L
38
2 8
28
40
2 8
30
30
1 8
20
42
2 8
32
47
4 8
36
V
CE
5
psi
10
10
-1
0 0
11
11
-11
0 9
9 -9
0
12
12
-12
0 13
13
-1
3 0
3 p
si
21
21
-21
0 23
23
-2
3 0
19
19
-19
0 24
24
-2
4 0
26
26
-26
0
2 p
si
32
32
-32
0 35
35
-3
5 0
30
30
-30
0 36
36
-3
6 0
40
40
-40
0
Je
t fi
re
Fir
e zo
ne
37
13
1 19
37
13
1
19
33
14
1 17
37
13
1
19
43
12
2 22
20.9
kW
/m
2 41
18
1
21
41
18
1 21
37
18
-1
18
41
18
1
21
46
18
2 24
14.4
kW
/m
2 44
21
0
22
44
21
0 22
40
21
-2
19
44
21
0
22
49
22
1 25
7.3
kW
/m
2 51
29
-1
25
51
29
-1
25
47
29
-3
22
51
29
-1
25
55
30
-1
27
2 L
PG
ro
ad t
ank
er
Ru
ptu
re
Fla
sh f
ire
LF
L
105
34
-20
55
110
34
-20
55
185
33
-15
110
112
35
-15
55
69
35
-25
30
V
CE
5
psi
67
36
-5
31
82
45
-8
37
12
2 34
54
88
85
47
-9
38
78
59
-4
0 19
3 p
si
167
136
-105
31
17
0 13
3 -9
6 37
18
8 10
0 -1
2 88
17
3 13
5 -9
7 38
15
5 13
6 -1
17
19
2 p
si
239
208
-177
31
23
9 20
2 -1
65
37
290
202
-114
88
24
3 20
5 -1
67
38
227
208
-189
19
F
ireb
all
Fir
ebal
l ra
diu
s 60
60
-6
0 0
60
60
-60
0 60
60
-6
0 0
60
60
-60
0 60
60
-6
0 0
Lea
k
Fla
sh f
ire
LF
L
108
7 7
78
106
7 7
78
107
6 7
75
107
8 7
80
105
11
7 85
V
CE
5
psi
25
25
-2
5 0
25
25
-25
0 24
24
-2
4 0
27
27
-27
0 29
29
-2
9 0
3 p
si
49
49
-49
0 51
51
-5
1 0
48
48
-48
0 53
53
-5
3 0
59
59
-59
0
2 p
si
75
75
-75
0 77
77
-7
7 0
74
74
-74
0 81
81
-8
1 0
90
90
-90
0
Je
t fi
re
Fir
e zo
ne
73
28
1 37
73
28
1
37
65
29
-1
32
73
28
1 37
83
27
1
42
20.9
kW
/m
2 80
37
0
40
80
37
0 40
73
36
-1
46
80
37
0
40
89
37
1 45
14.4
kW
/m
2 86
44
-2
42
86
44
-2
42
78
43
37
37
86
44
-2
42
95
45
-1
47
7.3
kW
/m
2 10
0 61
-4
48
10
0 61
-4
48
92
60
-1
0 41
10
0 61
-4
48
10
8 61
-2
53
Esc
alat
ion
B
LE
VE
F
ireb
all
rad
ius
60
60
-60
0 60
60
-6
0 0
60
60
-60
0 60
60
-6
0 0
60
60
-60
0
Fla
sh f
ire
LF
L
108
7 7
78
106
7 7
78
107
6 7
75
107
8 7
80
105
11
7 85
Lar
ge
liq
uid
lea
k
VC
E
5 p
si
25
25
-25
0 25
25
-2
5 0
24
24
-24
0 27
27
-2
7 0
29
29
-29
0
3
psi
49
49
-4
9 0
51
51
-51
0 48
48
-4
8 0
53
53
-53
0 59
59
-5
9 0
ER
M-H
ON
G K
ON
G L
TD
W
EE
K 3
0 -
JU
LY
20
10
A7
B-4
8
Wea
ther
Co
nd
itio
ns
3B
3D
7D
3E
1.4F
Sec
tio
n
No
.
Des
crip
tio
n
Lea
k S
ize
Ou
tco
me
Cri
teri
a
d
c s
m
d
c s
m
d
c s
m
d
c s
m
d
c s
m
2 p
si
75
75
-75
0 77
77
-7
7 0
74
74
-74
0 81
81
-8
1 0
90
90
-90
0
Je
t fi
re
Fir
e zo
ne
73
28
1 37
73
28
1
37
65
29
-1
32
73
28
1 37
83
27
1
42
20.9
kW
/m
2 80
37
0
40
80
37
0 40
73
36
-1
46
80
37
0
40
89
37
1 45
14.4
kW
/m
2 86
44
-2
42
86
44
-2
42
78
43
37
37
86
44
-2
42
95
45
-1
47
7.3
kW
/m
2 10
0 61
-4
48
10
0 61
-4
48
92
60
-1
0 41
10
0 61
-4
48
10
8 61
-2
53
Fla
sh f
ire
LF
L
12
1 0
7 14
1
0 8
11
1 0
6 14
1
0 8
15
1 0
9
Lar
ge
vap
ou
r le
ak
VC
E
5 p
si
4 4
-4
0 4
4 -4
0
3 3
-3
0 4
4 -4
0
4 4
-4
0
3 p
si
8 8
-8
0 8
8 -8
0
7 7
-7
0 8
8 -8
0
8 8
-8
0
2 p
si
12
12
-12
0 12
12
-1
2 0
11
11
-11
0 12
12
-1
2 0
12
12
-12
0
Je
t fi
re
Fir
e zo
ne
20
3 4
12
20
3 4
12
23
3 5
14
20
3 4
12
19
3 5
12
20.9
kW
/m
2 22
6
4 13
22
6
4 13
25
6
5 15
22
6
4 13
20
5
4 12
14.4
kW
/m
2 24
9
4 14
24
9
4 14
27
8
5 16
24
9
4 14
22
7
4 13
7.3
kW
/m
2 28
13
4
16
28
13
4 16
29
13
3
16
28
13
4 16
27
14
3
15
Fla
sh f
ire
LF
L
37
1 6
28
40
2 6
30
32
1 6
22
42
2 6
32
47
3 6
34
Med
ium
liq
uid
lea
k
VC
E
5 p
si
25
25
-25
0 25
25
-2
5 0
24
24
-24
0 27
27
-2
7 0
29
29
-29
0
3 p
si
49
49
-49
0 51
51
-5
1 0
48
48
-48
0 53
53
-5
3 0
59
59
-59
0
2 p
si
75
75
-75
0 77
77
-7
7 0
74
74
-74
0 81
81
-8
1 0
90
90
-90
0
Je
t fi
re
Fir
e zo
ne
39
14
1 20
39
14
1
20
35
14
1 17
39
14
1
20
39
14
1 20
20.9
kW
/m
2 42
18
1
21
42
18
1 21
38
18
0
19
43
19
1 22
48
19
1
24
14.4
kW
/m
2 45
21
1
23
45
21
1 23
41
21
-1
20
46
23
0
23
51
23
1 26
7.3
kW
/m
2 53
31
-3
25
53
31
-3
25
50
31
-4
23
53
21
-1
26
58
32
0
29
3 F
lash
fir
e L
FL
19
1
0 13
20
1
0 14
16
1
0 10
21
1
0 16
23
1
0 18
Fil
lin
g l
ine
to s
tora
ge
ves
sel
Fu
ll b
ore
Ru
ptu
re
VC
E
5 p
si
6 6
-6
0 6
6 -6
0
4 4
-4
0 6
6 -6
0
7 7
-7
0
3 p
si
12
12
-12
0 13
13
-1
3 0
9 9
-9
0 13
13
-1
3 0
14
14
-14
0
2 p
si
18
18
-18
0 19
19
-1
9 0
14
14
-14
0 20
20
-2
0 0
22
22
-22
0
Je
t fi
re
Fir
e zo
ne
25
8 1
13
25
8 1
13
22
9 1
11
25
8 1
13
29
8 3
16
20.9
kW
/m
2 27
11
0
14
27
11
0 14
25
11
1
13
27
11
1 13
31
11
1
16
14.4
kW
/m
2 29
14
-1
14
29
14
-1
14
27
14
-1
13
29
14
0
14
33
14
1 17
7.3
kW
/m
2 34
19
-2
17
34
19
-2
17
31
19
-3
14
34
19
0
17
37
20
-1
18
Lea
k
Fla
sh f
ire
LF
L
12
1 0
8 14
1
0 9
10
1 0
7 14
1
0 9
17
1 0
13
V
CE
5
psi
4
4 -4
0
4 4
-4
0 3
3 -3
0
4 4
-4
0 4
4 -4
0

ER
M-H
ON
G K
ON
G L
TD
W
EE
K 3
0 -
JU
LY
20
10
A7
B-4
9
Wea
ther
Co
nd
itio
ns
3B
3D
7D
3E
1.4F
Sec
tio
n
No
.
Des
crip
tio
n
Lea
k S
ize
Ou
tco
me
Cri
teri
a
d
c s
m
d
c s
m
d
c s
m
d
c s
m
d
c s
m
3 p
si
8 8
-8
0 8
8 -8
0
7 7
-7
0 8
8 -8
0
8 8
-8
0
2 p
si
12
12
-12
0 12
12
-1
2 0
11
11
-11
0 13
13
-1
3 0
13
13
-13
0
Je
t fi
re
Fir
e zo
ne
20
6 2
11
20
6 2
11
17
7 1
9 20
6
2 11
23
6
3 12
20.9
kW
/m
2 22
9
2 12
22
9
2 12
19
9
-1
9 22
9
2 12
24
9
2 12
14.4
kW
/m
2 23
11
1
12
23
11
1 12
21
11
-1
10
23
11
1
12
26
11
2 14
7.3
kW
/m
2 27
14
1
14
27
14
1 14
25
15
-1
12
27
14
1
14
29
15
-1
14
4 F
lash
fir
e L
FL
38
2
8 27
41
2
8 30
31
1
8 20
43
2
8 33
48
4
8 30
Lin
e fr
om
sto
rag
e v
esse
l to
vap
ori
zers
F
ull
bo
re R
up
ture
VC
E
5 p
si
21
21
-21
0 21
21
-2
1 0
18
18
-18
0 22
22
-2
2 0
24
24
-24
0
3 p
si
33
33
-33
0 34
34
-3
4 0
29
29
-29
0 36
36
-3
6 0
39
39
-39
0
2 p
si
47
47
-47
0 48
48
-4
8 0
41
41
-41
0 51
51
-5
1 0
55
55
-55
0
Je
t fi
re
Fir
e zo
ne
38
13
1 19
38
13
1
19
33
14
0 16
38
13
1
19
43
12
1 22
20.9
kW
/m
2 42
18
1
21
42
18
1 21
38
18
0
19
42
18
1 21
46
18
1
23
14.4
kW
/m
2 45
22
1
23
45
22
1 23
41
21
-1
20
45
22
1
23
49
22
1 25
7.3
kW
/m
2 52
30
-2
25
52
30
-2
25
48
30
-4
22
52
30
-2
25
56
30
0
28
Lea
k
Fla
sh f
ire
LF
L
12
1 0
8 14
1
0 9
10
1 0
7 14
1
0 9
17
1 0
13
V
CE
5
psi
7
7 -7
0
7 7
-7
0 7
7 -7
0
8 8
-8
0 8
8 -8
0
3 p
si
12
12
-12
0 12
12
-1
2 0
11
11
-11
0 12
12
-1
2 0
13
13
-13
0
2 p
si
17
17
-17
0 17
17
-1
7 0
15
15
-15
0 18
18
-1
8 0
18
18
-18
0
Je
t fi
re
Fir
e zo
ne
20
6 2
11
20
6 2
11
17
7 1
9 20
6
2 11
23
6
3 12
20.9
kW
/m
2 22
9
2 12
22
9
2 12
19
9
-1
9 22
9
2 12
24
9
2 12
14.4
kW
/m
2 23
11
1
12
23
11
1 12
21
11
-1
10
23
11
1
12
26
11
2 14
7.3
kW
/m
2 27
14
1
14
27
14
1 14
25
15
-1
12
27
14
1
14
29
15
-1
14
5 V
apo
rise
rs
Fla
sh f
ire
LF
L
5 1
0 3
5 1
0 3
4 1
0 2
5 1
0 3
6 1
0 4
Fu
ll b
ore
Ru
ptu
re
VC
E
5 p
si
0 0
0 0
0 0
0 0
0 0
0 0
0 0
0 0
0 0
0 0
3 p
si
0 0
0 0
0 0
0 0
0 0
0 0
0 0
0 0
0 0
0 0
2 p
si
0 0
0 0
0 0
0 0
0 0
0 0
0 0
0 0
0 0
0 0
Je
t fi
re
Fir
e zo
ne
10
1 0
9 10
1
0 9
10
1 0
9 10
1
0 9
10
1 0
9
20.9
kW
/m
2 0
0 0
0 0
0 0
0 0
0 0
0 0
0 0
0 0
0 0
0
14.4
kW
/m
2 0
0 0
0 0
0 0
0 0
0 0
0 0
0 0
0 0
0 0
0
7.3
kW
/m
2 0
0 0
0 0
0 0
0 0
0 0
0 0
0 0
0 0
0 0
0
6 F
lex
ible
ho
se
Fu
ll b
ore
Ru
ptu
re
Fla
sh f
ire
LF
L
19
1 0
13
20
1 0
14
16
1 0
10
21
1 0
16
23
1 0
18
ER
M-H
ON
G K
ON
G L
TD
W
EE
K 3
0 -
JU
LY
20
10
A7
B-5
0
Wea
ther
Co
nd
itio
ns
3B
3D
7D
3E
1.4F
Sec
tio
n
No
.
Des
crip
tio
n
Lea
k S
ize
Ou
tco
me
Cri
teri
a
d
c s
m
d
c s
m
d
c s
m
d
c s
m
d
c s
m
VC
E
5 p
si
6 6
-6
0 6
6 -6
0
4 4
-4
0 6
6 -6
0
7 7
-7
0
3 p
si
12
12
-12
0 13
13
-1
3 0
9 9
-9
0 13
13
-1
3 0
14
14
-14
0
2 p
si
18
18
-18
0 19
19
-1
9 0
14
14
-14
0 20
20
-2
0 0
22
22
-22
0
Je
t fi
re
Fir
e zo
ne
25
8 1
13
25
8 1
13
22
9 1
11
25
8 1
13
29
8 3
13
20.9
kW
/m
2 27
11
0
14
27
11
0 14
25
11
1
13
27
11
1 13
31
11
1
16
14.4
kW
/m
2 29
14
-1
14
29
14
-1
14
27
14
-1
13
29
14
0
14
33
14
1 17
7.3
kW
/m
2 34
19
-2
17
34
19
-2
17
31
19
-3
14
34
19
0
17
37
20
-1
18
Lea
k
Fla
sh f
ire
LF
L
12
1 0
8 14
1
0 9
10
1 0
7 14
1
0 9
17
1 0
13
V
CE
5
psi
4
4 -4
0
4 4
-4
0 3
3 -3
0
4 4
-4
0 4
4 -4
0
3 p
si
8 8
-8
0 8
8 -8
0
7 7
-7
0 8
8 -8
0
8 8
-8
0
2 p
si
12
12
-12
0 12
12
-1
2 0
11
11
-11
0 13
13
-1
3 0
13
13
-13
0
Je
t fi
re
Fir
e zo
ne
20
6 2
11
20
6 2
11
17
7 1
9 20
6
2 11
23
6
3 12
20.9
kW
/m
2 22
9
2 12
22
9
2 12
19
9
-1
9 22
9
2 12
24
9
2 12
14.4
kW
/m
2 23
11
1
12
23
11
1 12
21
11
-1
10
23
11
1
12
26
11
2 14
7.3
kW
/m
2 27
14
1
14
27
14
1 14
25
15
-1
12
27
14
1
14
29
15
-1
14
7 F
lash
fir
e L
FL
14
1
0 10
16
1
0 11
11
1
0 6
17
1 0
12
23
2 0
16
Fu
ll b
ore
Ru
ptu
re
VC
E
5 p
si
5 5
-5
0 7
7 -7
0
4 4
-4
0 8
8 -8
0
12
12
-12
0
Sen
d-o
ut
pip
ing
d
ow
nst
ream
of
vap
ori
zers
3
psi
11
11
-1
1 0
14
14
-14
0 9
9 -9
0
16
16
-16
0 25
25
-2
5 0
2 p
si
17
17
-17
0 22
22
-2
2 0
13
13
-13
0 24
24
-2
4 0
38
38
-38
0
Je
t fi
re
Fir
e zo
ne
24
1 0
23
24
1 0
23
24
1 0
23
24
1 0
23
24
1 0
23
20.9
kW
/m
2 0
0 0
0 0
0 0
0 0
0 0
0 0
0 0
0 0
0 0
0
14.4
kW
/m
2 24
2
2 13
24
2
2 13
24
2
2 13
24
2
2 13
19
2
1 10
7.3
kW
/m
2 25
4
1 13
25
4
1 13
25
4
1 13
25
4
1 13
20
5
0 10
Lea
k
Fla
sh f
ire
LF
L
2 1
0 1
2 1
0 1
2 1
0 1
2 1
0 1
3 1
0 2
V
CE
5
psi
0
0 0
0 0
0 0
0 0
0 0
0 0
0 0
0 0
0 0
0
3 p
si
0 0
0 0
0 0
0 0
0 0
0 0
0 0
0 0
0 0
0 0
2 p
si
0 0
0 0
0 0
0 0
0 0
0 0
0 0
0 0
0 0
0 0
Je
t fi
re
Fir
e zo
ne
5 1
0 4
5 1
0 4
5 1
0 4
5 1
0 4
5 1
0 4
20.9
kW
/m
2 0
0 0
0 0
0 0
0 0
0 0
0 0
0 0
0 0
0 0
0
14.4
kW
/m
2 0
0 0
0 0
0 0
0 0
0 0
0 0
0 0
0 0
0 0
0
7.3
kW
/m
2 0
0 0
0 0
0 0
0 0
0 0
0 0
0 0
0 0
0 0
0
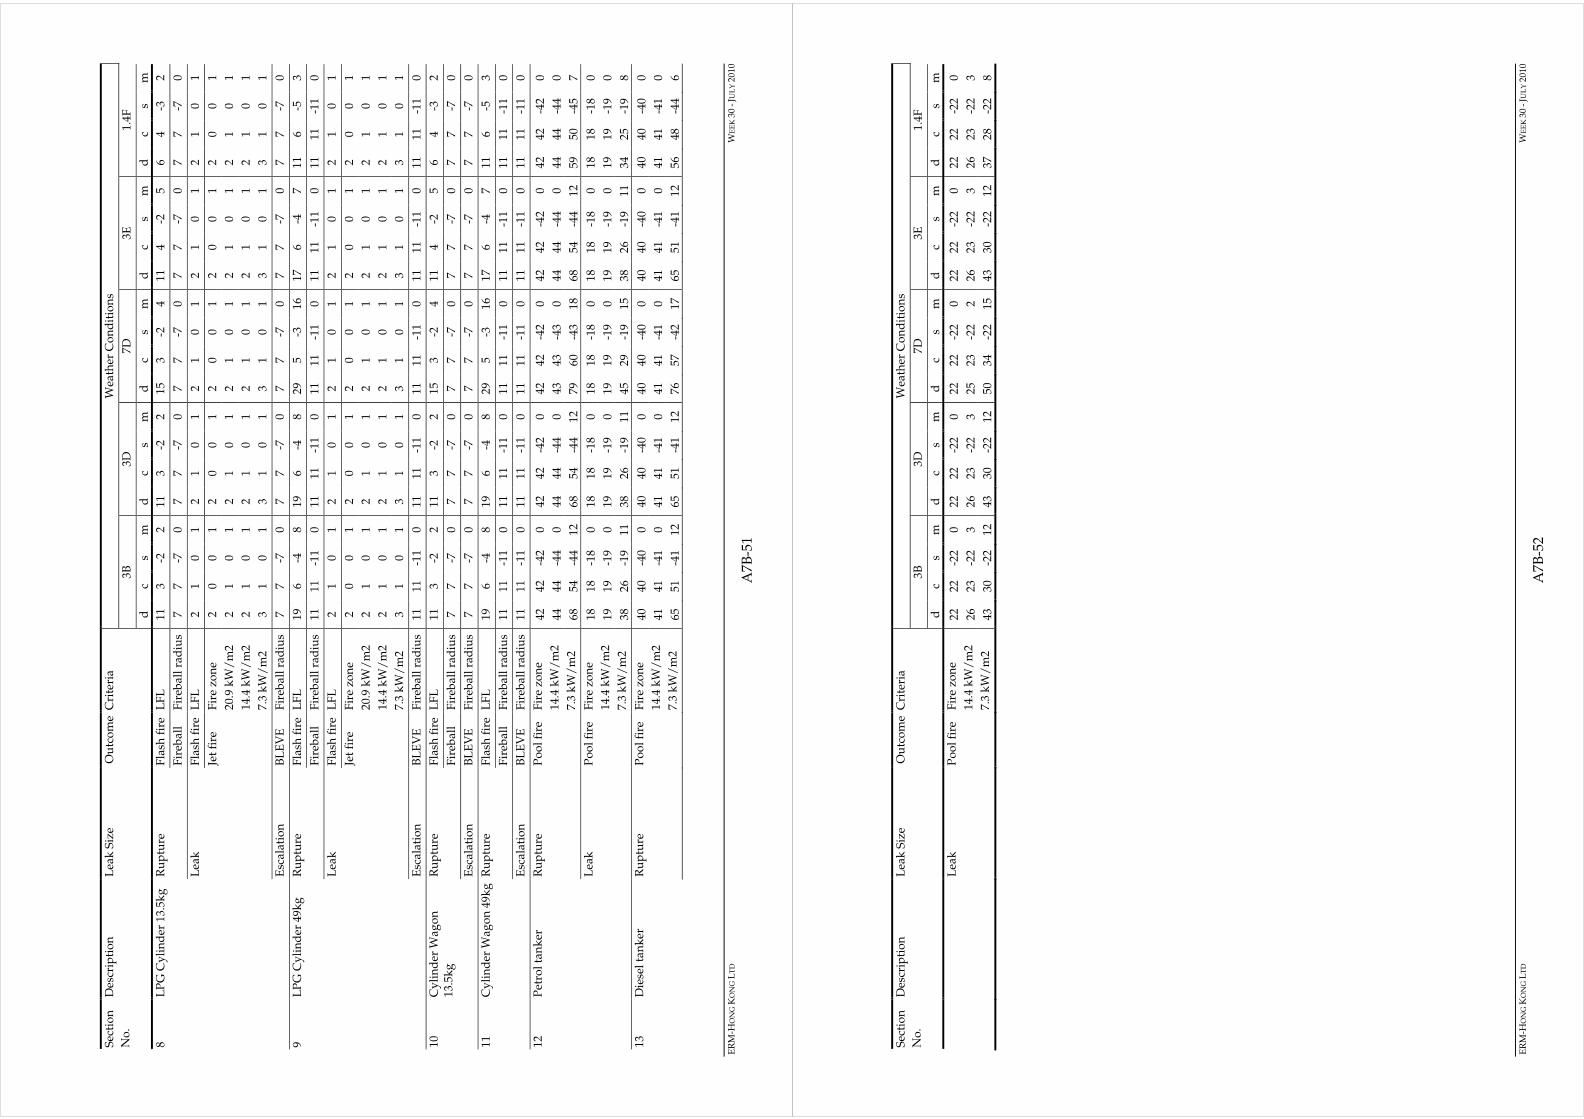
ER
M-H
ON
G K
ON
G L
TD
W
EE
K 3
0 -
JU
LY
20
10
A7
B-5
1
Wea
ther
Co
nd
itio
ns
3B
3D
7D
3E
1.4F
Sec
tio
n
No
.
Des
crip
tio
n
Lea
k S
ize
Ou
tco
me
Cri
teri
a
d
c s
m
d
c s
m
d
c s
m
d
c s
m
d
c s
m
8 L
PG
Cy
lin
der
13.
5kg
R
up
ture
F
lash
fir
e L
FL
11
3
-2
2 11
3
-2
2 15
3
-2
4 11
4
-2
5 6
4 -3
2
F
ireb
all
Fir
ebal
l ra
diu
s 7
7 -7
0
7 7
-7
0 7
7 -7
0
7 7
-7
0 7
7 -7
0
Lea
k
Fla
sh f
ire
LF
L
2 1
0 1
2 1
0 1
2 1
0 1
2 1
0 1
2 1
0 1
Je
t fi
re
Fir
e zo
ne
2 0
0 1
2 0
0 1
2 0
0 1
2 0
0 1
2 0
0 1
20.9
kW
/m
2 2
1 0
1 2
1 0
1 2
1 0
1 2
1 0
1 2
1 0
1
14.4
kW
/m
2 2
1 0
1 2
1 0
1 2
1 0
1 2
1 0
1 2
1 0
1
7.3
kW
/m
2 3
1 0
1 3
1 0
1 3
1 0
1 3
1 0
1 3
1 0
1
Esc
alat
ion
B
LE
VE
F
ireb
all
rad
ius
7 7
-7
0 7
7 -7
0
7 7
-7
0 7
7 -7
0
7 7
-7
0
9 L
PG
Cy
lin
der
49k
g
Ru
ptu
re
Fla
sh f
ire
LF
L
19
6 -4
8
19
6 -4
8
29
5 -3
16
17
6
-4
7 11
6
-5
3
F
ireb
all
Fir
ebal
l ra
diu
s 11
11
-1
1 0
11
11
-11
0 11
11
-1
1 0
11
11
-11
0 11
11
-1
1 0
Lea
k
Fla
sh f
ire
LF
L
2 1
0 1
2 1
0 1
2 1
0 1
2 1
0 1
2 1
0 1
Je
t fi
re
Fir
e zo
ne
2 0
0 1
2 0
0 1
2 0
0 1
2 0
0 1
2 0
0 1
20.9
kW
/m
2 2
1 0
1 2
1 0
1 2
1 0
1 2
1 0
1 2
1 0
1
14.4
kW
/m
2 2
1 0
1 2
1 0
1 2
1 0
1 2
1 0
1 2
1 0
1
7.3
kW
/m
2 3
1 0
1 3
1 0
1 3
1 0
1 3
1 0
1 3
1 0
1
Esc
alat
ion
B
LE
VE
F
ireb
all
rad
ius
11
11
-11
0 11
11
-1
1 0
11
11
-11
0 11
11
-1
1 0
11
11
-11
0
10
Ru
ptu
re
Fla
sh f
ire
LF
L
11
3 -2
2
11
3 -2
2
15
3 -2
4
11
4 -2
5
6 4
-3
2
Cy
lin
der
Wag
on
13
.5k
g
F
ireb
all
Fir
ebal
l ra
diu
s 7
7 -7
0
7 7
-7
0 7
7 -7
0
7 7
-7
0 7
7 -7
0
Esc
alat
ion
B
LE
VE
F
ireb
all
rad
ius
7 7
-7
0 7
7 -7
0
7 7
-7
0 7
7 -7
0
7 7
-7
0
11
Cy
lin
der
Wag
on
49k
g
Ru
ptu
re
Fla
sh f
ire
LF
L
19
6 -4
8
19
6 -4
8
29
5 -3
16
17
6
-4
7 11
6
-5
3
F
ireb
all
F
ireb
all
rad
ius
11
11
-11
0 11
11
-1
1 0
11
11
-11
0 11
11
-1
1 0
11
11
-11
0
Esc
alat
ion
B
LE
VE
F
ireb
all
rad
ius
11
11
-11
0 11
11
-1
1 0
11
11
-11
0 11
11
-1
1 0
11
11
-11
0
12
Pet
rol
tan
ker
R
up
ture
P
oo
l fi
re
Fir
e zo
ne
42
42
-42
0 42
42
-4
2 0
42
42
-42
0 42
42
-4
2 0
42
42
-42
0
14
.4 k
W/
m2
44
44
-44
0 44
44
-4
4 0
43
43
-43
0 44
44
-4
4 0
44
44
-44
0
7.
3 k
W/
m2
68
54
-44
12
68
54
-44
12
79
60
-43
18
68
54
-44
12
59
50
-45
7
Lea
k
Po
ol
fire
F
ire
zon
e 18
18
-1
8 0
18
18
-18
0 18
18
-1
8 0
18
18
-18
0 18
18
-1
8 0
14.4
kW
/m
2 19
19
-1
9 0
19
19
-19
0 19
19
-1
9 0
19
19
-19
0 19
19
-1
9 0
7.3
kW
/m
2 38
26
-1
9 11
38
26
-1
9 11
45
29
-1
9 15
38
26
-1
9 11
34
25
-1
9 8
13
Die
sel
tan
ker
R
up
ture
P
oo
l fi
re
Fir
e zo
ne
40
40
-40
0 40
40
-4
0 0
40
40
-40
0 40
40
-4
0 0
40
40
-40
0
14
.4 k
W/
m2
41
41
-41
0 41
41
-4
1 0
41
41
-41
0 41
41
-4
1 0
41
41
-41
0
7.
3 k
W/
m2
65
51
-41
12
65
51
-41
12
76
57
-42
17
65
51
-41
12
56
48
-44
6
ER
M-H
ON
G K
ON
G L
TD
W
EE
K 3
0 -
JU
LY
20
10
A7
B-5
2
Wea
ther
Co
nd
itio
ns
3B
3D
7D
3E
1.4F
Sec
tio
n
No
.
Des
crip
tio
n
Lea
k S
ize
Ou
tco
me
Cri
teri
a
d
c s
m
d
c s
m
d
c s
m
d
c s
m
d
c s
m
Lea
k
Po
ol
fire
F
ire
zon
e 22
22
-2
2 0
22
22
-22
0 22
22
-2
2 0
22
22
-22
0 22
22
-2
2 0
14.4
kW
/m
2 26
23
-2
2 3
26
23
-22
3 25
23
-2
2 2
26
23
-22
3 26
23
-2
2 3
7.3
kW
/m
2 43
30
-2
2 12
43
30
-2
2 12
50
34
-2
2 15
43
30
-2
2 12
37
28
-2
2 8

ERM-HONG KONG LTD WEEK 30 - JULY 2010
A7B-53
6 RISK RESULTS
6.1 RISK SUMMATION
Risk summation combines the estimates of the consequences of an event with
the event frequencies to give an estimate of the resulting risk of fatalities. The
Consultants in-house software RISKPLOTTM has been used for risk
summation. The inputs to the software comprise a number of files:
• Release cases file detailing all identified hazardous events and their
frequencies;
• Release location file containing the locations of hazardous events either at
given points or along given routes;
• Consequences file/effect zone dimensions, which inputs the calculated
consequences of each event under each possible weather condition, as
appropriate;
• Weather frequencies file that details the local meteorological data according
to a matrix of weather class (speed/stability combinations) and wind
directions;
• Population data file. The population data are divided into geographical
areas of polygonal shape dependent on the population density within that
area. Point and line populations may also be defined.
RISKPLOTTM takes into account all of the above information and models each
event under each combination of conditions (weather, location, etc.). It
calculates the number of fatalities from each event with a given probability of
occurrence. The number of fatalities is based upon the proportion of each
population area overlapped by the hazard effect.
The two types of risk measures considered are societal risk and individual
risk.
6.2 SOCIETAL RISK
Societal risk is defined as the risk to a group of people due to all hazards
arising from a hazardous installation or activity. The simplest measure of
societal risk is the Rate of Death or Potential Loss of Life (PLL), which is
equivalent to the predicted number of fatalities per year.
The frequency (f) and fatalities (N) associated with each outcome event are
derived as described in earlier sections. The Potential Loss of Life is then
calculated as follows:
PLL = f1N1 + f2N2 + f3N3 +…+ fnNn
The PLL results are presented in Table 6.1 for the existing, construction and
ERM-HONG KONG LTD WEEK 30 - JULY 2010
A7B-54
future phases. The highest risks are associated with the construction phase
due to the additional worker population. The PLL for this year amounts to
3.39×10⁻⁵ per year, or equivalently, one fatality every 30,000 years.
The future 2031 case is marginally higher than the existing risks, in line with
the general growth in residential population assumed in the analysis. This
increase is not due to MTRC operations however, since all station population
will be below ground and unaffected by any incidents at the LPG Depot.
Table 6.1 Potential Loss of Life
Project Phase PLL (per year)
LPG compound LPG transit Overall
Existing risk (2009) 5.96×10⁻⁶ 1.25×10⁻⁵ 1.84×10⁻⁵
Construction phase (2014) 1.99×10⁻⁵ 1.41×10⁻⁵ 3.39×10⁻⁵
Future operational phase (2031) 6.38×10⁻⁶ 1.55×10⁻⁵ 2.19×10⁻⁵
A breakdown of PLL by population group for the construction year 2014 is
shown in Table 6.2. It can be seen that a major component of the societal risks
arise from the Preliminary Treatment Works construction workers. This is due
to the close proximity of these workers with the LPG Compound. The
additional population injected from MTR workers contribute only 1% to the
societal risks since they are located further from the LPG Depot. This is a
negligible increase in risks.
Table 6.2 PLL Breakdown by Population Group for Construction Phase
Population Group PLL % of Total
MTR construction workers 1.88×10⁻⁷ 1 %
PTW construction workers 1.46×10⁻⁵ 43 %
Other population 1.92×10⁻⁵ 56 %
Total 3.39×10⁻⁵ 100 %
Societal risk can also be expressed in the form of an F-N curve, which
represents the cumulative frequency (F) of all event outcomes leading to N or
more fatalities. This representation of societal risk highlights the potential for
accidents involving large numbers of fatalities.
FN curves for the LPG Depot are shown in Figure 6.1. The risks for the current
year, construction phase and future operational phase all lie in the acceptable
region. It may be noted that the curves are in good agreement with the
previous HATS study (ENSR, 2008). Although the current analysis made some
refinements to the methodology, the approach is essentially very similar to
that adopted by ENSR (2008). The main difference is in the indoor harm
probabilities and the inclusion of projectile effects from the LPG Transit
Depot. A test was conducted using the same indoor harm probabilities as
those used in the previous HATS study. This increased the risks marginally
and further improved the agreement between the two studies, but the
differences are not significant.
Comparing the existing risks (2009) with the future operational phase (2031), it
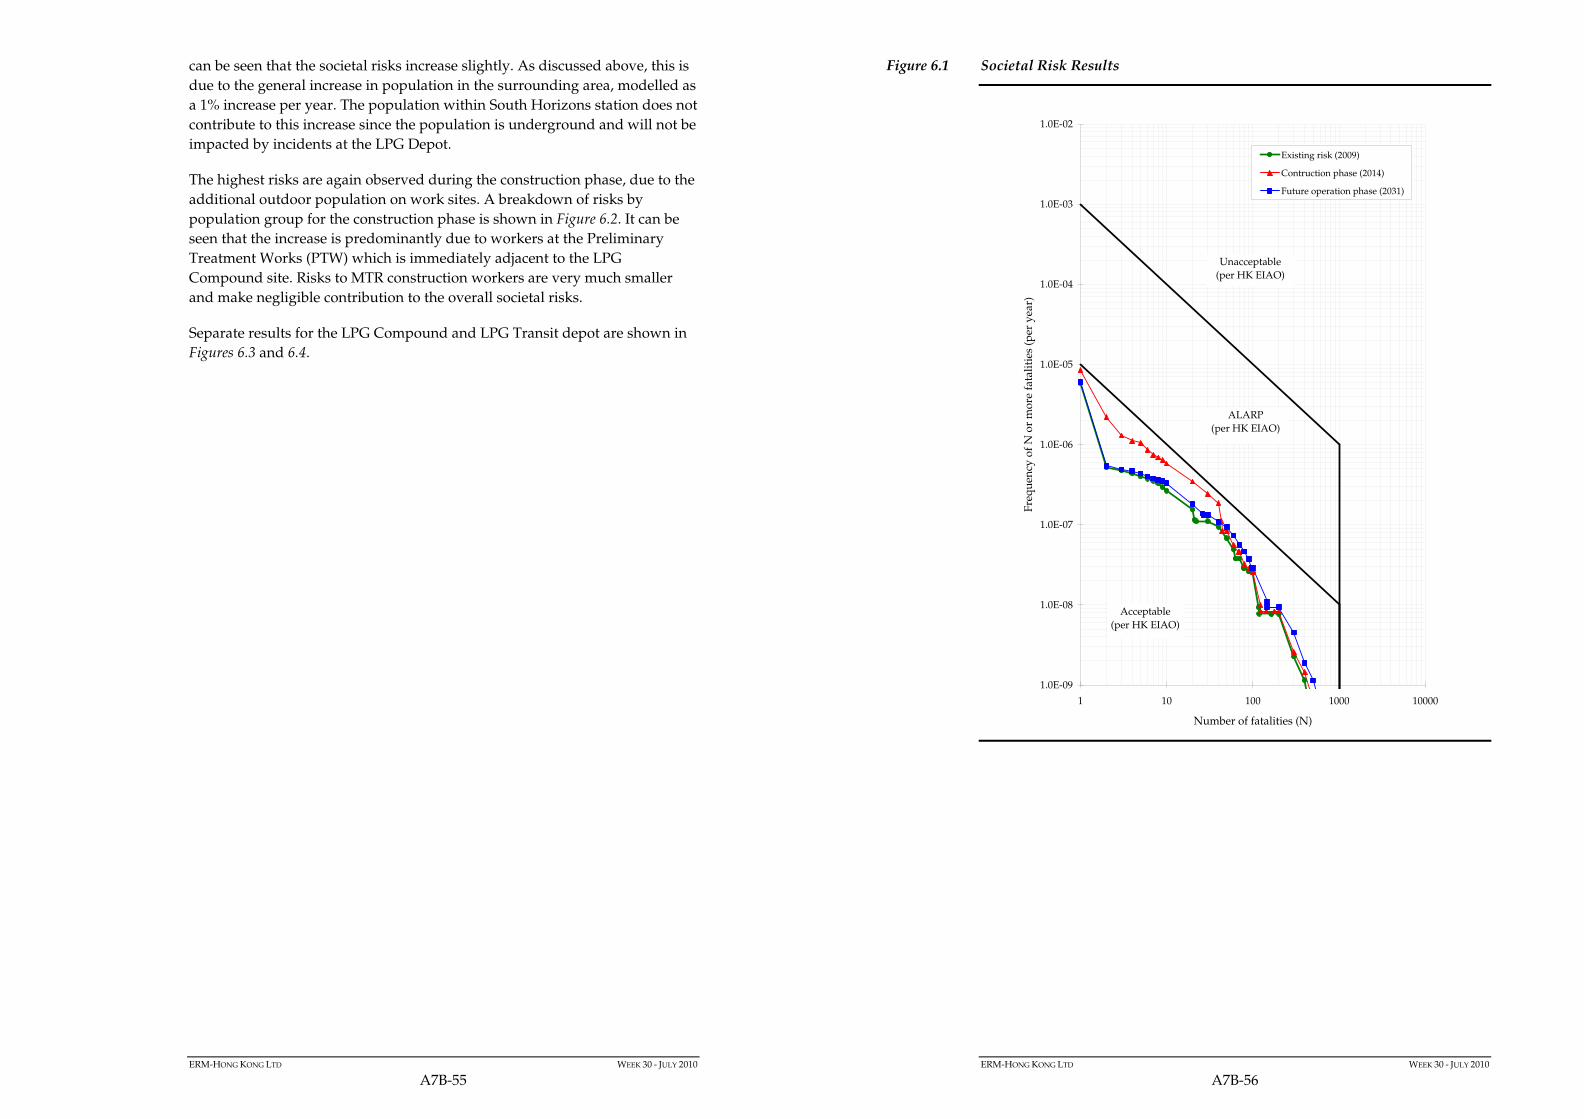
ERM-HONG KONG LTD WEEK 30 - JULY 2010
A7B-55
can be seen that the societal risks increase slightly. As discussed above, this is
due to the general increase in population in the surrounding area, modelled as
a 1% increase per year. The population within South Horizons station does not
contribute to this increase since the population is underground and will not be
impacted by incidents at the LPG Depot.
The highest risks are again observed during the construction phase, due to the
additional outdoor population on work sites. A breakdown of risks by
population group for the construction phase is shown in Figure 6.2. It can be
seen that the increase is predominantly due to workers at the Preliminary
Treatment Works (PTW) which is immediately adjacent to the LPG
Compound site. Risks to MTR construction workers are very much smaller
and make negligible contribution to the overall societal risks.
Separate results for the LPG Compound and LPG Transit depot are shown in
Figures 6.3 and 6.4.
ERM-HONG KONG LTD WEEK 30 - JULY 2010
A7B-56
Figure 6.1 Societal Risk Results
1.0E-09
1.0E-08
1.0E-07
1.0E-06
1.0E-05
1.0E-04
1.0E-03
1.0E-02
1 10 100 1000 10000
Number of fatalities (N)
Fre
qu
ency
of
N o
r m
ore
fat
alit
ies
(per
yea
r)
Existing risk (2009)
Contruction phase (2014)
Future operation phase (2031)
Unacceptable
(per HK EIAO)
Acceptable
(per HK EIAO)
ALARP
(per HK EIAO)
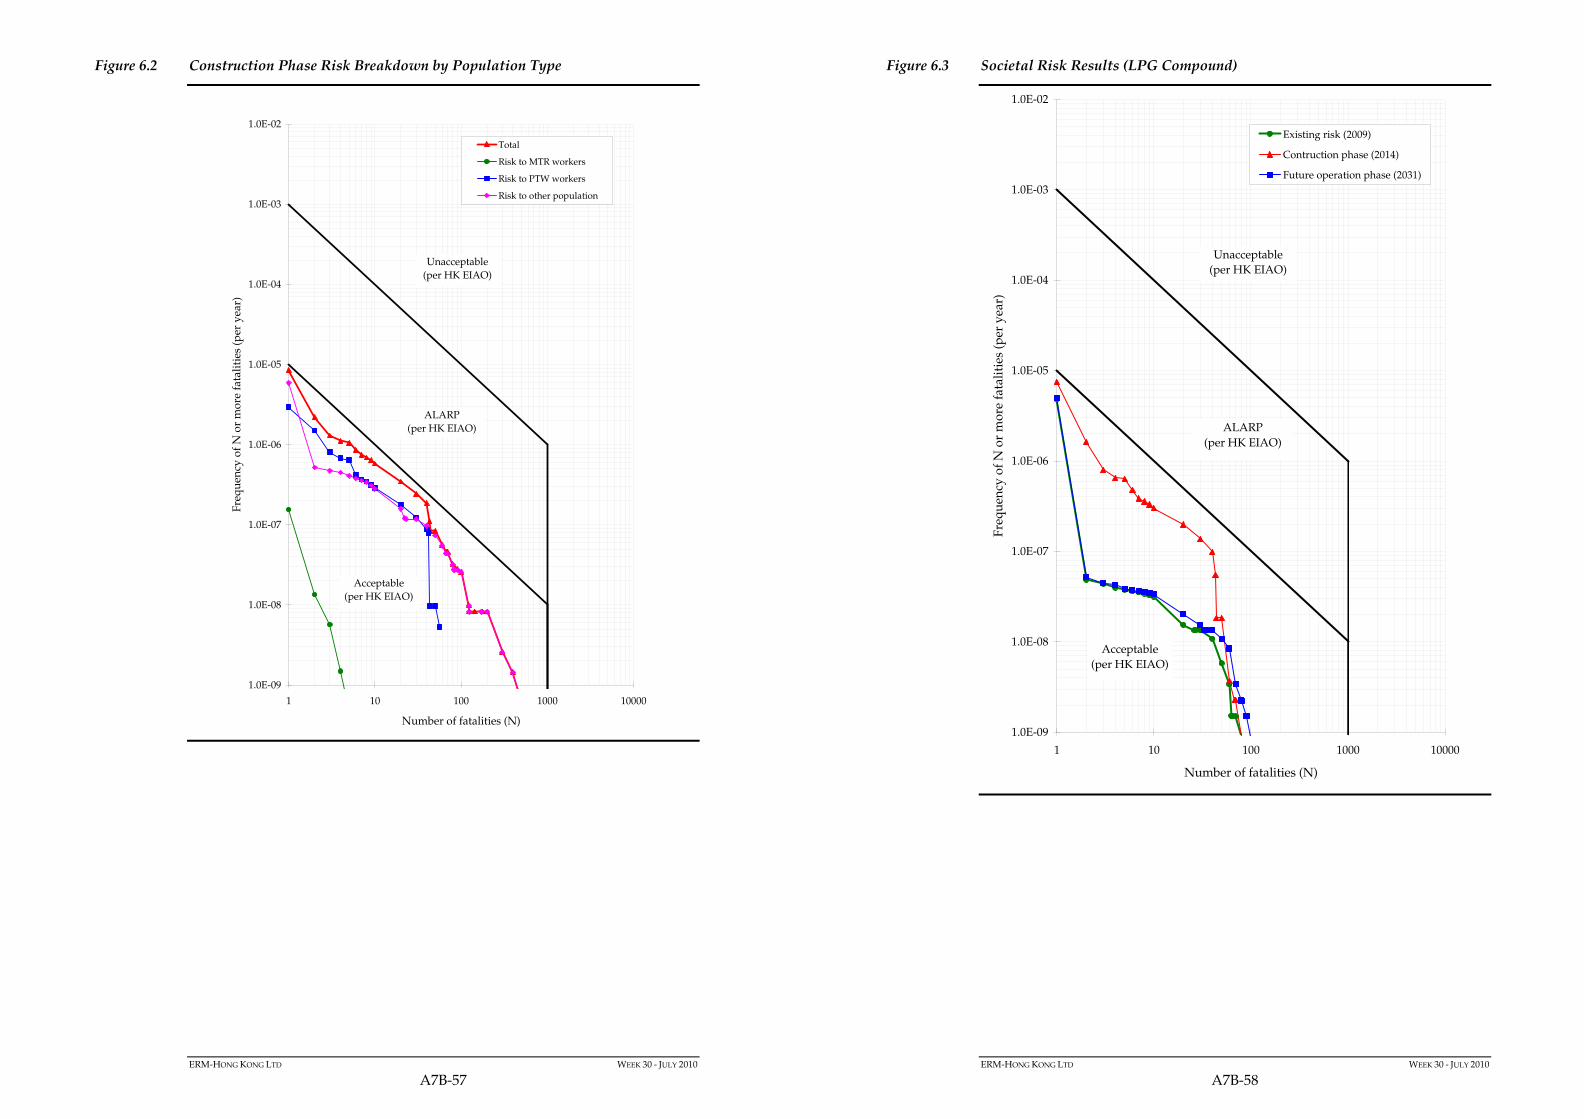
ERM-HONG KONG LTD WEEK 30 - JULY 2010
A7B-57
Figure 6.2 Construction Phase Risk Breakdown by Population Type
1.0E-09
1.0E-08
1.0E-07
1.0E-06
1.0E-05
1.0E-04
1.0E-03
1.0E-02
1 10 100 1000 10000
Number of fatalities (N)
Fre
qu
ency
of
N o
r m
ore
fat
alit
ies
(per
yea
r)
Total
Risk to MTR workers
Risk to PTW workers
Risk to other population
Unacceptable
(per HK EIAO)
Acceptable
(per HK EIAO)
ALARP
(per HK EIAO)
ERM-HONG KONG LTD WEEK 30 - JULY 2010
A7B-58
Figure 6.3 Societal Risk Results (LPG Compound)
1.0E-09
1.0E-08
1.0E-07
1.0E-06
1.0E-05
1.0E-04
1.0E-03
1.0E-02
1 10 100 1000 10000
Number of fatalities (N)
Fre
qu
ency
of
N o
r m
ore
fat
alit
ies
(per
yea
r)
Existing risk (2009)
Contruction phase (2014)
Future operation phase (2031)
Unacceptable
(per HK EIAO)
Acceptable
(per HK EIAO)
ALARP
(per HK EIAO)
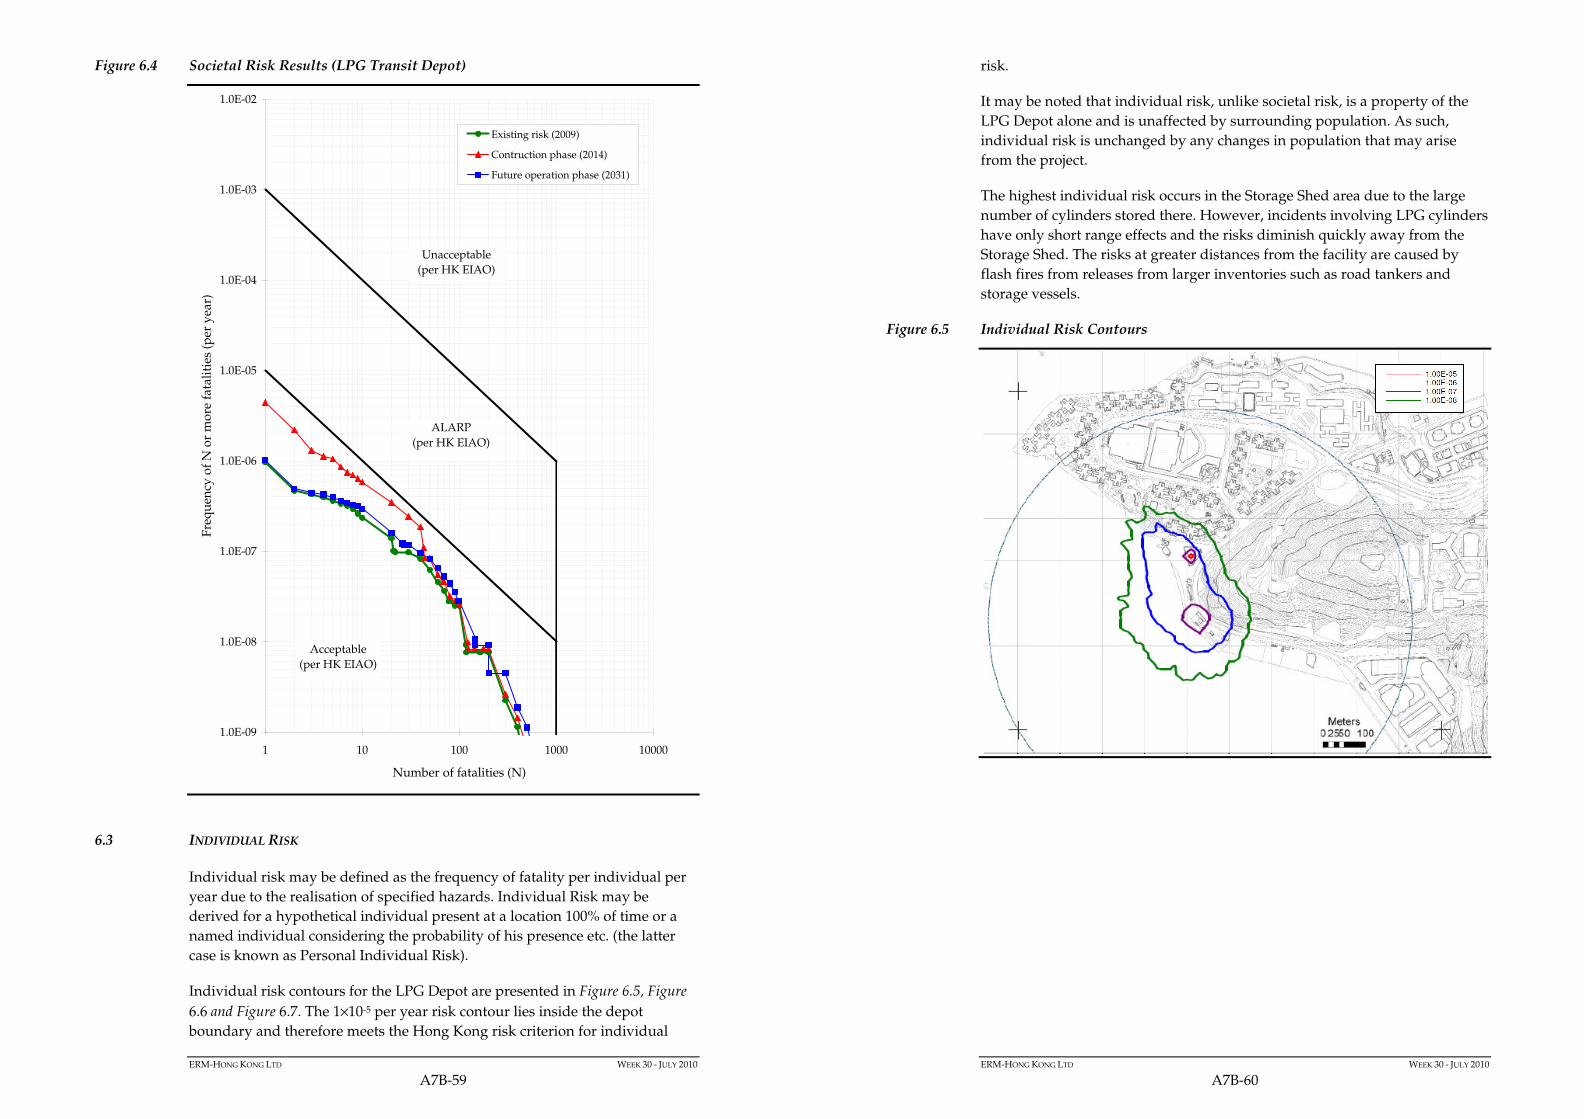
ERM-HONG KONG LTD WEEK 30 - JULY 2010
A7B-59
Figure 6.4 Societal Risk Results (LPG Transit Depot)
6.3 INDIVIDUAL RISK
Individual risk may be defined as the frequency of fatality per individual per
year due to the realisation of specified hazards. Individual Risk may be
derived for a hypothetical individual present at a location 100% of time or a
named individual considering the probability of his presence etc. (the latter
case is known as Personal Individual Risk).
Individual risk contours for the LPG Depot are presented in Figure 6.5, Figure
6.6 and Figure 6.7. The 1×10⁻⁵ per year risk contour lies inside the depot
boundary and therefore meets the Hong Kong risk criterion for individual
1.0E-09
1.0E-08
1.0E-07
1.0E-06
1.0E-05
1.0E-04
1.0E-03
1.0E-02
1 10 100 1000 10000
Number of fatalities (N)
Fre
qu
ency
of
N o
r m
ore
fat
alit
ies
(per
yea
r)
Existing risk (2009)
Contruction phase (2014)
Future operation phase (2031)
Unacceptable
(per HK EIAO)
Acceptable
(per HK EIAO)
ALARP
(per HK EIAO)
ERM-HONG KONG LTD WEEK 30 - JULY 2010
A7B-60
risk.
It may be noted that individual risk, unlike societal risk, is a property of the
LPG Depot alone and is unaffected by surrounding population. As such,
individual risk is unchanged by any changes in population that may arise
from the project.
The highest individual risk occurs in the Storage Shed area due to the large
number of cylinders stored there. However, incidents involving LPG cylinders
have only short range effects and the risks diminish quickly away from the
Storage Shed. The risks at greater distances from the facility are caused by
flash fires from releases from larger inventories such as road tankers and
storage vessels.
Figure 6.5 Individual Risk Contours

ERM-HONG KONG LTD WEEK 30 - JULY 2010
A7B-61
Figure 6.6 Individual Risk Contours (LPG Compound)
ERM-HONG KONG LTD WEEK 30 - JULY 2010
A7B-62
Figure 6.7 Individual Risk Contours (LPG Transit Depot)
ERM-HONG KONG LTD WEEK 30 - JULY 2010
A7B-63
6.4 THE LPG DEPOT AND EXPLOSIVES DELIVERIES VIA LEE NAM ROAD
Explosives deliveries from the Chung Hom Shan Magazine to the Ap Lei
Chau delivery point will use Lee Nam Road, a section of which adjoins the
LPG Depot. In the event of an explosives vehicle detonation within this road
section, there could be an impact on the LPG containing equipment inside the
depot. Conversely an explosion in the LPG facility could impact on the
explosives vehicle. This section presents an assessment of the risk that the
explosives vehicle poses to or suffers from the LPG Depot.
Since the entire LPG Depot is enclosed by a 2.4 m high solid boundary wall,
damage to the LPG facilities is considered only possible if the explosion
overpressure is sufficient to damage the wall and the fragments generated
strike the equipment inside.
Lees suggests an overpressure of 2.3 psi as the lower limit of serious structural
damage and an overpressure of 2 -3 psi could shatter concrete (not reinforced)
or cinder block walls (Lees, 1996). It is therefore deemed appropriate to
assume an overpressure of below 2 psi would not affect the equipment inside
the boundary wall. For comparison, an overpressures below 2 psi is expected
to result in only minor damage such as slight distortion of the steel frame of a
clad building (1.3 psi), shattering of windows (0.5 – 1 psi) and minor structural
damage (0.4 psi).
In the worst case the maximum quantity of explosives to be transported along
Lee Nam Road will be 207 kg TNT equivalent. Based on the TNT explosion
model from the Yellow Book, an overpressure of 2 psi could reach up to a
distance of 62 m from the source of explosion.
The two concerned road sections to be considered are a 10 m route along the
boundary of the LPG compound and a 40 m route along the cylinder shed. For
the LPG compound, the vulnerable length of the road can be calculated as 134
m (i.e. 10m + 62m + 62m). Based on the maximum foreseeable usage of Lee
Nam Road of 787 trips per year and the probability of initiation of explosives
during road transport (non-expressway) of 7.96 x 10⁻¹⁰ per km, the probability
of truck explosion impacting the LPG compound is 8.4 x 10⁻⁸ per year.
Similarly, the frequency of impacting the LPG shed can be calculated as 1.0 x
10-7 per year.
It should be noted that in the ALARP case a maximum 250 kg load (258kgTNT
equivalent) can be transported for a maximum of 670 trips, with a 2 psi
overpressure distance of 67m, giving corresponding impact frequencies of 7.7
x 10-8 and 9.3 x 10⁻⁸, which is less than in the worst case.
Even without considering that the tanks are mounded, the probability of the
equipment being struck, and then being struck with a high energy fragment
sufficient to rupture the steel vessels or piping, these explosion impact
frequencies are already about 3 to 4 orders of magnitude lower than the base
event frequencies assumed for the QRA (Table 4.1 and 4.2). For example, the
failure rate of LPG vessels is 1.24 x 10⁻⁵ per year and for LPG cylinders it is
ERM-HONG KONG LTD WEEK 30 - JULY 2010
A7B-64
7.92 x 10⁻³ per year. Therefore, the increased risk of a truck explosion
impacting the equipment inside the depot is considered negligible.
The scenario of a major fire or explosion within the LPG depot leading to an
initiation of explosives in the truck is also considered negligible from the risk
standpoint. The presence time of an explosives truck on the road along the
LPG Depot is estimated to be about 3.5 hours per year (assuming a driving
speed of 50km/hr for a 250m road), this equates to a presence factor of 3.98 x
10-4. Combining this presence factor with the event frequencies of a jet fire,
explosion or flash-fire of between 10-5 and 10-7 per year (Table 4.7), and
considering the directional probability of a jet fire impinging on the explosives
truck, the protection from the boundary wall, and that a flash-fire would not
ingress into the truck, would give frequency values of well below 10-9 per year.
It is therefore concluded that the explosives truck travelling alongside the LPG
Depot on Lee Nam Road poses negligible additional risk to the LPG Depot
and vice versa.
ERM-HONG KONG LTD WEEK 30 - JULY 2010
A7B-65
7 CONCLUSIONS
A QRA was conducted on Shell’s LPG Depot in Ap Lei Chau to assess the
increase in societal risk from the SIL(E) construction and operation. The
methodology adopted followed closely that of an earlier study conducted for
the same facility as part of the Harbour Area Treatment Scheme (HATS)
assessment. Refinements to the methodology were applied in a few respects,
but nevertheless, the results obtained are closely consistent with those
obtained from the previous study.
Results for the existing risks, construction phase and future operational phase
all lie in the acceptable region of the FN curves, although they lie close to the
ALARP region. Societal risks are highest during the construction phase which
overlaps with construction for the Preliminary Treatment Works. The
additional population from these groups of workers increases the societal
risks but risks remain in the acceptable region. This increase in risk is
predominantly due to workers at the Preliminary Treatment Works site which
is immediately adjacent to the LPG Depot. Additional risks from the MTR
construction workers are negligible and amount to about 1%.
The South Horizons station, once complete, is also expected to make
negligible contribution to societal risks since the station population will be
below ground and will be unaffected by possible incidents at the LPG Depot.
Assessment of large gas releases from road tanker or storage tank ruptures
suggest that it is not possible for flammable gas to ingress into the South
Horizons Station through vent ducts in significant quantities. Nevertheless, as
an additional precaution, it is recommended to provide gas detectors in the air
intakes which automatically close the HVAC dampers in case of gas detection.
The 10-5 per year individual risk contour remains on site and meets Hong
Kong Risk Guidelines criteria.
ERM-HONG KONG LTD WEEK 30 - JULY 2010
A7B-66
8 REFERENCES
Alvanon, 2008, Chinese Body Measurement Study, www.avanon.com
Baum M. R., 1988, Disruptive failure of pressure vessels – preliminary design
guidelines for fragment velocity and the extent of the hazard zone, J. Press.
Vess. Technol. – Trans ASME 1988:110:168-76.
Birk, A.M., 1996, Hazards from Propane BLEVEs: An update and Proposal for
Emergency Responders, Journal of Loss Prevention in Process Industries, Vol.
9, No. 2, pp.173-181.
CCPS, 1999, Guidelines for Evaluating the Characteristics of Vapor Cloud
Explosions, Flash Fires, and BLEVEs, Center for Chemical Process Safety.
Centamap, 2009, http://www.centamap.com
CIA, 1998, Guidance for the Location and Design of Occupied Buildings on
Chemical Manufacturing Sites, Chemical Industry Association,
CIA/CISHEC/9802/CP/500/2M.
ENSR, 2008, Harbour Area Treatment Scheme (HATS) – Stage 2A EIA Study –
Investigation, Agreement No. CE 43/2005.
ERM, 2003, Discovery Bay’s 4th LPG Compound: Quantitative Risk
Assessment.
ERM, 2006, Liquefied Natural Gas (LNG) Receiving Terminal and Associated
Facilities – EIA Study.
ERM, 2008, Introducing NG/LPG Buses and Heavy Duty Vehicles in Hong
Kong – Feasibility Study, Agreement No. CE 49/2006, Electrical & Mechanical
Services Department, Government of Hong Kong SAR.
ERM, 2009, Environmental Impact Assessment of Hong Kong Section of
Guangzhou-Shenzhen-Hong Kong Express Rail Link: Appendix 13 - Hazard
to Life Assessment.
Holden, P.; Reeves, A., (1985). Fragmentation Hazards from Failures of
Pressurized Liquefied Gas Vessels. Assessment and Control of Major Hazards.
IChemE Symposium Series # 93 IChemE, Rugby, UK. 205-220.
Crossthwaite, P. J., Fitzpatrick, R. D., and Hurst, N. W., Risk assessment for
the siting and developments near liquefied petroleum installations, IChemE
Symposium Series No. 110, 1988.
Lees, F. P., 1996, Loss Prevention in the Process Industries, Butterworth-
Heinemann.
Maunsell Environmental Management Consultants, 2006, QRA for Tung
Chung LPG and Petrol Filling Station.

ERM-HONG KONG LTD WEEK 30 - JULY 2010
A7B-67
N.W. Hurst, C. Nussey, R.P. Pape, 1989, Development and Application of a
Risk Assessment Tool (RISKAT) in the Health and Safety Executive, Chem.
Eng. Res. Des., Vol. 67.
Planning and Lands Bureau, 2000, PHI Register, Government of Hong Kong
S.A.R.
Shell, 2009, Personal Communication.
Stawczyk, J., 2003, Experimental Evaluation of LPG Tank Explosion Hazards,
Journal of Hazardous Materials B96, pp.189-200.


![QRA Technical Guidance - National Environment Agency · QRA Technical Guidance [Revision No: 1] [Date of Revision: 31st March 2016] Contents 1 QRA Study](https://cdn.vdocuments.net/doc/165x107/5ace3a7d7f8b9a1d328b8ec2/qra-technical-guidance-national-environment-technical-guidance-revision-no-1.jpg)


