
DIRECTORATE: AGRO-PROCESSING SUPPORT
agriculture,forestry & fisheries
Quarterly Economic Review of the Food
and Beverages Industry in South Africa
April – June 2016________________________________________________________________
Volume 3, Number 1

i
PREFACE
This publication Quarterly Economic Review of the food and beverage Industry in South
Africa: April to June 2016 is the first quarterly review by the Directorate: Agro-processing
Support to provide an overview of the economic performance of the food and beverage
industry in South Africa. The food and beverages industry in South Africa is one of the sub-
sectors of agro-processing that plays a dominant role in terms of output and employment in
the agro-processing sector. By adding value to the primary agriculture and fisheries
production, the food and beverages industry stimulates output and job creation in the
primary sector and contributes directly to the food security of the country. In addition, it
played a pivotal role in supplying inputs to the food and beverage service industry,
wholesale and retail sectors.
One of the core businesses of the Directorate: Agro-processing Support is to provide timely
and updated economic information regarding the food and beverages industry to monitor
its performance and provide insight into the effects of economic policies and exogenous
factors on the industry. The main economic indicators reviewed are the changes in prices,
production, capacity utilisation, value of sales, formal employment and trade. An outlook of
the industry for the next quarter is also presented. In addition, some indicators of the food
and beverages service industry, wholesale and retail sectors are reviewed to evaluate the
forward linkages of the food and beverages industry.
Any comments and suggestions on the content of the publication are most welcome.
Victor Thindisa
Director: Agro-processing Support
Pretoria
Disclaimer: The Department of Agriculture, Forestry and Fisheries did everything to ensure the
accuracy of the information reported in this publication. The department will, however, not
be liable for the results of action based on this publication.

ii
CONTENTS
PREFACE ................................................................................................................................................ i
1. INTRODUCTION ........................................................................................................................... 1
2. FOOD PRODUCTS ....................................................................................................................... 1
2.1 PRICE ..................................................................................................................................... 2
2.2 PRODUCTION ...................................................................................................................... 5
2.4 INCOME FROM FOOD SALES IN THE SERVICE INDUSTRY .......................................... 8
2.5 TRADE .................................................................................................................................. 10
2.6 EMPLOYMENT ..................................................................................................................... 20
2.7 OUTLOOK ............................................................................................................................ 21
3. BEVERAGES ................................................................................................................................ 22
3.1 PRICES…………………………………………………………………………………………………………………………….22
3.2 PRODUCTION .................................................................................................................... 23
3.3 VALUE OF SALES ................................................................................................................ 24
3.4 INCOME FROM BAR SALES IN THE SERVICE INDUSTRY ............................................ 25
3.5 TRADE .................................................................................................................................. 26
3.6 EMPLOYMENT…………………………………………………………………………………………………………………..34
3.7 OUTLOOK ............................................................................................................................ 34
4. CONCLUSION ............................................................................................................................ 35
NOTES: ................................................................................................................................................. 37
Compiled by Deborah Makola and Joshua Magomani with inputs from Phiwe Jiba and
Tebogo Clement Sebopetji
Department of Agriculture, Forestry and Fisheries
Sefala Building
503 Belvedere Street, Arcadia, South Africa
All correspondence can be addressed to:
Director: Agro-processing Support
Private Bag X416, Pretoria 0001, South Africa
Tel.: +27 (12) 319 8457
Fax: +27 (12) 319 8093
E-mail: [email protected]
This publication is also available on the internet at: http://www.daff.gov.za

1
1. INTRODUCTION
In 2016, global growth is projected to slow down to 3,1% before recovering to 3,4% in 2017.
The forecast, which is revised down by a 0,1 percentage point for 2016 and 2017 relative to
April, reflects a more subdued outlook for advanced economies following, amongst other
factors, the UK vote in favour of leaving the European Union (Brexit) in June and weaker-
than-expected growth in the United States (IMF, 2016).
However, in the second quarter of 2016, global economic growth moderated, following a
slowdown in activity in both advanced and emerging-market economies. The US economy
has lost momentum over the past few quarters and the expectation of a pickup in the
second quarter of 2016 has not been realized, with growth estimated at 1,1% at a seasonally
adjusted annual rate (IMF, 2016).
Furthermore, among advanced economies, the economic performance of Japan and
Europe was sluggish. Again, the outcome of the Brexit referendum and potential banking
stresses in some European countries further negatively affected the outlook for the United
Kingdom (UK) and the euro area. Output growth in emerging-market economies
decelerated on account of slower growth in India, a contraction in economic activity in
Russia and recessions in several major Latin American economies, with the outlook remaining
mixed (Reserve Bank, 2015).
In South Africa, the real gross domestic product (GDP) in the second quarter of 2016,
increased by 3,3%, following a contraction in the first quarter. The variations in economic
growth from quarter to quarter were mostly the result of fluctuations in the primary and
secondary sectors. The real value added by the mining sector rebounded, while agricultural
production inched lower to record a sixth consecutive quarter of contraction, mainly due to
the effect of drought. Moreover, the volume of manufacturing production picked up
significantly (Reserve Bank, 2015).
The food, beverages and tobacco division employment contracted by 2,2% quarter-to-
quarter, but grew by 6,1% year-on-year. The quarter-to-quarter contraction was driven mainly
by a decline in number of employment in the food component of the division which resulted
in the shedding of 2 986 jobs during the second quarter of 2016. This quarterly review assesses
the economic performance of the food and beverages industry, given a moderate global
economic growth and a contraction of domestic economic activities recorded during the
second quarter of 2016.
2. FOOD PRODUCTS
According to the Standard Industrial Classification, the food industry incorporates groups of
products which are categorized into the following four codes:
Code 301 refers to manufacturing, processing and preservation of meat, fish,
vegetables, fruits, oils, and fats.
Code 302 refers to manufacturing, processing and preservation of dairy products
Code 303 refers to manufacture of grain mill products, starch products and prepared
animal feeds
Code 304 refers to manufacture of other food products like bread, sugar, chocolate,
pasta, coffee, nuts, and spices.
2
Hence, food products refer to those primary agricultural and fisheries products that have
undergone some form of change through manufacturing and processing or performed some
value addition activities such as preservation.
2.1 PRICE
Consumer price index (CPI)1
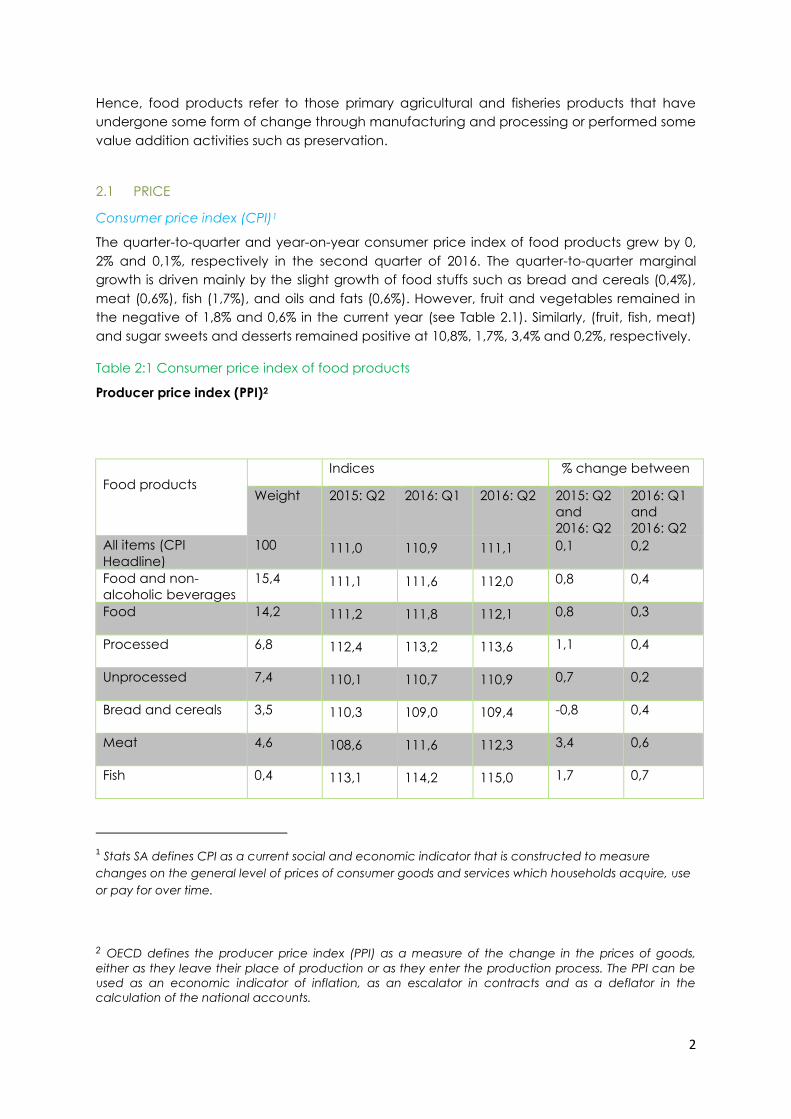
The quarter-to-quarter and year-on-year consumer price index of food products grew by 0,
2% and 0,1%, respectively in the second quarter of 2016. The quarter-to-quarter marginal
growth is driven mainly by the slight growth of food stuffs such as bread and cereals (0,4%),
meat (0,6%), fish (1,7%), and oils and fats (0,6%). However, fruit and vegetables remained in
the negative of 1,8% and 0,6% in the current year (see Table 2.1). Similarly, (fruit, fish, meat)
and sugar sweets and desserts remained positive at 10,8%, 1,7%, 3,4% and 0,2%, respectively.
Table 2:1 Consumer price index of food products
Producer price index (PPI)2
1 Stats SA defines CPI as a current social and economic indicator that is constructed to measure
changes on the general level of prices of consumer goods and services which households acquire, use
or pay for over time.
2 OECD defines the producer price index (PPI) as a measure of the change in the prices of goods,
either as they leave their place of production or as they enter the production process. The PPI can be
used as an economic indicator of inflation, as an escalator in contracts and as a deflator in the
calculation of the national accounts.
Food products
Indices % change between
Weight 2015: Q2 2016: Q1 2016: Q2 2015: Q2
and
2016: Q2
2016: Q1
and
2016: Q2
All items (CPI
Headline)
100 111,0 110,9 111,1 0,1 0,2
Food and non-
alcoholic beverages
15,4 111,1 111,6 112,0 0,8 0,4
Food 14,2 111,2 111,8 112,1 0,8 0,3
Processed 6,8 112,4 113,2 113,6 1,1 0,4
Unprocessed 7,4 110,1 110,7 110,9 0,7 0,2
Bread and cereals 3,5 110,3 109,0 109,4 -0,8 0,4
Meat 4,6 108,6 111,6 112,3 3,4 0,6
Fish 0,4 113,1 114,2 115,0 1,7 0,7

3
Source: (Stats SA, 2016a)
The producer price index for final manufactured goods registered an improved contraction
of 0,3%, following a 0,4% negative growth in the last quarter. The following items moderated
in the period: meat and meat products (0,3%), fruit and vegetables (0,1%), oils and fats
(1,3%). However, sugar rebounded by 1,0%, while beverages and bakery products grew by
0,7% and 0,5%, respectively and food products stagnated at 0,2%, (see Table 2.2). On the
other hand, the year-on-year producer price index for final manufactured decelerated by
0,6%, following a 0,2% contraction in the last quarter. Sugar, (oils and fats) recorded a 1,3%
and 3,1%, growth, respectively, while (meat and meat products) and fruit and vegetables
moderated by 7,5% and 1,5%, respectively. In addition, bakery products stagnated at 1,0%,
with fish remaining unchanged as compared to the preceding quarter of a 2,0% negative
growth.
Table 2.2: Producer price index of food products
Milk, eggs and
cheese
1,7 119,8 120,9 121,2 1,2 0,2
Oils and fats 0,5 100,8 100,3 100,9 0,1 0,6
Fruit 0,2 98,5 111,1 109,1 10,8 -1,8
Vegetables 1,6 114,1 111,9 111,2 -2,5 -0,6
Sugar, sweets and
deserts
0,6 115,0 114,9 115,2 0,2 0,3
Other food 0,9 84,1 85,5 85,7 1,9 0,2
Food products
Indices % change between
Weight 2015: Q2 2016:
Q1
2016:
Q2
2015: Q2
and
2016: Q2
2016: Q1
and
2016: Q2
Final manufactured
goods (Headline PPI)
100 115,1 114,7 114,4 -0,6 -0,3
Food products 26,3 116,9 118,8 119,2 2,0 0,3
Meat and meat
products
4,5 117,7 126,2 126,5 7,5 0,3
Fish and fish product 1,6 127,5 127,7 127,5 0,0 -0,2
Fruit and vegetables 2,4 112,5 114,0 114,2 1,5 0,1
Oils and fats 0,5 105,8 107,7 109,0 3,0 1,3
Dairy products 3,3 122,4 122,7 122,7 0,2 0,0
Grain mill products 1,8 109,3 108,2 109,5 0,2 1,2
Starch and starch
products and animal
feeds
1,6
117,6 117,4 117,5 -0,1 0,1

4
Source: Stats SA (2016b)
Import unit value index3
Import unit values of selected food products are given in Table 2.3. During the current period,
the import unit value index for food products and oils and fats, grew by 0,2%, however,
contracted by 3,4% year-on-year. In addition, quarter-to-quarter and year-on-year for fats
and oils contracted by 3,6% and 0,1%, respectively. Grain mill products grew year-on-year by
0,5%.
Table 2.3: Import unit value index of food products
Source: Stats SA (2016c)
3 IMF defines export and import unit value index as a measure of the overall change in the prices of
transactions in goods and services between the residents of an economic territory and residents of the
rest of the world. The average unit value is obtained by dividing the value of exported/imported goods
in monetary terms with the respective volume/weight of the goods.
Other food products 0,9 116,3 116,7 117,4 0,9 0,6
Bakery products 6,9 121,9 122,4 123,1 1,0 0,5
Sugar 1,9 103,5 103,7 104,8 1,3 1,0
Food products
Indices % change between
2015: Q2 2016: Q1 2016: Q2 2015: Q2
and
2016: Q2
2016: Q1
and
2016: Q2
Food (total) 110,0 106,1 106,3 -3,4 0,2
Fats and oils 101,3 97,8 97,7 -3,6 -0,1
Grain mill products 120,9 116,6 117,2 -3,1 0,5

5
2.2 PRODUCTION
Source: Statistics SA (2016d)
A physical volume of production by the food products division is presented in Figure 2.1. The
quarter-to-quarter physical volume of production of meat and meat products stagnated at
1,3%, dairy contracted by 1,2%, grain mill and bakery products rebounded by 0,2%, while
“other food products’’ decelerated by 0,2% in the second quarter of 2016. However, the
year-on-year volume of production for meat and meat products increased modestly by
3,0%, following a 1,1% growth in the first quarter of 2016. Dairy products moderated by 4,9%,
while grain mill and bakery and “other food products’’ decelerated by 1,7% and 0,1%,
respectively.
Production capacity
Table 2.4: Utilisation and reasons for underutilisation of production capacity by large
enterprises: Food products (percentage)
Period Utilisation Reasons for underutilisation
Total
under-
utilisation
Shortage of Insufficient
demand
Other
Raw
materials
Labour
Skilled Semi and
unskilled
2015: Q2 82,7 17,3 1,9 1,4 0,2 10,9 3,0
2016: Q1 81,7 18,3 2,2 1,3 0,3 10,7 3,8
50
60
70
80
90
100
110
120
13020
11:
Q2
20
11:
Q3
20
11:
Q4
20
12:
Q1
20
12:
Q2
20
12:
Q3
20
12:
Q4
20
13:
Q1
20
13:
Q2
20
13:
Q3
20
13:
Q4
20
14:
Q1
20
14:
Q2
20
14:
Q3
20
14:
Q4
20
15:
Q1
20
15:
Q2
20
15:
Q3
20
15:
Q4
20
16:
Q1
20
16:
Q2
Ind
ex (
2010 =
100)
Figure 2.1: Seasonally adjusted physical volume of production:
food products
Meat, fish, fruit etc Dairy products
Grain mill products Other food products

6
2016: Q2 81,5 18,5 2,1 1,4 0,2 10,1 4,8
Source: Statistics SA (2016e)
The utilisation of production capacity by large enterprises of food products showed a
marginal decrease year-on-year and quarter-to-quarter (see Table 2.4). Insufficient demand
and other reasons such as low productivity and shortage of raw materials are the main
reasons of underutilisation during the period.
2.3 VALUE OF SALES
Source: Statistics SA (2016d)
In the second quarter of 2016, the quarter-to-quarter seasonally adjusted value of sales of
food products moderated by 0,3%, following a 0,6% growth recorded in the previous quarter.
However, the seasonally adjusted value of sales grew marginally by 1,3% as compared to
1,2% year-on-year of the same period (see Figure 2.2).
20 000
40 000
60 000
80 000
100 000
120 000
140 000
160 000
201
1: Q
2
20
11
: Q
3
201
1: Q
4
201
2: Q
1
201
2: Q
2
201
2: Q
3
201
2: Q
4
201
3: Q
1
201
3: Q
2
201
3: Q
3
201
3: Q
4
201
4: Q
1
201
4: Q
2
201
4: Q
3
201
4: Q
4
201
5: Q
1
201
5: Q
2
201
5: Q
3
201
5: Q
4
201
6: Q
1
201
6: Q
2
R m
illio
n
Figure 2.2: Seasonally adjusted value of sales (current prices):
food products

7
Source: Statistics SA (2016d)
Wholesale and retail sales4
The current value of wholesale and retail sales of food, beverages and tobacco are given in
Figure 2.4. The wholesale and retail sales of food, beverages and tobacco increased
significantly by 9,6% and 17,1%, following growth of 1,0% and 2,6% respectively as recorded in
the previous quarter. Similarly, it grew significantly by 17,4% and 26,1% year-on-year, following
growth of 8,7% and 10,0%, respectively as recorded in the last quarter. As a result of the
positive growths, the current value of income from wholesale and retail sales of food,
beverages and tobacco increased from R69,5 billion and R15,6 billion in the previous quarter
to R76,2 billion and R18,3 billion, respectively in the second quarter of 2016.
4 Statistics South Africa (Stats SA) conducts a monthly survey covering enterprises in the wholesale and
retail trade industry. The results of the monthly wholesale and retail trade sales survey are used to
compile estimates of the gross domestic product (GDP) and its components, which are used in
monitoring the state of the economy and formulation of economic policy. These statistics are also used
in the analysis of comparative business and industry performance.
50
5 050
10 050
15 050
20 050
25 050
30 050
201
1: Q
2
201
1: Q
3
201
1: Q
4
201
2: Q
1
201
2: Q
2
201
2: Q
3
201
2: Q
4
201
3: Q
1
201
3: Q
2
20
13
: Q
3
201
3: Q
4
20
14
: Q
1
201
4: Q
2
201
4: Q
3
201
4: Q
4
201
5: Q
1
201
5: Q
2
201
5: Q
3
201
5: Q
4
201
6: Q
1
201
6: Q
2
Ind
ex (
2010 =
100)
Figure 2.3: Seasonally adjusted value of sales (current prices):
food products
Meat , fish, fruit etc Dairy products
Grain mill products Other food products

8
Source: Statistics SA (2016f, 2016g)
2.4 INCOME FROM FOOD SALES IN THE SERVICE INDUSTRY6
Table 2,5 below shows the income from food sales5 in the service industry, which includes
food sales in restaurants and coffee shops6, take-away and fast food outlets7 and catering
services8. The quarter-to-quarter and year-on-year current income from food sales in the
service industry increased significantly by 9,4% and 15,4%, following growth of 2,2% and 6,5%,
respectively in the preceding quarter. Owing to the increase in growths, the current value of
income from food sales in the service industry increased modestly from R9,9 billion in the
previous quarter to R10,8 billion in the second quarter of 2016.
5 Income from food sales in the service industry refers to income from the sale of meals and non-
alcoholic drinks.
6 Restaurants and coffee shops refers to enterprises involved in the sale and provision of meals and
drinks, ordered from a menu, prepared on the premises for immediate consumption and with provided
seating.
7 Take-away and fast food outlets refer to enterprises involved in the sale and provision of meals and
drinks, ordered from a menu, prepared on the premises for takeaway purposes in a packaged format,
at a stand or in a location, with or without provided seating.
8 Catering services refers to enterprises involved in the sale and supply of meals and drinks prepared on
the premises on a contract basis and brought to other premises chosen by the person ordering them,
to be served for immediate consumption to guests or customers. Catering services also include bars,
taverns, other drinking places, ice-cream parlours, etc.
0
10 000
20 000
30 000
40 000
50 000
60 000
70 000
80 000
90 000
201
1: Q
2
201
1: Q
3
201
1: Q
4
201
2: Q
1
201
2: Q
2
201
2: Q
3
201
2: Q
4
201
3: Q
1
201
3: Q
2
201
3: Q
3
201
3: Q
4
201
4: Q
1
201
4: Q
2
201
4: Q
3
201
4: Q
4
201
5: Q
1
201
5: Q
2
201
5: Q
3
201
5: Q
4
201
6: Q
1
201
6: Q
2
R m
illio
n
Figure 2.4: Wholesale and retail trade sales of food, beverages
and tobacco (current prices)
Wholesale Retail

9
Source: Statistics SA (20156)
The current income from food sales in the service industry increased significantly by 9,4%,
following a growth of 2,2% in the preceding quarter. The quarter-to-quarter increase can be
attributed to the growth in restaurants and coffee shops by 10,9% and 12,1% from a 2,9% and
a 1,3% growth in the last quarter. However, catering services contracted by 1,3% as
compared to a 2,9% growth in the preceding quarter. Similarly, the income from food sales
grew significantly by 10,5% from a 2,5% increase registered in the last quarter, driven by
growth in restaurant and coffee shops, take-away/fast food outlets and catering services by
11,5%, 11,6% and 7,8%, respectively (see Figure 2.6). During the quarter under review, the
total income from the restaurants and coffee shops, take-away/fast food outlets and
catering services stands at R5,7 billion, R4,8 billion and R2,1 billion, respectively, which
represents a growth in total income of 9,4% in the current quarter.
Source: Statistics SA (2016h)
4 000
5 000
6 000
7 000
8 000
9 000
10 000
11 000
12 000
201
1: Q
2
201
1: Q
3
201
1: Q
4
201
2: Q
1
201
2: Q
2
201
2: Q
3
201
2: Q
4
201
3: Q
1
201
3: Q
2
201
3: Q
3
201
3: Q
4
201
4: Q
1
201
4: Q
2
201
4: Q
3
20
14
: Q
4
20
15
: Q
1
201
5: Q
2
201
5: Q
3
201
5: Q
4
201
6: Q
1
201
6: Q
2
R m
illio
n
Figure 2.5: Income from food sales in the service industry
5001 0001 5002 0002 5003 0003 5004 0004 5005 0005 500
201
1: Q
2
201
1: Q
3
201
1: Q
4
20
12
: Q
1
201
2: Q
2
20
12
: Q
3
201
2: Q
4
201
3: Q
1
201
3: Q
2
201
3: Q
3
201
3: Q
4
201
4: Q
1
201
4: Q
2
201
4: Q
3
201
4: Q
4
201
5: Q
1
201
5: Q
2
201
5: Q
3
201
5: Q
4
201
6: Q
1
201
6: Q
2
R m
illio
n
Figure 2.6: Income from food sales in the service industry
Restaurants and coffee shops Take-away/fast food outlets
Catering services

10
2.5 TRADE
Main food export destinations and products
Figure 2.7 shows food export destination share of the continents. Africa was the main food
export destination during the second quarter of 2016; it accounted almost half of exports
(49%), followed by the Americas and Asia, which accounted 22% and 21%, respectively, of
the total food export destination. Europe and Oceania, altogether accounted for 8% of the
total food export. The trend during the past five years shows that Africa is by far the biggest
share of food export of more than 50% (see Figure 2.8).
Source: Quantec EasyData (2016)
Source: Quantec EasyData (2016)
Africa
49%
Europe
6%
Asia
21%
Americas
22%
Oceania
2%
Figure 2.7: The Food export destinations'share of continents in
2016:Q2
0
10
20
30
40
50
60
70
80
201
1: Q
2
20
11
: Q
3
201
1: Q
4
201
2: Q
1
201
2: Q
2
201
2: Q
3
201
2: Q
4
201
3: Q
1
201
3: Q
2
20
13
: Q
3
201
3: Q
4
201
4: Q
1
201
4: Q
2
201
4: Q
3
201
4: Q
4
201
5: Q
1
201
5: Q
2
20
15
: Q
3
201
5: Q
4
201
6: Q
1
201
6: Q
2
%
Figure 2.8: The food export destination's share of the continents
(2011-2016)
Africa Europe Asia Americas

11
Figure 2.9 shows the food export destinations’ share of the main regions9 in the second
quarter of 2016. Among the main regions, SADC (Excluding SACU) accounted the highest
share of food export (26%), followed by SACU, (Excluding RSA) (25,0%), the EU (24%), Eastern
Asia (13,0%), Western Asia and NAFTA with 6,0% each.
Source: Quantec EasyData (2016)
9 The main regions which are included in the analysis are the top eight regions: SADC, Western Africa,
EU; NAFTA (North Atlantic Free Trade Area consists consisting of US, (Canada and Mexico); Eastern Asia
(which includes China, Japan, North Korea and South Korea); Western Asia (mostly Middle Eastern
countries); South Central Asia (which includes India, Pakistan and Bangladesh) and Australia and New
Zealand.
SACU
(ExcludinG RSA
25%
SADC
(Excluding
SACU)
26%
European
Union
24%
Western Asia
6%
NAFTA
6%
Eastern Asia
13%
Figure 2.9: The Food export destinations'share of main regions in
2016:Q2
12
Source: Quantec EasyData (2016)
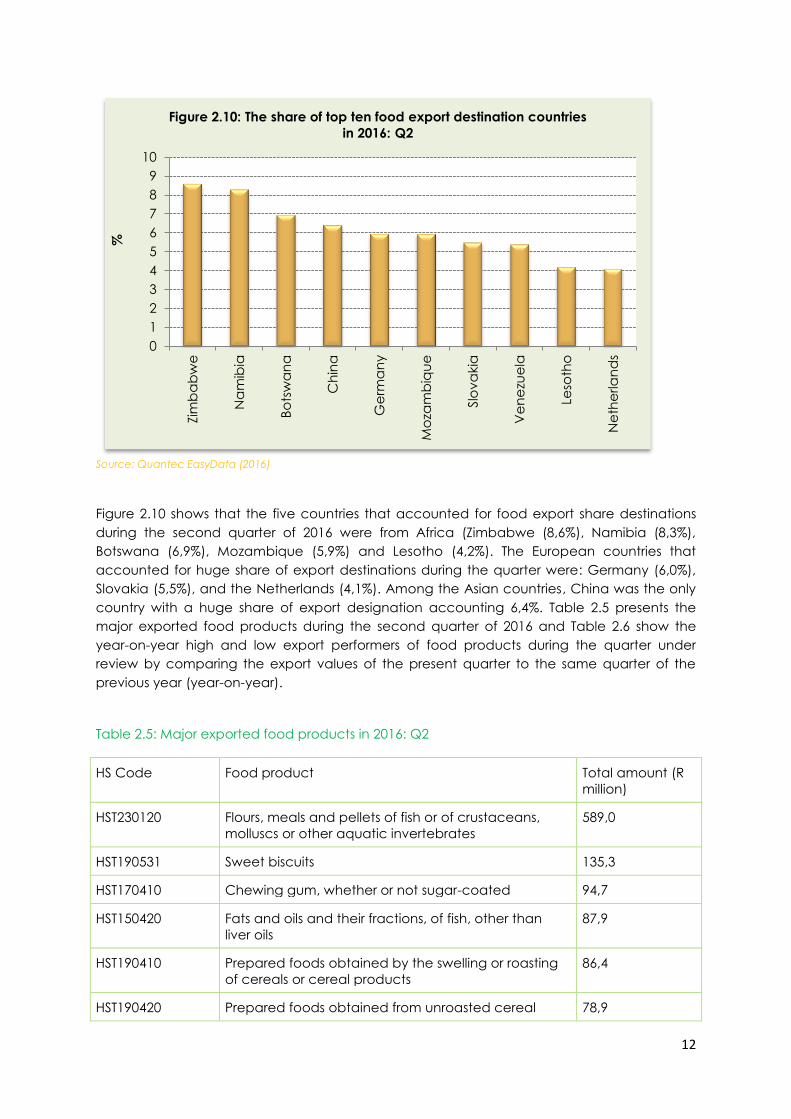
Figure 2.10 shows that the five countries that accounted for food export share destinations
during the second quarter of 2016 were from Africa (Zimbabwe (8,6%), Namibia (8,3%),
Botswana (6,9%), Mozambique (5,9%) and Lesotho (4,2%). The European countries that
accounted for huge share of export destinations during the quarter were: Germany (6,0%),
Slovakia (5,5%), and the Netherlands (4,1%). Among the Asian countries, China was the only
country with a huge share of export designation accounting 6,4%. Table 2.5 presents the
major exported food products during the second quarter of 2016 and Table 2.6 show the
year-on-year high and low export performers of food products during the quarter under
review by comparing the export values of the present quarter to the same quarter of the
previous year (year-on-year).
Table 2.5: Major exported food products in 2016: Q2
HS Code Food product Total amount (R
million)
HST230120 Flours, meals and pellets of fish or of crustaceans,
molluscs or other aquatic invertebrates
589,0
HST190531 Sweet biscuits 135,3
HST170410 Chewing gum, whether or not sugar-coated 94,7
HST150420 Fats and oils and their fractions, of fish, other than
liver oils
87,9
HST190410 Prepared foods obtained by the swelling or roasting
of cereals or cereal products
86,4
HST190420 Prepared foods obtained from unroasted cereal 78,9
0
1
2
3
4
5
6
7
8
9
10
Zim
ba
bw
e
Na
mib
ia
Bo
tsw
an
a
Ch
ina
Ge
rma
ny
Mo
zam
biq
ue
Slo
va
kia
Ve
ne
zue
la
Leso
tho
Ne
the
rla
nd
s
%
Figure 2.10: The share of top ten food export destination countries
in 2016: Q2

13
flakes or from mixtures of unroasted cereal flakes and
roasted cereal flakes or swelled cereals
HST190420 Prepared foods obtained from unroasted cereal
flakes or from mixtures of unroasted cereal flakes and
roasted cereal flakes or swelled cereals
78,9
HST040690 Other cheese 78,6
HST210320 Tomato ketchup and other tomato sauces 62,3
HST210230 Prepared baking powders 30,7
HST040630 Processed cheese, not grated or powdered 28,0
HST210130 Roasted chicory and other roasted coffee substitutes
and extracts, essences and concentrates thereof
25,9
HST180610 Cocoa powder containing added sugar or other
sweetening matter
22,6
HST230110 Flours, meals and pellets of meat or meat offal;
greaves
14,4
HST190510 Crisp bread
11,6
HST040610 Fresh (unripened or uncured) cheese, including whey
cheese and curd
10,9
HST190540 Rusks, toasted bread and similar toasted products 9,8
HST040520 Dairy spreads 4,8
HST040620 Grated or powdered cheese, of all kinds 4,4
HST190220 Stuffed pasta, whether or not cooked or otherwise
prepared
2,9
HST040640 Blue-veined cheese and other cheese containing
veins produced by Penicillium roqueforti
2,6
HST210310 Soya sauce 2,5
HST210220 Inactive yeasts; other single-cell microorganisms,
dead
2,4
HST210210 Active yeasts 2,4
HST190520 Gingerbread and the like 2,4
HST190532 Waffles and wafers 2,1
Source: Quantec EasyData (2016)

14
Table 2.6: Export performance of food products
HS Code Food product % Changes
compared to
a year ago
High performers
HST150410 Fish liver oils and their fractions 4594,3
HST170310 Cane molasses 555,2
HST170260 Other fructose and fructose syrup, containing in the dry
state more than 50% by weight of fructose, excluding invert
sugar 374,1
HST110220 Maize (corn) flour 211,9
HST110813 Potato starch 207,5
HST230400 Oilcake and other solid residues, whether or not ground or
in the form of pellets, resulting from the extraction of soya
bean oil 168,0
HST100890 Other cereals 160,2
HST150420 Fats and oils and their fractions of fish, other than liver oils 149,2
HST110814 Manioc (cassava) starch 142,9
HST040610 Fresh (unripened or uncured) cheese, including whey
cheese, and curd 140,3
HST040640 Blue-veined cheese and other cheese containing veins
produced by Penicillium Roqueforti 126,7
HST170220 Maple sugar and maple syrup 116,9
HST170410 Chewing gum, whether or not sugar-coated 113,6
HST210230 Prepared baking powders 102,0
HST040630 Processed cheese, not grated or powdered 79,1
HST090230 Black tea (fermented) and partly fermented tea, in
immediate packings of a content not exceeding 3 kg 74,7
HST230120 Flours, meals and pellets, of fish or of crustaceans, molluscs
or other aquatic invertebrates 63,1
HST190300 Tapioca and substitutes, therefore prepared from starch in
the form of flakes, grains, pearls, siftings or in similar forms. 54,0
HST040620 Grated or powdered cheese, of all kinds 51,3
HST190540 Rusks, toasted bread and similar toasted products 45,3
HST170230 Glucose and glucose syrup, not containing fructose or
containing in the dry state less than 20% by weight of
fructose 42,6

15
Source: Quantec EasyData (2016)
Main source of food imports and imported food products
South Africa’s main source of food import during the second quarter of 2016 is presented in
Figure 2.11. South Africa imported 62% of its food from Asia and Europe combine. The share
of the Americas (27%) was also significant, while that of Africa and Oceania were marginal
at 9,0% and 2,0%, respectively. Figure 2.12 indicates that during the past five years, Europe,
the Americas and Asia have been the largest sources of import, while Africa has been the
least and is still below 15%.
HST180610 Cocoa powder, containing added sugar or other
sweetening matter 40,2
HST210320 Tomato ketchup and other tomato sauces 36,5
HST180500 Cocoa powder, not containing added sugar or other
sweetening matter 33,5
HST110510 Flour, meal and powder 28,2
HST230110 Flours, meals and pellets of meat or meat offal; greaves 23,9
HST151710 Margarine, excluding liquid margarine 22,3
HST110100 Wheat or meslin flour 21,1
HST040510 Butter 15,8
HST190532 Waffles and wafers 14,8
Low performers
HST150430 Fats and oils and their fractions, of marine mammals -99,7
HST230500 Oil cake and other solid residues, whether or not ground or
in the form of pellets, resulting from the extraction of
ground-nut oil -99,0
HST150300 Lard stearin, lard oil, oleostearin, oleo oil and tallow oil, not
emulsified or mixed or otherwise prepared -95,3
HST170240 Glucose and glucose syrup, containing in the dry state at
least 20% but less than 50% by weight of fructose, excluding
invert sugar -74,7
HST151530: Castor oil and its fractions -58,6
HST190240: Couscous -52,2
HST110819 Other starches -51,3
HST040520 Dairy spreads -37,8
HST190220 Stuffed pasta, whether or not cooked or otherwise
prepared -33,1
HST180400 Cocoa butter, fat and oil -31,8

16
Source: Quantec EasyData (2016)
Source: Quantec EasyData (2016)
As the main trading region, the EU accounts for 38% of the total food imports, followed by
South America (26%), South Eastern Asia (23%), Eastern Asia (9,0%) and NAFTA (4,0%) during
the second quarter of 2016 (see Figure 2.13).
Africa
9% Americas
27%
Asia
28%
Europe
34%
Oceania
2%
Figure 2.11: The share of continents as a source of food import in
2016:Q2
0
5
10
15
20
25
30
35
40
45
201
1: Q
2
201
1: Q
3
201
1: Q
4
201
2: Q
1
201
2: Q
2
201
2: Q
3
201
2: Q
4
201
3: Q
1
201
3: Q
2
201
3: Q
3
201
3: Q
4
201
4: Q
1
201
4: Q
2
201
4: Q
3
201
4: Q
4
201
5: Q
1
201
5: Q
2
201
5: Q
3
201
5: Q
4
201
6: Q
1
201
6: Q
2
%
Figure 2.12: The share of continents as a source of food import
(2011-2016)
Asia Europe Americas Africa

17
Source: Quantec EasyData (2016)
Source: Quantec EasyData (2016)
Among the top ten countries as sources of import for South Africa, Argentina was the highest
(15,7%), followed by Indonesia (8,5%), Malaysia (8,4%), the Netherlands (8,3%), Spain (7,4%),
China (7,2%), Gabon (7,2%), Brazil (6,8%), Belarus (3,7%) and the United Kingdom (3,6%)(see
Figure 2.14). Table 2.6 presents the major imported food products during the second quarter
of 2016.
European
Union
38%
NAFTA
4% Eastern Asia
9%
South-Eastern
Asia
23%
South America
26%
Figure 2.11: The share of regions as a source of food import in
2016:Q2
0
2
4
6
8
10
12
14
16
18
Arg
en
tin
a
Ind
on
esi
a
Ma
laysi
a
Ne
the
rla
nd
s
Sp
ain
Ch
ina
Ga
bo
n
Bra
zil
Be
laru
s
Un
ite
d K
ing
do
m
%
Figure 2.14: The share of top ten countries as a source of food
import in 2016: Q2

18
Table 2.7: Top 30 imported food products in 2016: Q2
HS Code Food product Total
amount (R
million)
HST230400 Oil cake and other solid residues, whether or not ground or in the
form of pellets, resulting from the extraction of soya bean oil. 695,8
HST040690 Other cheese 123,3
HST170410 Chewing gum, whether or not sugar-coated 81,0
HST040630 Processed cheese, not grated or powdered 80,2
HST230110 Flours, meals and pellets of meat or meat offal; greaves 72,6
HST040510 Butter 69,0
HST110100 Wheat or meslin flour 62,6
HST180400 Cocoa butter, fat and oil 61,1
HST180500 Cocoa powder, not containing added sugar or other
sweetening matte. 58,9
HST151620 Vegetable fats and oils and their fractions 56,4
HST190230 Other pasta 54,8
HST190531 Sweet biscuits 53,5
HST170310 Cane molasses 43,8
HST210210 Active yeasts 34,9
HST110814 Manioc (cassava) starch 28,9
HST170230 Glucose and glucose syrup, not containing fructose or
containing in the dry state less than 20% by weight of fructose 23,6
HST170240 Glucose and glucose syrup, containing in the dry state at least
20% but less than 50% by weight of fructose, excluding invert
sugar 17,1
HST230120 Flours, meals and pellets, of fish or of crustaceans, molluscs or
other aquatic invertebrates 16,4
HST210320 Tomato ketchup and other tomato sauces 16,2
HST210500 Ice cream and other edible ice, whether or not containing
cocoa 15,2
HST110812 Maize (corn) starch 13,7
HST210410 Soups and broths and preparations thereof 12,9
HST151530 Castor oil and its fractions 10,5
HST151800 Animal or vegetable fats and oils and their fractions, boiled,
oxidised, dehydrated, sulphurised, blown, polymerised by heat in
vacuum or in inert gas or otherwise chemically modified,
excluding those of heading 15.16; inedible mixtures or pre 8,0

19
Source: Quantec EasyData (2016)
Source: Quantec EasyData (2016)
Figure 2.15 shows the quarterly trade balance of food products. The quarter-to-quarter food
export and import of food products rebounded by 13,3% and 4,2%, following a 7,1% and
11,6% respective growth in the previous quarter. However, the year-on-year food exports and
imports increased marginally by 19,7% and 11,9%, in the current quarter as compared to the
19,2% and 9,9% respective growth registered in the preceding quarter. As a result, the trade
surplus widened from R11,2 billion in the previous quarter to R12,7 billion during the second
quarter of 2016.
0
2 000
4 000
6 000
8 000
10 000
12 000
14 000
16 000
20
12
: Q
1
20
12
: Q
2
20
12
: Q
3
201
2: Q
4
201
3: Q
1
201
3: Q
2
201
3: Q
3
201
3: Q
4
201
4: Q
1
201
4: Q
2
201
4: Q
3
201
4: Q
4
201
5: Q
1
201
5: Q
2
201
5: Q
3
201
5: Q
4
201
6: Q
1
201
6: Q
2
R m
illio
n
Figure 2.15: Quarterly trade balance of food products
Export Import
HST210310 Soya sauce 7,9
HST040640 Blue-veined cheese and other cheese containing veins
produced by Penicillium roqueforti 6,3
HST190532 Waffles and wafers 6,2
HST040620 Grated or powdered cheese, of all kinds 5,9
HST040310 Yogurt 5,8
HST110813 Potato starch 5,7

20
2.6 Employment
Source: Statistics SA (2016i)
Figure 2.16 shows the total number of formal employment in the food products division. The
quarter-to-quarter food products division contracted by 1,6% as compared to a 2,4% growth
registered in the preceding quarter. As a result of the decline in growth, the employment in
the division decreased from 190 131 in the last quarter to 187,415 in the second quarter of
2016.
Source: Statistics SA (2016i)
Figure 2.17 shows the number of formal employment of food products division items. The
quarter-to-quarter formal employment of (meat, fish, fruit, vegetables, oils and fats) and
grain mill products contracted by 4,9% and 1,1% as compared to the respective growth of
0,3% and 2,2% recorded in the last quarter. However, dairy products showed an improved
150 000
155 000
160 000
165 000
170 000
175 000
180 000
185 000
190 000
195 000
20
15:
Q2
20
15:
Q3
20
15:
Q4
20
16:
Q1
20
16
: Q
2
Figure 2.16: Total number of formal employment: food
products
0
20 000
40 000
60 000
80 000
100 000
201
5: Q
2
201
5: Q
3
20
15
: Q
4
201
6: Q
1
201
6: Q
2
Figure 2.17: Number of formal employment: food
products
Production, processing and preservation of meat, fish, fruit, vegetables, oils and fats
Dairy products
Grain mill products, starches and starch products and prepared animal fat
Other food products

21
contraction of 1,0%, following a 4,3% decline recorded in the preceding quarter.
Furthermore, other food products moderated by 0,5% from a 6,2% growth in the first quarter
of 2016. As a result, the other food products is the only division that created jobs in the
quarter under review, of 81 118 from 80 732 jobs in the preceding quarter.
2.7 OUTLOOK
Table 2.8: Net balance10 of BER manufacturing survey: food products
2015: Q4 2016: Q1 2016: Q2 2016: Q3*
Domestic sales volumes -8 3 51 47
Export sales volumes 32 1 22 28
Production volumes -3 18 30 27
Domestic order volumes received -45 23 56 46
Export order volumes received 2 1 14 24
General business conditions -29 -63 -31 2
Number of factory workers 7 -23 -12 -55
Fixed investment -3 -29 -34 -25
Business confidence11 50 16 35
Expected volume of goods imported in
12 months’ time -24 -32 13
Expected volume of goods exported in
12 months’ time 11 32 15
Expected real investment in machinery
and equipment in 12 months’ time -25 0 -19
10 BER calculates the net balance statistics by subtracting the percentage of the respondents replying
“down” from the percentage replying “up” to a particular question. Respondents are asked to
compare the current quarter’s experience to that of a year ago. A positive net balance implies an
improvement (i.e., positive year-on-year growth) and vice versa. Therefore, the net balance varies from
-100 to 100 where -100 is the most negative response; 0 is a situation of no change and 100 is the most
positive response.
11 BER calculates the business confidence index by asking respondents to rate current business
conditions as “satisfactory” or “unsatisfactory.” Then the index is derived as a gross percentage of the
respondents replying “satisfactory.” A value of 50 is indicative of neutrality, 100 indicative of extreme
confidence and 0 of extreme lack of confidence. An index greater than 50 shows the majority of
respondents are satisfied with the prevailing economic conditions.

22
2015: Q4 2016: Q1 2016: Q2 2016: Q3*
Expected business conditions in 12
months’ time -25 -36 -16
*Expected Source: BER (2016)
A survey of food manufacturing by the Bureau for Economic Research (BER) is presented in
Table 2.7 The survey shows that the year-on-year outlook for the third quarter of 2016 is
positive for all the variables except for fixed investments and employment.
3. BEVERAGES
Beverages according to SIC classification is code 305 and it comprises of the following
beverage products:
Distilling, rectifying and blending of spirits; ethyl alcohol production from fermented
materials; manufacture of wine
Manufacture of beer and other malt liquors and malt
Breweries, except sorghum beer breweries
Sorghum beer breweries
Manufacture of malt
Manufacture of soft drinks; production of mineral waters
3.1 PRICE
Table 3.1 below shows the consumer price indices and export unit value of beverages. The
year-on-year and quarter-to-quarter consumer price inflation for alcoholic beverages
moderated by 0,1% and 0,2%, respectively, as compared to the previous quarter. The
quarter-to-quarter consumer price moderation is as a result of moderate growth in wine
(0,9%), hot beverages (0,4%), cold beverages (0,4%) and spirits (0,1%). However, beer
remained unchanged as compared to the previous quarter growth which was 0,1%. On the
other hand, the producer price for beverages remained unchanged for the current quarter,
while the export unit value moderated by 2,6%. The year-on-year moderated growth was
driven by the moderate growth of wine (3,8%), hot beverages (0,9%), non-alcoholic
beverages (0,4%), spirits (0,3%) and cold beverages (0,2%.
Table 3.1: Price indices of beverages
Beverages products
Indices % change between
Weight 2015: Q2 2016: Q1 2016:
Q2
2015: Q2
and
2016: Q2
2016:
Q1 and
2016:
Q2
Consumer price indices
All items (CPI
Headline)
100 111,0 110,9 111,1 0,1 0,2
Alcoholic
beverages
3,9 113,6 115,5 116,0 2,1 0,4
Spirits 0,8 109,7 110,0 110,0 0,3 0,1
Wine 0,7 113,4 116,7 117,7 3,8 0,9

23
Source: Stats SA (2016a, 2016b, 2016
3.2 PRODUCTION
Source: Statistics SA (2016d)
Figure 3.1 presents the seasonally adjusted physical volume of production for beverages
division. During the second quarter of 2016, the volume of production for beverages
increased marginally by 1,8% as compared to the 1,2% growth registered in the previous
quarter, however, it rebounded by 1,2% year-on-year following a 0,1% contraction in the last
quarter.
50
60
70
80
90
100
110
120
130
201
1: Q
2
201
1: Q
3
201
1: Q
4
201
2: Q
1
201
2: Q
2
201
2: Q
3
201
2: Q
4
201
3: Q
1
201
3: Q
2
201
3: Q
3
201
3: Q
4
201
4: Q
1
201
4: Q
2
201
4: Q
3
201
4: Q
4
201
5: Q
1
201
5: Q
2
20
15
: Q
3
201
5: Q
4
201
6: Q
1
201
6: Q
2
Ind
ex (
2010 =
100)
Figure 3.1: Seasonally adjusted physical volume of
production: beverages
Beer 2,5 114,4 114,8 114,8 0,3 0,0
Non-alcoholic
beverages
1,2 109,6 109,7 110,0 0,4 0,3
Hot beverages 0,3 115,9 116,5 117,0 0,9 0,4
Cold beverages 0,9 107,3 107,1 107,5 0,2 0,4
Producer price index
Beverages 8,5 111,3 111,4 111,4 0,1 0,0
Export Unit value
Beverages 135,2 126,4 140,5 144,2 14,1 2,6

24
Production capacity
Table 3.2: Utilisation and reasons for underutilisation of production capacity by large
enterprises: Beverages division (percentage)
Period Utilisation Reasons for underutilisation
Total
under-
utilisation
Shortage of Insufficient
demand
Other
Raw
materials
Labour
Skilled Semi and
unskilled
2015: Q2 82,8 17,2 2,0 1,5 0,2 8,7 4,9
2016: Q1 85,6 14,4 1,9 0,8 0,2 7,7 3,8
2016: Q2 85,5 14,5 2,0 1,0 0,3 7,7 3,6
Source: Statistics SA (2016e)
Table 3.2 shows that the year-on-year utilisation capacity showed an increase during the
second quarter of 2016 for the beverages division, however, it moderated as compared to
the previous quarter. Insufficient demand remains the main reason for underutilisation during
the period followed by other reasons such as seasonal factors.
3.3 VALUE OF SALES
Source: Statistics SA (2016d)
10 000
20 000
30 000
40 000
50 000
60 000
70 000
80 000
90 000
100 000
110 000
201
1: Q
2
201
1: Q
3
201
1: Q
4
201
2: Q
1
201
2: Q
2
201
2: Q
3
201
2: Q
4
201
3: Q
1
201
3: Q
2
201
3: Q
3
201
3: Q
4
201
4: Q
1
201
4: Q
2
201
4: Q
3
201
4: Q
4
201
5: Q
1
201
5: Q
2
20
15
: Q
3
201
5: Q
4
201
6: Q
1
201
6: Q
2
R m
illio
n
Figure 3.2: Seasonally adjusted value of sales (current
prices): beverages

25
The seasonally adjusted value of sales for beverages division stagnated by 1,8% year-on-
year, however, moderated by 0,5% quarter-to-quarter following a1,0% growth recorded in
the preceding quarter (see Figure 4.6).
3.4 INCOME FROM BAR SALES IN THE SERVICE INDUSTRY12
During the second quarter of 2016, income from bar sales in the food and beverages
services industry accelerated by 10,5%, following a 2,5% growth recorded in the preceding
quarter; representing a growth from R1,5 billion previously to R1,6 billion in the current quarter.
The increases are as a result of increase in growth of restaurants and coffee shops, take-
away/fast food and catering services by 11,5%, 11,6% and 7,8%, following growth of 2,9%,
3,0% and 1,1%, respectively in the previous quarter. Similarly, the year-on-year total income
from bar sales in the industry grew by 22,0% for restaurants and coffee shops, take-away/fast
food outlets (10,8%) and catering services (14,8%).
Source: Statistics SA (2016h)
12 Income from bar sales refers to income from liquor sales.
0
200
400
600
800
1 000
1 200
1 400
1 600
1 800
2 000
201
1: Q
2
201
1: Q
3
201
1: Q
4
201
2: Q
1
201
2: Q
2
201
2: Q
3
201
2: Q
4
201
3: Q
1
201
3: Q
2
201
3: Q
3
201
3: Q
4
201
4: Q
1
201
4: Q
2
201
4: Q
3
201
4: Q
4
201
5: Q
1
201
5: Q
2
201
5: Q
3
201
5: Q
4
20
16
: Q
1
201
6: Q
2
R m
illio
n
Figure 3.3: Total income from bar sales in the service industry

26
Source: Statistics SA (2016h)
3.5 TRADE
Main export destinations and food products
Figure 3.5 shows that, during quarter two of 2016, Europe was by far the largest export
destination for South African beverages. It accounted for 43% of the total export, followed by
Africa (35%), then Asia and the Americas at 11% and 10%, respectively. Oceania played a
marginal role as export destination for South African beverages division export. The trend of
the export destination’s share during the past five years indicates that Europe and Africa
have been the two continents that have been playing the most significant roles in beverages
export share destination (see Figure 3.6).
Source: Quantec EasyData (2016)
0
200
400
600
800
1 000
1 200
1 400
201
1: Q
2
201
1: Q
3
201
1: Q
4
201
2: Q
1
201
2: Q
2
201
2: Q
3
201
2: Q
4
201
3: Q
1
201
3: Q
2
201
3: Q
3
201
3: Q
4
201
4: Q
1
201
4: Q
2
201
4: Q
3
201
4: Q
4
201
5: Q
1
201
5: Q
2
201
5: Q
3
201
5: Q
4
20
16
: Q
1
201
6: Q
2
R m
illio
n
Figure 3.4: Income from bar sales in the service industry
Restaurants and coffee shops Catering services
Take-away/fast food outlets
Africa
35%
Americas
10% Asia
11%
Europe
43%
Oceania
1%
Figure 3.5: The beverage export destination's share of
continents in 2016:Q2

27
Source: Quantec EasyData (2016)
Among the main trading region, the EU accounts for most of the total export, followed by
SADC (Excluding SACU) 17,0%) and SACU (Excluding RSA), which accounted for 16,0%.
NAFTA, Eastern Asia and South Eastern Asia accounted for 10,0%, 6,0% and 4,0%, respectively
during the period (see Figure 3.7).
Source: Quantec EasyData (2016)
0
10
20
30
40
50
60201
1: Q
2
201
1: Q
3
201
1: Q
4
201
2: Q
1
201
2: Q
2
201
2: Q
3
201
2: Q
4
201
3: Q
1
201
3: Q
2
201
3: Q
3
20
13
: Q
4
201
4: Q
1
201
4: Q
2
201
4: Q
3
201
4: Q
4
201
5: Q
1
201
5: Q
2
20
15
: Q
3
201
5: Q
4
201
6: Q
1
201
6: Q
2
%
Figure 3.6: The beverages export destination's share of the
continents
(2011-2016)
Europe Africa Americas Asia
European
Union
47%
NAFTA
10%
Eastern Asia
6%
South Eastern
Asia
4%
SADC
(Excluding
SACU)
17%
SACU
(Excluding
RSA)
16%
Figure 3.7: The share of top beverage export destination
regions in 2016: Q2

28
Source: Quantec EasyData (2016)
Figure 3.8 above shows the share of the top ten beverages export destinations during the
second quarter of 2016. The following are the main countries that beverages were exported
to during the quarter: Saint Vincent and the Grenadines (9,9%), Germany (7,9%), Namibia
(7,4%), the Netherlands (5,6%), Mozambique (4,5%), United States (4,4%), Central African
Republic (4,1%), Denmark (4,0%), Sweden (4,0%) and Canada (3,8%). Table 3.3 presents
major exported beverages during the quarter under review, while Table 3.4 shows high and
low export performers of beverages during the second quarter of 2016 by comparing the
export values of the present quarter to the same quarter of the previous year (year-on-year).
Table 3.3: Major exported beverages products in 2016: Q2
HS Code Beverages products Total amount
(R million)
HST220710 Undenatured ethyl alcohol of an alcoholic strength by
volume of 80% vol. or higher
387,4
HST220210 Waters, including mineral waters and aerated waters,
containing added sugar or other sweetening matter or
flavoured
305,0
HST220600 Other fermented beverages (for example, cider, perry,
mead); mixtures of fermented beverages and mixtures
of fermented beverages and non-alcoholic
beverages, not elsewhere specified or included
221,9
HST220870 Liqueurs and cordials 167,9
HST220820 Spirits obtained by distilling grape wine or grape marc 89,5
HST220820 Spirits obtained by distilling grape wine or grape marc 89,5
HST220830 Whiskies 67,0
HST220860 Vodka 39,9
0
2
4
6
8
10
12
Sa
int
Vin
ce
nt
an
d
the
Gre
na
din
es
Ge
rma
ny
Na
mib
ia
Ne
the
rla
nd
s
Mo
zam
biq
ue
Un
ite
d S
tate
s
Ce
ntr
al A
fric
an
Re
pu
blic
De
nm
ark
Sw
ed
en
Ca
na
da
%
Figure 3.8: The share of top ten beverages export destination
countries in 2016: Q2
29
HST220850 Gin and Geneva 28,7
HST220840 Rum and other spirits obtained by distilling fermented
sugar-cane products
16,7
HST220900 Vinegar and substitutes for vinegar obtained from
acetic acid
7,7
HST220430 Other grape must 4,2
Source: Quantec EasyData (2016)
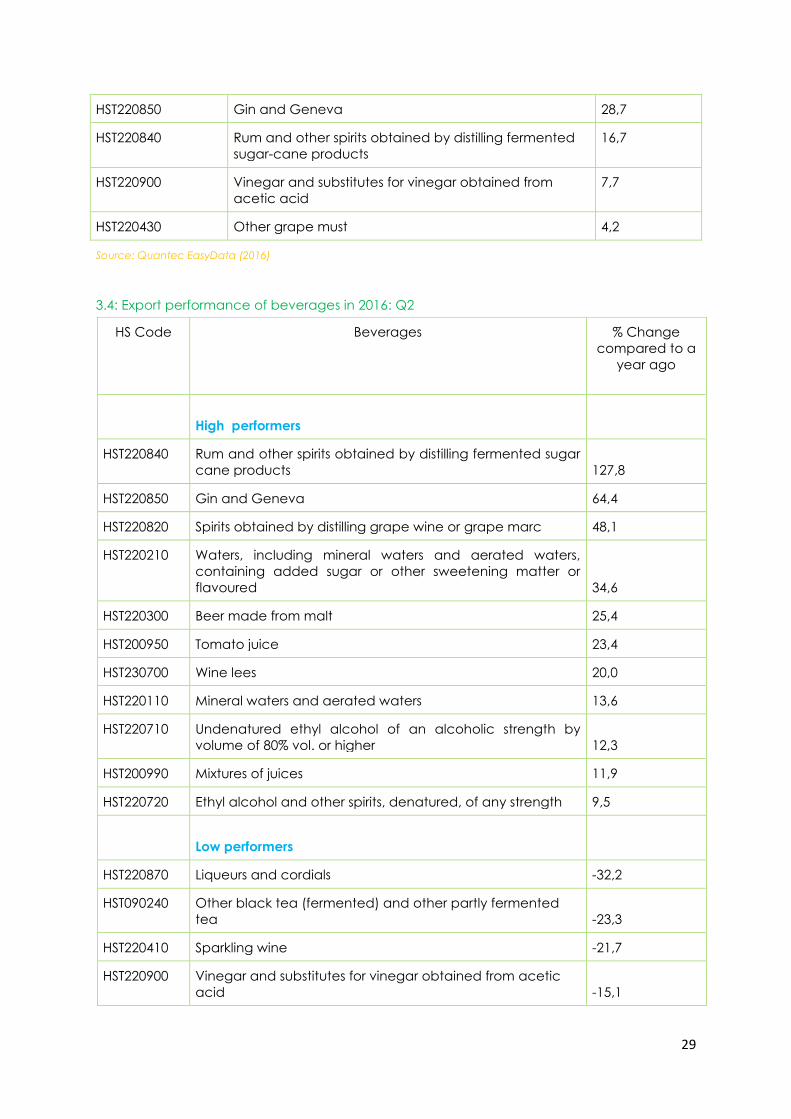
3.4: Export performance of beverages in 2016: Q2
HS Code Beverages % Change
compared to a
year ago
High performers
HST220840 Rum and other spirits obtained by distilling fermented sugar
cane products 127,8
HST220850 Gin and Geneva 64,4
HST220820 Spirits obtained by distilling grape wine or grape marc 48,1
HST220210 Waters, including mineral waters and aerated waters,
containing added sugar or other sweetening matter or
flavoured 34,6
HST220300 Beer made from malt 25,4
HST200950 Tomato juice 23,4
HST230700 Wine lees 20,0
HST220110 Mineral waters and aerated waters 13,6
HST220710 Undenatured ethyl alcohol of an alcoholic strength by
volume of 80% vol. or higher 12,3
HST200990 Mixtures of juices 11,9
HST220720 Ethyl alcohol and other spirits, denatured, of any strength 9,5
Low performers
HST220870 Liqueurs and cordials -32,2
HST090240 Other black tea (fermented) and other partly fermented
tea -23,3
HST220410 Sparkling wine -21,7
HST220900 Vinegar and substitutes for vinegar obtained from acetic
acid -15,1

30
Source: Quantec EasyData (2016)
Main imported beverage products and the source
Figure 3.9 illustrates the share of continents as a source of beverage import in the second
quarter of 2016. Europe, which accounted 80% import share, was the largest source of
beverages import during the second quarter of 2016. Africa accounted 7% of the import,
while the Americas, Asia and Oceania altogether accounted for 13% of the total beverages
import during the period. Figure 3.10 shows that during the past five years, Europe, followed
by Africa, accounted for a huge share of beverages import, followed by the Americas and
Asia with 8% and 4%, respectively. Oceania’s contribution is very small at 1%.
Source: Quantec EasyData (2016)
Africa
7% Americas
8% Asia
4%
Europe
80%
Oceania
1%
Figure 3.9: The share of continent's as a source of beverages
import in 2016: Q2
HST220830 Whiskies -13,1
HST220600 Other fermented beverages (for example, cider, perry,
mead); mixtures of fermented beverages and mixtures of
fermented beverages and non-alcoholic beverages, not
elsewhere specified or included -12,2
HST200981 Cranberry (Vaccinium macrocarpon, Vaccinium
oxycoccos, Vaccinium vitis-idaea) juice -8,2
HST220860 Vodka -4,7

31
Source: Quantec EasyData (2016)
Among the top trading regions, the EU (80%) still accounts the largest share followed by
(SACU (Excluding RSA)) (7%), and NAFTA (7%). Western Asia and the Western Europe rest
played a minor role of as a source of import for beverages; they accounted for 3% each (see
Figure 3.10).
Source: Quantec EasyData (2016)
0
10
20
30
40
50
60
70
80
90201
1: Q
2
201
1: Q
3
201
1: Q
4
201
2: Q
1
201
2: Q
2
201
2: Q
3
201
2: Q
4
201
3: Q
1
201
3: Q
2
201
3: Q
3
201
3: Q
4
201
4: Q
1
201
4: Q
2
20
14
: Q
3
201
4: Q
4
201
5: Q
1
201
5: Q
2
201
5: Q
3
201
5: Q
4
201
6: Q
1
201
6: Q
2
%
Figure 3.10: The share of continents as a source of beverages
import
(2011-2016)
Europe Americas Africa Asia
NAFTA
7% Western Asia
3% Western
Europe Rest
3%
European
Union
80%
SACU
(Excluding
RSA)
7%
Figure 3.11: The share of top regions as a source of beverages
import in 2016: Q2
32
Source: Quantec EasyData (2016)
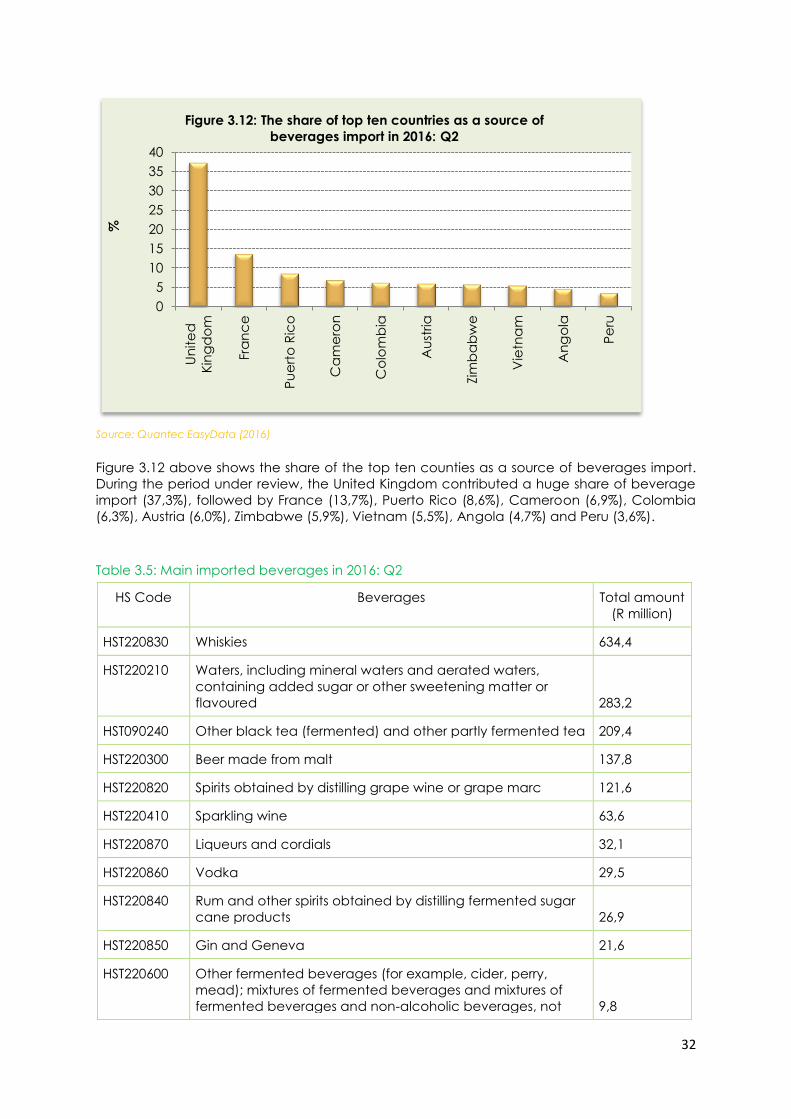
Figure 3.12 above shows the share of the top ten counties as a source of beverages import.
During the period under review, the United Kingdom contributed a huge share of beverage
import (37,3%), followed by France (13,7%), Puerto Rico (8,6%), Cameroon (6,9%), Colombia
(6,3%), Austria (6,0%), Zimbabwe (5,9%), Vietnam (5,5%), Angola (4,7%) and Peru (3,6%).
Table 3.5: Main imported beverages in 2016: Q2
0
5
10
15
20
25
30
35
40
Un
ite
d
Kin
gd
om
Fra
nc
e
Pu
ert
o R
ico
Ca
me
ron
Co
lom
bia
Au
stria
Zim
ba
bw
e
Vie
tna
m
An
go
la
Pe
ru
%
Figure 3.12: The share of top ten countries as a source of
beverages import in 2016: Q2
HS Code Beverages Total amount
(R million)
HST220830 Whiskies 634,4
HST220210 Waters, including mineral waters and aerated waters,
containing added sugar or other sweetening matter or
flavoured 283,2
HST090240 Other black tea (fermented) and other partly fermented tea 209,4
HST220300 Beer made from malt 137,8
HST220820 Spirits obtained by distilling grape wine or grape marc 121,6
HST220410 Sparkling wine 63,6
HST220870 Liqueurs and cordials 32,1
HST220860 Vodka 29,5
HST220840 Rum and other spirits obtained by distilling fermented sugar
cane products 26,9
HST220850 Gin and Geneva 21,6
HST220600 Other fermented beverages (for example, cider, perry,
mead); mixtures of fermented beverages and mixtures of
fermented beverages and non-alcoholic beverages, not 9,8

33
Source: Quantec EasyData (2016)
Source: Quantec EasyData (2016)
During the second quarter of 2016, the export of beverages rebounded by 19,0%, following a
18,5% contraction in the previous quarter, however, it increased modestly year-on-year by
15,5%, following a 10,5% growth registered in the preceding quarter. On the other hand, the
quarter-to-quarter and the year-on-year import rebounded by 22,7% and 9,6%, following a
contraction of 29,8% and 0,4%, repsectively in the last quarter. As a result, the trade surplus of
beverages industry widened from R2 216,7 million in the previous quarter to R2 591,1 million
during the second quarter of 2016 (see Figure 3.13).
0
500
1 000
1 500
2 000
2 500
3 000
3 500
4 000
4 500
5 000
201
2: Q
2
201
2: Q
3
201
2: Q
4
201
3: Q
1
201
3: Q
2
201
3: Q
3
201
3: Q
4
201
4: Q
1
201
4: Q
2
201
4: Q
3
201
4: Q
4
201
5: Q
1
201
5: Q
2
20
15
: Q
3
201
5: Q
4
201
6: Q
1
201
6: Q
2
R m
illio
n
Figure 3.13: Quarterly trade balance of beverages
Export Import
elsewhere specified or included
HST220900 Vinegar and substitutes for vinegar obtained from acetic
acid 7,5
HST090230 Black tea (fermented) and partly fermented tea, in
immediate packings of a content not exceeding 3 kg 7,5
HST220110 Mineral waters and aerated waters 6,2
HST200981 Cranberry (Vaccinium macrocarpon, Vaccinium
oxycoccos, Vaccinium vitis-idaea) juice 5,1
HST220710 Undenatured ethyl alcohol of an alcoholic strength by
volume of 80% vol. or higher 4,8
HST220720 Ethyl alcohol and other spirits, denatured, of any strength 0,1

34
3.6 Employment
Source: Quantec EasyData (2016i)
Figure 3.14 shows the number of formal employment in the beverages and tobacco
products industry. The quarter-to-quarter formal employment of the beverages and tobacco
products divisions contracted by 5,2%, following a growth of 2,4% recorded in the previous
quarter. As a result of the decline in employment growth, the total number of formal
employment of the beverages and tobacco products division decreased from 40 925 in the
previous quarter to 38 790 during the second quarter of 2016.
3.7 OUTLOOK
Table 3.6: Net balance of BER manufacturing survey: Beverages
2015: Q4 2016: Q1 2016: Q2 2016: Q3*
Domestic sales volumes 86 94 36 87
Export sales volumes 76 89 92 40
Production volumes 85 87 83 83
Domestic order volumes received 86 92 35 87
Export order volumes received 76 88 92 44
General business conditions -3 -85 9 60
Number of factory workers 21 3 7 8
37 500
38 000
38 500
39 000
39 500
40 000
40 500
41 000
41 500
201
5: Q
2
201
5: Q
3
201
5: Q
4
201
6: Q
1
201
6: Q
2
Figure 3.14: Number of formal employment: beverage and
tobacco products

35
2015: Q4 2016: Q1 2016: Q2 2016: Q3*
Fixed investment 89 -1 2 63
Business confidence 12 9 64
Expected volume of goods imported in
12 months’ time -75 -2 40
Expected volume of goods exported in
12 months’ time 84 96 97
Expected real investment in machinery
and equipment in 12 months’ time 62 93 63
Expected business conditions in 12
months’ time -14 -87 -26
*Expected Source: BER (2016)
The survey of the beverages division by BER shows that the year-on-year outlook for the third
quarter of 2016 is positive for all variables.
4. CONCLUSION
The real gross domestic product (GDP) of South Africa in the second quarter of 2016
increased by 3,3%, following a contraction in the first quarter. The variations in economic
growth from quarter to quarter were mostly the result of fluctuations in the primary and
secondary sectors. The real value added by the mining sector rebounded, while agricultural
production inched lower to record a sixth consecutive quarter of contraction, mainly due to
the effect of the drought. Moreover, the volume of manufacturing production picked up
significantly.
The nominal value of sales of food and beverages industry moderated by 0,2% as compared
to 0,8% growth in the last quarter. Similarly, it moderated by 1,3% year-on-year.
The wholesale and retail sales of food, beverages and tobacco increased significantly
quarter-to-quarter and year-on-year. Income from food sales in the service industry stands at
R10,8 billion during the second quarter of 2016.
In terms of trade, Africa was the main food export destination during the second quarter of
2016; it accounted almost half of total exports followed by the Americas and Asia. Europe is
by far the largest export destination for South African beverages; it accounted for a huge
amount of the total export, followed by Africa then Asia and the Americas.
Furthermore, Europe, followed by Africa accounted for a huge share of beverages import,
followed by the Americas and then Asia.
The food, beverages and tobacco division employment contracted by 2,2% quarter-to-
quarter, however, grew by 6,1% year-on-year. The quarter-to-quarter contraction was driven
mainly by a decline in number of employment in the food component of the division, which
resulted in the shedding of 2 986 jobs during the second quarter of 2016.

36
REFERENCES
BER (2016), Manufacturing Survey. Bureau for Economic Research, University of Stellenbosch.
Quantec EasyData (2016), RSA International Trade. Accessed in December 2016.
Statistics SA (2016a), Consumer Price Index, various issues. Statistics South Africa.
Statistics SA (2016b), Producer Price Index, various issues. Statistics South Africa.
Statistics SA (2016c), Export and Import Unit Value Indices, various issues. Statistics South
Africa.
Statistics SA (2016d), Manufacturing: Production and Sales, various issues. Statistics South
Africa.
Statistics SA (2016e), Manufacturing: Utilisation of Production Capacity by Large Enterprises.
Statistics South Africa.
Statistics SA (2016f), Wholesale Trade Sales, various issues, Statistics South Africa.
Statistics SA (2016g), Retail Trade Sales, various issues, Statistics South Africa.
Statistics SA (2016h), Food and Beverages, various issues, Statistics South Africa.
Statistics SA (2016i), Quarterly Employment Statistics, various issues. Statistics South Africa.
Reserve Bank (2016), Quarterly Bulletin, December 2016, South African Reserve Bank.

37
NOTES:
----------------------------------------------------------------------------------------------------------------------------- ----------
---------------------------------------------------------------------------------------------------------------------------------------
----------------------------------------------------------------------------------------------------------------------------- ----------
------------------------------------------------------------------------------------------------------------------------------------- --
----------------------------------------------------------------------------------------------------------------------------- ----------
----------------------------------------------------------------------------------------------------------------------------- ----------
------------------------------------------------------------------------------------------------------------------- --------------------
----------------------------------------------------------------------------------------------------------------------------- ----------
----------------------------------------------------------------------------------------------------- ----------------------------------
----------------------------------------------------------------------------------------------------------------------------- ----------
---------------------------------------------------------------------------------------------------------------------------------------
----------------------------------------------------------------------------------------------------------------------------- ----------
---------------------------------------------------------------------------------------------------------------------------------------
----------------------------------------------------------------------------------------------------------------------------- ----------
---------------------------------------------------------------------------------------------------------------------------------------
----------------------------------------------------------------------------------------------------------------------------- ----------
---------------------------------------------------------------------------------------------------------------------------------------
----------------------------------------------------------------------------------------------------------------------------- ----------
---------------------------------------------------------------------------------------------------------------------------------------
----------------------------------------------------------------------------------------------------------------------------- ----------
---------------------------------------------------------------------------------------------------------------------------------------
----------------------------------------------------------------------------------------------------------------------------- ----------
-------------------------------------------------------------------------------------------------------------------------------- -------
---------------------------------------------------------------------------------------------------------------------------- -----------
----------------------------------------------------------------------------------------------------------------------------- ----------
-------------------------------------------------------------------------------------------------------------- -------------------------
----------------------------------------------------------------------------------------------------------------------------- ----------
------------------------------------------------------------------------------------------------ ---------------------------------------
----------------------------------------------------------------------------------------------------------------------------- ----------
---------------------------------------------------------------------------------------------------------------------------------------
----------------------------------------------------------------------------------------------------------------------------- ----------
---------------------------------------------------------------------------------------------------------------------------------------
----------------------------------------------------------------------------------------------------------------------------- ----------
---------------------------------------------------------------------------------------------------------------------------------------
----------------------------------------------------------------------------------------------------------------------------- ----------
---------------------------------------------------------------------------------------------------------------------------------------

38
----------------------------------------------------------------------------------------------------------------------------- ----------
---------------------------------------------------------------------------------------------------------------------------------------
----------------------------------------------------------------------------------------------------------------------------- ----------
---------------------------------------------------------------------------------------------------------------------------------------
----------------------------------------------------------------------------------------------------------------------------- ----------
----------------------------------------------------------------------------------------------------------------------------- ----------
----------------------------------------------------------------------------------------------------------------------- ----------------
----------------------------------------------------------------------------------------------------------------------------- ----------
--------------------------------------------------------------------------------------------------------- ------------------------------
---------------------------------------------------------------------------------------------------------------------------------------
---------------------------------------------------------------------------------------------------------------------------------------
----------------------------------------------------------------------------------------------------------------------------- ----------
---------------------------------------------------------------------------------------------------------------------------------------
----------------------------------------------------------------------------------------------------------------------------- ----------
---------------------------------------------------------------------------------------------------------------------------------------
---------------------------------------------------------------------------------------------------------------------------------------
---------------------------------------------------------------------------------------------------------------------------------------
----------------------------------------------------------------------------------------------------------------------------- ----------
---------------------------------------------------------------------------------------------------------------------------------------
----------------------------------------------------------------------------------------------------------------------------- ----------
---------------------------------------------------------------------------------------------------------------------------------------
----------------------------------------------------------------------------------------------------------------------------- ----------
------------------------------------------------------------------------------------------------------------------------------------ ---
----------------------------------------------------------------------------------------------------------------------------- ----------
----------------------------------------------------------------------------------------------------------------------------- ----------
---------------------------------------------------------------------------------------------------------------------------------------
----------------------------------------------------------------------------------------------------------------------------- ----------
---------------------------------------------------------------------------------------------------------------------------------------
----------------------------------------------------------------------------------------------------------------------------- ----------
---------------------------------------------------------------------------------------------------------------------------------------
---------------------------------------------------------------------------------------------------------------------------------------
---------------------------------------------------------------------------------------------------------------------------------------
----------------------------------------------------------------------------------------------------------------------------- ----------
---------------------------------------------------------------------------------------------------------------------------------------
----------------------------------------------------------------------------------------------------------------------------- ----------
---------------------------------------------------------------------------------------------------------------------------------------
----------------------------------------------------------------------------------------------------------------------------- ----------


