
Rainfall and temperatures changes have confoundingimpacts on Phytophthora cinnamomi occurrence risk inthe southwestern USA under climate change scenariosSALLY E . THOMPSON1 , S IMON LEV IN 2 and IGNACIO RODRIGUEZ-ITURBE3
1Department of Civil and Environmental Engineering, University of California, Berkeley, CA 94710, USA, 2Department of
Ecology and Evolutionary Biology, Princeton University, Princeton NJ 08544, USA, 3Department of Civil and Environmental
Engineering, Princeton University, Princeton, NJ 08544, USA
Abstract
Global change will simultaneously impact many aspects of climate, with the potential to exacerbate the risks posed by
plant pathogens to agriculture and the natural environment; yet, most studies that explore climate impacts on plant
pathogen ranges consider individual climatic factors separately. In this study, we adopt a stochastic modeling
approach to address multiple pathways by which climate can constrain the range of the generalist plant pathogen Phy-
tophthora cinnamomi (Pc): through changing winter soil temperatures affecting pathogen survival; spring soil tempera-
tures and thus pathogen metabolic rates; and changing spring soil moisture conditions and thus pathogen growth rates
through host root systems. We apply this model to the southwestern USA for contemporary and plausible future cli-
mate scenarios and evaluate the changes in the potential range of Pc. The results indicate that the plausible range of this
pathogen in the southwestern USA extends over approximately 200 000 km2 under contemporary conditions. While
warming temperatures as projected by the IPCC A2 and B1 emissions scenarios greatly expand the range over which
the pathogen can survive winter, projected reductions in spring rainfall reduce its feasible habitat, leading to spatially
complex patterns of changing risk. The study demonstrates that temperature and rainfall changes associated with pos-
sible climate futures in the southwestern USA have confounding impacts on the range of Pc, suggesting that projections
of future pathogen dynamics and ranges should account for multiple pathways of climate–pathogen interaction.
Keywords: California, climate change, edaphic, multiple stressors, Phytophthora cinnamomi, plant pathogen, rainfall, stochastic
modeling
Received 18 June 2013 and accepted 22 October 2013
Introduction
The potential for warmer temperatures to expand path-
ogen ranges and alter epidemiology is an important
consequence of global climate change for human popu-
lations and the environment (Coakley et al., 1999; Cha-
kraborty et al., 2000; Bergot et al., 2004; Boland et al.,
2004; Garrett et al., 2006; Ibanez et al., 2006; Pautasso
et al., 2010). Plant pathogens influence large-scale forest
mortality events, so understanding their future range
and impacts will assist conservation planning (Allen
et al., 2010; Jactel et al., 2012). Plant pathogens also
impact agricultural production, meaning their response
to climate change threatens global and regional food
security (Chakraborty, 2005; Sutherst et al., 2011).
Pathogens are sensitive to multiple climatic and envi-
ronmental factors, as reflected in the ‘disease triangle’
(Agrios, 2005), a conceptual model that states that dis-
ease is the outcome of the presence of a virulent patho-
gen, a susceptible host, and suitable environmental
conditions. Theoretical and empirical studies address-
ing climate change impacts on plant disease tend to
focus on individual environmental factors such as tem-
perature (Chakraborty, 2005; Garrett et al., 2006;
Thompson et al., 2010), elevated atmospheric carbon
dioxide concentrations (Pangga et al., 2004; Lake &
Wade, 2009; Melloy et al., 2010) and water availability
(Desprez-Loustau et al., 2006; Thompson et al., 2013),
despite the likelihood that climate change will alter
temperature, precipitation, potential evaporation, and
ecological regimes simultaneously. Retrospective
analyses show that multiple environmental drivers and
their interactions influence expansion of disease ranges
(Fabre et al., 2011; Pangga et al., 2011). Understanding
these interactions remains an area of outstanding
research need (Chakraborty, 2005; Pautasso et al., 2012).
Climatic and edaphic factors could limit Phytophthora
cinnamomi (Pc) range in several ways. First, Pc is sensi-
tive to cold temperatures (approaching freezing). Expo-
sure to sufficiently cold temperatures for sufficiently
long durations during winter will kill Pc (Marc�ais et al.,1996). Temperatures warm enough to permit survival
of Pc may still be cold enough to suppress its ability toCorrespondence: Sally Thompson, tel. +1 510 642 1980, fax +1 510
643 5264, e-mail: [email protected]
© 2014 John Wiley & Sons Ltd 1
Global Change Biology (2014), doi: 10.1111/gcb.12463
Global Change Biology

grow, reproduce, and cause disease to hosts (Zentmyer
et al., 1976; Shearer et al., 1987). Previous modeling
studies considering temperature effects on Pc range in
Europe suggest the potential for considerable expan-
sion in warming climates (Brasier & Scott, 1994; Bergot
et al., 2004). However, Pc growth rates also display a
threshold-like response to soil moisture in laboratory
conditions. Dry soils also inhibit reproduction, survival,
dispersal, and development of symptoms in host plants
(Hwang & Ko, 1978; MacDonald & Duniway, 1978;
Nesbitt et al., 1978; Malajczuk & Theodorou, 1979;
Benjamin & Newhook, 1981; Tippett et al., 1987, 1989).
Soil moisture conditions experienced by the pathogen
themselves arise from interactions among the precipita-
tion regime, soil depth, drainage, and atmospheric
evaporative demand, and thus reflect the interplay of
edaphic and climatic conditions. Finally, Pc disease is
also often suppressed in rich soils where organic matter
content exceeds �5% (Broadbent & Baker, 1974; Nesbitt
et al., 1979), probably because of predation by other soil
organisms in the diverse microfaunal communities
sustained in these soils (Weste & Marks, 1987).
Projections of potential future risk therefore require
techniques to assess the impact of multiple environmen-
tal changes and their interactions on pathogen range and
epidemiology. Here, we apply a mechanistic modeling
approach to explore how climate change could impact
pathogen range and activity. We explore how simulta-
neous changes in temperature, precipitation, snow-pack
extent, and evaporative demand might impact the range
of a well-characterized pathogen under different climate
scenarios. To do this we couple two existing models that
describe controls on the range of the generalist root path-
ogen Pc in the state of California and surrounding
regions in the states of Oregon, Nevada, and Arizona in
the southwest USA. Pc occurs in this region (Tidwell
et al., 1984; Swiecki et al., 2003; Garbelotto et al., 2006;
Chavarriaga et al., 2007; Pagliaccia et al., 2011, 2013) but
its range is poorly delineated. In other warm climates
such as southernAustralia andHawaii, Pc has had a dev-
astating effect on timber production, natural forests and
agriculture (Newhook & Podger, 1972; Hwang & Ko,
1978; Weste & Marks, 1987; Balci & Halmschlager, 2003;
Harham, 2005; Judelson & Blanco, 2005; Benson et al.,
2006; J€onsson, 2006). Modeling the climatic and edaphic
limits on its potential range in theUS southwestwill help
determine the risks posed by this pathogen, particularly
since there is not as yet a detailed understanding of the
susceptibility of native species to Pc infection.
Our modeling study aims to address two research
questions:
1. How do climate and edaphic factors limit the poten-
tial range of Pc in the southwestern USA under
climatic conditions representative of the late 20th
century (baseline conditions)? and
2. How do the different modes of Pc response to tem-
perature and soil moisture change this projected
range under plausible future climate scenarios?
Recognizing that observations of Pc in the region pro-
vide an incomplete delineation of the full potential Pc
range, we nonetheless compare the location of known
sites of Pc infection in California to the model predic-
tions, as the most feasible check on the consistency of
the model with observation.
Materials and methods
To address the research questions, we link two existing mod-
els that describe: (i) Pc winter survival probabilities and (ii) Pc
disease severity during the spring growing season (when Pc
typically expands through the root system of host species in
Mediterranean climates such as those in the southwestern
USA; Weste & Marks, 1987). We first model winter soil tem-
peratures. Second, we use the modeled soil temperatures to
estimate Pc survival with an existing, validated survival
model (Marc�ais et al., 1996). Next, we expand a probabilistic
soil moisture model to account for snowpack contributions.
We use the projected soil moisture fluctuations to drive a sto-
chastic pathogen risk model, previously employed to describe
disease range, relative risk on different soil types, and
response to different irrigation regimes at sites in Western
Australia and Oregon (Thompson et al., 2013). The output of
this model is a metric of the likelihood of disease expansion
throughout a hosts’ root system, lying between 0 (no Pc in the
root system) and 1 (complete colonization of the root system).
Fourth, we identify regions with high soil organic content
from the national State Soil Geographic Database (STATSGO)
and Soil Survey Geographic Database (SSURGO) data sets and
exclude these regions from the potential Pc range (Scharwz &
Alexander, 1995). Finally, we compute a relative Pc risk as the
product of the risk of winter survival, absence of suppressive
(organic) soil conditions, and moisture-controlled host coloni-
zation. We apply this modeling framework to baseline
(approximately year 2000) and future (approximately year
2050) climate scenarios across the southwest USA. We repeat
the analyses using high resolution downscaled climate and
soil data for the San Francisco Bay Area (Flint & Flint, 2012),
allowing us to explore the effects of microtopography, orogra-
phy, and fine-grained changes in soil properties, typical of the
California coastline, on the spatial patterns of Pc disease risk
and its projected climate sensitivity.
Data sources
We use three different climate datasets: (i) monthly regional
historical climate observations interpolated to a 140-km2 grid
for the 1950–2000 period (Maurer et al., 2002); (ii) bias-cor-
rected and spatially downscaled National Center for Atmo-
spheric Research Community Climate System Model 3.0
© 2014 John Wiley & Sons Ltd, Global Change Biology, doi: 10.1111/gcb.12463
2 S . E . THOMPSON et al.

(Collins et al., 2006) monthly simulations run for the IPCC A2
(medium-high emissions) and B1 (low emissions) climate sce-
narios on the same 140 9 140 km grid (Cayan et al., 2009; van
Vuuren et al., 2011); and (iii) 30-year average monthly projec-
tions from the Geophysical Fluid Dynamics Laboratory cli-
mate models for the same scenarios, downscaled to a high
resolution (270 9 270 m) grid over the San Francisco Bay area
(Flint & Flint, 2012) for the 1970–2000 and 2035–2065 periods.
To obtain representative climate characteristics, we average
the monthly regional data over 10 year intervals (1990–2000
and 2045–2055). The climate components obtained for each
dataset are summarized in Table 1. We estimate average daily
temperature for the Bay Area climate surfaces as a simple
mean of monthly maximum and minimum temperature; and
estimate the potential evaporation at the southwestern US
scale using the Priestly–Taylor equation.
One of the limitations of this approach lies in the consider-
able uncertainty surrounding the use of downscaled climate
datasets. Our goal in using these high resolution data sets was
to: (i) develop a reasonable baseline drawn from interpolated
observations and (ii) compare this against plausible climate
futures to elucidate the range of potential Pc responses and
how they could manifest themselves at regional scales. We do
not interpret these future cases as predictions or forecasts, but
illustrative scenarios to offer insight into process interactions.
Regional soil data, specifically percentage clay, organic mat-
ter content and soil depth data are derived from STATSGO
(Scharwz & Alexander, 1995). Soil data for the Bay Area are
obtained from the SSURGO datasets (Staff, 2012). Both data
sets derive from soil maps with irregular mapping units rang-
ing from <1 ha in size to >20 000 ha (e.g., for large, homoge-
neous areas such as the submerged portions of San Francisco
Bay). The soil data were thus mapped to the climate grid
scales used for both the Bay Area and the regional scale. We
use tabulated hydraulic parameters (Clapp & Hornberger,
1978) to estimate the properties of the water retention curve
for each soil type on the basis of the percentage clay content,
classifying <10% clay soils as sands, 10–15% clay content as
loamy sands, 15–20% clay contents as sandy loams, 20–40%
clay content as loams and >40% clay contents as clays. Geore-
ferenced locations where Pc has been isolated from natural or
agricultural soils in California were obtained from the
Phytophthora Database (www.phytophthoradb.org), Forest
Phytophthoras of the World (www.foresphytophthoras.org),
and recent literature sources (Jacobs et al., 1997; Elliott et al.,
2010; Swiecki et al., 2011).
Winter survival modeling. Marc�ais et al. (1996) showed that
winter survival of Pc declines as the duration of exposure to
sub-zero temperatures increases, according to the relationship:
I ¼ 1� 1
1þ 14:7� expð0:007PT\0Þ ð1Þ
where ΣT<0 represents the sum of hourly temperatures below
0 °C. Model validation showed that survival projections of
50% or greater corresponded to increases in disease symptoms
in 86% of monitored stems, and no reductions in disease. Con-
versely, lower survival projections lead to reductions in dis-
ease symptoms or healing of previous wounding (Marc�aiset al., 1996). We therefore take survival projections of 50% or
greater as providing an indication of plausible disease range
as constrained by winter temperatures. To determine Pc expo-
sure to these temperatures requires: (i) modeling soil tempera-
ture fluctuations with depth and (ii) estimating the maximum
depth at which Pc occurs.
Several models have been proposed to estimate soil temper-
ature dynamics using typical spatial datasets (Zheng et al.,
1993; Kang et al., 2000). We use a recent version of these mod-
els that accounts for shading of the soil surface by vegetation
and insulation of the soil surface by snow (K€atterer & Andr€on,
2008). This model predicts T (z,t) the temperature of the soil at
depth z and time t, as:
TtðzÞ ¼ Tt�1ðzÞ þ ðTsurf � Tt�1ðzÞÞ � exp �zpKsp
� �1=2 !
� expð�klbLAItÞ: ð2Þwhere Tsurf is the surface temperature, Ks is the thermal diffu-
sivity of the soil, p is a characteristic timescale of thermal fluc-
tuations (in this case equivalent to the number of hours in
1 year), klb is the absorption coefficient associated with soil
shading, and LAI is the leaf area index of local vegetation.
We assume that during winter, the surface temperature is
given by the measured air temperature, that is, Tsurf = Tair,
except where a snow-pack is present to insulate the soil from
air temperature fluctuations. We treat a monthly snow-water
equivalent (SWE) >5 mm as indicating a persistent snowpack.
In these cases, we follow K€atterer & Andr€on (2008) in taking
Tsurf = 0.2Tair. Unfortunately, validation data for snow-cov-
ered surfaces are not available in the study region. The 20%
factor was, however, extensively validated by K€atterer &
Andr€on (2008) in Europe.
Soil thermal diffusivity ksp is computed with the methods of
Peters-Lidard et al. (1998) (details in Appendix) using the
mean soil moisture values computed in Section Pc - soil mois-
ture model to give the percentage saturation of the winter
soils. We calibrate the absorption coefficient klb for the soil
Table 1 Data obtained for the regional and local climate
characterization under baseline and future scenarios (Collins
et al., 2006; Cayan et al., 2009; van Vuuren et al., 2011; Flint &
Flint, 2012)
Scale Datasets Years
Local Temperature
(monthly max and min)
1970–2000,
2035–2065
Potential evaporation
(monthly mean)
Precipitation (monthly mean)
Regional Temperature (monthly mean) 1990–2000,
2045–2055Net radiation (monthly mean)
Relative humidity
(monthly mean)
Snow water equivalent
(monthly mean)
Precipitation (monthly mean)
© 2014 John Wiley & Sons Ltd, Global Change Biology, doi: 10.1111/gcb.12463
CLIMATE CHANGE AND RISK FACTORS FOR PHYTOPHTHORA CINNAMOMI OCCURRENCE 3

temperature model using data from 16 California Irrigation
Management Information System (CIMIS) stations (http://
wwwcimis.water.ca.gov/cimis/) spanning northern to south-
ern California and representing coastal and interior sites.
These stations report temperature data at 15 cm depth, over a
12-year timeframe (2000–2012). Assuming a reference LAI of 3
(K€atterer & Andr€on, 2008), klb is calibrated by minimizing the
mean absolute error in winter temperatures for all 16 stations
(see Table 3), obtaining klb = 0.96.
Finally, we assume that during winter Pc organisms would
preferentially migrate to deep soils that provide a thermal buf-
fer against air temperature fluctuations. Although Pc is typi-
cally located in shallow soils with high plant root densities
(Weste & Law, 1973), it has also been found at depths of up to
75 cm below the surface, when these soil conditions were
more suitable for its growth, reproduction and survival (e.g.,
Shea et al., 1983). We therefore compute the winter soil tem-
perature profiles at the either the maximum soil depth or
75 cm depth, whichever is smaller, and insert these values
into Eqn (2) to estimate Pc survival risk.
Pc - soil moisture model. Thompson et al. (2013) developed a
stochastic model to relate Pc establishment risk to soil moisture
dynamics (the mathematical details of this model are presented
in expanded form in the Appendix). The stochastic soil mois-
ture model of Laio et al. (2001) and its crossing properties as
identified by Porporato et al. (2001) were used to estimate the
frequency with which soil moisture conditions (represented by
s, the relative moisture content, equivalent to the volumetric
water content normalized by the soil porosity) fluctuate around
a ‘critical’ matric potential (or equivalently a critical soil mois-
ture, sc). If the critical potential Ψc is set to the value at which
dry soils inhibit Pc growth (approximately �3000 kPa in sterile
laboratory media; Malajczuk & Theodorou, 1979) then these
fluctuations represent transitions from conditions that allow Pc
growth to conditions that promote host recovery.
There are two challenges in applying Laio’s soil moisture
model to the US southwest. The first is that rainfall along the
US west coast is often more autocorrelated than assumed by
Laio et al. (2001). The second is that interior and montane loca-
tions receive snow as well as rainfall, and that sustained snow
melt provides an important contribution to local soil moisture
dynamics.
We address the first of these challenges by noting that in a
comprehensive sensitivity analysis of the Pc risk model used
here, Pc risk was near-constant along contours of equivalent
mean monthly rainfall (Thompson et al., 2013). Pc risk is thus
insensitive to the details of rainfall arrival at daily timescales,
including deviations from a Poisson-process. This finding also
allows us to directly use model data that forecasts monthly
scale rainfall, without having to assume a model for the rain-
fall occurrence rates and depths. Throughout, therefore, we
assume a rain-day frequency of k = 0.3 (i.e., one rainy day in
every 3 days), and estimate the average rainfall depth as
a ¼ P=k where P is the mean daily rainfall estimated from the
monthly climate data.
In the absence of snow, the soil moisture probability density
function (PDF) is estimated as a function of precipitation rate
and depth (constrained to match the monthly precipitation
totals), potential evaporation, soil depth, and soil properties,
directly following the mathematical formulation in Laio et al.
(2001). The presence of a snowpack invalidates this approach
by generating a long transient condition which cannot be cap-
tured by the steady-state approximation used in deriving the
PDF when soil moisture is controlled by rainfall. It is clear that
if persistent snow-melt occurs then soils will be saturated, that
is, s = 1 during the spring period when a snow-pack is in
place. The simplest, and not far-from realistic approach is to
assume that in any pixel containing a snow-pack with SWE
>5 mm, s = 1, and that the probability of this saturated condi-
tion occurring throughout the spring period is equal to P
(s = 1) = ΣMSWE>5 mm/ΣMSpring, where MSWE>5 mm indicates
the number of months where a snowpack was present, and
MSpring indicates months in the Spring period. The remainder
of the PDF is given by the precipitation-driven soil moisture
conditions, weighted by 1 � P (s = 1). Effectively, this approx-
imation represents the transient conditions of dry-down of the
soil following melting of the snowpack, modified to account
for the probability mass at s = 1. For the purposes of con-
straining the Pc dynamics, the dynamics of this transient con-
dition are not critical, since the snowpack maintains soil in a
wet condition that supports Pc growth during the period after
snowmelt. Thus, this approximation is suitable for the
purposes of Pc range determination.
Independently from the soil moisture PDF, the model incor-
porates a biological component that describes a simplified
host–pathogen interaction. If we assume that the soil water
potential exceeds Ψc, the pathogen colonizes the root zone of
the host plant at a rate rmax. A healthy host has root volume v
which is equal to its upper limit vmax. Infected roots eventually
die, so that in an infected tree, the volume of colonized roots b
lies between 0 (uninfected host) and vmax (root system com-
pletely colonized). Hosts with high resistance to Pc regrow
roots rapidly or resist infection at a rate m (Newhook & Pod-
ger, 1972; Weste & Taylor, 1987), leading to a reduction in b. In
dry soils, the rate of Pc growth is impeded to a ‘drought’ rate
rmin, during which time the host will tend to recover. These
dynamics can be expressed in a one-equation non-dimen-
sional model (Thompson et al., 2013), which reproduces the
dynamics of a more complete two-equation susceptible-
infected (SI) disease model. Here, B = b/vmax, t′ = tm,
Rmax = rmax/m and Rmin = rmin/m, so that the final growth
equation takes the form (Thompson et al., 2013):
dB
dt0¼B R Wð Þ � 1� Bvð Þ;
R Wð Þ ¼Rmax; W[Wc
¼Rmin; W�Wc
ð3Þ
The power v in this equation is set to 100 for computational
purposes: this provides a close approximation to a stepwise
function in which pathogen colonization rates remain constant
until the whole root zone is colonized, and then switches to
zero. Provided Rmin < 1 and Rmax > 1, the steady state condi-
tion of this equation switches when soil is wet (B = 1, the
whole root zone is colonized by Pc) and when soil is dry
(B = 0, no pathogen remains in the system). This satisfies the
© 2014 John Wiley & Sons Ltd, Global Change Biology, doi: 10.1111/gcb.12463
4 S . E . THOMPSON et al.

conditions for applying an analytical solution for the steady-
state PDF of the pathogen extent B as derived by Horsthemke
& Lefever (1984). As shown in Thompson et al. (2013), this
steady state PDF has the form:
p Brð Þ ¼ �N0 Rmax � Rminð ÞBa1 1� Rmax þ Bnð Þa2 1� Rmin � Bnð Þa3ð4Þ
where
a1 ¼ � 1þ fþ
Rmin � 1þ f�
Rmax � 1
� �
a2 ¼ f�
n Rmax � 1ð Þ � 1
a3 ¼ fþ
n Rmin � 1ð Þ � 1
ð5Þ
for B 2 [0,1], where f+ and f� are the frequencies of switching
around the sc condition (and can be obtained directly from the
PDF of s as shown in Porporato et al., 2001), and N′ is a nor-
malization constant chosen such thatR10 pðBÞdB ¼ 1. The
expectation of B, B can also be computed analytically from the
soil, climate and pathogen parameters, and provides a parsi-
monious metric of the risk posed by Pc for a given set of envi-
ronmental and host conditions.
This model allows estimation of the probability of Pc infect-
ing its hosts’ root zone as a function of soil properties, rainfall
statistics and vegetation type. The model was validated for
two case studies in Western Australia and one agricultural case
study in Oregon. Because the long history of Pc in Western
Australia (over 100 years; Shearer et al., 2004) has allowed the
pathogen to spread extensively, and because it has received
detailed attention there and in agricultural settings, the case
studies provide a more comprehensive opportunity to validate
the ecohydrological model than the comparison with Califor-
nian data made in this study. Therefore, we briefly report the
findings from these three case studies: (i) all 27 locations with
established Pc disease reported by the Centre for Phytophthora
Science and Management (http://www.cpsm.murdoch.edu.
au/), across the approximately 1000 km by 1000 km south-
western region of Western Australia coincide with regions
where B� 0:5, and 23 of 27 occur in regions where B� 0:8, sug-
gesting a rate of Type 2 (predicting no Pc when Pc was in fact
present) errors in the range of 0–15%; (ii) examination of dis-
ease frequency on contrasting soil types in an intensively mon-
itored Pc affected 5 95 km forest plot (Batini & Hopkins, 1972)
lead to a model prediction that Pc would occur two times as
frequently on clay soils than on sandy soil; observations
showed that Pc actually occurred 1.9 times as frequently on
clay soils than on sandy soils; and (iii) Finally, the model repro-
duced the near-linear increase in Pc disease severity from 20%
to 60% root destruction on irrigated blueberries as the irriga-
tion rate was increased from 0.5 to 1 to 1.5 times evaporative
demand (Bryla & Linderman, 2007). Details of these validation
exercises are reported in Thompson et al. (2013).
Application to the southwest USA
The southwestern USA contains a climatically, geologically,
and biologically diverse set of landscapes (Torregrosa et al.,
2013). Climatically, the region encompasses cool, humid, oce-
anic climates near the coast, arid interior valleys and deserts
with continental climates, and montane and nivial uplands in
the Sierra Nevada mountain ranges. Precipitation tends to be
highly seasonal with the majority falling during a 4-month
period from December to March. The diversity of climatic
types is reflected in the diversity of terrestrial vegetation,
with important vegetation communities including coastal
rainforests, dry chapparal, Mediterranean oak savannas,
montane forests, and subalpine regions (Barbour et al., 2007).
Within the study area, the California Floristic Province is rec-
ognized as a biodiversity hotspot (Myers et al., 2000), and the
state is home to over 7600 plant species (Baldwin et al., 2012).
The San Francisco Bay Area, which is used as a higher resolu-
tion case study maintains much of the same complexity of cli-
mate, geology, and biology, due to strong ocean-inland
gradients in temperature and annual precipitation (Gilliam,
2002), and the activity of various tectonic faults in the region
(Sloan, 2005).
The diversity of climate and soil types in the study area
can be directly parameterized within the stochastic soil mois-
ture and pathogen models. Note that we have allowed spatial
variations in evaporative demand to be driven by radiation,
temperature, and humidity (via the Priestly–Taylor equation),
and have not incorporated an explicit treatment of varying
vegetation cover on Emax. The rationale for this lies in the fact
that surface conductance (the physical term describing the
effect of leaf area on evapotranspiration) loses sensitivity to
LAI for low humidity (characteristic of the region) and
LAI > 2, suggesting that the first order controls on Emax vari-
ation lie in energy limitation rather than vegetation character-
istics (Leuning et al., 2008). The diversity of the vegetation
also presents a challenge for parameterization of the patho-
gen dynamics in the model. It is clearly not feasible to param-
eterize specific host resistance terms for Pc for all 7600
vascular plant species in the study area; furthermore assess-
ments of susceptibility of the native vegetation to Pc are strik-
ingly incomplete, and remain insufficiently quantitative to
allow a direct comparison to be made. The problem is similar
to applying this model to Pc in Western Australia, where far
more work on Pc susceptibility has been performed. In that
comparably biodiverse landscape, 3084 of the 5710 native
plant species were found to be susceptible or highly suscepti-
ble to Pc infection (Shearer et al., 2004). This determination,
however, required intensive surveys of native vegetation in
representative habitats, as well as comparative inoculation
greenhouse trials (Shearer et al., 2004), and still provides only
qualitative information about the relative vulnerability of host
plants. No comparable investigations have as yet taken place
in the US south west, although numerous common native
species are known to be vulnerable to Pc, including manza-
nita species (Swiecki et al., 2003), chapparal species (e.g.,
Ceanothus sp.), Monterey pine, sycamore, western sword fern,
coast live oak (Farr & Rossman, 2013), bay laurel and
madrone (Fichtner et al., 2010). In the absence of detailed
observations of host–pathogen interactions for the diversity
of species in Western Australia, we explored climate limita-
tions on range using a combination of: (i) laboratory estimates
© 2014 John Wiley & Sons Ltd, Global Change Biology, doi: 10.1111/gcb.12463
CLIMATE CHANGE AND RISK FACTORS FOR PHYTOPHTHORA CINNAMOMI OCCURRENCE 5

of Pc growth rates in sterile media and (ii) host resistance
parameters (m) taken from a moderately susceptible host (the
eucalyptus species Jarrah, Eucalyptus marginata) and esti-
mated to be 0.1 day�1 (Thompson et al., 2013). We have
repeated this approach for the US southwest with the follow-
ing rationalizations: (i) moderately susceptible host dynamics
ensure that climate effects are clear. For highly susceptible
hosts, climatic drivers are relatively unimportant, since any
serendipitous infection is likely to lead to mortality. For
unsusceptible hosts, climate is equally unimportant. Thus to
explore the impacts of climate change, moderately susceptible
host assumptions are sensible; (ii) Evidence from infections of
common tree species (oaks, laurels, madrone) suggests that
the hosts are indeed moderately susceptible to Pc, with infec-
tions most common in wet areas (Garbelotto et al., 2006;
Fichtner et al., 2010) and mortality commonly associated with
concurrent pest or drought stress (Fichtner et al., 2010); (iii)
for the sake of identifying climate sensitivity specifically,
holding host vulnerability constant across the study area pro-
vides a useful control, and in the absence of more detailed
information, is the most parsimonious modeling approach.
As a check on the impacts of this assumption, we have also
evaluated the sensitivity of the model results to a doubling or
halving of host resistance.
The biological parameters Rmax and Rmin were estimated
from the assumed value of m = 0.1 and laboratory observa-
tions of rmin and rmax. Pc growth rates in sterile media at 25 °Cwere 0.46 day�1 under well-watered conditions (rmax), and
0.07 day�1 under dry conditions (rmin) (Malajczuk & Theodo-
rou, 1979). Because the US southwest contains a large range in
temperature due to strong marine effects near the coast, conti-
nentality inland, and large mountain ranges, we extended the
definition of rmin and rmax to incorporate temperature depen-
dence. Shearer et al. (1987) noted that growth rates of Pc var-
ied linearly with temperature, and found that growth declined
to zero at T = 4.9 °C. We therefore fit linear relationships
between the values of rmin and rmax obtained by [45] at 25 °Cand assumed values of 0 at T = 4.9 °C, obtaining:
rmax ¼ �0:1122þ 0:023T; ð6Þ
rmin ¼ �0:171þ 0:0035T; ð7Þwhere T is the ambient temperature experienced by Pc in °Cand is assumed here to be equal to the average air tempera-
ture.
We force the modified Laio model (Section Pc - soil mois-
ture model) with the data outlined in Data Sources section and
Table 1 estimate the soil moisture PDF. The contribution of the
climate factors to the development of a mean soil moisture
map for the region is illustrated in Fig. 1. We then estimate
the biological parameters using the different surface tempera-
ture conditions. Then, we estimate the PDF of the Pc coloniza-
tion extent with Eqn (4). We interpret the mean colonization
extent as being proportional to the risk posed by Pc to host
vegetation during its most active period in spring. We com-
pute this risk during 2–3 month periods in spring: March to
May and April to June, recognizing that warmer temperatures
for the later period might be offset by reduced water availabi-
lity, and vice versa, and take the total risk as the maximum
experienced at any pixel during these two periods.
Risk estimates
In addition to spatially distributed estimates of the mean Pc
colonization extent (RiskRainfall) and survival probability
(RiskWinterSurvival), we also generate a surface, RiskSoil account-
ing for the effect of soil type on Pc risk. On the basis of litera-
ture thresholds for organic matter content in soils that
suppress or do not suppress Pc, we set RiskSoil = 1 in soils
where organic matter content was less than 5%, and
RiskSoil = 0 for higher organic matter soil types (Broadbent &
Baker, 1974; Nesbitt et al., 1979; Weste & Marks, 1987). This
surface thus allows us to account for the dramatic reduction of
Pc risks on organic-rich soils. In practice, however, the extent
of these soil types in the study area was limited: less than 1%
of the terrestrial soils in the Bay Area were suppressive by
T, oC Monthly rainfall, mm Mean relative water content, sNet radiation, Wm–2
Relative humidity, % Mean EP, mm day–1 SWE, mm
20
10
0
30025020015010050
7060504030
0.4
0.3
0.2
0.1
140
100
60
20
120010008006004002000
1
0.8
0.6
0.4
0.2
0
Fig. 1 Climatic factors that contribute to the soil moisture probability density functions (PDFs) across the state for the 1990–2000 cli-
mate conditions, averaged for the March to May period. Panels show the climatic components that contribute to the potential evapora-
tion [temperature (T), relative humidity and net radiation], the resulting estimate of potential evaporation (mean EP) using the
Priestly–Taylor equation, and the March snow-water equivalent (SWE). The panel on the right indicates the computed mean soil mois-
ture (derived from full PDF estimates for each pixel) for the same period. There is a clear contribution of snowmelt that increases soil
moisture toward saturation in the presence of snow cover. Desert features such as California’s Central Valley and Arizona’s deserts are
clearly distinguished by the low soil moisture probabilities. Fine-scale variations in predicted soil moisture content also arise due to
spatial differences in soil depth and clay content.
© 2014 John Wiley & Sons Ltd, Global Change Biology, doi: 10.1111/gcb.12463
6 S . E . THOMPSON et al.

these metrics, and less than 2% of the soils in the whole study
area. Thus, controls on Pc due to organic soils were limited.
To develop a metric of the total risk, we simply take the
product of the three risk components:
RiskTotal ¼ RiskRainfall � RiskSoil � RiskWinterSurvival ð8ÞAreas where Risk ⟶ 1 have suitable thermal, moisture and
soil organic matter conditions to support Pc. Areas where Risk
⟶ 0 are inhibited by spring being too dry, winter being too
cold, the soil being too rich or a combination of these factors,
and are thus at low risk of Pc infection. Based on our previous
analysis of Pc distribution in Western Australia, where Pc risk
was solely controlled by water availability (i.e., Risksoil = 1
and Risksurvival = 1), Risk � 0.5 delineates the limits of the Pc
range. We then compare the projected risk maps for contem-
porary conditions in the southwest US and the Bay Area to the
observed locations of Pc infection. Although these compari-
sons cannot identify false positives (regions where the model
over-predicts the Pc risk), it does allow us to identify false neg-
atives (i.e., regions where the model underestimates Pc risk).
Results
The model results are presented graphically in Figs 2
and 3 for the southwestern USA and for the Bay Area,
respectively, for all climate scenarios. The spatial ranges
over which there is an increase/decrease in Pc risk due
to winter survival and spring Pc activity are also shown
in Table 2. These results are discussed below in the
light of the two guiding research questions.
How do climate and edaphic factors limit the potentialrange of Pc in the southwestern USA undercontemporary conditions?
Winter survival. Predictions of winter survival of Pc are
contingent on the performance of the soil temperature
model. The error statistics for its application to the 16
CIMIS stations are shown in Table 3. The mean abso-
lute error is 1.7 °C, and the mean total error is (�0.6 °).These errors lead to uncertainty in the projected winter-
survival range of approximately �3.5%, suggesting that
the survival model predictions are robust to the error in
the temperature model. This robustness reflects the fact
that the survival probabilities depend on both thresh-
old dynamics and cumulative temperatures. Absolute
errors in temperature model predictions therefore tend
to compensate for each other in the survival model.
Winter survival predictions for the whole southwest
area are shown in the top row of plots in Fig. 2 and are
listed in Table 2. Under contemporary conditions, win-
ter survival is plausible over an approximately
536 000 � 18 000 km2 area, or 43 � 1.5% of the region.
Applying the soil temperature model to the Bay Area
indicates that 100% winter survival is likely under
current conditions, which generate only occasional sub-
zero temperatures.
Soil moisture and pathogen activity. The predicted Pc risk
based on its spring activity is illustrated in the second
row of plots in Fig. 2 and is listed in Table 2. The spa-
tial pattern of elevated Riskrainfall reflects both the pat-
tern of soil moisture availability and of spring
temperatures (illustrated in Fig. 1). Approximately
327 000 km2 of the study area (26%) is sufficiently
warm and wet during the spring to support a high level
of Pc activity.
In the San Francisco Bay Area, the pattern of RiskTotalexhibits fine-scale spatial heterogeneity, which, given
the low occurrence of organic soils and the 100% winter
survival rate, may be attributed to fine-scale heteroge-
neity in RiskRainfall (see Fig. 3). Much of this heteroge-
neity arises due to highly variable spatial soil
properties. The major soil types follow a strongly aniso-
tropic pattern in parent material that is aligned along
the northwest–south-east direction of the major tectonic
faults that occur in the region. Layered onto this hetero-
geneity is a markedly orographic rainfall pattern, with
1
0.8
0.6
0.4
0.2
0
1990–2000 2045–2055 B1 2045–2055 A2
1250 km
RiskSurvival
RiskRainfall
RiskTotal
Risk
leve
l
Fig. 2 The contributing, climate-driven and cumulative risk fac-
tors for Phytophthora cinnamomi (Pc) shown for the whole study
area in California, Oregon, Nevada and Arizona. Columns of
plots indicate the model predictions of risk under different cli-
mate scenarios. The rows of figures relate to the changing risk
of Pc surviving over winter (RiskSurvival, top), or Pc receiving
sufficiently warm and wet spring conditions to pose a risk to
hosts with moderate susceptibility (RiskRainfall, middle) and the
areas in which all of winter survival, spring conditions and non-
suppressive soil conditions suggest Pc could potentially exist
(RiskTotal, bottom). The legend is applicable to all plots, as the
risk levels in each case are valued in the range 0–1.
© 2014 John Wiley & Sons Ltd, Global Change Biology, doi: 10.1111/gcb.12463
CLIMATE CHANGE AND RISK FACTORS FOR PHYTOPHTHORA CINNAMOMI OCCURRENCE 7

the highest rainfall occurring on the marine side of the
coastal ranges. Near the coast, Pc risk tends to increase
with temperature, with the median risk increasing from
0.25 to 0.75 as temperature increases from 11 °C to
12.4 °C. Further inland, Pc risk plateaus and then
declines with further temperature increases, reflecting
the correlation between temperature and water stress
once coastal influences wane.
Given the uncertainty associated with the estimated
vegetation parameters, the soil moisture and pathogen
activity modeling for the 1990–2000 period was repeated
using the assumption that: (i) vegetation susceptibility
was doubled (m = 0.05) and (ii) vegetation susceptibility
was halved (m = 0.2). In case (i) we found that the over-
all spatial pattern of Pc risk was similar, but that in some
regions where we projected no Pc risk for moderately
susceptible vegetation, we would now project minor
risks (RiskRainfall � 0.25) for the more sensitive vegeta-
tion. The overall range where RiskRainfall > 0.5 increased
by 14%, or some 5% of the study region – comparable to
the error associated with the soil temperature model.
Comparable reductions in the range of Pc were found
for case (ii) where the pattern of Pc risk was again main-
tained, but areas where we had projected low risk for
moderately susceptible vegetation were not at risk for
the resistant vegetation. The overall range where
RiskRainfall > 0.5 decreased by 14%, or 5% of the study
region, again comparable to the error due to the soil
1990–2000 2045–2055 B1 2045–2055 A21816141210
150
100
50
0
10.80.60.40.20
PPT (mm month–1)
RiskTotal
°Cm
m m
onth
–1Ri
sk le
vel
T°C
Fig. 3 Climate factors and projected Phytophthora cinnamomi
(Pc) risk for the San Francisco Bay Area. The columns of plots
indicate the different climate scenarios used in the modeling.
The rows indicate the projected changes in mean spring temper-
ature (T°C, top), mean monthly spring rainfall (PPT, middle)
and the estimated Pc risk (RiskTotal, bottom). Note that because
Pc survives winter in the Bay Area in all scenarios, and high car-
bon soils are not prevalent, RiskRainfall � RiskTotal in this area.
Table 2 Spatial range of Phytophthora cinnamomi (Pc) in terms of projected total risk Risktotal, risk of winter survival Risksurvival,
and risk during the spring season (Riskrainfall) for the three climate scenarios at regional scales (an approximately 1000 by 1000 km
area covering California and portions of neighboring states) and for the Bay Area (an approximately 150 by 150 km area covering
the San Francisco Bay, stretching inland to Livermore, north to Napa and south almost to Santa Cruz). Figures given in parentheses
indicate the percentage of the modeled domain represented by the given areas. To illustrate the complex interactions between
temperature and water availability that govern the dynamic risk of Pc during spring growth, the area in which risk increases
(RiskRainfall↑) and decreases (RiskRainfall↓) for each climate scenario is also shown
Scale Scenario
RiskTotal > 0.5
9 105 km2
RiskSurvival > 0.5
9 105 km2
RiskRainfall > 0.5
9 105 km2
RiskRainfall↑9 105 km2
RiskRainfall↓9 105 km2
Regional 1990–2000 1.97 (15.6%) 5.36 (42.6%) 3.27 (25.9%)
2045–2055 B1 1.63 (13.0%) 8.21 (65.0%) 2.23 (17.7%) 3.90 (30.1%, 0.06↑) 4.01 (31.8%, 0.26↓)2045–2055 A2 1.74 (13.7%) 9.07 (71.8%) 2.20 (17.4%) 4.73 (37.3%, 0.08↑) 3.39 (26.7%, 0.28↓)
Scale Scenario Risk > 0.5
km2
RiskSurvival > 0.5
km2
RiskRainfall > 0.5 RiskRainfall↑km2
RiskRainfall↓km2
Bay Area 1970–2000 5384 (52.0%) 10 000 (100%) 5384 (52.0%)
2035–2065 B1 6514 (63.0%) 10 000 (100%) 6514 (63.0%) 817.4 (7.91%) 6 (0%)
2035–2065 A2 3785 (36.6%) 10 000 (100%) 3785 (36.6%) 4.67 (0%) 1174 (11.4%)
Table 3 Error statistics compiled for running the soil temper-
ature model for 16 CIMIS stations located across California.
Stations include: Bishop, Calipatria/Mulberry, San Luis
Obispo, Buntingville, Alturas, King City-Oasis Road, Victor-
ville, Madera, Belridge, Otay Lake, Camarillo, Union City,
Owens Lake South, Cadiz Valley, Woodland, Plymouth
Error metric
Mean
error
Error
standard
deviation
Mean absolute error 1.68 0.66
Mean error �0.66 1.31
© 2014 John Wiley & Sons Ltd, Global Change Biology, doi: 10.1111/gcb.12463
8 S . E . THOMPSON et al.

temperature model. Thus, the relative change in Pc risk
is: (i) significantly damped compared to relative change
in host susceptibility and (ii) larger but comparable to
other sources of error in the predictions.
Total contemporary Pc Risk. The contemporary area
where RiskTotal exceeds 0.5 covers 197 000 km2 of the
southwestern USA, or approximately 16% of the study
region. Pc’s potential range in the Bay Area covers
approximately 52% of the terrestrial surface, some
5384 km2. Note that the pixel in the regional model that
corresponds to the Bay Area has RiskTotal = 1: the regio-
nal scale pixels do not account for spatial patterning
within pixels. The total range of Pc is therefore likely to
be overstated by the regional model due to small-scale,
site-specific factors relating to orography, microclimate,
and soil type.
Figure 4 presents a comparison of the estimated Pc
risk under contemporary conditions with twelve loca-
tions in the state of California where Pc has been posi-
tively identified from soil baiting and diseased plants.
Recently, Pc was also identified in a number of loca-
tions around the Bay Area, allowing a higher resolution
comparison between observations and predicted risk to
be made in this area. With one exception, all the
observed occurrences of Pc are located in sites where
the predicted risk levels were 0.8–1. The one site
located in a region where we predicted negligible Pc
risk is located within the Imperial Valley, an exten-
sively irrigated agricultural region with an otherwise
desert climatology. Thus, depending on how the Impe-
rial Valley site is treated, the rate of Type 2 errors from
the model was 0–8%. Although the number of sites
where this comparison could be made was limited, the
probability of randomly selecting 11 of 12 locations
with RiskTotal ≥ 0.8 is less than one in 107 across the
whole model domain, and less than one in 104 for Cali-
fornia specifically.
How do the different modes of Pc response to temperatureand soil moisture change its projected range underplausible future climate scenarios?
The effects of a warming climate on Pc risk vary
depending on the risk factors and specific climate sce-
nario being assessed. Warming changes winter survival
in a straightforward fashion: under the A2 scenario sur-
vival increases dramatically so that the region in which
more than half of a Pc population would survive the
winter increases from 43% (contemporary) to 72% of
the study area. More modest increases in winter-sur-
vival probabilities arise under the B1 climate scenario,
in which Pc winter survival becomes probable over
65% of the study area (Table 2).
The effects of climate change on soil moisture and Pc
spring activity are more complex. At the regional scale,
climate change reduces the risk posed by Pc (Fig. 2)
across the majority of the study area. However, the
changes are spatially variable. Pc risk declines mark-
edly in the Central Valley. It is largely unchanged in
coastal northern California and Oregon, where rainfall
levels are projected to remain high. Its range is also
unchanged in the south-eastern part of the region,
which is significantly water limited under contempo-
rary scenarios and projected to remain so. Pc risk
increases in the north-eastern extent of the study area.
The increase in Pc risk in this area is greatest in the high
emissions scenario. In the lower emissions scenario,
comparable increases in Pc extent occur inland in the
southern extent of the range. In both cases, these
increases indicate an interaction of warmer tempera-
tures with unchanged or slightly enhanced rainfall.
The potential complexity of the interactions between
changing water and temperature in one of these south-
ern locations is illustrated in Fig. 5 for a site in the
southwestern part of the region. In this location, Pc risk
increases under the B1 scenario but decreases under the
A2 scenario. Figure 5 shows a decomposition of the
projected changes into those due to temperature and
those due to changes in soil moisture. As shown,
increasing temperatures increase Pc risk from the base-
line case for both A2 and B1 scenarios, but in the A2
scenario, a decrease in soil moisture more than offsets
the effect of warmer spring conditions. Conversely,
under the B1 conditions, the slight increase in soil mois-
ture increases pathogen risk at this location, but only
when both temperature and soil moisture increase
1
0.8
0.6
0.4
0.2
0
Risk
leve
l
(a) (b)
Fig. 4 Plot of observed Phytophthora cinnamomi (Pc) infection in
CA (circles, red online, gray in print) overlaid on 1990–2000
(contemporary) risk projections at the scale of the southwest
region and the scale of the San Francisco Bay Area. With the
exception of a single site within the irrigated Imperial Valley,
the observed Pc infection locations occur where the model indi-
cates that RiskTotal = 0.8–1.0 (Jacobs et al., 1997; Swiecki et al.,
2003, 2011; Garbelotto et al., 2006; Rizzo & Fichtner, 2007; Elliott
et al., 2010; Fichtner et al., 2010)
© 2014 John Wiley & Sons Ltd, Global Change Biology, doi: 10.1111/gcb.12463
CLIMATE CHANGE AND RISK FACTORS FOR PHYTOPHTHORA CINNAMOMI OCCURRENCE 9
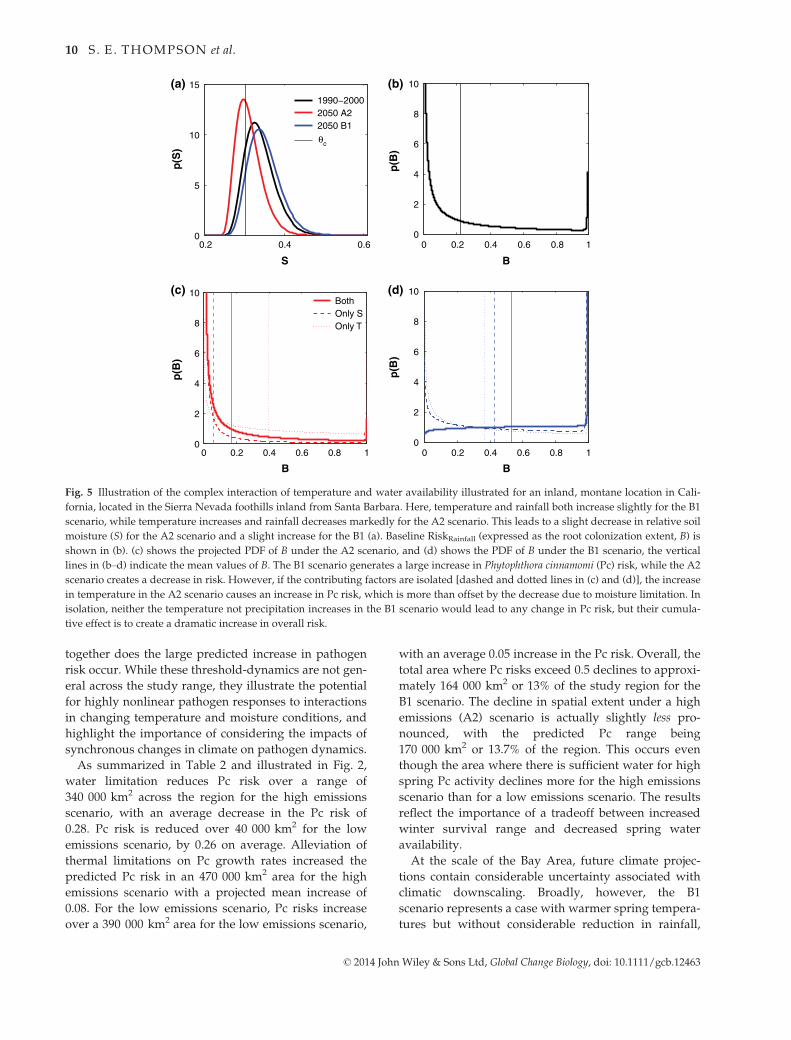
together does the large predicted increase in pathogen
risk occur. While these threshold-dynamics are not gen-
eral across the study range, they illustrate the potential
for highly nonlinear pathogen responses to interactions
in changing temperature and moisture conditions, and
highlight the importance of considering the impacts of
synchronous changes in climate on pathogen dynamics.
As summarized in Table 2 and illustrated in Fig. 2,
water limitation reduces Pc risk over a range of
340 000 km2 across the region for the high emissions
scenario, with an average decrease in the Pc risk of
0.28. Pc risk is reduced over 40 000 km2 for the low
emissions scenario, by 0.26 on average. Alleviation of
thermal limitations on Pc growth rates increased the
predicted Pc risk in an 470 000 km2 area for the high
emissions scenario with a projected mean increase of
0.08. For the low emissions scenario, Pc risks increase
over a 390 000 km2 area for the low emissions scenario,
with an average 0.05 increase in the Pc risk. Overall, the
total area where Pc risks exceed 0.5 declines to approxi-
mately 164 000 km2 or 13% of the study region for the
B1 scenario. The decline in spatial extent under a high
emissions (A2) scenario is actually slightly less pro-
nounced, with the predicted Pc range being
170 000 km2 or 13.7% of the region. This occurs even
though the area where there is sufficient water for high
spring Pc activity declines more for the high emissions
scenario than for a low emissions scenario. The results
reflect the importance of a tradeoff between increased
winter survival range and decreased spring water
availability.
At the scale of the Bay Area, future climate projec-
tions contain considerable uncertainty associated with
climatic downscaling. Broadly, however, the B1
scenario represents a case with warmer spring tempera-
tures but without considerable reduction in rainfall,
0.2 0.4 0.60
5
10
15
S
p(S
)
0 0.2 0.4 0.6 0.8 10
2
4
6
8
10
B
p(B
)
0 0.2 0.4 0.6 0.8 10
2
4
6
8
10
B
p(B
)
1990−20002050 A22050 B1
θc
0 0.2 0.4 0.6 0.8 10
2
4
6
8
10
B
p(B
)
BothOnly SOnly T
(b)(a)
(d)(c)
Fig. 5 Illustration of the complex interaction of temperature and water availability illustrated for an inland, montane location in Cali-
fornia, located in the Sierra Nevada foothills inland from Santa Barbara. Here, temperature and rainfall both increase slightly for the B1
scenario, while temperature increases and rainfall decreases markedly for the A2 scenario. This leads to a slight decrease in relative soil
moisture (S) for the A2 scenario and a slight increase for the B1 (a). Baseline RiskRainfall (expressed as the root colonization extent, B) is
shown in (b). (c) shows the projected PDF of B under the A2 scenario, and (d) shows the PDF of B under the B1 scenario, the vertical
lines in (b–d) indicate the mean values of B. The B1 scenario generates a large increase in Phytophthora cinnamomi (Pc) risk, while the A2
scenario creates a decrease in risk. However, if the contributing factors are isolated [dashed and dotted lines in (c) and (d)], the increase
in temperature in the A2 scenario causes an increase in Pc risk, which is more than offset by the decrease due to moisture limitation. In
isolation, neither the temperature not precipitation increases in the B1 scenario would lead to any change in Pc risk, but their cumula-
tive effect is to create a dramatic increase in overall risk.
© 2014 John Wiley & Sons Ltd, Global Change Biology, doi: 10.1111/gcb.12463
10 S . E . THOMPSON et al.

while the A2 scenario represents a situation with
reduced rainfall and warmer temperatures. As shown
in Fig. 3, the effects are quite striking: an increase in
temperature without a large decrease in rainfall results
in an increase in the area that is vulnerable to Pc
by approximately 20% (from approximately 5300–6500 km2). Conversely, a decline in rainfall and
increase in temperature result in a large decline in Pc
risk, to approximately 3800 km2, about half of its
contemporary range.
Discussion
The modeling study indicated four different controls
on modeled Pc range, which interacted to generate
complex spatial patterns of Pc response to projected cli-
matic changes. The first control was the proportion of
soil organic carbon, which provided a static template of
(isolated and restricted) areas in which Pc would not
establish. The second control was winter temperatures
which impede pathogen over-winter survival. The
range over which the pathogen survived winter
expanded sequentially from contemporary conditions
to the B1 and then A2 climate scenarios. The third and
fourth controls on pathogen range lay in spring temper-
ature and rainfall which together controlled spring Pc
activity. Declining precipitation in the B1 and A2 sce-
narios inhibited Pc growth. The implications of drier
climatic conditions in the study area varied depending
on the absolute local Pc risk in a given area. Thus, little
change in Pc risk was predicted in wet regions such as
the northern coast, where drier spring conditions under
B1 and A2 climate futures were still wet enough to sup-
port Pc activity. In the driest limits of the current Pc
range, contemporary rainfall was too limited to support
Pc activity, and further drying of the climate under B1
and A2 scenarios did not alter the pathogen risk. In
mesic regions, progressively dry springs reduced over-
all Pc risk under the B1 scenario, relative to contempo-
rary conditions. Despite further reductions in rainfall
under the A2 scenario, however, only minor further
decreases in Pc spring risk were predicted compared to
the B1 scenario. This we attribute to increasing spring
temperatures enhancing the rate of Pc expansion dur-
ing spring, which increased disease risk over part of
the model range. The spatial locations where warmer
spring temperatures under the B1 and A2 scenarios
caused increases in Pc risk were spatially separated
from the locations where decreases in rainfall reduced
Pc risk, so the overall pattern of Pc risk during spring
under contemporary, B1 and A2 scenarios differs: the
B1 case primarily reflects reductions in the contempo-
rary area of high risk, while the A2 scenario continues
this reduction but also leads to expanded regions of
moderate Pc risk in the north-eastern part of the study
region. The interactions of these controls lead to a
decrease in Pc range under both B1 and A2 scenarios
compared to contemporary conditions, but, surpris-
ingly, less of a reduction in total Pc range under the
more extreme warming scenario.
The modeling study ignored several factors that
impact dynamic Pc risk – that is, the risk of Pc develop-
ing in uninfected areas. It has not considered pathways
of introduction of Pc into natural communities. Proxim-
ity to roads, streams, soil disturbance, innoculum
sources, and high vehicle or pedestrian traffic are
highly likely to impact these risks. Similarly, the diver-
sity of Californian vegetation and its variable sensitivity
to Pc has not been considered: higher resolution studies
considering differentials of vegetation susceptibility
could provide a far more nuanced picture of the spatial
extent of Pc, and could, for instance, eliminate areas of
risk in primarily urbanized environments in the San
Francisco Bay Area. However, in the absence of
improved data regarding host–pathogen interactions
for dominant vegetation types in the area, there is lim-
ited basis on which to make such a high-resolution
suite of assumptions about vegetation susceptibility.
Despite this missing information, the damped sensiti-
vity of Pc range relative to changes in assumed host
resistance across the region in conjunction with field
observations confirming that a wide range of regional
species are susceptible to Pc, suggests that the overall
conclusions of the modeling study regarding climate
sensitivity should be robust. Finally, we have assumed
that the local environmental conditions experienced by
Pc are determined solely by climate, which is not true
in the irrigated agricultural areas in California’s Central
and Imperial Valleys. In these regions, irrigation
regimes that are sufficiently frequent to sustain high
water potentials in the root zone would alleviate the
environmental water stress, as indicated by the obser-
vation of Pc occurrence within the Imperial Valley. If
water stress is alleviated in these regions, temperatures
are warm enough in both winter and spring to support
high levels of Pc activity. Thus, irrigated agricultural
land should be considered at risk of Pc infestation
under both present and future scenarios.
Overall, the modeling analysis suggests that Pc has a
much larger potential range in the US southwest than
could be inferred purely from current observations of
the locations of infected sites. At present, despite the
high awareness of Phytophthora ramorum and sudden
oak death in the US southwest, there is limited public
awareness, policy or scientific attention given to Pc
(Swiecki et al., 2011). Sources of Pc are known to exist
in agricultural and nursery settings in California
(including nurseries supplying native plants that are
© 2014 John Wiley & Sons Ltd, Global Change Biology, doi: 10.1111/gcb.12463
CLIMATE CHANGE AND RISK FACTORS FOR PHYTOPHTHORA CINNAMOMI OCCURRENCE 11

used for revegetation, and could therefore export the
disease into native ecosystems), and appear to be the
source of Pc infection in native ecosystems in several
cases (Zentmyer, 1980; Swiecki et al., 2011). However,
no current phytosanitation certification programs, pro-
tocols for reducing soil movement from infected to
clean sites, or recognized successful spot treatment
approaches to minimizing Pc spread are in place in Cal-
ifornia (Dunstan et al., 2009; Swiecki et al., 2011). While
the number of native species in California that are sus-
ceptible to Pc remains unclear, estimates in comparably
biodiverse southwestern Australia suggest that over
3000 of the 5700 indigenous plant species are suscepti-
ble (Shearer et al., 2004). Pc has already demonstrated
its potential to reshape plant communities and entire
ecologies (Garkaklis et al., 2004). In the absence of
detailed information about host susceptibility in Cali-
fornia, the large ranges that appear to be supported by
contemporary climates in conjunction with the severe
effects of Pc in comparable ecosystems point to a critical
need to improve risk assessment, phytosanitation and
awareness of Pc disease.
Despite its relatively simple ecology, Pc nonetheless
displays non-monotonic responses to climatic warming
at regional and local scales, with spatially distinct
regions having opposite trends in Pc risk. Although the
modeling framework presented accounts for many dif-
ferent aspects of climate, other changes including car-
bon fertilization due to enhanced atmospheric [CO2],
changing land use and ecological thresholds have been
neglected, and linking disease risk models to ecosystem
outcomes remains challenging. For example, in Wes-
tern Australia a 40 year drying trend has reduced Pc
activity, but with the effect of replacing Pc induced
mortality with drought stress stress (Brouwers et al.,
2013). Considering that Pc mortality is linked to periods
of drought stress that follow wet periods in which Pc
causes root damage (Desprez-Loustau et al., 2006), limi-
tation of Pc range due to drying, while beneficial for
limiting expansion of the pathogen, may come at the
expense of increased mortality for infected ecosystems.
Acknowledgements
Support from the National Science Foundation (NSF EAR-1013339) is acknowledged.
References
Agrios G (2005) Plant Pathology. Elsevier Academic Press, San Diego, CA.
Allen CD, Macalady AK, Chenchouni H et al. (2010) A global overview of drought
and heat-induced tree mortality reveals emerging climate change risks for forests.
Forest Ecology and Management, 259, 660–684.
Balci Y, Halmschlager E (2003) Incidence of Phytophthora species in oak forests in
Austria and their possible involvement in oak decline. Forest Pathology, 33,
157–174.
Baldwin B, Goldman D, Keil D, Patterson R, Rosatti T, Wilken D (2012) The Jepson
Manual: Vascular Plants of California (2nd edn). University of California Press,
Berkeley, CA.
Barbour M, Keeler-Wolf T, Shoenheer AA (2007) Terrestrial Vegetation of California.
University of California Press, Berkeley, CA.
Batini F, Hopkins E (1972) Phytophthora cinnamomi rands – a root pathogen of the Jar-
rah forest. Australian Forestry, 36, 57–68.
Benjamin M, Newhook F (1981) Effect of glass microbeads on Phytophthora zoospore
motility. Transactions of the British Mycological Society, 78, 43–46.
Benson D, Grand L, Veria C, Gottwald T (2006) Temporal and spatial epidemiology
of Phytophthora root rot in Fraser Fir plantations. Plant Disease, 90, 1171–1180.
Bergot M, Cloppet E, Perarnaud V, Deque M, Marcais B, Desprez-Loustau ML (2004)
Simulation of potential range expansion of oak disease caused by Phytophthora cin-
namomi under climate change. Global Change Biology, 10, 1539–1552.
Boland G, Melzer M, Hopkin A, Higgins V, Nassuth A (2004) Climate change and
plant diseases in Ontario. Canadian Journal of Plant Pathology, 26, 335–350.
Brasier CM, Scott JK (1994) European oak declines and global warming: a theoretical
assessment with special reference to the activity of Phytophthora cinnamomi. EPPO
Bulletin, 24, 221–232.
Broadbent P, Baker K (1974) Behaviour of Phytophthora cinnamomi in soils suppressive
and conducive to root rot. Crop and Pasture Science, 25, 121–137.
Brouwers N, Matusick G, Ruthrof K, Lyons T, Hardy G (2013) Landscape-scale
assessment of tree crown dieback following extreme drought and heat in a Medi-
terranean eucalypt forest ecosystem. Landscape Ecology, 28, 69–80.
Bryla D, Linderman R (2007) Implications of irrigation method and amount of water
application on Phytophthora and Pythium infection and severity of root rot in high-
bush blueberry. HortScience, 42, 1463–1467.
Cayan D, Tyree M, Dettinger M et al. (2009) Climate change scenarios and sea level
rise estimates for California – 2008 climate change scenarios assessment – final
report. Available at: http://www.energy.ca.gov/publications/displayOneReport.
php?pubNum=CEC-5 00-2009-014-F (accessed 20 June 2013).
Chakraborty S (2005) Potential impact of climate change on plant-pathogen interac-
tions. Australasian Plant Pathology, 34, 443–448.
Chakraborty S, Tiedemann AV, Teng PS (2000) Climate change: potential impact on
plant diseases. Environmental Pollution, 108, 317–326.
Chavarriaga D, Bodles WJA, Leifert C, Belbahri L, Woodward S (2007) Phytophthora
cinnamomi and other fine root pathogens in north temperate pine forests. FEMS
Microbiology Letters, 276, 67–74.
Clapp R, Hornberger G (1978) Empirical equations for some soil hydraulic properties.
Water Resources Research, 14, 601–604.
Coakley S, Scherm H, Chakraborty S (1999) Climate change and plant disease man-
agement. Annual Review of Phytopathology, 37, 399–426.
Collins WD, Bitz CM, Blackmon ML et al. (2006) The community climate system
model version 3 (ccsm3). Journal of Climate, 19, 2122–2143.
Desprez-Loustau ML, Marcais B, Nageleisen LM, Piou D, Vannini A (2006) Interac-
tive effects of drought and pathogens in forest trees. Annals of Forest Science, 63,
597–612.
Dunstan WA, Rudman T, Shearer BL et al. (2009) Containment and spot eradication
of a highly destructive, invasive plant pathogen (phytophthora cinnamomi) in nat-
ural ecosystems. Biological Invasions, 12, 913–925.
Elliott M, Chastagner G, Dermott G, DeBauw A, Sniezko R (2010) A first look at
genetic variation in resistance to the root pathogen Phytophthora cinnamomi using a
range-wide collection of pacific madrone Arbutus menziesii. In: Proceedings of the 4th
International Workshop on Genetics of Host-Parasite Interactions in Forestry, General
Technical Report PSW-GTR-240, pp. 290–294. US Forest Service, Albany, CA.
Available at: http://www.fs.fed.us/psw/publications/documents/psw_gtr240/
ps w_gtr240_290.pdf (accessed 17 December 2013).
Fabre B, Piou D, Desprez-Loustau ML, Marcais B (2011) Can the emergence of pine
Diplodia shoot blight in France be explained by changes in pathogen pressure
linked to climate change? Global Change Biology, 17, 3218–3227.
Farr D, Rossman A (2013) Fungal database. Available at: http://nt.ars-grin.gov/
fungaldatabases/ (accessed 12 September 2013).
Fichtner EJ, Rizzo DM, Swiecki TJ, Bernhardt EA (2010) Emergence of Phytophthora
cinnamomi in a Sudden Oak Death-impacted forest. In: Proceedings of the Sudden
Oak Death Fourth Science Symposium, General Technical Report PSW-GTR-229, pp.
320–321. US Forest Service, Santa Cruz, CA.
Flint L, Flint A (2012) Downscaling future climate scenarios to fine scales for hydro-
logic and ecological modeling and analysis. Ecological Processes, 1, 1–15.
Garbelotto M, Huberli D, Shaw D (2006) First report on an infestation of Phytophthora
cinnamomi in natural oak woodlands of California and its differential impact on
two native oak species. Plant Disease, 90, 685.
© 2014 John Wiley & Sons Ltd, Global Change Biology, doi: 10.1111/gcb.12463
12 S . E . THOMPSON et al.
Garkaklis MJ, Calver MC, A WB, Hardy GES (2004) Habitat alteration caused by
introduced plant disease: a significant threat to the conservation of Australian for-
est fauna. In: Conservation of Australians Forest Fauna (ed. Lunney D), pp. 899–913.
Royal Zoological Society of New South Wales, Mosman, NSW.
Garrett KA, Dendy SP, Frank EE, Rouse MN, Travers SE (2006) Climate change
effects on plant disease: genomes to ecosystems. Annual Review of Phytopathology,
44, 489–509.
Gilliam H (2002) Weather of the San Francisco Bay Region (2nd edn). University of Cali-
fornia Press, Berkeley, CA.
Harham A (2005) Phytophthora cinnamomi. Molecular Plant Pathology, 6, 589–604.
Horsthemke W, Lefever R (1984) Noise-induced Transitions: Theory and Applications in
Physics, Chemistry and Biology. Springer, New York.
Hwang SC, Ko W (1978) Biology of chlamydospores, sporangia, and zoospores of
Phytophthora cinnamomi in soil. Phytopathology, 68, 726–731.
Ibanez I, Clark J, Dietze M et al. (2006) Predicting biodiversity change: outside the
climate envelope, beyond the species-area curve. Ecology, 87, 1896–1906.
Jacobs K, MacDonald JD, Berry AM, Costello LR (1997) The effect of low oxygen
stress on Phytophthora cinnamomi infection and disease of cork oak roots. In:
Proceedings of the Symposium on Oak Woodlands: Ecology, Management, and Urban
Interface Issues, USDA Forest Service General Technical Report PSW-GTR-160, pp.
553–558. US Forest Service, San Luis Obispo, CA. Available at: http://www.
fs.fed.us/psw/publications/documents/psw_gtr160/ps w_gtr160_04g_jacobs.pdf
(accessed 17 December 2013).
Jactel H, Petit J, Desprez-Loustau ML, Delzon S, Piou D, Battisti A, Koricheva J (2012)
Drought effects on damage by forest insects and pathogens: a meta-analysis. Global
Change Biology, 18, 267–276.
J€onsson U (2006) A conceptual model for the development of Phytophthora disease in
Quercus robur. New Phytologist, 171, 55–68.
Judelson H, Blanco F (2005) The spores of Phytophthora: weapons of the plant
destroyer. Nature Reviews Microbiology, 3, 47–58.
Kang S, Kim S, Oh S, Lee D (2000) Predicting spatial and temporal patterns of soil
temperature based on topography, surface cover and air temperature. Forest Ecol-
ogy and Management, 136, 173–184.
K€atterer T, Andr€on O (2008) Predicting daily soil temperature profiles in arable soils
in cold temperate regions from air temperature and leaf area index. Acta Agricultu-
rae Scandinavica, Section B – Soil & Plant Science, 59, 77–86.
Laio F, Porporato A, Ridolfi L, Rodriguez-Iturbe I (2001) Plants in water-controlled
ecosystems: active role in hydrologic processes and response to water stress – II.
Probabilistic soil moisture dynamics. Advances in Water Resources, 24, 707–723.
Lake JA, Wade RN (2009) Plant-pathogen interactions and elevated CO2: morphologi-
cal changes in favor of pathogens. Journal of Experimental Botany, 60, 3123–3131.
Leuning R, Zhang YQ, Rajaud A, Cleugh H, Tu K (2008) A simple surface conductance
model to estimate regional evaporation using MODIS leaf area index and the Pen-
man-Monteith equation.Water Resources Research, 44, doi: 10.1029/2007WR006562.
MacDonald J, Duniway J (1978) Influence of the matric and osmotic components of
water potential on zoospore discharge in of Phytophthora. Ecology and Epidemiology,
67, 751–757.
Malajczuk N, Theodorou C (1979) Influence of water potential on growth and cultural
characteristics of Phytophthora cinnamomi. Transactions of the British Mycological Soci-
ety, 72, 15–18.
Marc�ais B, Dupuis F, Desprez-Loustau M (1996) Modelling the influence of winter
frosts on the development of the stem canker of red oak, caused by Phytophthora
cinnamomi. Annales des Sciences Foresti�eres, 53, 369–382.
Maurer E, Wood A, Adam J, Lettenmaier D, Nijssen B (2002) A long-term hydrologi-
cally-based data set of land surface fluxes and states for the conterminous United
States. Journal of Climate, 15, 3237–3251.
Melloy P, Hollaway G, Luck J, Norton R, Aitken E, Chakraborty S (2010) Production
and fitness of Fusarium pseudograminearum inoculum at elevated carbon dioxide in
FACE. Global Change Biology, 16, 3363–3373.
Myers N, Mittermeier RA, Mittermeier CG, da Fonseca GAB, Kent J (2000) Biodiver-
sity hotspots for conservation priorities. Nature, 403, 853–858.
Nesbitt H, Malajczuk N, Glenn A (1978) Effect of soil moisture and temperature on
the survival of Phytophthora cinnamomi rands in soil. Soil Biology and Biochemistry,
11, 137–140.
Nesbitt HJ, Malajczuk N, Glenn AR (1979) Effect of organic matter on the survival of
Phytophthora cinnamomi rands in soil. Soil Biology and Biochemistry, 11, 133–136.
Newhook F, Podger F (1972) The role of Phytophthora cinnamomi in Australian and
New Zealand forests. Annual Reviews in Phytopathology, 10, 299–326.
Pagliaccia D, McKee B, Pond E, Douhan GW (2011) Population genetic structure of
Phytophthora cinnamomi associated with Phytophthora root rot of avocado (Persea
americana) within California. Phytopathology, 101, S135.
Pagliaccia D, Pond E, McKee B, Douhan GW (2013) Population genetic structure
of Phytophthora cinnamomi associated with avocado in California and the discovery
of a potentially recent introduction of a new clonal lineage. Phytopathology, 103,
91–97.
Pangga IB, Chakraborty S, Yates D (2004) Canopy size and induced resistance in
Stylosanthes scabra determine anthracnose severity at high CO2. Phytopathology, 94,
221–227.
Pangga IB, Hanan J, Chakraborty S (2011) Pathogen dynamics in a crop canopy and
their evolution under changing climate. Plant Pathology, 60, 70–81.
Pautasso M, Dehnen-Schmutz K, Holdenrieder O et al. (2010) Plant health and global
change – some implications for landscape management. Biological Reviews, 85, 729–
755.
Pautasso M, Doering TF, Garbelotto M, Pellis L, Jeger MJ (2012) Impacts of climate
change on plant diseases-opinions and trends. European Journal of Plant Pathology,
133, 295–313.
Peters-Lidard CD, Blackburn E, Liang X, Wood EF (1998) The effect of soil thermal
conductivity parameterization on surface energy fluxes and temperatures. Journal
of the Atmospheric Sciences, 55, 1209–1224.
Porporato A, Laio F, Ridolfi L, Rodriguez-Iturbe I (2001) Plants in water-controlled
ecosystems: active role in hydrologic processes and response to water stress – III.
Vegetation water stress. Advances in Water Resources, 24, 725–744.
Rizzo D, Fichtner E (2007) Phytophthora in forests and natural ecosystems of the
Americas. In: Proceedings of the Fourth Meeting of the International Union of Forest
Research Organizations (IUFRO) Working Party S07.02.09, General Technical Report
PSW-GTR-221, pp. 35–44. US Forest Service, Monterey, CA. Available at: http://
ucanr.edu/sites/rizzolab/files/142694.pdf#page=47 (accessed 17 December 2013).
Scharwz G, Alexander RB (1995) Soils data for the conterminous United States
derived from the NRCS State Soil Geographic (STATSGO) Database. Available at:
http://water.usgs.gov/lookup/getspatial?ussoils (accessed 17 December 2013).
Shea S, Shearer B, Tippett J, Deegan P (1983) Distribution, reproduction and move-
ment of Phytophthora cinnamomi on sites highly conducive to Jarrah Dieback in
South Western Australia. Plant Disease, 67, 970–973.
Shearer B, Shea S, Deegan P (1987) Temperature-growth relationships of Phytophthora
cinnamomi in the secondary phloem of roots of Banksia grandis and Eucalyptus
marginata. Phytopathology, 77, 661–665.
Shearer BL, Crane CE, Cochrane A (2004) Quantification of the susceptibility of the
native flora of the south-west botanical province, Western Australia, to Phytophtho-
ra cinnamomi. Australian Journal of Botany, 52, 435–443.
Sloan D (2005) Geology of the San Francisco Bay Region. University of California Press,
Berkeley, CA.
Staff SS (2012) Soil Survey Geographic (SSURGO) database for California. Available at:
http://websoilsurvey.sc.egov.usda.gov/App/HomePage.htm (accessed 17 Decem-
ber 2013).
Sutherst RW, Constable F, Finlay KJ, Harrington R, Luck J, Zalucki MP (2011) Adapt-
ing to crop pest and pathogen risks under a changing climate. Wiley Interdisciplin-
ary Reviews-Climate Change, 2, 220–237.
Swiecki TJ, Bernhardt EA, Garbelotto M (2003) First report of root and crown rot
caused by Phytophthora cinnamomi affecting native stands of Arctostaphylos myrtifo-
lia and A. viscida in California. Plant Disease, 87, 1395.
Swiecki TJ, Bernhardt E, Garbelotto M, Fichtner E (2011) The exotic plant pathogen
Phytophthora cinnamomi: a major threat to rare Acrtostaphylos and much more.
Proceedings of the CNPS Conservation Conference (eds. Willoughby JW, Orr BK,
Schierenbeck KA, Jensen NJ), 17–19 January 2009, Sacramento, CA, 367–371.
Thompson S, Alvarez-Loayza P, Terborgh J, Katul G (2010) The effects of plant patho-
gens on tree recruitment in the Western Amazon under a projected future climate:
a dynamical systems analysis. Journal of Ecology, 98, 1434–1446.
Thompson S, Levin S, Rodriguez-Iturbe R (2013) Linking plant disease risk and pre-
cipitation drivers: a dynamical systems framework. The American Naturalist, 181,
E1–E16.
Tidwell TE, Kosta KL, Henderson JC (1984) Root rot of Western Swordfern Polysti-
chum munitum caused by Phytophthora cinnamomi in California USA. Plant Disease,
68, 536.
Tippett J, Crombie D, Hill T (1987) Effect of phloem water relations on the growth of
Phytophthora cinnamomi in Eucalyptus marginata. Phytopathology, 77, 246–250.
Tippett J, McGrath J, Hill T (1989) Site and seasonal effects on susceptibility of
Eucalyptus marginata to Phytophthora cinnamomi. Australian Journal of Botany, 37,
481–490.
Torregrosa A, Taylor MD, Flint LE, Flint AL (2013) Present, future, and novel biocli-
mates of the San Francisco, California region. PLoS ONE, 8, e58450.
van Vuuren D, Edmonds J, Kainuma M et al. (2011) The representative concentration
pathways: an overview. Climatic Change, 109, 5–31.
© 2014 John Wiley & Sons Ltd, Global Change Biology, doi: 10.1111/gcb.12463
CLIMATE CHANGE AND RISK FACTORS FOR PHYTOPHTHORA CINNAMOMI OCCURRENCE 13

Weste G, Law C (1973) The invasion of native forest by Phytophthora cinnamomi. III.
Threat to the National Park, Wilson’s Promontory, Victoria. Australian Journal of
Botany, 21, 31–51.
Weste G, Marks GC (1987) The biology of Phytophthora cinnamomi in Australasian for-
ests. Annual Review of Phytopathology, 25, 207–229.
Weste G, Taylor P (1987) The invasion of native forest by Phytophthora cinnamomi. I.
Brisbane Ranges, Victoria. Australian Journal of Botany, 19, 281–294.
Zentmyer GA (1980) Phytophthora cinnamomi and the Diseases it Causes. 10. American
Phytopathological Society, St. Paul, MN.
Zentmyer G, Leary J, Klure LJ, Grantham G (1976) Variability in growth of Phytoph-
thora cinnomomi in relation to temperature. Phytopathology, 66, 982–986.
Zheng D, Hunt ER Jr, Running SW (1993) A daily soil temperature model based on
air temperature and precipitation for continental applications. Climate Research, 2,
183–191.
Supporting Information
Additional Supporting Information may be found in theonline version of this article:
Appendix S1. Soil thermal diffusivity estimates.
© 2014 John Wiley & Sons Ltd, Global Change Biology, doi: 10.1111/gcb.12463
14 S . E . THOMPSON et al.


