Journal of Analytical Toxicology, Vol. 25, May/June 2001
Rapid Determination of Cyanide and Azide in Beverages by Microdiffusion Spectrophotometric Method
Kouichiro Tsuge, Mieko Kataoka, and Yasuo Seto* National Research Institute of Police Science, 6-3-l, Kashiwanoha, Kashiwa, Chiba 277-0882, Japan
Abstract
A rapid screening method was developed for the determination of the toxic volatile anions, cyanide and azide, in beverages. This method consisted of a microdiffusion extraction combined with spectrophotometry using the K~nig cyanide reaction and ferric azide complex formation in conjugation with cerium azide oxido- reduction. The time required to achieve full recovery in the extraction of hydrogen cyanide and hydrazoic acid from samples was considerably shortened by increasing the diffusion temperature from 25~ to 40~ The time required to achieve saturated color development in the K~nig cyanide reaction was also shortened by increasing incubation temperature to 40~ The interference in both azide color reactions was examined for volatile compounds. Cyanide interfered only in the case of ferric azide complex formation. Sulfide, sulfate, nitrite, and acetic acid interfered in both the color reactions. The established method gave a detection limit of 6~M for cyanide and 0.5ram for azide, and it required only 1 h to determine both anions. Cyanide and azide disappeared by evaporation from beverages during 25~ storage under open conditions in a pH-dependent manner as a function of their respective pK a values of 9.2 and 4.6.
Introduction
A widespread series of deliberate poisoning cases occurred in Japan during the second half of 1998 (1). The first case, the Wakayama curry poisoning case, occurred in late July, and 4 people died and more than 60 became seriously ill after eating arsenic-laced curry served at a community festival in the Sonobe district of Wakayama (2). In August, 10 employees of a wood-processing firm in Niigata became ill after drinking bev- erages made with sodium azide (NaN3)-laced water in the elec- tric kettle in the office. After that, four copycat crimes in- volving cases of sodium azide tampering occurred (2). The third event occurred in Nagano, and a resident there died after drinking cyanide-laced canned oolong tea (3). In addition, a number of attempted or fake cases of cyanide tampering of bev- erages have also been documented. Common articles of daily
* Author to whom correspondence should be addressed.
life such as commercial detergents have also been used to adulterate foods and drinks.
When poisoning cases occur, determination of the toxic sub- stances is required for medical treatment of the casualties, as well as the subsequent criminal investigation. In Japan, forensic science laboratories (FSL) of the prefectural police headquarters and, when requested, the National Research In- stitute of Police Science (NRIPS), are often involved in the forensic investigations and perform analyses of samples from the victims and evidence samples taken from the crime scenes. After a simple preliminary examination, the causative toxic substances are typically identified by sophisticated instru- mental analysis. Emergency medical units have also been known to examine samples (taken from a victim) by routine clinical analysis. Among the toxic substances, cyanide is an im- portant compound and is a highly relevant candidate for testing. So far, several attempted suicides and accidental cases of sodium azide poisoning have been reported (4-9). After a number of homicides and cases of intentional injury by sodium azide tampering, azide has now become a target for initial in- quiry in unknown poisoning cases in Japan (10). In general, sodium azide is routinely used for a variety of purposes, such as a preservative in laboratory use (11), and it has recently been included in automobile air bags as a combustion material (12). Azide has a hypotensive effect in humans (13), and its tox- icity is derived from its ability to inhibit cytochrome oxidase ac- tivity (14). Azide and cyanide are weak acids when they exist in the acid form (PKaS 4.8 and 9.31, respectively) and show a sim- ilar volatility (boiling points 26~ and 37~ respectively) (13,15).
Laboratory analysis of cyanide consists of the following two procedures: extraction of hydrogen cyanide (HCN) from sam- ples and the quantitation of the extracted cyanide. Aeration (16), distillation (17), microdiffusion (18,19), headspace (HS) (20-23), and HS-microextraction (24) were used as the ex- traction procedures. Titration (25), spectrophotometry (26), spectrofluorimetry (27), polarography (28), ion chromatog- raphy (IC) (29), high-performance liquid chromatography (HPLC) (30), and gas chromatography (GC) with electron- capture detection after conversion to cyanogen halide (20) and nitrogen-phosphorus detection (21-23) were used as the quan-
228 Reproduction (photocopying) of editorial content of this journal is prohibited without publisher's permission.
Journal of Analytical Toxicology, Vol. 25, May/June 2001
titation procedures. For the quantitation of azide, oxido- reductive titration (13,31-33), spectrophotometry using a ferric salt (34-36) or a cerium salt (37), IC (38-40), GC (41,42), and HPLC (8,9,43) have been reported. GC, after a pentafluo- robenzylation derivatization procedure, enables the simulta- neous determination of azide, cyanide, and other anions (44,45). In the early stages of a poisoning, the more quickly the toxic substances are identified from evidence samples, the more effective is the applied medical treatment. In addition, the rapid determination of the causative poisons facilitates the early stage of the criminal investigation. Among the extraction methods now employed, microdiffusion is an ideal candidate for volatile substances. Spectrophotometric microdiffusion methods for the rapid determination of cyanide in the blood of a victim in emergency situations have already been reported (46,47).
In this paper, we report on the expanded use of the micro- diffusion method for the determination of cyanide and azide. Although the rapid screening test kits such as ion test paper (Cyantesmo paper, Macherey-Nagel and Cyano Check paper, Advantec Toyo) for the direct examination of water sample are commercially available, they have the disadvantages of inter- ference from many coexisting compounds and semiquantitative nature. We selected spectrophotometry because from the standpoint of rapidity, simplicity, accurate quantitation, and economy, it is applicable to both emergency medical and forensic investigation as a preliminary screening method. The K6nig method (48), which uses a pyridine-pyrazolone reagent for cyanide, was chosen because this method is the most fre- quently used in Japanese toxicological laboratories. We also adopted both the azide ferric complex reaction and the cerium oxido-reduction reaction for azide quantitation. Finally, we report on a simultaneous determination method for cyanide and azide, and also examined the stability of cyanide and azide in various commercially available beverages from the stand- point of detectability in leftover beverage samples that have been found in crime scenes.
Experimental
Reagents Potassium cyanide (KCN), NAN3, andp-toluenesulfonchlor-
amide (chloramine T) were purchased from Wako Pure Chem- ical (Osaka, Japan). Diammonium cerium (IV) nitrate was from Kanto Chemical (Tokyo, Japan). Cyanoline blue (mixture of 1- phenyl-3-methyl-5-pyrazolone and 4,4'-bis(1-phenyl-3-methyl- 5-pyrazolone)) was purchased from Dojindo Laboratories (Ku- mamoto, Japan). All other chemicals used were of analytical grade. All aqueous solutions were prepared with deionized and distilled water.
Microdiffusion Glass Conway cells (outer cell, height 8 mm, exterior diam-
eter, 60 ram, interior diameter, 40 mm; center well, height 5 mm, exterior diameter 34 ram; Shibata Scientific Technology, Tokyo, Japan) were used for microdiffusion. Two milliliters of
0.1M sodium hydroxide (NaOH) was added to the center well of the cell. One milliliter of the sample solution was added to one side of the outer well. A glass plate coated with glycerol was then placed over the cells, leaving a small opening on the side opposite the sample, through which 0.5 mL of 10% (w/v) sul- furic acid (H2SO4) was added. The cell was closed rapidly, and the sample and acid were immediately mixed by gently tilting the cell. At the incubation for 30 min at 40~ in an air incu- bator, the lid was removed and the extracted solution in the center cell was removed with a pipette.
Spectrophotometric method no. 1 (K6nig reaction) The cyanide level was measured by the K6nig reaction using
the pyridine-pyrazolone reagent (26). Forty microliters of a so- lution of the inner cell, after microdiffusion, was then pipetted into a 96-well microplate, and mixed with 15 ~L of 1.0M potas- sium hydrogen phosphate solution, 5 lnL of 5.0M NaOH solu- tion, and 10 l~L of 6.25 mg/mL chloramine T solution. After ap- proximately 2 min, 0.12 mL of 0.27% (w/v) Cyanoline blue in pyridine/water (1:5, v/v) was added to the mixture. After the in- cubation for 10 min at 40~ in an air incubator, the absorbance of the solution was determined at 630 nm using a microplate reader (Spectramax 250, Molecular Device Co., Menlo Park, CA). The calibration standards (0-200~tM) were also subjected to the same color reactions in parallel. Samples giving cyanide levels higher than 200~M were assayed again after appropriate dilution of the inner cell solution with 0.1M NaOH.
Spectrophotometric method no. 2 (ferric azide complex formation)
The azide level was measured as the azide ferric complex by spectrophotometry (35). Twenty microliters of the inner cell and 0.18 mL of 50mM ferric trichloride in 10raM hydrochloric acid (HCI) were pipetted into a 96-well micro plate. After 5 min, the absorbance was determined at 450 nm using microplate reader. The calibration standards (0-10raM) are also subjected to the same color reactions in parallel. The samples giving azide levels higher than 10raM were assayed again after ap- propriate dilution of the inner cell solution with 0.1M NaOH.
Spectrophotometric method no. 3 (cerium reduction by azide)
The azide level was determined by spectrophotometry by oxido-reduction using the cerium reagent (37). Twenty micro- liter of the inner cell and 0.18 mL of 600~M diammonium cerium (IV) nitrate in 1.0M H2SO 4 were pipetted into a 96-well micro plate. The absorbance was immediately determined at 390 nm using microplate reader. The calibration standards (0-6mM) are also subjected to the same color reactions in par- allel. The samples giving azide levels higher than 6raM were assayed again after appropriate dilution of the inner cell solu- tion with 0.1M NaOH.
Routine spectrophotometric method The mentioned procedures for measuring color develop-
ment using a microplate reader were modified by scaling up the reaction volume from 0.2 mL to 3.0 mL and by measuring the absorbance of the color reaction solution by mean of a
229
U-best V-560DS spectrophotometer (Japan Spectroscopic, Tokyo, Japan) at the respective wavelengths. For the K6nig cyanide assay, the mixture of chlorinated solution and pyridine- pyrazolone reagent was incubated at 40~ in a water bath.
A storage experiment for cyanide and azide in a beverage solution
The following six commercial beverages were used: canned Coca Cola (Japan Coca Cola Bottlers, Tokyo, Japan), a paper carton of orange juice drink (Sweet Orange Juice, reconstituted from concentrate to 100%, Gurico, Tokyo, Japan), a paper carton of sake drink (Miyakotaka, alcohol conc. 15-16%, Koyama Honke, Omiya, Japan), a canned draft beer (Ichiban Shibori, Kirin Beer, Tokyo, Japan), a canned coffee (Georgia Mocha/Kilimanjaro (50:50), Japan Coca Cola Bottlers), and a paper carton of milk (Rakuno Milk, Zenrakuren, Tokyo, Japan). Tea was extracted with 200 mL of hot water from 2 g of a tea pack (Lipton, Tokyo, Japan).
Twenty milliliters of beverage or a 100mM phosphate- or acetate-buffered solution was combined with 0.4 mL of a 500mM KCN solution or a 500mM NaN3 solution in glass tube (30-ram i.d.) with or without closing the tube with a stopper and was left at 25~ After the specified time, the aliquot was sampled, and the level of cyanide or azide was determined by the microdiffusion spectrophotometric method.
Results and Discussion
Improvement in the spectrophotometric methods for cyanide and azide
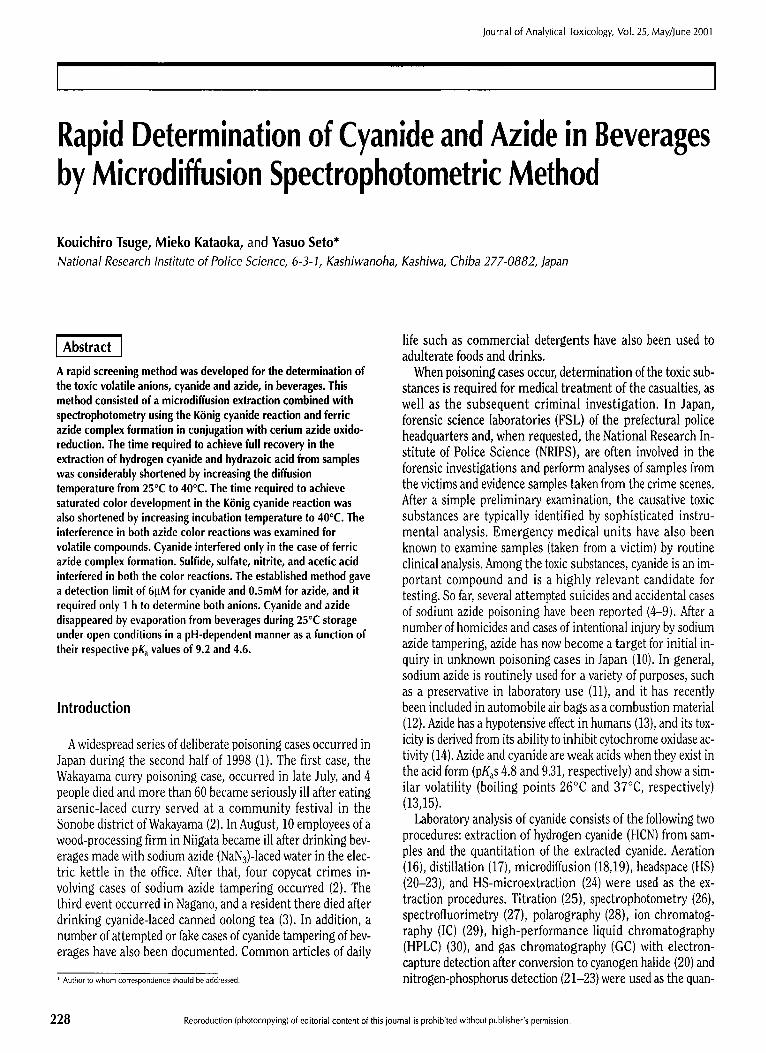
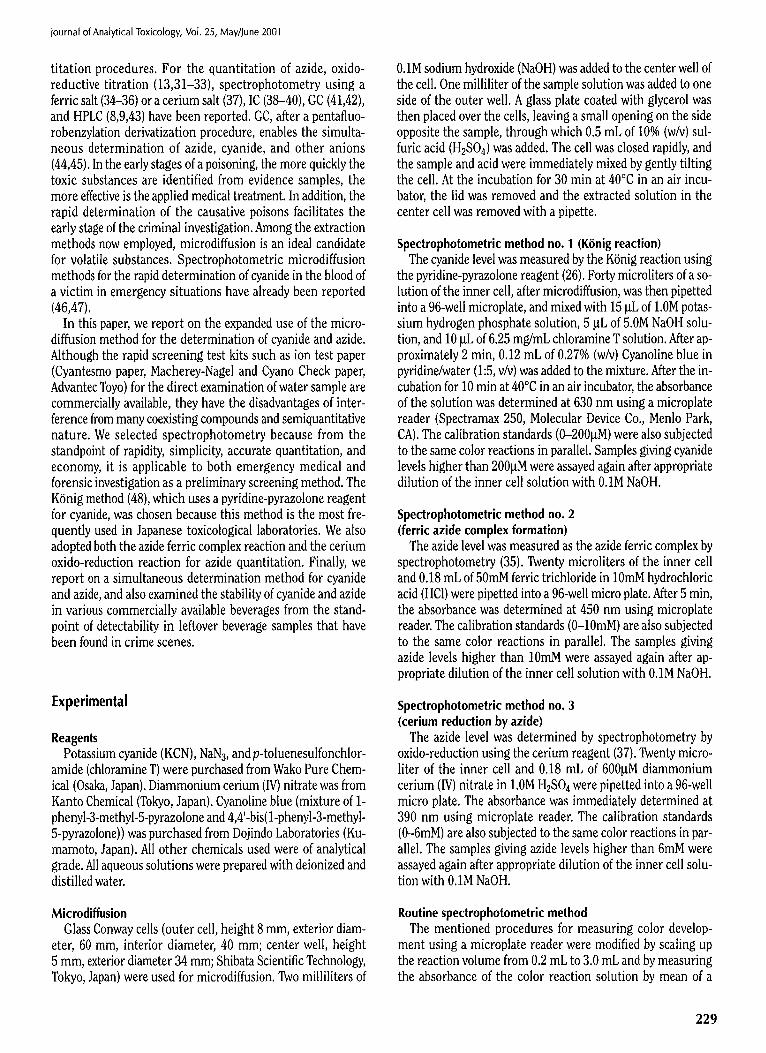
In the K~nig cyanide color development using pyridine- pyrazolone reagent, the formation of a blue color indicates the presence of cyanide (26). As shown in Figure 1, more than 25 rain was required to reach maximal color development at 25~ Increasing the incubation temperature to 40~ short- ened the time to 10 rain, after which the absorbance remained nearly constant. This result is consistent with literature ob- servations (46,47). As shown in Figure 2, the calibration curve was linear (7 = 0.9998) with respect to cyanide concentrations ranging from 0 to 200]JM in the inner well solution. The within-day repeatability (401aM, n = 8) was 3.5% (relative stan- dard deviation (RSD)), and the detection limit was 31aM (S/N = 3). Only equimolar thiocyanate gave a positive interference (49). However, thiocyanate can be removed in the microdiffu- sion process because of its nonvolatility. Neither NAN3, sodium sulfide (Na2S), sodium sulfite (Na2SO3) nor sodium nitrite (NaNO2) showed a K6nig color development. Neither 40% ethanol nor 0.65mM of acetic acid interfered with the color de- velopment. Ethanol is presented at high levels in alcoholic beverages, and acetic acid in vinegar beverages. Acetic acid (100raM) interfered with the color development, which can be attributed to a pH decline in the K6nig reaction (49). There- fore, ethanol and volatile anions which may be adulterated and which can be extracted by microdiffusion, such as azide, sulfide, sulfite and nitrite, represent negligible interferences in the K6nig color reaction, except for high levels of acetic acid.
230
Journal of Analytical Toxicology, Vol. 25, May/June 2001
0.25
E 0.20 o
.~ 0.15
,~ o.1o
0
.8 0.05 <
0.00 -
0
i i i
10 20 30
Time (min)
40
Figure 1. Effect of time and temperature on color development for the KOnig reaction with cyanide. Forty microliters of 25mM KCN in 0.1M NaOH was mixed with 15 mL of 1M potassium hydrogen phosphate solution, 5 mL of 5M NaOH solution, and 10 mL of 6.25 mg/mL chlo- ramine T solution. After approximately 2 rain, 0.12 mL of 0.27% (w/v) Cyanoline blue in pyridine/water (1:5, v/v) was added to the mixture, fol- lowed by incubation at 25~ (open circle) or 40~ (closed circle) for the specified times. The absorbance at 630 nm was plotted against the incubation time.
2.5
E 2.0
( D 1.5
~5 1.o
O.5
0.0 i i i
50 100 150 200 Cyanide (pM)
F i g u r e 2. Calibration curve for cyanide in the K6nig reaction. Absorbance at 630 nm was plotted against the cyanide concentration. Each point rep- resents the mean for eight determinations.
2.0
c E 1.5
1.0
. . Q a
.~ 0.5
0.0 ' ' 1.0 1.5 2.0 2.5
pH
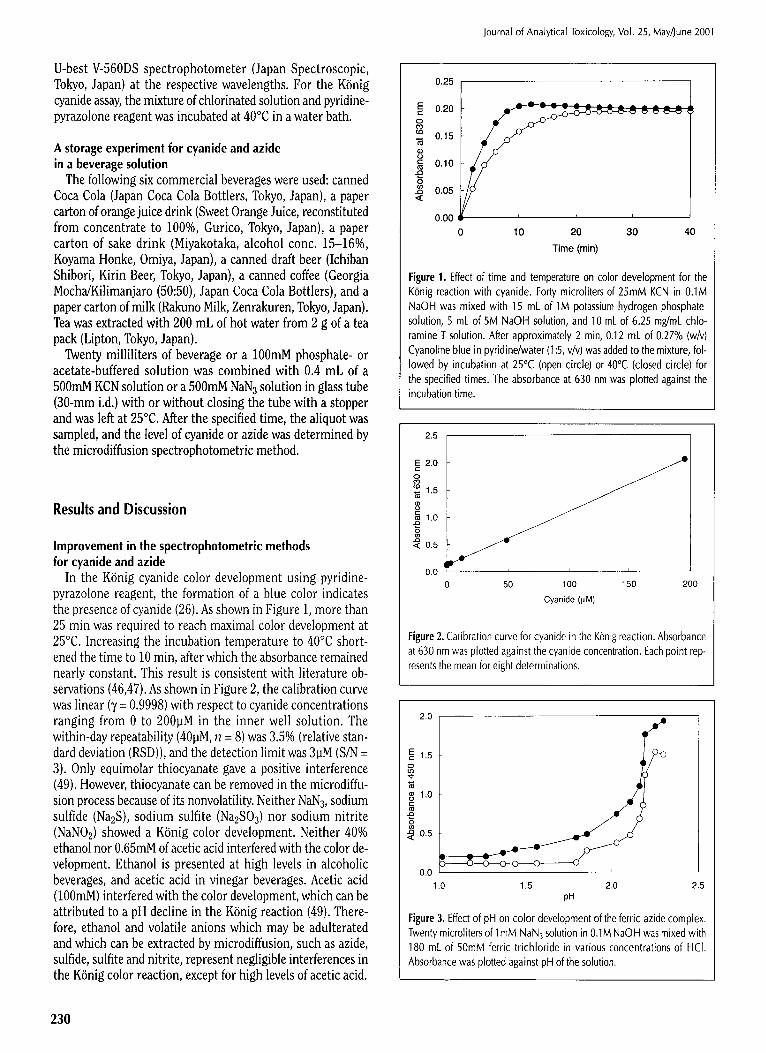
F i g u r e 3. Effect of pH on color development of the ferric azide complex. Twenty microliters of 1 mM NaN 3 solution in 0.1M NaOH was mixed with 180 mL of 50mM ferric trichloride in various concentrations of HCI. Absorbance was plotted against pH of the solution.
Journal of Analytical Toxicology, Vol. 25, May/June 2001
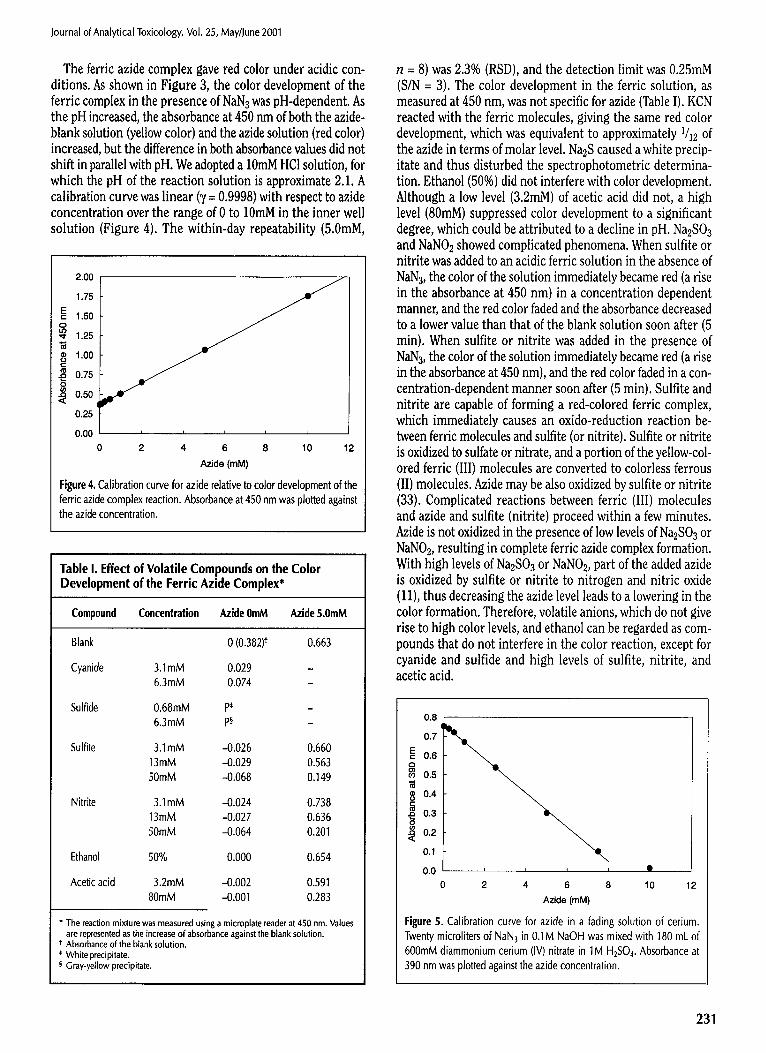
The ferric azide complex gave red color under acidic con- ditions. As shown in Figure 3, the color development of the ferric complex in the presence of NaN3 was pH-dependent. As the pH increased, the absorbance at 450 nm of both the azide- blank solution (yellow color) and the azide solution (red color) increased, but the difference in both absorbance values did not shift in parallel with pH. We adopted a 10raM HCI solution, for which the pH of the reaction solution is approximate 2.1. A calibration curve was linear (y = 0.9998) with respect to azide concentration over the range of 0 to 10mM in the inner well solution (Figure 4). The within-day repeatability (5.0raM,
2.00
1.75
1.50
1.25
1.00
0.75
0.50
0.25
0.00 ' , , , , 0 2 4 6 8 10 12
Azide (raM)
Figure 4. Calibration curve for azide relative to color development of the ferric azide complex reaction. Absorbance at 450 nm was plotted against the azide concentration.
Table I. Effect of Volatile Compounds on the Color Development of the Ferric Azide Complex*
Compound Concentration Azlde 0mM Azide 5.0mM
Blank 0 (0.382) t 0.663
Cyanide 3.1mM 0.029 6.3mM 0.074
Sulfide 0.68mM P* 6.3mM Pw
Sulfite
Nitrite
Ethanol
Acetic acid
3.1 mM -0.026 0.660 13mM -0.029 0.563 50mM -0.068 0.149
3.1 mM --0.024 0.738 13mM -0.027 0,636 50mM -0.064 0.201
50% 0.000 0.654
3.2mM .-0.002 0.591 80mM -0.001 0.283
* The reaction mixture was measured using a microplate reader at 450 nm. Values are represented as the increase of absorbance against the blank solution.
t Absorbanee of the blank solution. * White precipitate. w Gray-yellow precipitate.
n = 8) was 2.3% (RSD), and the detection limit was 0.25raM (S/N = 3). The color development in the ferric solution, as measured at 450 nm, was not specific for azide (Table I). KCN reacted with the ferric molecules, giving the same red color development, which was equivalent to approximately 1/12 of the azide in terms of molar level. Na2S caused a white precip- itate and thus disturbed the spectrophotometric determina- tion. Ethanol (50%) did not interfere with color development. Although a low level (3.2raM) of acetic acid did not, a high level (80raM) suppressed color development to a significant degree, which could be attributed to a decline in pH. Na2SO3 and NaNO2 showed complicated phenomena. When sulfite or nitrite was added to an acidic ferric solution in the absence of NaN 3, the color of the solution immediately became red (a rise in the absorbance at 450 nm) in a concentration dependent manner, and the red color faded and the absorbance decreased to a lower value than that of the blank solution soon after (5 rain). When sulfite or nitrite was added in the presence of NaN 3, the color of the solution immediately became red (a rise in the absorbance at 450 nm), and the red color faded in a con- centration-dependent manner soon after (5 rain). Sulfite and nitrite are capable of forming a red-colored ferric complex, which immediately causes an oxido-reduction reaction be- tween ferric molecules and sulfite (or nitrite). Sulfite or nitrite is oxidized to sulfate or nitrate, and a portion of the yellow-col- ored ferric (III) molecules are converted to colorless ferrous (II) molecules. Azide may be also oxidized by sulfite or nitrite (33). Complicated reactions between ferric (III) molecules and azide and sulfite (nitrite) proceed within a few minutes. Azide is not oxidized in the presence of low levels of Na2SO3 or NaNO2, resulting in complete ferric azide complex formation. With high levels of Na2SO3 or NaNO2, part of the added azide is oxidized by sulfite or nitrite to nitrogen and nitric oxide (11), thus decreasing the azide level leads to a lowering in the color formation. Therefore, volatile anions, which do not give rise to high color levels, and ethanol can be regarded as com- pounds that do not interfere in the color reaction, except for cyanide and sulfide and high levels of sulfite, nitrite, and acetic acid.
0.8
0.7
0.6
co 0.5
8 0.4
0.3
~ 0.2
0.1
0.0 ' ' ~ ' �9
0 2 4 6 8 10 12 Azide (raM)
Figure 5. Calibration curve for azide in a fading solution of cerium. Twenty microliters of NaN 3 in 0.1M NaOH was mixed with 180 mL of 600raM diammonium cerium (IV) nitrate in 1M H2SO 4. Absorbance at 390 nm was plotted against the azide concentration.
231
The addition of azide to a cerium solution led to a change of the yellow color (ceric (IV)) to colorless (cerous (III)). A color change in the cerium azide reaction was not so drastically in- fluenced by pH as was the case for the ferric azide complex for- mation. Under optimized conditions, the calibration curve was linear (y = 0.9995) with respect to azide concentration over the range of 0 to 7 mM in the inner well (Figure 5). The within-day repeatability (5.0raM, n --- 8) was 2.7% (RSD), and the detection limit was 0.5mM (S/N = 3). The reaction of the cerium reagent with azide is based on the oxidation of azide by ceric (IV) molecules. Accordingly, volatile reducing substances could in- terfere in the reaction. As shown in Table II, even 200mM KCN did not interfere in the color reaction. Na~S, Na2SO3, and NaNO~., all reducing compounds, caused the same color fading. Ethanol (50%) did not interfere in the color reaction. High levels (80raM) of acetic acid suppressed the color development significantly, although low levels (0.64raM) did not. There- fore, ethanol and cyanide can be regarded as not interfering with the color reaction, except for sulfide, sulfate, and nitrite and high levels of acetic acid.
Improvement in microdiffusion conditions relative to cyanide and azide
The extraction of HCN and hydrazoic acid (HN3) is an im- portant process in isolating them from interfering compounds in complicated-matrix samples. If the determination method omits the extraction process, potentially interfering reactions can lead to mistaken findings for certain toxic substances. In the widespread series of poisoning cases in 1998 in Japan,
Table II. Effect of Volatile Compounds on the Absorbance of Ceric Solutions in the Absence and Presence of Azide*
Compound Concentration Azide 0mM Azide 5.0mM
Blank 0 (0.725) t -0.455
Cyanide
Sulfide
Sulfite
Nitrite
Ethanol
Acetic acid
1.0mM 0.000 -0.454 5.0mM -0.001 -0.454
200mM 0.001 -0.453
1.0mM -0.097 10mM -0.409 50mM -0.669
3.1mM -0.051 -0.421 13raM -0.359 -0.420 50mM -0.359 -0.461
0.8mM -0.271 -0.455 3.2raM -0.482 -0.499
50mM -0.490 -0.434
50% -0.001 -0.462
0.64mM -0.005 -0.452 80mM -0.013 -0.283
* The color solution was measured by microplate reader at 390 nm. Values are represented as the increase of absorbance against the blank solution. Absorbance of the blank solution.
Journal of Analytical Toxicology, Vol. 25, May/June 2001
there were several cases of mistaken detection in the early stages of the investigations. In the Wakayama arsenic curry poi- soning case, a false-positive finding of cyanide was reported during the first week of the investigation (50).
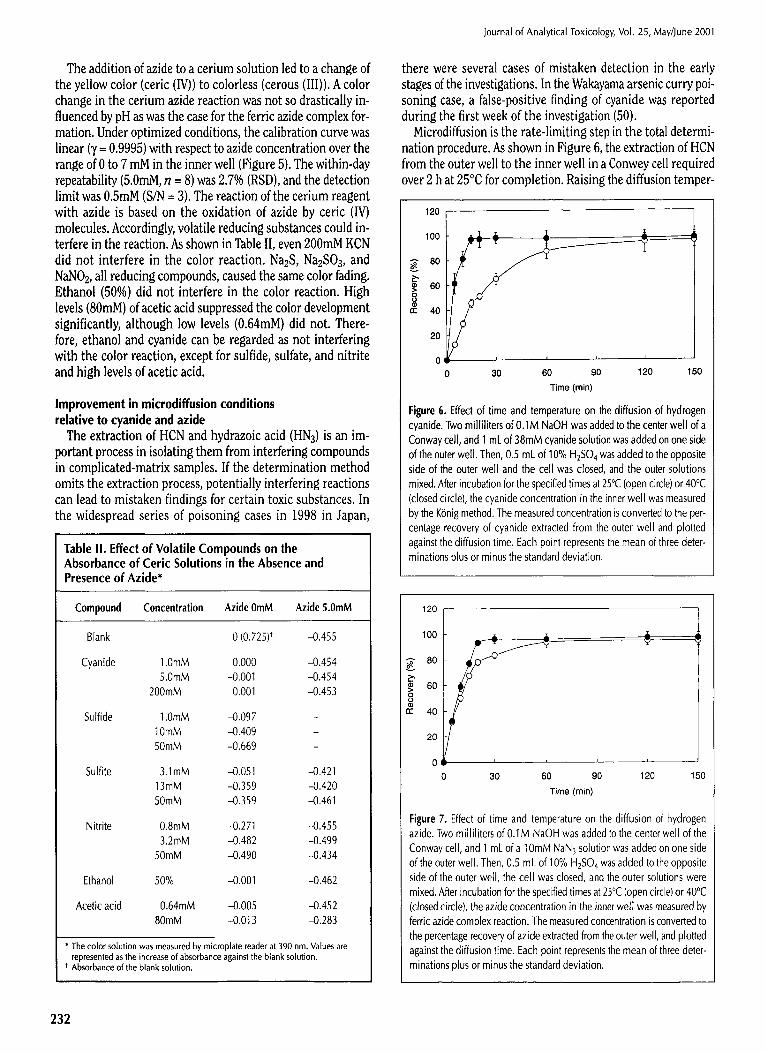
Microdiffusion is the rate-limiting step in the total determi- nation procedure. As shown in Figure 6, the extraction of HCN from the outer well to the inner well in a Conwey cell required over 2 h at 25~ for completion. Raising the diffusion temper-
12o 1 100
n- 40
20
0 ~
0 30 60 90 120 150
Time (min)
Figure 6. Effect of time and temperature on the diffusion of hydrogen cyanide. Two milliliters of 0.1M NaOH was added to the center well of a Conway cell, and 1 mL of 38raM cyanide solution was added on one side of the outer well. Then, 0.5 mL of 10% H2S04 was added to the opposite side of the outer well and the cell was closed, and the outer solutions mixed. After incubation for the specified times at 25~ (open circle) or 40~163 (closed circle), the cyanide concentration in the inner well was measured by the K6nig method. The measured concentration is converted to the per- centage recovery of cyanide extracted from the outer well and plotted against the diffusion time. Each point represents the mean of three deter- minations plus or minus the standard deviation.
120
100
o~ 8O
60 o > 8
C:E 40
20
0 0
I i i i
30 60 90 120 150
Time (min)
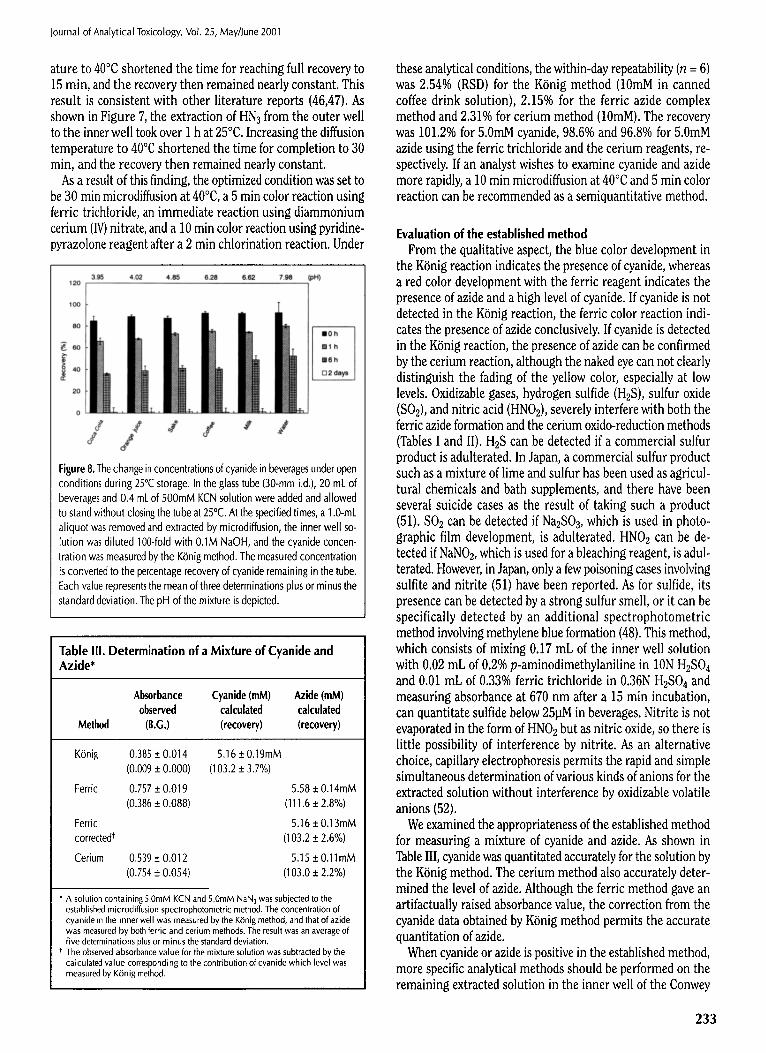
Figure 7. Effect of time and temperature on the diffusion of hydrogen azide. Two milliliters of 0.1M NaOH was added to the center well of the Conway cell, and 1 mL of a 10mM NaN 3 solution was added on one side of the outer well. Then, 0.5 mL of 10% H2SO 4 was added to the opposite side of the outer well, the cell was closed, and the outer solutions were mixed. After incubation for the specified times at 25~ (open circle) or 40~ (closed circle), the azide concentration in the inner well was measured by ferric azide complex reaction. The measured concentration is converted to the percentage recovery of azide extracted from the outer well, and plotted against the diffusion time. Each point represents the mean of three deter- minations plus or minus the standard deviation.
232
Journal of Analytical Toxicology, Vol. 25, May/June 2001
ature to 40~ shortened the time for reaching full recovery to 15 min, and the recovery then remained nearly constant. This result is consistent with other literature reports (46,47). As shown in Figure 7, the extraction of HN3 from the outer well to the inner well took over 1 h at 25~ Increasing the diffusion temperature to 40~ shortened the time for completion to 30 min, and the recovery then remained nearly constant.
As a result of this finding, the optimized condition was set to be 30 rain microdiffusion at 40~ a 5 rain color reaction using ferric trichloride, an immediate reaction using diammonium cerium (IV) nitrate, and a 10 min color reaction using pyridine- pyrazolone reagent after a 2 min chlorination reaction. Under
3.95 120 [
IO0
4.02 4,85 6.28 6,62
6 o
~o 2O
0 . . . . .
~" d d d **
7.98 (pH)
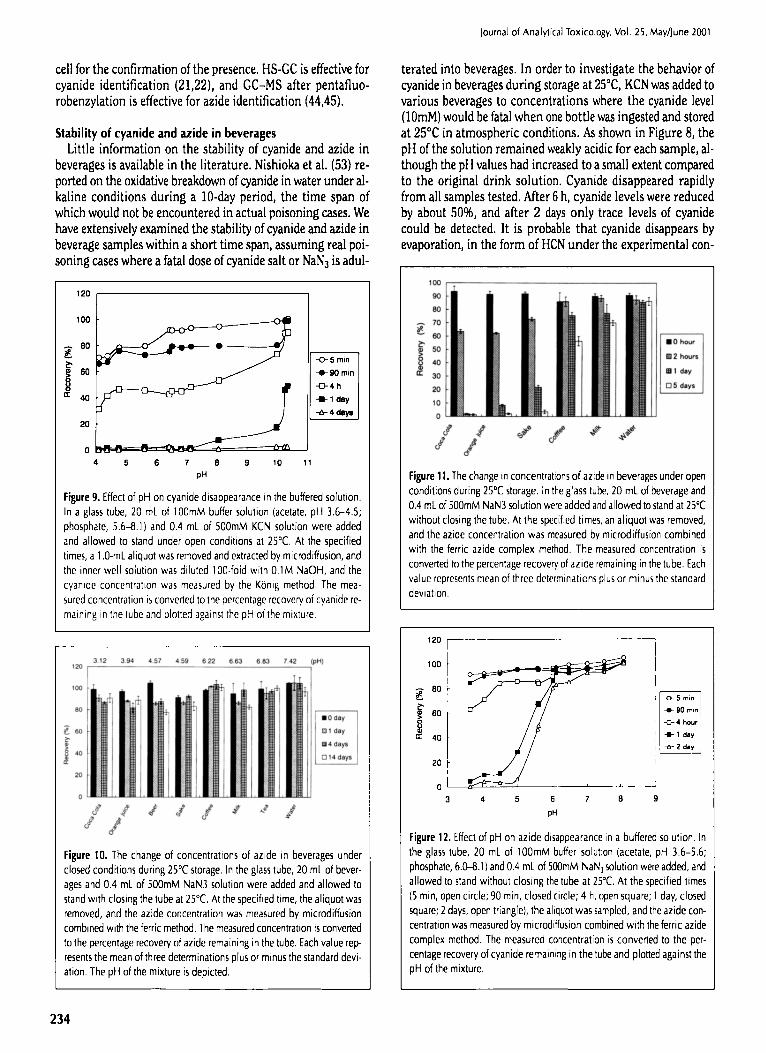
Figure 8. The change in concentrations of cyanide in beverages under open conditions during 25~ storage. In the glass tube (30-ram i.d.), 20 mL of beverages and 0.4 mL of 500mM KCN solution were added and allowed to stand without closing the tube at 25~ At the specified times, a 1.0-mL aliquot was removed and extracted by microdiffusion, the inner well so- lution was diluted 100-fold with 0.1M NaOH, and the cyanide concen- tration was measured by the K6nig method. The measured concentration is converted to the percentage recovery of cyanide remaining in the tube. Each value represents the mean of three determinations plus or minus the standard deviation. The pH of the mixture is depicted.
Table III. Determination of a Mixture of Cyanide and Azide*
Absorbance Cyanide (mM) Azide (mM) observed calculated calculated
Method (B.G.) (recovery) (recovery)
KOnig 0.385 + 0.014 5.16 + 0.19mM (0.009 + 0.000) (103.2 + 3.7%)
Ferric 0.757 + 0.019 5.58 + 0.14mM (0.386 + 0.088) (111.6 _+ 2.8%)
Ferric 5.16 + 0.13mM corrected * (103.2 + 2.6%)
Cerium 0.539 + 0.012 5.15 + 0.11 mM (0.754 + 0.054) (103.0 + 2.2%)
* A solution containing 5.0mM KCN and 5.0mM NaN 3 was subjected to the established microdiffusion spectrophotometric method. The concentration of cyanide in the inner well was measured by the KOnig method, and that of azide was measured by both ferric and cerium methods. The result was an average of five determinations plus or minus the standard deviation.
~" The observed absorbance value for the mixture solution was subtracted by the calculated value corresponding to the contribution of cyanide which level was measured by K6nig method.
these analytical conditions, the within-day repeatability (n = 6) was 2.54% (RSD) for the K~nig method (10mM in canned coffee drink solution), 2.15% for the ferric azide complex method and 2.31% for cerium method (10mM). The recovery was 101.2% for 5.0mM cyanide, 98.6% and 96.8% for 5.0raM azide using the ferric trichloride and the cerium reagents, re- spectively. If an analyst wishes to examine cyanide and azide more rapidly, a 10 min microdiffusion at 40~ and 5 min color reaction can be recommended as a semiquantitative method.
Evaluation of the established method From the qualitative aspect, the blue color development in
the K~nig reaction indicates the presence of cyanide, whereas a red color development with the ferric reagent indicates the presence of azide and a high level of cyanide. If cyanide is not detected in the K~nig reaction, the ferric color reaction indi- cates the presence of azide conclusively. If cyanide is detected in the K~nig reaction, the presence of azide can be confirmed by the cerium reaction, although the naked eye can not clearly distinguish the fading of the yellow color, especially at low levels. Oxidizable gases, hydrogen sulfide (H2S), sulfur oxide (SO2), and nitric acid (HNO2), severely interfere with both the ferric azide formation and the cerium oxido-reduction methods (Tables I and II). H2S can be detected if a commercial sulfur product is adulterated. In Japan, a commercial sulfur product such as a mixture of lime and sulfur has been used as agricul- tural chemicals and bath supplements, and there have been several suicide cases as the result of taking such a product (51). SO2 can be detected if Na2SO3, which is used in photo- graphic film development, is adulterated. HNO2 can be de- tected if NaNO2, which is used for a bleaching reagent, is adul- terated. However, in Japan, only a few poisoning cases involving sulfite and nitrite (51) have been reported. As for sulfide, its presence can be detected by a strong sulfur smell, or it can be specifically detected by an additional spectrophotometric method involving methylene blue formation (48). This method, which consists of mixing 0.17 mL of the inner well solution with 0.02 mL of 0.2% p-aminodimethylaniline in 10N H2SO 4 and 0.01 mL of 0.33% ferric trichloride in 0.36N H2SO 4 and measuring absorbance at 670 nm after a 15 min incubation, can quantitate sulfide below 25pM in beverages. Nitrite is not evaporated in the form of HNO2 but as nitric oxide, so there is little possibility of interference by nitrite. As an alternative choice, capillary electrophoresis permits the rapid and simple simultaneous determination of various kinds of anions for the extracted solution without interference by oxidizable volatile anions (52).
We examined the appropriateness of the established method for measuring a mixture of cyanide and azide. As shown in Table III, cyanide was quantitated accurately for the solution by the K~nig method. The cerium method also accurately deter- mined the level of azide. Although the ferric method gave an artifactually raised absorbance value, the correction from the cyanide data obtained by K~nig method permits the accurate quantitation of azide.
When cyanide or azide is positive in the established method, more specific analytical methods should be performed on the remaining extracted solution in the inner well of the Conwey
233
Journal of Analytical Toxicology, Vol. 25, May/June 2001
cell for the confirmation of the presence. HS-GC is effective for cyanide identification (21,22), and GC-MS after pentafluo- robenzylation is effective for azide identification (44,45).
Stability of cyanide and Ride in beverages Little information on the stability of cyanide and azide in
beverages is available in the literature. Nishioka et al. (53) re- ported on the oxidative breakdown of cyanide in water under al- kaline conditions during a 10-day period, the time span of which would not be encountered in actual poisoning cases. We have extensively examined the stability of cyanide and azide in beverage samples within a short time span, assuming real poi- soning cases where a fatal dose of cyanide salt or NaN3 is adul-
120
IO0
~, eo
2O
0 4 5 6 7 B 9 10 11
pH
Figure 9. Effect of pH on cyanide disappearance in the buffered solution. In a glass tube, 20 mL of 100raM buffer solution (acetate, pH 3.6-4.5; phosphate, 5.6-8.1) and 0.4 mL of 500mM KCN solution were added and allowed to stand under open conditions at 25~ At the specified times, a 1.0-mL aliquot was removed and extracted by microdiffusion, and the inner well solution was diluted 100-fold with 0.1M NaOH, and the cyanide concentration was measured by the Konig method. The mea- sured concentration is converted to the percentage recovery of cyanide re- maining in the tube and plotted against the pH of the mixture.
3 1 2 3 9 4 4 5 7 4 5 9 6 2 2 6 6 3 6 8 3 ?'42 (pH) 120 r I
! " ": " T " T
~'6o
i,~ ' ~ / /
Figure I0. The change of concentrations of azide in beverages under closed conditions during 25~ storage. In the glass tube, 20 mL of bever- ages and 0.4 mL of 500ram NaN3 solution were added and allowed to stand with closing the tube at 25~ At the specified time, the aliquot was removed, and the azide concentration was measured by microdiffusion combined with the ferric method. The measured concentration is converted to the percentage recovery of azide remaining in the tube. Each value rep- resents the mean of three determinations plus or minus the standard devi- ation. The pH of the mixture is depicted.
terated into beverages. In order to investigate the behavior of cyanide in beverages during storage at 25~ KCN was added to various beverages to concentrations where the cyanide level (]0raM) would be fatal when one bottle was ingested and stored at 25~ in atmospheric conditions. As shown in Figure 8, the pH of the solution remained weakly acidic for each sample, al- though the pH values had increased to a small extent compared to the original drink solution. Cyanide disappeared rapidly from all samples tested. After 6 h, cyanide levels were reduced by about 50%, and after 2 days only trace levels of cyanide could be detected. It is probable that cyanide disappears by evaporation, in the form of HCN under the experimental con-
lOO
9o
BO
70
~ 3o 2o
10 0
J /
Figure 11. The change in concentrations of azide in beverages under open conditions during 25~ storage. In the glass tube, 20 mL of beverage and 0.4 mL of 500mM NaN3 solution were added and allowed to stand at 25~ without dosing the tube. At the specified times, an aliquot was removed, and the azide concentration was measured by microdiffusion combined with the ferric azide complex method. The measured concentration is converted to the percentage recovery of azide remaining in the tube. Each value represents mean of three determinations plus or minus the standard deviation.
n"
120 I
100 t i
8o ~
40
20 I- I
ol a
I
[ -o- 90 m,
I ~ L :~Y , -~" 2 day
4 5 6 7 8 9
pH
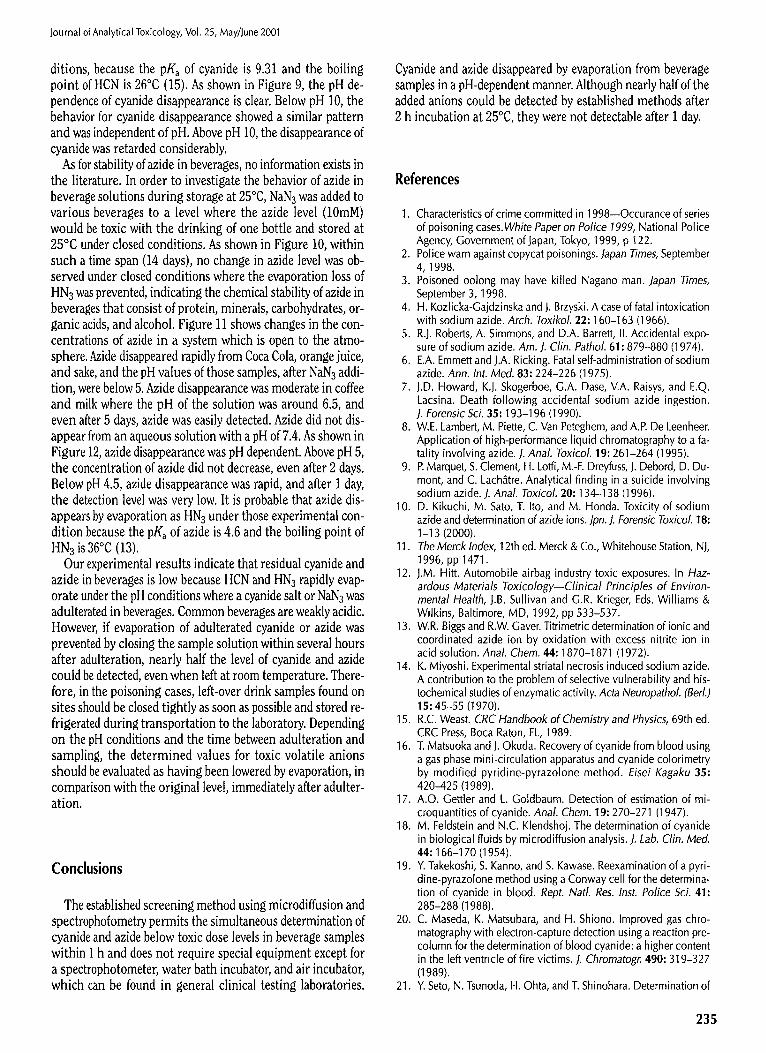
Figure 12. Effect of pH on azide disappearance in a buffered solution. In the glass tube, 20 mL of 100ram buffer solution (acetate, pH 3.6-5.6; phosphate, 6.{~8.1) and 0.4 mL of 500raM NaN] solution were added, and allowed to stand without dosing the tube at 25~ At the specified times (5 rain, open circle; 90 rain, closed circle; 4 h, open square; I day, closed square; 2 days, open triangle), the aliquot was sampled, and the azide con- centration was measured by microdiffusion combined with the ferric azide complex method. The measured concentration is converted to the per- centage recovery of cyanide remaining in the tube and plotted against the pH of the mixture.
234
Journal of Analytical Toxicology, Vol. 25, May/June 2001
ditions, because the PKa of cyanide is 9.31 and the boiling point of HCN is 26~ (15). As shown in Figure 9, the pH de- pendence of cyanide disappearance is clear. Below pH 10, the behavior for cyanide disappearance showed a similar pattern and was independent of pH. Above pH 10, the disappearance of cyanide was retarded considerably.
As for stability of azide in beverages, no information exists in the literature. In order to investigate the behavior of azide in beverage solutions during storage at 25~ NaN3 was added to various beverages to a level where the azide level (10mM) would be toxic with the drinking of one bottle and stored at 25~ under closed conditions. As shown in Figure 10, within such a time span (14 days), no change in azide level was ob- served under closed conditions where the evaporation loss of HN3 was prevented, indicating the chemical stability of azide in beverages that consist of protein, minerals, carbohydrates, or- ganic acids, and alcohol. Figure 11 shows changes in the con- centrations of azide in a system which is open to the atmo- sphere. Azide disappeared rapidly from Coca Cola, orange juice, and sake, and the pH values of those samples, after NaN3 addi- tion, were below 5. Azide disappearance was moderate in coffee and milk where the pH of the solution was around 6.5, and even after 5 days, azide was easily detected. Azide did not dis- appear from an aqueous solution with a pH of 7.4. As shown in Figure 12, azide disappearance was pH dependent. Above pH 5, the concentration of azide did not decrease, even after 2 days. Below pH 4.5, azide disappearance was rapid, and after 1 day, the detection level was very low. It is probable that azide dis- appears by evaporation as HN3 under those experimental con- dition because the PKa of azide is 4.6 and the boiling point of HN3 is 36~ (13).
Our experimental results indicate that residual cyanide and azide in beverages is low because HCN and HN3 rapidly evap- orate under the pH conditions where a cyanide salt or NaN 3 was adulterated in beverages. Common beverages are weakly acidic. However, if evaporation of adulterated cyanide or azide was prevented by closing the sample solution within several hours after adulteration, nearly half the level of cyanide and azide could be detected, even when left at room temperature. There- fore, in the poisoning cases, left-over drink samples found on sites should be closed tightly as soon as possible and stored re- frigerated during transportation to the laboratory. Depending on the pH conditions and the time between adulteration and sampling, the determined values for toxic volatile anions should be evaluated as having been lowered by evaporation, in comparison with the original level, immediately after adulter- ation.
Conclusions
The established screening method using microdiffusion and spectropho[ometry permits the simultaneous determination of cyanide and azide below toxic dose levels in beverage samples within 1 h and does not require special equipment except for a spectrophotometer, water bath incubator, and air incubator, which can be found in general clinical testing laboratories.
Cyanide and azide disappeared by evaporation from beverage samples in a pH-dependent manner. Although nearly half of the added anions could be detected by established methods after 2 h incubation at 25~ they were not detectable after I day.
References
1. Characteristics of crime committed in 1998--Occurance of series of poisoning cases.White Paper on Police 1999, National Police Agency, Government of Japan, Tokyo, 1999, p 122.
2. Police warn against copycat poisonings. Japan Times, September 4, 1998.
3. Poisoned oolong may have killed Nagano man. Japan Times, September 3, 1998.
4. H. Kozlicka-Gajdzinska and J. Brzyski. A case of fatal intoxication with sodium azide. Arch. Toxikol. 22" 160-163 (1966).
5. R.J. Roberts, A. Simmons, and D.A. Barrett, II. Accidental expo- sure of sodium azide. Am. J. Clin. Pathol. 61" 879-880 (1974).
6. E.A. Emmett and J.A. Ricking. Fatal self-administration of sodium azide. Ann. Int. Med. 83:224-226 (1975).
7. J.D. Howard, K.J. Skogerboe, G.A. Dase, V.A. Raisys, and E.Q. Lacsina. Death following accidental sodium azide ingestion. J. Forensic Sci. 35:193-196 (1990).
8. W.E. Lambert, M. Piette, C. Van Peteghem, and A.P. De Leenheer. Application of high-performance liquid chromatography to a fa- tality involving azide. J. Anal. Toxicol. 19' 261-264 (1995).
9. P. Marquet, S. Clement, H. Lotfi, M.-F. Dreyfuss, J. Debord, D. Du- mont, and C. Lach~tre. Analytical finding in a suicide involving sodium azide. J. Anal. Toxicol. 20:134-138 (1996).
10. D. Kikuchi, M. Sato, T. Ito, and M. Honda. Toxicity of sodium azide and determination of azide ions. Jpn. J. Forensic ToxicoL 18: 1-13 (2000).
11. The Merck Index, 12th ed. Merck & Co., Whitehouse Station, NJ, 1996, pp 1471.
12. J.M. Hitt. Automobile airbag industry toxic exposures. In Haz- ardous Materials Toxicology--Clinical Principles of Environ- mental Health, J.B. Sullivan and G.R. Krieger, Eds. Williams & Wilkins, Baltimore, MD, 1992, pp 533-537.
13. W.R. Biggs and R.W. Gaver. Titrimetric determination of ionic and coordinated azide ion by oxidation with excess nitrite ion in acid solution. Anal. Chem. 44:1870-1871 (1972).
14. K. Miyoshi. Experimental striatal necrosis induced sodium azide. A contribution to the problem of selective vulnerability and his- tochemical studies of enzymatic activity. Acta Neuropathol. (Berl.) 15:45-55 (1970).
15. R.C. Weast. CRC Handbook of Chemistry and Physics, 69th ed. CRC Press, Boca Raton, FL, 1989.
16. T. Matsuoka and J. Okuda. Recovery of cyanide from blood using a gas phase mini-circulation apparatus and cyanide colorimetry by modified pyridine-pyrazolone method. Eisei Kagaku 35: 420-425 (1989).
17. A.O. Gettler and L. Goldbaum. Detection of estimation of mi- croquantities of cyanide. Anal. Chem. 19- 270-271 (1947).
18. M. Feldstein and N.C. Klendshoj. The determination of cyanide in biological fluids by microdiffusion analysis. J. Lab. Clin. Med. 44:166-170 (1954).
19. Y. Takekoshi, S. Kanno, and S. Kawase. Reexamination of a pyri- dine-pyrazolone method using a Conway cell for the determina- tion of cyanide in blood. Rept. Natl. Res. Inst. Police Sci. 41: 285-288 (1988).
20. C. Maseda, K. Matsubara, and H. Shiono. Improved gas chro- matography with electron-capture detection using a reaction pre- column for the determination of blood cyanide: a higher content in the left ventricle of fire victims. J. Chromatogr. 490" 319-327 (1989).
21. Y. Seto, N. Tsunoda, H. Ohta, and T. Shinohara. Determination of
235
Journal of Analytical Toxicology, Vol. 25, May/June 2001
blood cyanide by headspace gas chromatography with nitrogen- phosphorus detection and using a megabore capillary column. Anal. Chim. Acta 276:247-259 (1993).
22. Y. Seto. Determination of physiological levels of blood cyanide without interference by thiocyanate. Jpn. J. Toxicol. Environ. Health 42:319-325 (1996).
23. A. Ishii, H. Seno, K. Watanabe-Suzuki, and O. Suzuki. Determi- nation of cyanide in whole blood by capillary gas chromatog- raphy with cryogenic oven trapping. Anal. Chem. 70:4873-4876 (1998).
24. K. Takekawa, M. Oya, A. Kido, and O. Suzuki. Analysis of cyanide in blood by headspace solid-phase microextraction and capillary gas chromatography. Chromatographia 47:209-214 (1998).
25. J.A. Ryan and G.W. Culshaw. The use of p-dimethylaminoben- zylidene-rhodanine as an indicator for the volumetric determi- nation of cyanides. Analyst 69:370-371 (1944).
26. J. Epstein. Estimation of microquantities of cyanide. Anal. Chem. 19:272-274 (1947).
27. A. Sano, M. Takezawa, and S. Takitani. Spectrofluorimetric de- termination of cyanide in blood and urine with naphthalene- 2,3-dialdehyde and taurine. Anal. Chim. Acta 225:351-358 (1989).
28. J.O. Egekeze and F.W. Oehme. Direct potentiometric method for the determination of cyanide in biological materials. ]. Anal. Toxicol. 3:119-124 (1979).
29. A.M. Bond, I.D. Heritage, G.G. Wallace, and M.J. McCormick. Si- multaneous determination of free sulfide and cyanide by ion chromatography with electrochemical detection. Anal. Chem. 54" 582-585 (1982).
30. S. Chinaka, N. Takayama, Y. Michigami, and K. Ueda. Simulta- neous determination of cyanide and thiocyanate in blood by ion chromatography with fluorescence and ultraviolet detection. J. Chromatogr. B 713:353-359 (1998).
31. E.L. Grove, R.S. Braman, H.F. Combs, and S.B. Nicholson. Anal. Chem. 34" 682-685 (1962).
32. A.A. Schilt and J.W. Sutherland. A reversible internal indicator for sodium nitrite titrations. Anal. Chem. 36" 1805-1807 (1964).
33. R.G. Clem and E.H. Huffman. Determination of azide ion by hy- drogen ion titration after oxidation with nitrite. Anal. Chem. 37: 366-368 (1965).
34. C.E. Robertson and C.M. Austin. Colorimetric estimation of mil- ligram quantities of inorganic azides. Anal. Chem. 29:854-855 (1957).
35. A. Anton, J.G. Dodd, and A.E. Harvey, Jr. Spectrophotometric de- termination of azide with ferric perchlorate. Anal. Chem. 32: 1209-1210 (1960).
36. E.K. Dukes and R.M. Wallace. Determination of hydrazoic acid and ferric ion by spectrophotometric measurement of the ferric azide complex. Anal. Chem. 33" 242-244 (1961 ).
37. E.A. Terpinski. Spectrophotometric determination of sodium azide. Analyst 110:1403-1405 (1985).
38. H. Mackie, S.J. Speciale, L.J. Throop, and T. Yang. Ion chro- matographic determination of the azide ion in a prealbumin frac- tion from human serum. J. Chromatogr. 242:177-180 (1982).
39. P.L. Annable and L.A. Sly. Azide determination in protein samples by ion chromatography. J. Chromatogr. 546:325-334 (1991 ).
40. R. Kruszyna, R.P. Smith, and H. Kruszyna. Determining sodium azide concentration in blood by ion chromatography. J. Forensic Sci. 43" 200-202 (1998).
41. J.M. Zehner and R.A. Simonaitis. Gas chromatographic determi- nation of hydrazoic acid. J. Chromatogr. Sci. 14:493-494 (1976).
42. E. Kubaszewski, Z. Kurzawa, and M. Lozynski. Determination of microgram amounts of azides by gas chromatography. Anal. Chim. Acta 196:267-270 (1987).
43. J. Vacha, M. Tkaczykova, and M. Rejholcova. Determination of sodium azide in the presence of proteins by high-performance liquid chromatography. J. Chromatogr. B 488:506-508 (1989).
44. S. Kage, T. Nagata, and K. Kudo. Determination of cyanide and thiocyanate in blood by gas chromatography and gas chro- matography-mass spectrometry. J. Chromatogr. B 675:27-32 (1996).
45. A. Miki, M. Nishikawa, and H. Tsuchihashi. Simultaneous GC-MS determination of azide, cyanide and thiocyanate via phase- transfer-catalyzed pentafluorobenzylation. J. Health Sci. 46' 81-88 (2000).
46. M. Holzbecher and H.A. Ellenberger. An Evaluation and modifi- cation of a microdiffusion method for the emergency determina- tion of blood cyanide. J. Anal. Toxicol. 9:251-253 (1985).
47. M. Laforge, F. Buneaux, P. Houete, E Bourgeois, R. Bourdon, and P. Levillain. A rapid spectrophotometric blood cyanide de- termination applicable to emergency toxicology. J. Anal. Tox- icol. 18" 173-175 (1994).
48. The Pharmaceutical Society of Japan. Standard Methods of Chem- ical Analysis in Poisoning with Commentary, 4th ed. Nanzan-do, Tokyo, Japan, 1992, pp 67-68.
49. K. Tsuge, M. Kataoka, and Y. Seto. Cyanide and thiocyanate levels in blood and saliva of healthy adult volunteers. J. Health Sci. 46' 343-350 (2000).
50. Police look for culprit in Wakayama cyanide slayings. Japan Times, July 27, 1998.
51. National Research Institute of Police Science. Annual Case Re- ports of Drug and Toxic Poisoning in Japan 1959-2000, No. 1-42. National Police Agency, Kashiwa, Japan, 2000.
52. Hewlett-Packard Forensic Anion Analysis (HP Part No. 12-5968- 390 3E). Yokogawa Analytical Systems, Tokyo, Japan, 1999.
53. H. Nishioka, M. Nishikawa, M. Katagi, M. Tatsuno, and H. Tsuchi- hashi. Analysis of cyanide compounds using Fourier transform Raman spectroscopy. Jpn. J. Sci. Technol. Identif. 4:61-66 (2000).
Manuscript received June 26, 2000; revision received September 27, 2000.
236


