
Reconnaissance of the Ground- Water Resources of the Arkansas Valley Region Arkansas1y ROBERT M. CORDOVA
:ONTRIBUTIONS TO THE HYDROLOGY OF THE UNITED STATES
GEOLOGICAL SURVEY WATER-SUPPLY PAPER 1669-BB
Prepared in cooperation with lhe Arkansas Geological and Conservation Commission
FNITED STATES GOVERNMENT PRINTING OFFICE, WASHINGTON : 1963
UNITED STATES DEPARTMENT OF THE INTERIOR
STEWART L. UDALL, Secretary
GEOLOGICAL SURVEY
Thomas B. Nolan, Director
For sale by the Superintendent of Documents, U.S. Government Printing Office Washington, D.C., 20402

CONTENTS
Abstract____________________________________ BBlIntroduction. _____ ______________________________________________ 2
Fieldwork_ _____..._.___________________________ 3Acknowledgments. ____________________________________________ 3Well-numbering system-___-_-__-__-_--_---____-_--_-_--------- 3
Geographic setting____________________________________________ 3Location and limits of region__________________________________ 3Topography, drainage, and climate______________________________ 4Economy and resources________________________________________ 5
Geologic setting.._________________________________________________ 6Rock units__________________________________________________ 6
Rocks of Ordovician to Mississippian age____________---______ 6Rocks of Mississippian age________________________________ 7
Stanley Shale____-__-______--_-_-____-_-____-__-_--___ 7Jackfork Sandstone_____________--________-_--_________ 7
Rocks of Pennsylvanian age___________-_________----_______ 7Atoka Formation______________.____.__________________ 7Hartshorne Sandstone_______________________ .______. 9McAlester Shale_______-__--_________ ____ 9Savanna Sandstone____________________________-_______ 11Boggy Shale.___________________________ 12
Rocks of Quaternary age_________________________-_________ 13Structure._ ___________________________________________________ 15
Water resources ___________________________________________________ 16Streamflow ___________________________________________________ 16Ground water_________________________________________________ 16
Occurrence-______________________________________________ 16Water-bearing openings in alluvial deposits _______________ 16Water-bearing openings in consolidated rocks _____________ 17Water-table and artesian conditions____________________ 19
Movement__ ____________________________________________ 20Depth to water and water-level fluctuations________________ 20Chemical quality and temperature___________________________ 22Ground-water development____________________-_--__-___-__ 27
Types of wells_____________________________ 27Rural-domestic, agricultural, public, and industrial supplies, 27Pumping tests and well yields___________________________ 29Potential development and limiting factors ________ _ ____ 31
Summary of principal conclusions___________ ________ _______ 33References cited___________________________________________________ 33
in

IV CONTENTS
ILLUSTRATIONS
PagePLATE 1. Detailed geologic section of part of the western Arkansas Valley
region.._______________________________________ In pocketFIGURE 1. Map of Arkansas_______________________ BB2
2. Diagram showing well-numbering system._____ 43. Diagrammatic transverse section of a major tributary valley._ 134. Diagrammatic section showing the two types of wells used in
the consolidated rocks______________________________ 175. Diagrammatic section illustrating relation of wells to a large
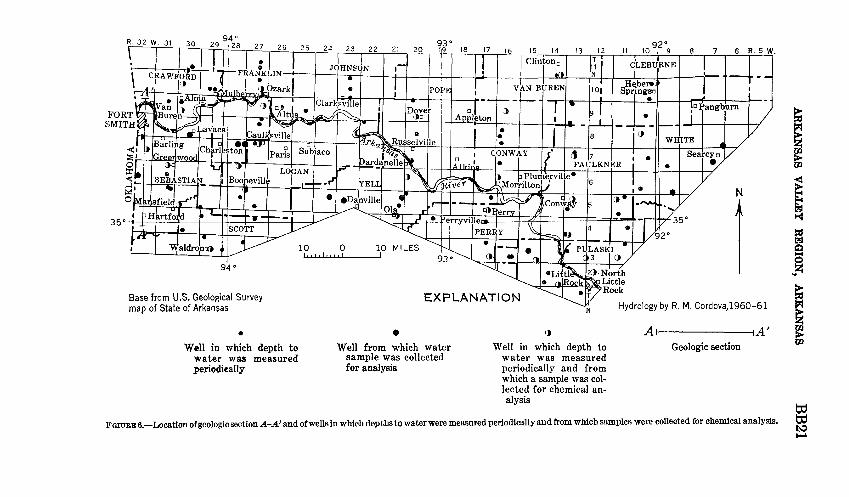
water-bearing joint____________-____---__------_-_- __ 186. Location of geologic section A-A' and wells_________. _ 21
TABLES
PageTABLE 1. Post-Atoka rock units of Pennsylvanian age used on the "Geo
logic Map of Arkansas" correlated with those used in this report________________________________ BB6
2. Selected records of borings in the tributary alluvium...________ 143. Chemical analyses of water from wells in the Arkansas Valley
region__________________________________ 244. Municipalities having public water supplies_________ _____ 285. Pumping-test data.__________________________________ 30

CONTRIBUTIONS TO THE HYDROLOGY OF THE UNITED STATES
RECONNAISSANCE OF THE GROUND-WATER RESOURCES OF THE ARKANSAS VALLEY REGION, ARKANSAS
By ROBEBT M. COBDOVA
ABSTRACT
The Arkansas Valley region, as defined in this report, includes about 7,200 square miles in the Interior Highlands of Arkansas. The total ground water used in 1960 was computed to be 19.0 mgd. Rural-domestic needs required 8.7 mgd, municipalities 1.2 mgd, and agriculture, which includes irrigation and the watering of livestock and poultry, 9.1 mgd.
Ground water occurs in two distinct environments in the Arkansas Valley region. One includes the alluvial deposits of Quaternary age of the Arkansas River and its tributaries; the other includes the consolidated rocks of Pennsyl- vanian to Ordovician age, which underlie the entire region. The present report is primarily concerned with the consolidated rocks and the alluvium of the tributary streams.
The consolidated rocks are the principal source of ground water outside the alluvial area of the Arkansas River. Most wells probably will not yield more than 60 gpm, although 1 well yielded 100 gpm. Rural homes, poultry and livestock farms, small commercial establishments, and small municipalities generally pump water from wells 50 to 200 feet deep. The depth to an adequate water supply is con trolled by the size, degree of interconnection, and number of water-bearing openings intercepted by the well and not by the rock unit. Depth of drilling is limited by the depth to salt water, which ranges from about 500 to 2,000 feet but in most places is about 1,000 feet. If a water supply must be obtained from the consoli dated rocks, then a detailed geologic and ground-water study should be made. From the data obtained, depths and locations of wells can be chosen which will take advantage of the optimum conditions of occurrence and movement of ground water.
Alluvial deposits of the tributary streams cannot be utilized as major sources of ground water because of their low permeability. Test drilling may prove valuable in locating high-permeability zones. In most of the region the available ground water satisfies rural-domestic needs, but larger supplies must be sought in the underlying consolidated rocks.
Chemical analyses of well water in the consolidated rocks show that the sodium anion and the bicarbonate cation predominate in most of the rock units, that the dissolved-solids content generally is less than 500 ppm, that the iron content is less than 2.0 ppm, and that the hardness is less than 200 ppm. Water temperatures
BB1
BB2 CONTRIBUTIONS TO HYDROLOGY OP THE UNITED STATES
ranging from 61° to 63 °F were recorded in most wells in the consolidated rocks having depths to water greater than 20 feet and in all wells that were pumped for long periods of time.
INTRODUCTION
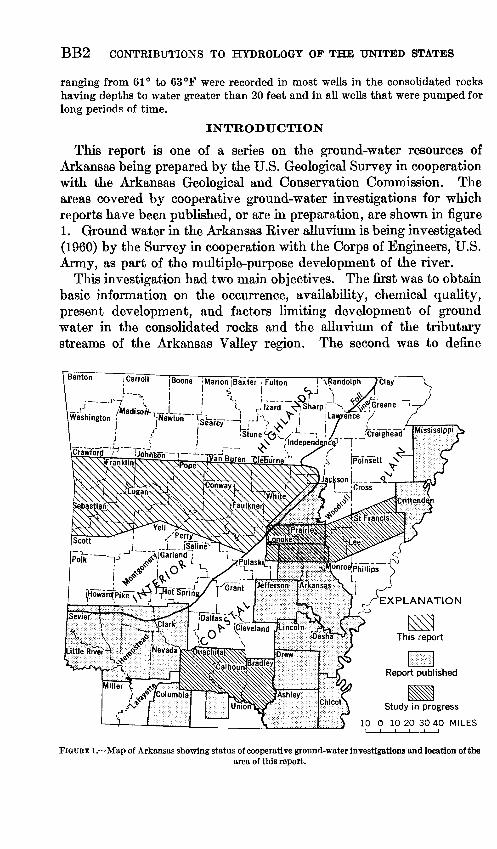
This report is one of a series on the ground-water resources of Arkansas being prepared by the U.S. Geological Survey in cooperation with the Arkansas Geological and Conservation Commission. The areas covered by cooperative ground-water investigations for which reports have been published, or are in preparation, are shown in figure 1. Ground water in the Arkansas River alluvium is being investigated (1960) by the Survey in cooperation with the Corps of Engineers, U.S. Army, as part of the multiple-purpose development of the river.
This investigation had two main objectives. The first was to obtain basic information on the occurrence, availability, chemical quality, present development, and factors limiting development of ground water in the consolidated rocks and the alluvium of the tributary streams of the Arkansas Valley region. The second was to define
Be I 03"0" [Boone jMarion [Baxter I Fulton I ^Randolph jJClay"
Washington .
Study in progress
10 0 10 20 3040 MILES
FIGURE 1. Map of Arkansas showing status of cooperative ground-water investigations and location of thearea of this report.

ARKANSAS VALLEY REGION, ARKANSAS BB3
areas or problems requiring detailed investigations so that the regional ground-water situation can be evaluated on a sound basis.
FIELDWORK
The fieldwork was accomplished between July 1960 and March 1961 and was concentrated along seven data-collection lines which were transverse to the regional structure. On these lines, depth to water was measured periodically in 108 selected wells, and 29 samples of water were collected for chemical analysis. Analyses were made by the Branch of Quality of Water, U.S. Geological Survey, Fayetteville, Ark. Pumping tests were made at eight well sites. Geologic structures and lithologies were studied in roadcuts, quarries, and wells to deter mine their importance in the occurrence and movement of ground water. Records of gas tests, wells and bridge-foundation borings were studied to determine the lithology of the units below the surface. Additional data on the geology (Croneis, 1930; Hendricks and Parks, 1950), chemical quality, and pumping tests were already available and are incorporated in this report.
ACKNOWLEDGMENTS
Appreciation is extended to all who contributed to the information used in this report. Residents permitted use of their wells for the measurement of water levels, for the collection of water samples, and for pumping tests. They also supplied information on availability and character of water that otherwise would not have been obtainable. The Arkansas State Highway Commission supplied records of borings at bridge sites. Carter Oil Co., Gulf Oil Corp., and Shell Oil Co. supplied records of gas tests and wells.
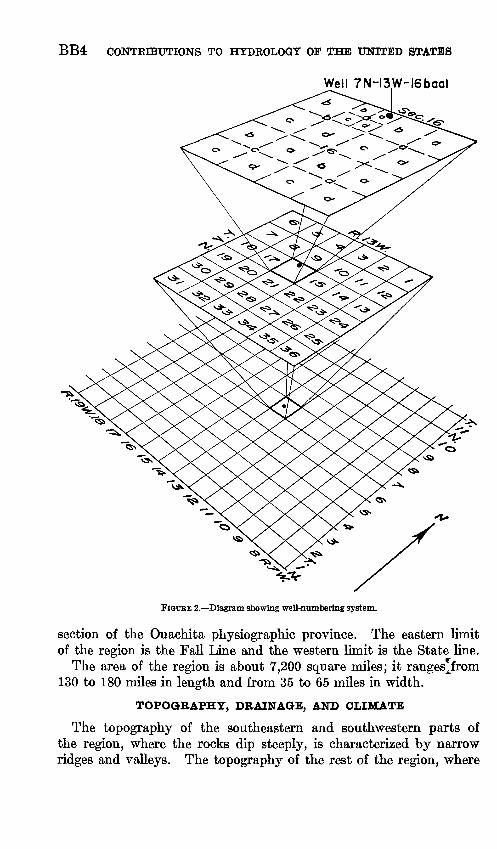
WELL-NUMBERING SYSTEM
Locations of water wells, borings, gas tests, and geologic sections are given according to the system of land subdivision of the U.S. Bureau of Land Management. (See fig. 2.) For example, the number of well 7N-13W-16baal indicates that it is the first well inventoried in the NE^NE^NWK sec. 16, T. 7 N., R. 13 W. The next weU inventoried in the same quarter-quarter-quarter section is designated 7N-13W-16baa2, and so on.
GEOGRAPHIC SETTING
LOCATION AND LIMITS OF REGION
The Arkansas Valley region is part of the Interior Highlands of Arkansas (fig. 1). Most of the region lies in the Arkansas Valley section of the Ouachita physiographic province (Fenneman, 1938). However, for this report, it includes a part of the Ouachita Mountain
BB4 CONTRIBUTIONS TO HYDROLOGY OP THE UNITED STATES
Well 7N-l3W-l6baal
FIGTJEE 2. Diagram showing well-numbering system.
section of the Ouachita physiographic province. The eastern limit of the region is the Fall Line and the western limit is the State line.
The area of the region is about 7,200 square miles; it ranges^from 130 to 180 miles in length and from 35 to 65 miles in width.
TOPOGRAPHY, DRAINAGE, AND CLIMATE
The topography of the southeastern and southwestern parts of the region, where the rocks dip steeply, is characterized by narrow ridges and valleys. The topography of the rest of the region, where
ARKANSAS VALLEY REGION, ARKANSAS BB5
the rocks dip gently, is characterized by rolling lowlands, synclinal mountains, and cuestas.
The lowlands generally do not exceed 500 feet in altitude, and the highlands generally are less than 1,000 feet. Some of the synclinal mountains, however, have altitudes exceeding 2,000 feet. The maximum altitude in the region is 2,823 feet.
Most of the region lies in the drainage basin of the Arkansas River. The northeast corner of the region is drained by the Little Red River. The southeast edge of the region is drained by several bayous that flow into the Coastal Plain.
The Arkansas Valley region has short mild winters and long hot summers. The growing season is at least 200 days and in some localities is as much as 244 days. Precipitation generally is in the form of showers, and amounts are measurable on the average of 100 days annually. The mean annual precipitation for the region is about 48 inches. The mean minimum temperature is about 40° F and the mean maximum about 83° F an average of about 62° F for the region.
ECONOMY AND RESOURCES
The economy of the region is basically agricultural. Corn, cotton, clover, grapes, oats, peaches, sorghum, soybeans, and strawberries are important crops. Truck farming, dairying, livestock, and poultry raising also form a large part of the agricultural base. Industry is tied, to a large extent, to the agriculture and timber of the region. Large industrial plants are in the cities along the Arkansas River, and small factories are in many towns throughout the region.
The mineral resources of the region include natural gas, coal, dimension stone, crushed stone, shale, sand, and gravel. Natural gas has been obtained in 10 counties, and reserves have been estimated to be more than 900 trillion cubic feet (Arkansas Oil and Gas Comm., 1959), which includes reserves of 1 county and parts of 4 counties not in the report area. The coal mines produced 441,000 short tons of coal in 1959. Dimension stone has been quarried in 5 counties, and more than 22,000 short tons was quarried in 1959, most of which came from Logan County. More than 4 million short tons of crushed stone was supplied by 5 counties in 1959. More than 151,000 short tons of shale, used in the manufacture of brick and tile and as a light weight aggregate, was mined in Sebastian County in 1959. Six counties supplied more than 6K million tons of sand and gravel mined from the alluvium of the Arkansas River in 1959.
A significant expansion of the economy of the Arkansas Valley region is foreseen after the completion of the multiple-purpose development of the Arkansas River. This development is in progress (1960) and
695-904 63 2

BB6 CONTRIBUTIONS TO HYDROLOGY OF THE UNITED STATES
consists of reservoir and navigation projects. This expansion will necessarily increase the development of the natural resources including the ground-water resources.
GEOLOGIC SETTING
Ground water occurs in rocks, and a knowledge of the structure and composition of the rock units of a region is basic to the under standing of the occurrence, movement, availability, chemical quality, and potential development of the ground-water resources of that region. Included in this section are general descriptions of all the rock units in the region. Detailed logs and sections are included for those units which furnish most of the ground-water supply. Structure is discussed in general in this section and in detail in other sections of this report where relationships to the occurrence and movement of gound water can be shown.
BOCK UNITS
The Arkansas Valley region is underlain by consolidated rocks of Ordovician to Pennsylvanian age and by terrace and flood-plain deposits of Quarternary age. The location and extent of each rock unit are shown on the "Geologic Map of Arkansas" (1929). The U.S. Geological Survey currently uses a classification for the post- Atoka rock units of Pennsylvanian age which differs from that used on the State geologic map. Correlation of these two classifications is shown in table 1.
ROCKS OF ORDOVICIAN TO MISSISSIPPIAN AGE
Rocks of Ordovician to Mississippian age include the Bigfork Chert and Polk Creek Shale of Ordovician age, the Missouri Mountain Slate of Silurian age, and the Arkansas Novaculite of Devonian and Mississippian ages. These rocks crop out in the southeastern part of
TABLE 1. Post-Atoka rock units of Pennsylvanian age used on]the "Geologic Map of Arkansas" correlated with those used in this report
"Geologic Map of Arkansas"
Savanna Sandstone
Paris Shale
Fort Smith Formation
Spadra Shale
Hartshorne Sandstone
This report
Boggy Shale
Savanna Sandstone
McAlester Shale
Hartshorne Sandstone

ARKANSAS VALLEY REGION, ARKANSAS BB7
the region, mainly in Pulaski County. Lithologic descriptions of these rock units are not included in the report because their water bearing properties were not considered in the investigation.
BOCKS OF MISSI8SIPPIAN AGE
STANLEY SHALE
The Stanley Shale overlies the Arkansas Novaculite and in the Arkansas Valley region crops out in Perry and Pulaski Counties (Charles Stone, oral communication, 1960). Complex folding has prevented accurate determinations of thickness, although a maximum of about 6,000 feet was mentioned by Croneis (1930).
The Stanley Shale is composed of bluish or black fissile clay shale, interbedded with fine-grained greenish-gray or bluish-gray sandstone. Some of the shale is highly carbonaceous and soils the fingers. Locally, the shale has been metamorphosed into hard slate. Quartz veins of many sizes commonly are seen in this rock unit.
JACEFORE SANDSTONE
The Jackfork Sandstone overlies the Stanley Shale. Within the Arkansas Valley region, the unit crops out in Perry and Pulaski Counties (Charles Stone, oral communication, 1960). Faulting has prevented an accurate measurement of thickness. The maximum exposed thickness is about 2,300 feet, and the true thickness probably is double this figure.
The sandstone is either light or dark gray, the dark-gray variety containing considerable black mica. The sandstone grains show rounding, and the grain size generally ranges from very fine to fine. Feldspar generally is a constituent, although it varies in quantity from place to place. Silica is a cementing agent and, where abundant, the resulting rock is a hard, tough quartzite. Locally, black shale is interbedded with the sandstone. Because of its resistance to weather ing, the sandstone forms prominent ridges, and jointing is seen in all outcrops.
ROCKS OF PENNSYLVANIA!* AGE
ATOEA FORMATION
The Atoka Formation crops out over a larger area than that of any other rock unit in the Arkansas Valley region. The maximum re corded thickness is in Perry County where at least 9,400 feet is ex posed. The minimum thickness is in the northern part of the region and is less than 1,500 feet.
The Atoka Formation consists of alternating beds of sandstone, siltstone, and shale. Shale is the most abundant rock type in most of the region, except in the eastern part where sandstone is more abundant. The shale is black, gritty, and micaceous, and commonly

BBS CONTRIBUTIONS TO HYDROLOGY OF THE UNITED STATES
underlies the lowlands because of its lack of resistance to weathering and erosion. The sandstone and siltstone are light and dark, and the individual sand grains commonly range from very fine to medium. The silt and sand grains may be tightly cemented by silica to form a hard, resistant rock. These resistant rocks form the ridges of the Atoka terrane. The thickness of an individual bed may be only a fraction of an inch or several tens of feet. The thin sandstone beds commonly are associated with thick zones of black shale, and the thin beds of black shale with thick sandstone zones. Coal beds of local extent and less than 18 inches thick are distributed throughout the Atoka Formation. Pyrite is a constituent of the black shale in places. Thin limestone beds have been drilled through at depth in the northern part of the region.
The following partial log of a gas test illustrates the typical lithology and interbedded nature of the Atoka Formation.
Log of Atoka Formation in 9N-16W-ldbThickness
(feet)Sandstone, light-gray, fine- to coarse-grained_____ ___________________ 10Sandstone, light-gray, very fine grained to medium-grained; medium-gray
siltstone__ ________________________________________ 10Shale, dark-gray; light-gray, very fine grained to fine-grained sandstone;
medium-dark-gray siltstone________________________________ 10Shale, dark-gray; light-gray, fine- to coarse-grained sandstone.._____ 10Shale, dark-gray_______________________________________________ 10Shale, dark-gray; light-gray, very fine grained to fine-grained sandstone._ 10Sandstone, light-gray, very fine grained to coarse-grained; dark-gray shale. 10 Sandstone, Light-gray, very fine grained to medium-grained; dark-gray
shale__ _______________________________________ 10Sandstone, fine-grained; shale____________________________ 10Sandstone.___________________________________________________ 10Shale, sandstone_________________ _______________ 10Shale. .._____________________________________ 10Sandstone, fine- to medium-grained________________________________ 10Shale, sandstone...._____________________________________________ 10Shale...____.__________.______________________ 10Sandstone, shale_______________________________________________ 120Shale, dark-gray_______________________________________________ 9Sandstone, light-gray, very fine grained to fine-grained________________ 2Shale, dark-gray__________________________________ 9Sandstone, very Light gray, fine-grained_______________________ 6Shale, dark-gray____________________ _________ _ 6Sandstone, very light gray, fine-grained . 8Sandstone, as above; dark-gray shale________________________ 27Shale, dark-gray_ _ ___ ____ ___ _______ ___ _ _____ _ 9Sandstone, light-gray, very fine grained______ _____________________ 3Shale, dark-gray.. _ __ 1Shale, dark-gray; light-gray siltstone..._____ _____________ 10Shale, dark-gray___________________________________ 20

ARKANSAS VALLEY REGION, ARKANSAS BB9
Log of Atoka Formation in 9N-16W-ldb ContinuedThickness
(feet)Sandstone, medium-light-gray, fine-grained_________________ 4Shale, dark-gray_________________________________ 1Sandstone, medium-light-gray, fine-grained___________________ 1Shale, dark-gray. _____________ _____ 114
HARTSHOBNE SANDSTONE
The Hartshorne Sandstone overlies the Atoka Formation and crops out mainly west of the line between E. 20 W. and E. 21 W. (See fig. 6.) The Hartshorne Sandstone generally forms prominent ridges in its area of outcrop, and the thickness ranges from about 10 to about 300 feet. The sandstone is thick bedded, whitish to light gray or brownish, and medium grained. Locally, it may be shaly, saccharoidal and porous, silty to fine grained, and greenish. Shale makes up a small part of the Hartshorne Sandstone but locally attains significant thickness. The following partial log of a gas test illustrates the general lithology of the Hartshorne Sandstone.
Log of Hartshorne Sandstone in 8N-%2W-llaccThickness
(feet)No samples_______________________________________________ 10Sandstone, tan, very fine grained to fine-grained, siliceous, carbonaceous,
micaceous, hard, tightly cemented.________________________ 20Sandstone, tan, fine-grained, subangular grains, siliceous, carbonaceous,
micaceous, tightly cemented; dark micaceous carbonaceous very fine grained arenaceous shale. ___________________________________ _ 20
Sandstone, as above, with streaks of dark carbonaceous pyritiferous shale_ 30 Sandstone, as above but unconsolidated______________________________ 10Sandstone, light-gray, very fine grained to fine-grained, siliceous, carbo
naceous, micaceous, tightly cemented, hard-________________________ 10Sandstone, light-gray, fine- to coarse-grained, frosted grains, siliceous,
clayey, unconsolidated; scarce carbonaceous mottling ________________ 20Sandstone, light-gray, fine- to medium-grained, subangular grains, siliceous,
clayey, micaceous; tan-brown, very fine grained siliceous hard tightly cemented sandstone__________________________________ 20
Sandstone, as above, with loosely cemented streaks ______ _ _____--__-- 10Sandstone, gray, fine-grained, subangular grains, siliceous, clayey, carbo
naceous; scarce, brown glassy sandstone.__________ ___ ______ 10
McALESTER SHALE
The McAlester Shale overlies the Hartshorne Sandstone and its main area of outcrop is west of the line between E. 20 W. and E. 21 W. (See fig. 6.) In the western part of the region, the McAlester Shale ranges in thickness from about 500 to about 1,820 feet and mainly consists of dark gritty shale and minor sandstone, siltstone, and coal. Most of the sandstone is fine grained, thin bedded, micaceous, and pale buff in color. However, the sandstone near the base of the

BB10 CONTRIBUTIONS TO HYDROLOGY OF THE UNITED STATES
formation east of Hartford, Sebastian County, generally is coarse grained and massive, and the sandstone in the middle part, east of Caulksville, Logan County, is similar to the Hartshorne Sandstone in appearance. Individual sandstone beds generally are less than 50 feet thick and lenticular.
The following composite section of the McAlester Shale described by Hendricks and Parks (1950, p. 75) illustrates the general lithology of this rock unit.
Composite section of the McAlester Shale in 5N-32WFt In
Shale, gray, sandy, micaceous____-__----__--_--_-_--__-_--___ 250 0Shale, black, carbonaceous; contains ostracodes._______________ 4 0Coal-____________________________________ 3 Shale, black, carbonaceous____________________________________ 1 2Coal-___ ______________. ____.__________ 4Underclay, hard___________________________________________ 2 0Shale, gray, sandy, micaceous_____-_---_____-_______________ 170 0Shale, gray, clayey, fissile_______________ _ ___________ 5 0Coal, very impure; mostly carbonaceous shale __ ________ 8Underclay__--___-________________ _______ _______ 1 0Sandstone, dark, hard, dense, stigmarian_______________________ 8Sandstone, olive, shaly, soft, micaceous_______________________ 8Sandstone, gray, micaceous, ripple-marked; thickness of beds Ys to 1
in. thick in lower part, increasing progressively to about 3 ft in upper part______________________________________ 80 0
Shale, dark-gray, micaceous, sandy; grades upward into the over lying sandstone__________________________ ____ 480 0
Sandstone, gray,ripple-marked, micaceous, in beds 1 to 2 ins. thick;grades laterally into sandy shale.._____ __________ ___ 13 0
Shale, dark-gray, sandy, micaceous__-_-___-_--_ _________ 112 0Shale, very sandy; locally grades into micaceous buff to gray shaly
sandstone_____________________________________ _______ 25 0Coal-____________________________________ 1 0Shale, black, carbonaceous- _____________ __ __ ___ 3 0Sandstone, gray, fine-grained, micaceous, ripple-marked; in beds
about 1 in. thick; grades downward into sandy shale. 30 0 Shale, dark, micaceous, somewhat sandy_____________ _ 170 0Shale, gray, very sandy, micaceous.---------------- 13 0Shale, dark-gray, slightly sandy, micaceous._---__________ 175 0Coal-___---_-----_----_ -- ---- --- ---_ - 1 0Shale, black, carbonaceous__________________ _ 3 0Sandstone, gray to buff, fine-grained, micaceous, ripple-marked,
thin-bedded; locally grades laterally into sandy shale __ __ 47 0 Shale, gray, very sandy, micaceous---__________ ___________ 16 0Sandstone, similar to above.___________ - ________ 7 0Shale, similar to above______________--_-----_--_-_- ________ 6 0Sandstone, similar to above--_____--_---------------_------___ 9 0Shale, dark-gray, somewhat sandy, micaceous._ __-_ _ 92 0 Shale, gray to buff, very sandy, micaceous-._______________ ___ 124 0Shale, dark-gray__________ __ 27 0

ARKANSAS VALLEY REGION, ARKANSAS BB11
Composite section of the McAlester Shale in 5N-32W Continued
Ft in Shale, gray to buff, very sandy, micaceous..____________________ 13 0Shale, dark-gray, micaceous_________________________________ 48 0Coal and carbonaceous shale__________________________________ 5 0Shale, black, carbonaceous.________________________________ 3 0Sandstone, buff, fine-grained, micaceous, ripple-marked-.________ 17 0Shale, gray, very sandy, micaceous._______________________ 12 0Coal, impure____________________________________________ 2 0Sandstone, gray to white, coarse-grained, irregularly bedded; len
ticular, with irregular base; ranges in thickness from a knife edge to 54ft____________________________________ 20 0
Shale, gray, sandy, micaceous.____________________________ 30 0Shale, dark, carbonaceous; contains plant fossils and brackish-
water in vertebrates- _________________________________ 7 0Coal--___________-____________.____________________________ 4 0Shale, carbonaceous, with coaly streaks; basal beds of the McAlester
Shale__________________________________________________ 3 0
2, 034 9SAVANNA SANDSTONE
The Savanna Sandstone overlies the McAlester Shale. Its mam area of outcrop is west of the line between R. 20 W. and R. 21 W. (See fig. 6) Measured sections of the Savanna Sandstone indicate thicknesses ranging from 1,140 to 1,610 feet. The Savanna Sandstone consists mainly of shale and sandstone with 6 coal beds and 1 lenticular bed of limestone. The shale generally is sandy and buff to brown in color. The sandstone generally is fine grained, thin bedded, buff to brown, and lenticular. Three beds of coal are more than 18 inches thick, and the rest are a few inches thick. A thin zone of limestone occurs in the upper part of this unit (see following composite section) and is the only limestone known in the post-Atoka rock units.
The following composite section of the Savanna Sandstone described by Hendricks and Parks (1950, p. 77) illustrates the general lithology of this rock unit.
Composite section of the Savanna Sandsone in 7N-%8 and 29 WFt In
Sandstone, buff, in thick even beds, medium-grained, and micaceous;uppermost unit of the Savanna Sandstone._________________ 20 0
Shale, gray, sandy________________________________ 6 0Sandstone, buff, shaly______________________________________ 5 0Shale, gray_____--___-__-____----___-___________--___---__ 5 0Limestone, sandy, with abundant fresh-water fossils ______ _____ 1 0Shale, black, calcareous.________________________ 2 0Limestone, dark-gray, hard, silicified, very fossiliferous __________ 1 0Coal_______________________________________________________ 6Shale, gray, sandy_______________________________________-___ 6 0Sandstone, brown to shaly, thin-bedded-_______________ __ 8 0

BB12 CONTRIBUTIONS TO HYDROLOGY OF THE UNITED STATES
Composite section of the Savana Sandsone in 7N-28 and 29 W ContinuedFt In
Shale, gray and black, sandy in part_______________________ 27 0Sandstone, marine fossils._____________________________ 2 0Shale, gray in upper part; grades downward into black shale that
contains abundant plant fossils..___________________________ 30 0Goal...._ _ ________________________________________________ 1 6Shale, gray and black, with abundant plant fossils in lower part.- 110 0 Coal______________________________________ 2Shale, black and gray, with some plant fossils in upper part---_ 70 0 Sandstone, brown, fine-grained and shaly_________________ 7 0Shale, gray and black, sandy________________________ 90 0Sandstone, brown, medium-grained, soft, thin-bedded__________ 5 0Coal__________________________________________.____________ 4Shale, gray________________________________ 100 0Coal_____________________________________________________ 4Sandstone, gray, fine-grained, hard; even-bedded in beds 1 to 8
in. thick; used locally for structural stone ____________________ 20 0Shale, gray and black, and some sandy shale.___________________ 200 0Sandstone, gray, brown, shaly, even-bedded____________________ 8 0Shale, gray and black, and some sandy shale..________________ 80 0Sandstone.________________________________________________ 10 0Shale, gray and black, and some sandy shale.___________________ 50 0Sandstone-.__________________________________________ 10 0Coal______________________________________ 11Shale, gray and black, and some sandy shale; contains two lenticular
sandstone beds________________________________________ 160 0Sandstone, brown, shaly, even-bedded, lower 1 to 2 ft very hard.__ 10 0 Shale, brown, sandy, micaceous.___________________________ 15 0Coal-_-_---_--_-_--______-_-_-__-_-._ __- ___-_-.____ - 6Shale, sandy, banded in gray and black, in yf to J_-in. beds re
sembling varves; contains plant fossils, especially in lower part__ 70 0 Coal___-__-___________________.._______________-_ _-.__ 1 6Sandstone, gray to buff, medium-grained to shaly___--________ 10 0Shale, gray, and some brown sandy shale_______________ 200 0Sandstone, brown, fine-grained, thin-bedded, hard; breaks into long
narrow rectangular fragments; basal units of the Savanna Sand- stone_________________________________________________ 15 0
1,359 9 BOGGY SHALE
The Boggy Shale overlies the Savanna Sandstone. It crops out on a few ridges mainly west of the line between R. 20 W. and R. 21 W. (See fig. 6.)
In the western part of the region, the Boggy Shale is a dark shale containing three buff to brown sandstone beds. It ranges in thickness from less than 100 to about 900 feet. The sandstone is coarse grained and medium bedded.

ARKANSAS VALLEY REGION, ARKANSAS
ROCKS OF QUATERNARY AGE
BB13
Alluvium overlies the consolidated rocks along the valley sides and in the channels of the Arkansas River and its major tributaries. The alluvium of the Arkansas River comprises terrace and flood-plain deposits. The terrace deposits belong to two different periods of deposition. The tops of the older deposits are about 50 feet above the present flood plain. They consist of interbedded gravel, clay, and sand and are typically red. The tops of the younger terrace deposits are about 20 to 40 feet above the present flood plain. These deposits are composed of a sequence of clay, sand, and gravel, the coarse material grading upward into the fine material. The flood-plain deposits of the Arkansas River consist of gravel, sand, silt, and clay. Generally, the coarse materials are on the bottom and the fine materials on the top. The deposits are about 40 feet thick at Fort Smith and thicken downstream to about 80 feet at Little Rock.
The major tributaries of the Arkansas River also have terrace and flood-plain deposits. A diagrammatic transverse section of a major tributary valley showing the various relations between these deposits and the bedrock is shown in figure 3. These relations are not developed
FIGURE 3. Diagrammatic transverse section of a major tributary valley showing the various relations between alluvial deposits and bedrock.
to the same degree along the entire length of each tributary, and, in places, remnants of an older period of stream deposition have been obliterated. The maximum thickness of the flood-plain deposits is about 60 feet and that of the terrace deposits about 30 feet. The flood- plain deposits and the terrace deposits commonly have two distinct zones. Selected records of borings in the alluvium at bridge sites are given in table 2. The upper zone is chiefly composed of fine-grained materials, such as clay and silt, and minor amounts of very fine to medium sand. The lower zone is composed of gravel and boulders, which generally are imbedded in a clayey, silty, or sandy matrix. Where the terrace deposits are prominent topographic features, the lower zone is thick and the upper zone is thin or absent. Where the flood-plain deposits are prominent topographic features, the lower zone generally constitutes less than 50 percent of the total thickness of the deposit and may be absent.
695-904 63 8

BB14 CONTRIBUTIONS TO HYDROLOGY OP THE UNITED STATES
TABLE 2. Selected records of borings in the tributary alluvium
Description Thickness (feet)
Depth (feet)
Location: 4N-16W-2faadl
Clay, brown, firm______._.___..____.__________- 13 13Clay, brown, firm, few gravel____-____.-_-----_---------- 5 18Clay, brown, medium-soft--______________________________ . 15 33Clay, brown, medium-firm.______.___ ____-_-____.__-_-_-_-_ 10 43Clay, gravel, and boulders, mixed___-_---------------------- 16. 4 59. 4Shale (bedrock)....--__-________-_____---_---------_-_---- 0 59.4
Location: 4N-l7W-15bdal[Composite log by author]
Clay and sand, red_____________________________________ 11 11Clay, red, compact_____________.______-_-__-_---------_ 17 28Sand, gray, medium-hard__________________________________ 8 36Clay, gray, compact_______________._--_-_-___--------_- 2 38Sand, white, medium-grained_______--------_-__--_--------- 5 43Refusal.--___-_-___________-______________ 0 43
Location: 5N-21W-23acal
Clay, hard__________________________-_-_____ 8 8Clay, medium-hard-.______________________________________ 14 22CJay, sandy...________.___________-__________ 15 37Shale (bedrock).-.._____.._________________... 0 37
Location: 5N-27W-18bbbl
Clay, sandy, medium-firm ___________---_-____---_-._--- 10. 8 10. 8Clay and gravel, firm.___________________________________ 4. 6 15. 4Shale, hard __________________________ - _-_ _ 0 15. 4
Location: 6N-13W-17addl
Clay, sandy, firm.. ___________________.___.____-_.__- 23 23Sand, fine_____________________________________________ 9 32Shale ---_------___-_._..__.____.._._________._-.----__ 0 32
Location: 7N-27W-31bbbl[At Caulksville, the alluvium is 30 ft thick and contains gravel]
Sand; silt______________________________...__ 6 6Rock, shelly.....-_--___._.______..____.-.-______-____-__ 0 6
Location: 8N-21W-25bdal
Loam, sandy; silt __-__________________--_-_-____--_-_-__ 16 16Gravel, coarse_---___-_____________-________.__-_____--__ 4 20Gravel, fine; boulders.____________________________________ 3 23Sandstone (bedrock)_-__-_________--____-.-----_-__-_-_.__ 0 23

ARKANSAS VALLEY REGION, ARKANSAS BB15
TABLE 2. Selected records of borings in the tributary alluvium Continued
Description Thickness (feet)
Depth (feet)
Location: 8N-22W-15cacl
Clay, brown, sandy, medium-firm____________________ _ ___ 8 8Clay, brown, sandy, nrm___.____________________________ 20 28Clay, brown, sandy, medium-firm_________________________ 3. 2 31. 2Clay; gravel; small boulders_______________________________ 10. 2 41. 4Rock, solid--------______-_.---__________.__-_-_-_ 0 41.4
Location: 9N-20W-21cccl
Silt; sand; gravel; boulders_______________________________ 10 10Shale; bedrock.. .________-_-_________________. 0 10
Location: 9N-25W-13ddbl
Sand; silt----____-__-_______.___,__________________ 10 10Gravel--------.---------------------,-----------.-------- 8 18Shale, soft-- ___________________-----------_____ 0 18
Location: ION-14W-12bc center 1
Silt; boulders..-._________________________________ 3. 3 3. 3Gravel; boulders __________________________-______.-__-__ 2.6 5. 9Rock, solid.-______-_---____ __._____-.__-__ 0 5.9
Location: ION-28W-26dbbl
Clay, brown, sandy, firm. __________________________________ 6 6Clay, brown, sandy, very firm_ __ ___ _ ___________ _ _____ 11 17Clay; gravel; boulders___--_----__-__-,______________--__-- 4 21Refusal--------------------------------__-_ ________ 0 21
STRTJCTTJBE
Structure is the controlling factor in the occurrence and movement of ground water in the Arkansas Valley region.
The Arkansas Valley region is a synclinorium lying, for the most part, between the low-dipping rocks of the Boston Mountains and the highly folded rocks of the Ouachita Mountains and partaking of the basic structural composition of each. Faults are common, the normal type predominating in the northern part of the region and the reverse type in the southern part. The rocks also have been contorted and broken by joints, fracture cleavage, and drag folding.
A geologic section (pi. 1 and fig. 6) exemplifies the gross geologic structure of the Arkansas Valley region. Section A-A' is an adaptation of a section from a previous report (Hendricks and Parks, 1950, pi. 14). Dips generally are less than 10° in most of the region. In the south-

BB16 CONTRIBUTIONS TO HYDROLOGY OF THE UNITED STATES
western and Ouachita Mountain parts of the region, the dips generally are steeper and vertical dips are seen in places.
WATER RESOURCES
STREAMFLOW
Records of streamflow are collected at several gaging stations in the region. The average annual streamflow of the Arkansas River at Van Buren for the period 1927-59 was 22,460,000 acre-feet, and at Little Rock for the same period it was 29,860,000 acre-feet. The difference between these figures, 7,400,000 acre-feet, was mainly contributed to the river by runoff from within the area of this report. The average annual streamflow at Dardanelle for the period 1937-59 was 26,680,000 acre-feet, suggesting that more water generally is con tributed to the river upstream from this locality than downstream.
Streamflow fluctuates seasonally with changes in precipitation and evapotranspiration. Maximum flow occurs in the winter and spring when precipitation is highest and the rate of evapotranspiration is lowest; minimum flow occurs in the summer and fall when precipita tion is lowest and the rate of evapotranspiration is highest. Dry periods have been recorded on all tributaries. Prolonged dry periods occur less frequently in streams having drainage areas that exceed 100 square miles. In the Arkansas Valley region, the close relation between streamflow and precipitation-evapotranspiration suggests that streams are mainly supplied by ground-water discharge during dry periods.
GROUND WATER
Replenishment of ground water in the Arkansas Valley region is primarily by precipitation. The average annual precipitation is 48 inches, or 18.4 million acre-feet.
OCCURRENCE
Ground water in the Arkansas Valley region occurs in two distinct environments. One includes the unconsolidated alluvial deposits of the Arkansas River and its tributaries, and the other includes the consolidated rocks that underlie the entire region. Openings of various kinds control the occurrence of ground water in both environ ments. The total volume of these openings determines the porosity, and the size and degree of interconnection of the openings determine the permeability.
WATER-BEARING OPENINGS IN ALLUVIAL DEPOSITS
The openings in the alluvial deposits are between the individual particles of clay, silt, sand, or gravel. Clay and silt deposits generally have a high porosity; but the small size and poor interconnection of the openings lessen their ability to transmit water, and they cannot

ARKANSAS VALLEY REGION, ARKANSAS BB17
be utilized as sources of large quantities of ground water. Sand and gravel deposits which have a higher permeability generally yield larger quantities of ground water than deposits of clay and silt.
WATER-BEARING OPENINGS IN CONSOLIDATED ROCKS
The openings in the consolidated rocks differ depending upon whether they are in the zone of alternate wetting and drying or hi the zone of permanent wetting. The lowest level of the water table separates these zones. Weathering has altered the rock above the water table to soil and "rotten" rock, which together attain a maxi mum thickness of about 20 feet. (See fig. 4.) The materials in the
A B
Dug well Drilled well
Water level
Bedding planes
Fracturecleavage-planes
Sandstone
FIGUEE 4. Diagrammatic section showing the two types of wells used in the consolidated rocks and the most common relation of these wells to the water-bearing materials.
weathered zone have a greater porosity and permeability than the original unweathered rock, and water occurs in this zone much like it does in the unconsolidated rocks. Below the water table, the rock is permanently wetted or saturated so that weathering has not affected the rock, and ground water occurs in secondary openings formed by earth movements and by solution. These openings include fractures and interbed passageways. Fractures of importance in the report area are joints and fracture cleavage (fig. 4).

BB18 CONTRIBUTIONS TO HYDROLOGY OF THE UNITED STATES
Joints occur in similarly oriented assemblages called sets, and several intersecting sets commonly are found in any area. They are not confined to one rock type, but they are better developed in massive rocks than in shaly or slaty rocks. The dimensions of joints are variable, but all pinch out with depth so that the water-bearing significance of joints also decreases with depth (fig. 5). Generally,
4 32 1
______*__________t_____V Land surface t______
FIGURE 5. Diagrammatic section illustrating relation of wells to a I'.rge wat?r-bearing joint. A well drilled at site 1 will not strike the joint; one drilled at site 2 will penetrate it above the water table; one drilled at site 3 will encounter it whore it is open and full of water; one drilled at site 4 will either fail to ra",ch it or will reach it at considerable depth where it has become tight and will therefore not yield much water. From Meinzer (1923, p. 179).
some joint sets predominate in size and continuity over others, and these are called master joints. An area that is intricately transected by joints does not necessarily contain large quantities of ground water because the individual fractures may be filled with silica or iron oxides. Joints probably are the predominant containers of ground water in most of the region, and their attitude and spacing should be determined in any search for ground-water supplies.
Fracture cleavage can be compared to jointing but the spacing of the fractures is closer, giving the affected rock a platy or fissile struc ture. This structure is confined to shales or shaly rocks so that in rock units like the Atoka Formation which are composed of alternat ing sandstones, siltstones, and shales fracture-cleavage zones may occur between massive zones. Interconnection of fracture-cleavage zones may be maintained by joints. Fracture cleavage locally occurs in the highly folded parts of the region.
Bedding" planes (fig. 4) are the surfaces of contact between rock

ARKANSAS VALLEY REGION, ARBANSAS BBK)
layers of similar^or dissimilar lithology and represent temporal breaks in the deposition of these layers. Interbed openings may have formed by solution along bedding surfaces where slippage due to differential movement has occurred. Slippage can produce a crushed zone, which, because of its larger exposed area, is more susceptible to solution than the unaffected rock above and below it.
The quantity of ground water available in any area necessarily depends upon the number, size, openness, and degree of interconnec tion of the water-bearing openings. Many small openings may yield less water to a well than a few large openings. The author has seen openings in high-yield wells which are several inches across, and the yield of these wells was obviously dependent upon the large openings. Wells having small yields were never seen to have large openings but, instead, many small ones. Openness depends on whether ground water has been or is an agent of secondary deposition or solution. Secondary deposition reduces the original capacity of the openings to contain water, whereas solution increases this capacity. Solution is not common in the region, but the results of deposition are seen in some places, particularly where shales or slates crop out. The degree of interconnection among openings of the same kind, or of different kinds, is a chief factor in determining the amount of water available to a well. A system of interconnected openings that has a large areal extent may have a large effective recharge area if water is relatively free to seep into the system. Also, such a sysu m may have a large storage potential, especially if its vertical extent is significant.
A detailed knowledge of the relative influence of the types of open ings on ground-water occurrence would facilitate the locating of well sites by eliminating a part of the preliminary field study.
WATER-TABLE AND ARTESIAN CONDITIONS
Ground water is said to occur under water-table conditions when it is not confined. Where the water table is in the alluvial deposits and the weathered zone, it is the upper surface of the zone of satura tion. The slope of the water table adjusts itself to changes in rate of seepage, and the magnitude of the slope above a zone of discharge is directly related to the rate of seepage and inversely related to the permeability of the water-bearing materials. In a general way, the slope of the water table is a subdued reflection of the topography.
Where the water table is in the unweathered zone it is the contact between the atmosphere and the water surface in fractures and interbed openings. The contact is irregular, and it is a common occurrence to strike a water-bearing zone at one elevation in one well and at a much higher or lower elevation in a well that is located only a few paces distant. The slope of the water table depends upon whether the water occurs in joints, fracture cleavage, or interbed

BB20 CONTRIBUTIONS TO HYDROLOGY OF THE UNITED STATES
openings. Joints are not confined to particular rock types, and the slope of the water table above the level of discharge depends on their openness and interconnection. The absence of interconnected joints may divide an area into more than one ground-water unit, each having its own water levels and discharge point. Fracture-cleavage openings and interbed openings confine ground water to specific horizons, unless the water is intercepted by other avenues of ground- water movement or is discharged.
Ground water is artesian where it is in a confined permeable zone. Confined permeable zones may be afforded by fractures, interbed openings, or by a sand bed between clay beds. Where a well pene trates a confined permeable zone and the head is great enough to cause the water to flow onto the surface, the well is termed "a flowing artesian well." Many such wells are found in the Atoka Formation in the northern part of the Arkansas Valley region.
MOVEMENT
In the unconsolidated alluvial materials and the weathered zone, ground water moves in the direction of the slope of the water table. In the unweathered zone, movement is controlled mainly by structure. Generally, ground water moves along interbed openings and fracture- cleavage openings towards the synclinal axes and away from the anticlinal axes. The geologic section (pi. 1) indicates the general movement in the western part of the region. Where dips are low, ground water is able to move comparately long distances before reaching points of discharge. Where dips are high, points of dis charge are reached sooner. Joints may allow ground water to move across the folded bedding planes instead of parallel to them. Faults may form a relatively impermeable boundary to movement if char acterized by gouge and cemented breccia. Movement, under such conditions, is deflected and the area of recharge is delimited.
Detailed investigation of ground-water movement is essential if weUs are to be drilled where maximum utilization of the available water supply can be achieved. Such investigation may reveal that certain aspects of structural control can be disregarded and the location of ground-water supplies be simplified to rule-of-thumb procedure.
DEPTH TO WATER AND WATER-LEVEL FLUCTUATIONS
The depths to water (fig. 6) during the period of investigation ranged from 1.5 feet above the land surface to 85.6 feet below the land surface. The maximum depth to water was less than 20 feet in 76 percent of the wells and less than 30 feet in 92 percent. The maximum depths occurred during the summer and fall of 1960. The numerous complaints of residents having dry or nearly dry
R. 32 W. 31 306 R. 5 W.28 27 26 25 24 23 22 21 20 1,9 18 17 , 6
Base from U.S. Geological Survey map of State of Arkansas
Well in which depth to water was measured periodically
Well from which water sample was collected for analysis
G
Well in which depth to water was measured periodically and from which a sample was col lected for chemical an alysis
Hydrology by R. M. Cordova,1960-61
A i \A'Geologic section
FGITJRE 6. Location of geologic section A-A' and of wells in which depths to water were measured periodically and from which samples were collected for chemical analysis.
I
03
WW to

BB221 CONTRIBUTIONS TO HYDROLOGY OP THE UNITED STATES
wells, the numerous dug wells having little or no water, and the fact that most of the stations of the U.S. Weather Bureau recorded pre cipitation deficiencies ranging from 1 to 8 inches, strongly suggest that the depths to water measured in 1960 were close to the maximum depths ever reached in the region.
Several factors control the depth to water in wells in the region. Precipitation has a direct effect on the depths to water, and periods of heavy rainfall are accompanied by corresponding decreases in depths to water. Conversely, dry periods are coincident with in creases in the depths to water. Depth to water generally is directly related to the topography of a locality, and wells on the crests or slopes of ridges have greater depths to water than those in nearby lowlands. The rate of evapotranspiration in the region probably is high enough to discharge most of the seepage in areas where dissection is deep. Pumping a well produces a cone of depression in the water table so that depths to water measured within the area of influence of the cone will not be indicative of static water-table conditions. Casing depth can affect the depth to water in a well if it is sufficient to shut out ground water in the weathered zone where seepage from this zone to the unweathered zone is slow or nonexistent. These wells, will have greater depths to water than wells that tap water from the weathered zone.
The maximum water-level fluctuation during the period of in vestigation in the Arkansas Valley region did not exceed 10 feet in 79 percent of the wells measured and 20 feet in 94 percent. The average fluctuation was 9.3 feet and, excluding those water levels that showed a marked deviation from the general range of fluctuations, the average was 7.5 feet.
The principal factor controlling water-level fluctuation in the region is the seasonal relation between precipitation and evapotranspiration. From late spring to early fall, when evapotranspiration is highest and precipitation is least, water levels decline to their minimum level. From early fall to late spring, when evapotranspiration is lowest and precipitation is greatest, water levels rise to their maximum level because more water is able to seep to the water table. Water-level fluctuations react to the seasonal precipitation-evapotranspiration pattern at a faster rate in the weathered zone than in the unweathered zone.
CHEMICAL. QUALITY AND TEMPERATURE
The chemical quality of ground water in the Arkansas Valley region was studied in 64 analyses of well water (table 3).
Bicarbonate waters predominate in the Atoka Formation, McAlester Shale, Savanna Sandstone, and Stanley Shale. The Hartshorne Sandstone has bicarbonate and sulfate waters, but more analyses
ARKANSAS VALLEY REGION, ARKANSAS BB23
are necessary to determine if there is a predominant anion. Sodium is the predominant cation in the Atoka Formation, McAlester Shale, and Savanna Sandstone. Magnesium cations predominate in the waters of the Stanley Shale. Calcium, sodium, and magnesium cations occur in the waters of the Hartshorne Sandstone, but none predominates in light of the evidence available. Of the well waters analyzed, sulf ate waters make up about 14 percent and chloride waters about 11 percent. Sodium chloride and magnesium chloride comprise the chloride waters and probably indicate the proximity of hydro carbon accumulations. The sulf ate waters are probably the result of the oxidation of pyrite, as this mineral is relatively common in the rocks of Carboniferous age.
The dissolved-solids content of the waters analyzed ranges from 37 to 1,450 ppm (parts per million), although 81 percent of the waters contain less than 500 ppm. The Atoka Formation and the McAlester Shale have the widest range of values; whereas the Hartshorne Sand stone, Savanna Sandstone, and Stanley Shale have consistently less than 500 ppm of dissolved solids. The U.S. Public Health Service (1961) recommends that the maximum concentration of dissolved solids not exceed 500 ppm in drinking and culinary water on carriers subject to Federal quarantine regulations, but it permits 1,000 ppm if no better water is available. Industrial tolerances differ widely, but few industrial processes will permit more than 1,000 ppm.
The iron content ranges from 0.00 to 19 ppm, but 75 percent of the waters analyzed contain less than 2 ppm. Waters of the Atoka Formation and the Hartshorne Sandstone generally exceed this value. The U.S. Public Health Service (1961) recommends that iron in drink ing and culinary water not exceed 0.3 ppm. This limit is not based on toxicity but on esthetic and taste considerations. This value is exceeded in about 50 percent of the waters analyzed, and all rock units have waters whose iron content exceeds this value. Only 11 percent of the well waters have more than 4.0 ppm of iron, and most of these are from the Atoka Formation.
The U.S. Public Health Service (1961) recommends that hardness should not exceed 100 ppm in drinking and culinary waters, and 50 percent of the well waters analyzed contain more than this amount. A hardness of 100 to 200 ppm is noticeable by most people and is considered hard; water with a hardness of more than 200 ppm re quires softening for many purposes, although it is generally satis factory for domestic uses and irrigation. The hardness of 84 percent of the waters is less than 200 ppm. One well in the Atoka Formation has water containing 1,100 ppm of hardness, which was the highest value found in the region.

BB24 CONTRIBUTIONS TO HYDROLOGY OF THE UNITED STATES
TABLE 3. Chemical analyses of water from wellsWell: See text for explanation of well-numbering system.Depth of well below land surface: Measured depths are given in feet and tenths; reported depths in feet.Character of water-bearing material and rock unit: Sh, shale; Ss, sandstone; Sh-Ss, shale and sandstone;
[Results in parts per million except as indicated.
Well
2N-12W-17aacl __14W-35dcbl.--
3N-llW-29aadl--. 13W-25accl __15W-21al ______
26dl. _____17W-26aaal __ 29W-22cccl _.__
4N-13W-30aadl..-21W-3accl. __-.
3adcl -5N-llW-8bacl
13W-9bbal __17W-27dbdl,..21W-lcdal .
Ir1r»p1
23W-16babl _16bab2 _
24W-llbccl _llbdcl ____
27W-6bcbl 30W-32bccl ___
6N-9W-34dadl___17W-7dcb2 -20W-18aabl __28W-2ddal __ 31W-2cdcl_ 32W-20dcbl-_-
Do.. .......
Do ...._,_______6N-32W-21accl. _
21addl _22bccl __
7N-7W-21dccl __13W-16baal ___.20W-20cdal.-..27W-3ccbl. _ .
3cccl _____4cabl -4dcal _____
28W-ldadl.__.
3ddal ____
8N-17W-36ccdl._._17aadl ____
30W-27cdal ____27dddl ___
9N-16W-16cccl. _20W-21cbbL
27cba4 __26W-15bccl ____
27W-23bdal _30W-29bbcl._-
10N-10W-12abbl _
30W-4babl __20cbbl._.
1 lN-14W-35abbl ___
Owner
R, Sullivan ___ , ._Mrs. Qlidewell ___ D. Kuykendall.. _ H. Massery _________Little Rock, City _
J. Raney. ___________ E. Scroggins. _______ I. Gentry ___________Ola, City.. _______ do.... _________Mrs. Williams __ _H. Langford--.M. Jones ______G. Brown ___________P. Ober ... __
-...do...... __ .....J. McBride _________Havana High SchoolO. Adair____________W. Carter. _________C. Johnson. _______Mr. Koch ___________W. Grooms. ________Mr. Robertson ______ Mr. Nolen _________F. Gossett __________
___ _.do....._._._...._
E. Hollowa _________
Hackett High School.
V. Olive.____.._____Mr. Kuykendall ____Caulksville, City ___H. Kizziar _________M. Hall _____________County Line School.
W. Gibbs ___ . ____
M. Campbell _______J. Barker ____________C. Wait.............Wells Cleaners ______N. Post.__..____.___
_____do_._____________Mr. Walker _________D. Engles ___________M. Phillips.________
Crow Realty ________A. Kildahl. _________M. Cox _____________
Depth of well below land
surface (feet)
44. 545.9 36.0 65. 064.0
100.048.0 29.5
128.120019746.322.439.845OK
1002121
10020.9914228.560.835.6 20.6
18018011011045.5
12086
116044.031
103.042
2001501205433.7
14116072
14549.028.533
23015
35032.446.674.97558.626.63084.0
Character of water-bearing material and
rock unit
Sh; Pa_____Sh;Ms. __ Ss;Mj. _____ Sh; Pa.. __Sh;Ms.._-_ do......Sh-Ss; Pa _ __ do.. ____ Sh;Pa._____ . -do......_-__-do._______ do.. ____ -do.. Sh; Pa
_____ do...__._- do _.do..________._do __ _____.do............do....... ..do.......__ do.._. _______.do._....______do.______Sh-Ss; Pa...Sh; Pa _ ...
.....do......Sh; Pm.. ____ do.......
Ss; Ph......._____ do...... do...... do. _____ do.
_.do..__.__Sh; Pm_ ____Ss; Ps, ______Sh; Ps_...__
_____ do_...._______ do.______Sh; Pm _.
Sh; Pm __________ do.... _._Ss; Pm ______Sh-Ss; Pa ___ ..do ....Sh; Pm..... .do~ ~Sh-Ss; Pa ___Ss; Pa _______Sh-Ss; Pa.__ -do._.____.Sh;Pa..___ _
.... .do.......Sh;Pm._ do Sh; Pa- _ .Sh-Ss; Pa _
_____ do...... _Ss; Pa. _____ do.......Sh; Pa.. __
Date of collection
9-26-609-20-60 9-26-60 5-26-557-13-595- 9-599-27-60 9-14-60 9-26-602-20-52
-_.do____9-16-60
_ do....9-15-609-1-53
__ -do. .4-7-58 do._
4- 8-58_____ do
9-22-60_____ do
4-15-559-15-609-27-609-14-60 9-13-604- 8-588-6-584-8-588- 6-58 do do. do
6-21-559-26-609-15-609-22-607-5-604-4-58 do........do....._ do..... do
9-22-601-27-489-6-559-26-604-4-58..do -9-26-60
__do .6-11-577-12-574-12-58
do 9-14-609-13-609-16-609-14-609-22-609-13-609-21-609-16-60
Tem per ature (°F)
6566 68
64
62 70 646364636466
737063656668 65656361
616765666360
61
67
6568
617163
59606565627270656762
Silica (SiOj)
6.45.9
17
1.15.2 9.3 5.8
21219.18.69.3
2312
4.16.29.7
175.7
1110 7.3
11
16
________
201311
.3
13
6.37.17.26.8
8.57.9
10201212185.6
Iron (Fe)
0.01.69 .71 .14.49
1.9.32 .00
3,81.52.36.4.04
3.06.7.08.23.07
3.5.00.00.14
2.5.041.2.08 .27.00
6.9.00
3.7.22
1.48.4
.318.7.29.04.00.44.24.04.04.05.18.10
8.8.16.26.07.04.83
3.9.53
1.419
.05
.10
.823.3.54.19
3.8.13
Cal cium (Ca)
223.6
22 50492011 28 653932512145169.1
4728191128309.7
197811 1325261519403739
3923195.21.2
392514
.91.0
1230117.9
111.58.4
37153614476.56.0
339.0
133.1
1295

ARKANSAS VALLEY REGION, ARKANSAS BB25
in the Arkansas Valley region, ArkansasPa, Atoka Formation; Ph, Hartshorne, Sandstone; Mj, Jackfork Sandstone; Pm, McAlester Shale; Ps, Savanna Sandstone; Ms, Stanley Shale.
Sulfate (SOO: Small "s" after number indicates HjS odor.
Analyses by U.S. Geological Survey]
Mag ne
sium (Mg)
11 3.7
11 57 34 22 11 33 34 12 12 83 24 39 15 11 34 13 7.1
13 12 25 7.5 8.3
53 5.2 9.3
13 14 10 10 18 17 23
8.7 11 18 4.4 .2
26 .3
9.3 .1 .7
4.8 15 6.5 4.3 3.0 .5
2.8 10 3.8
24 3.2
14 2.8 4.8
10 7.6 3.5 2.5 9.7
211
So dium (Na)
7.2 2.2
34 146
9.6 5.4 9.7
26 145 51 44 72 51 94 23 23 67 81 20
236 20 90 9.6
38 100 22 6.2
26 28 16 13 76 27 49
26 15 15 11
211 47
110 179 197 216 28 51 12 9.4
150 284
21 28 16 49
128 162
5.7 8.1 4.7
22 58 3.2
12 53
Po tas
sium (K)
3.1 .6
1.4 3.4 .9 .4 .8
1.2 3.2 1.4 1.4 4.3 3.2 7.0 1.0 3.8 2.5
48 15 5.8
24 2.1 1.4 8.5 5.1 6.6 1.8 2.0 1.3 1.4 .8
5.1 .9
1.1
1.3 .8 .9
3.5 2.0 3.1 4.9 3.4 3.0 9.0
.8 4 6.1
11 .8 .2
7.6 4.4 4.4 2.3 1.3 .9
1.2 1.3 .9
1.1 6
Bicar bonate (HC03)
96 24 92
591 224 145 108 100 284 182 148 88 33
508 146
17 220 164 108 530 148 384 80
110 288 109 54 44 57 81 96
158 106 220
- 210 150 144
11 402 176 290 520 409 502 40
114 86 44
368 511 28
220 86 40
288 336
28 31 20
108 208 23 72
980
Car bon- ate
(CDs)
0 0 0 0 0 0 0 0 0 0 0 0 0 0 0 0 0 0 0 0 0 0 0 0 0 0 0 0 0 0 0 0 0 0
0 0 0 0 0 0 0 0
26 2 0 0 0 0 0
20 0 0 0 0 0 0 0 0 0 0 0 0 0 0
Sul fate(S04)
14 6.0 1.2
71 83 2.4 2.8
135 122s 58 58 12
100 53s
.6 26 88
133 33
80s 41
16s 5.2
22 237
6.4 36
121 125 22 18
156 87 82
5.0 6.4 .4s
6.2 1.6s
124 39
20s 26
29s 49 4.5 3.4 5.6 3.4 5.2s
22 6.6 7.6
150 45
169 5.8 7.8
111 .2
1.6 2.6
12 255
Chlo ride (01)
142.5
70 78 13 24 3.0
24 180 28 27
378 96 7.5
21 36 90 50 9.0 56 15 25 6.2 32 102 4.5 4 6.5 5.5
16 14 41 30 22
6.0 3.2
23 21
100 24 18 20 26 31 20
106 5.0 9.5
43 132 24 4.5 5.5
56 38 60 7.0
10 2.8 8.5 5.0 2.5
19 100
Fluo- ride (F)
0.3 .2 .1
.1
.2
.5
.1
.1
.1
.3
.1
.6
.1
.3
1.2 .2.7
.3
.5
.2
.5
.3
.4
.4
.5
.1 1.0
.1
.1
."2"
.3
.0
.1
.T
.1
.1
.2 .2 .1 .2 .4
Nitrate (N0»)
4.4 .2 .1 .4 .9 .0 .0 ,5 .5 .7 .7 .0 .7 .3 .4 32
4.5 22
.0 5.3 .0 .6 15 .5 .6 .0 .0 .5
1.2 2.8 1.0 .6 .6
.8
.2 8.4
11 .0 .2 .2 .3 .2 .2
9.3 .2
1.9 3.0 .1 .2
11 .1 .5
36 .0 .0
1.5 4.9 1.0 .1 .0
1.2 .1 .0
Dis solved solids
127 37
289 819 312 184 90
336 790 284 265 653 435 545 178 176 495 443 164 733 268 453 121 240 870 163 163 264 232 176 139 433 278 343
214 192 181 108 572 382 354 524 494 534 211 317 108
71 414 746 126 341 85
448 380 638
55 101 228 153 257 39
152 1,450
Hard ness as CaCOs
100 24
100 360 262 140
72 206 302 147 129 468 151 273 102 69
258 124
76 81
120 178
55 82
412 49 70
116 122
78 88
174 162 192
133 102 122
31 4
204 64 73 0 6
50 137 54 37 40
6 32
134 53
188 48
175 28 34
124 54 47 18 70
1,100
Non- carbo nate hard ness
22 4
24 0
79 22 0
124 70 0 8
396 124
0 0
54 77 0 0 0 0 0 0 0
176 0
26 80 76 12 10 44 76 12
0 0 4
22 0
60 0 0 6 0
16
0 1 0 0
10 0 0
156 0 0 4 9
107 0 0 0
11 302
Specific conduc tance at25°C (micro- mhos)
23765
367 1,230
509 304 169 492
1,210 459 428
1,360 573 804 292 281 792 752 278
1,080 385 649 159 371
1,150 194 175 349 336 243 219 660 379 540
351 263 284 157 899 579 563 844 811 908 322 547 158 154 689
1,210 243 341 165 612 613 983 94
142 311 196 352
61 198
1,840
pH
7.2 6.5 6.4 8.2 7.0 8.1 6.8 6.7 6.8 7.0 6.8 6.8 6.3 8.0 7.2 5.7 6.6 7.1 6.6 7.8 7.1 7.6 6.8 7.2 7.6 6.8 6.8 6.2 6.3 6.3 6.5 7.3 6.7 8.2
8.2 6.7 7.4 6.0 8.0 6.9 7.8 8.0 8.8 8.3 6.4
6.6 6.3 7.9 8.5 6.0 7.1 6.7 6.7 8.2 7.1 6.7 6.6 6.3 7.4 7.5 6.3 6.3 8.0

BB26 CONTRIBUTIONS TO HYDROLOGY OP THE UNITED STATES
The sulfate content ranges from 0.2 to 255 ppm. The U.S. Public Health Service (1961) recommends that the sulfate concentration not exceed 250 ppm in drinking and culinary water. Only 1 well has water with a sulfate concentration exceeding this value, and only 1 well has water with more than 200 ppm. About 65 percent of the well waters has less than 50 ppm of sulfate.
The fluoride content ranges from 0.0 to 1.2 ppm, but generally it is less than 0.5 ppm. Fluoride, in quantities exceeding 1.5 ppm, can cause the dental defect known as mottled enamel (Maier, 1950). The nitrate content ranges from 0.0 to 36 ppm, but most of the water has less than 1.0 ppm. A nitrate content exceeding 45 ppm (Comly, 1945) in water used for preparing feeding formulas can cause cyanosis in babies.
The pH ranges from 5.7 to 8.8 but generally lies between 6.0 and 8.0, indicating mildly acid to mildly alkaline waters.
The odor of hydrogen sulfide and the staining of laundry, dishware, and bathroom and kitchen fixtures are the causes of most complaints of well users. These complaints arise generally from users of deep- drilled wells. The odor of hydrogen sulfide was recorded in less than 1 percent and objectionable iron staining in about 13 percent of the wells inventoried. Localities where these two objectionable qualities of ground water may be present cannot be predicted, and their presence is known only after drilling a well. Wells only several paces apart may have entirely different waters, one being good and the other objectionable.
The laboratory evidence available suggests that no clear-cut rela tion exists between chemical quality and depth to water or depth of well. However, field evidence indicates that water from shallow wells is softer and has less iron than water from deep wells. Well users who have had both types of wells will invariably make this statement, and well users who have shallow wells notice a distinct difference in quality of water between the high water-level periods and the low water-level or drought periods. Also, many users who have not had pumps on their wells and later installed pumps in these same wells report the same change from "soft" and "iron-free" water to "hard," "iron" water. The difference in quality of water between deep and shallow wells is not apparent from analysis, probably because most of the samples were collected during a dry period.
Temperature is like a chemical characteristic in that it can also influence the use of ground water. Generally, in wells having depths to water within 20 feet of the land surface, the water tempera tures ranged from 64° to 73° F. Water temperatures ranging from 62° to 63° F and corresponding to the average annual air temperature

ARKANSAS VALLEY REGION, ARKANSAS BB27
were recorded in most wells with depths to water greater than 20 feet and in all wells that were pumped for long periods of time.
GROUND-WATER DEVELOPMENT
The present (1960) development of ground water and its effect on the water cycle or its relation to potential development are primary considerations of a ground-water study if development of the water resources of a region is to proceed in a rational, conservative manner.
The purpose of this section is to discuss wells and usage as the principal elements of present development and to present various quantitative conclusions, derived chiefly from pumping-test data as the principal elements of potential development.
TYPES OF WEUS
Dug and drilled wells (fig. 6) are the two types used in the Arkansas Valley region. Dug wells are common and generally are less than 25 feet in depth and from 3 to 4 feet in diameter. The depths of wells dug in the consolidated rocks generally are determined by the thickness of the weathered zone. The depths of wells dug in the alluvial ma terials generally are determined by the depth to bedrock or to a basal gravel zone. The curbs of dug wells are constructed of brick, concrete, stone, or wood and may extend below the ground surface for a few feet or to the bottom of the well. Drilled wells are replacing dug wells to a great extent. Drilled wells range in depth from about 30 to about 300 feet, but the general range is from 50 to about 200 feet. The common well diameter is 6 inches, although there are a few 8-inch wells. Asphalt-fiber pipe generally is used for casing, and depth of casing generally is less than 10 feet.
Electrically driven jet pumps of less than 1 horsepower are com monly used to obtain water from drilled wells, although 10-quart buckets are also common. Pumps have been installed in some dug wells, but buckets are more common.
RURAL-DOMESTIC, AGRICULTURAL, PUBLIC, AND INDUSTRIAL SUPPLIES
Kural-domestic supplies are obtained exclusively from indivi dually owned wells. It is computed that 8.7 mgd (million gallons per day) were used in 1960 by the rural populace for domestic needs or 34 gpd (gallons per day) per capita. Outside the alluvial area of the Arkansas River, residences having facilities for running water generally have drilled wells ranging from 30 to more than 100 feet in depth. Resi dences without facilities for running water obtain water from dug or drilled wells, the depths of which range from 10 to more than 100 feet. An ample supply of water for residences generally is obtainable at depths of less than 75 feet.

BB28 CONTRIBUTIONS TO HYDROLOGY OF THE UNITED STATES
The agricultural supplies considered are those required for poultry farms, irrigation, and livestock. Outside the alluvial area of the Arkansas River, water required for these uses generally is obtained by drilling wells more than 75 feet deep. In 1960, poultry farms consumed 2.3 mgd. Most of the water used for irrigation in the region is pumped from the flood-plain deposits of the Arkansas River, and crops irrigated include rice and vegetables. It is computed that 2.8 mgd was used for irrigation in 1960. Livestock watered from wells consumed 4 mgd in 1960.
TABLE 4. Municipalities having public water supplies
Source: L, lake or impoundage; S, stream with no impoundage; W, well.Ownership: M, municipal; P, private.Treatment: A, aeration; C, chemical; D, disinfection by chlorination; DA,
disinfection by chlorination and ammonia; F, filtration; H, hypochlorination;I, iron removal; K, water stabilization; S, sedimentation; SO, softening; V,fluoridation.
[Based on data From the Bureau of Sanitary Engineering, Arkansas State Board of Health]
Municipality
Alma_ ____ ________ _ .Altus _____ __- _ __ _____Atkins_-______-_----_ _____Barling.. ____ ____ _ _ _Booneville___- ________ _
Clarksville___- _ ___ _ _____Conway____ _ _ _ _____ ___Danville. _____ ___ _________Dardanelle.- ------- ________Fort Smith __. ___ _ ____Greenwood __---__ _______Hartford. _____ _____ _ _ _Berber Springs. _____________
Little Rock_ __________ _____Mansfield....------- _____ _
Mulberry. _ _________ _____North Little Rock.. _ ____Ola _._ _______ _ __ . _
Pangburn... ____________ __Paris.____ _________ ___ _._
Ratcliff_._ ____ __ ________
Subiaco__ ___ ___________ _Sylvan Hills ___ ____________
Source
LWWLLLLLSSWLLWSLWLLWSLWWWLSWWLLLLLL
Population
1,370392
1,391700
2,6921,3511,0363,9199,791
9552,098
52, 9911,558
5312,265
514392
107, 813881
5,997934
58, 032805
1,965489
3,007720586213
8,9211,222
290400
6,7871,620
Owner ship
MMMPPMMMMMPMMMMMMMMPMMMMMMMMMPMPMMM
Treatment
C, DA, F, SH, KA, C, D, I, SA, C, D, F, S, VA, C, D, F, SDA, C, D, F, SA, C, D, F, SC, D, F, K, SA, C, D, F, SHC, D, F, SC, D, F, K, SH, KC, D, F, K, S, VA, C, D, F, SHC, DA, F, K, S, VC, D, F, SA, C, D, F, I, SC, D, F, SC, DA, F, K, S, VA,I,SDNoneA, C, D, F, SC, D, F, SH, KDA, C, D, F, K, SC, DA, F, K, S, VC, D, F, SC, DA, F, K, S, VC, D, F, SC, D, F, S

ARKANSAS VALLEY REGION, ARKANSAS BB29
Most of the industries using ground water are supplied by munici palities. Therefore, public and industrial supplies are considered jointly. Ground water was utilized by 33 percent of the municipalities having public water supplies (table 4), and the amount used in 1960 was 1.8 mgd or 130 gpd per person. Municipalities using ground-water supplies from consolidated rocks have drilled wells that range from 80 to about 300 feet in depth. Most of these wells are less than 200 feet deep.
For all needs a total of 19.0 mgd, or 21,000 acre-feet, of ground water was used in the Arkansas Valley region during 1960.
PUMPING TESTS AND WELL YIELDS
Pumping tests were made at 14 well sites to determine the water bearing properties of the consolidated rocks and the tributary allu vium. Tests in the consolidated rocks were made in wells drilled in the Atoka Formation, Hartshorne Sandstone, McAlester Shale, and Savanna Sandstone (table 5). These rock units have the largest outcrop area and therefore the largest areas of recharge of all the rock units in the region.
The water-bearing property that was most useful in this study is the coefficient of transmissibility which can be used to determine drawdowns at specific pumping rates. This value is defined as the amount of water in gallons per day at the prevailing water temperature and under a hydraulic gradient of 100 percent that will move through a vertical strip of the water-bearing zone having a width of 1 foot and a height equal to the saturated thickness of this zone.
Transmissibility values range from 50 to 15,000 gpd per ft (gallons per day per foot). (See table 5.) The maximum value of 15,000 gpd per ft is extraordinary when compared to the general range, 50 to 2,200 gpd per ft.
No relation exists in the consolidated rocks between transmissi bility and rock unit or depth of well. This fact is in accord with what is known about the occurrence of ground water in fractures and interbed openings. The number, size, openness, and inter connection of the water-bearing openings control the volume of water moving through an area. The number of water-bearing openings intercepted by a well determines the volume of water that will move into that well. The deeper a well is drilled the more chance there is of intercepting openings, but it does not follow that the deeper a well the more water it will yield.
Field study of the rock units complements the pumping tests in the final evaluation of the yields that may be expected from each unit. The Stanley Shale, Jackfork Sandstone, and Boggy Shale have small recharge areas and probably low transmissibilities. These

BB30 CONTRIBUTIONS TO HYDROLOGY OF THE UNITED STATES
TABLE 5. Pumping-test data
WelU
4N-17W-10bcdl_ _ ........ _15cddl ________
2lW-3accl___. _ ._.. __3acc2-_- ___ _ __
6N-27W-25dccl__._ ___ . ....32W-20ddcl ________
21aaal-... _ _______21adcl _____ __
7N-27W-3cccl-__ ..__....__.8N-30W-27dcbl. __.._____.__9N-20W-27cba2 _ .... ...___
26W-15bcal _ .........15bcbl __ ._ _______IGadbl _____________
Depth of well
below land surface (feet)
18052
20020020116165
30110382
109120101100
Transmis- sibility (gallons per day per foot)
8050
2,2001,3902,000
15, 000130
1,8001,5001,400
50560880
90
Rock unit
Atoka Formation.Tributary Alluvium.Atoka Formation.
Do.Do.
McAlester Shale.Hartshorne Sandstone.
Do.Savanna Sandstone.McAlester Shale.Atoka Formation.
Do.Do.Do.
' See text for explanation of well-numbering system.
rock units probably will not yield more than 10 gpm (gallons per minute) under sustained pumping. The maximum yield of wells drilled to date (1960) in the Atoka Formation is about 60 gpm. Large-capacity wells 100 to 300 feet deep supply the municipalities of Altus, Franklin County, Hartford, Sebastian County, and Ola, Yell County. Kural homes, farms, and small commercial establish ments generally have wells that yield less than 10 gpm and are less than 100 feet deep. Wells in the Hartshorne Sandstone have proved yields that range from 7 to 60 gpm and supply rural homes, small farms, small commercial establishments, and a small municipality. Most wells in the Hartshorne Sandstone probably yield much less than 60 gpm. Yields of wells in the McAlester Shale are adequate for small farms, rural homes, small commercial establishments, at least two large livestock farms, and one small municipality (Lavaca, Sebastian County). Lavaca obtains water from a well that is 80 feet deep and has a yield of 50 gpm under sustained pumping. A well that combines shallow depth with high yield as the Lavaca well is not common in the region or in the McAlester Shale. Most wells hi this rock unit yield much less than 50 gpm; but one well (6N-32W-20ddcl, table 5) has a proved yield of 100 gpm, which is almost twice that of any other known well in the region. A well in the Savanna Sandstone yields 60 gpm under sustained pumping, and the yield was the largest found in this rock unit. The well, which is about 103 feet deep, supplies water to the municipality of Caulksville, Logan County. Wells yielding less than 10 gpm supply water for rural homes, small farms, and small commercial establish ments.

AKKANSAS VALLEY REGION, ARKANSAS BB31
The flood-plain deposits of the Arkansas River yield ground water to the wells of four municipalities (Atkins, Pope County; Dardanelle, Yell County; Morrilton, Conway County; and Ozark, Franklin County) and to wells used for irrigation. The depths of the wells do not exceed 80 feet. An evaluation of the ground-water potential of these deposits is outside the scope of this report.
The alluvial deposits of the tributary streams are not considered to be major sources of ground-water. The fine texture of the upper zone and of the matrix of the lower zone and the data from a pumping test (table 5) indicate a low permeability for the alluvial materials in most of the region. In the vicinity of Perry, Perry County, and Plumerville, Conway County, relatively high permeabilities characterize the tribu tary alluvium. (The municipality of Plumerville utilizes the tributary alluvium as a source of water.) These atypical permeabilities probably are in gravels which have coarsed-grained matrices. Test drilling in the alluvial areas of the tributaries may prove valuable in locating high- permeability zones. The available lithologic data suggest that these zones are discontinuous and small and therefore only of local im portance as sources of ground water. In most of the region, yields from wells in the tributary alluvium are adequate for rural-domestic needs; but yields that are large enough for municipalities, irrigation, and poultry and livestock farms must be sought at depth in the underlying consolidated rocks.
The large yields of 50 to 100 gpm are not common for wells in the consolidated-rock terrane of the Arkansas Valley region. Special conditions of occurence and movement of ground water control the location of such wells. Detailed studies to determine these conditions would prove invaluable in locating other areas of maximum yield.
POTENTIAL DEVELOPMENT AND LIMITING FACTORS
The total streamflow of the region is computed to be 7.4 million acre-feet annually. The total ground water used in 1960 is com puted to be 21,000 acre-feet. The total water used from surface-water sources for 1960 is computed to be 40,000 acre-feet.
The amount of water discharged by streams is a measure of the water that is potentially available for development. Therefore, the total amount of water that is potentially available for development hi the Arkansas Valley region probably does not exceed 40 percent of the precipitation. The total water used in the region during 1960 was 61,000 acre-feet, which means that only 0.8 percent of the total water available for development was utilized. Therefore, the unused water in the region is in excess of 7 million acre-feet annually. However, only a part of this would be available for practicable development.

BB32 CONTRIBUTIONS TO HYDROLOGY OF THE UNITED STATES
The factors limiting development of ground water include the yield of wells and the depth of drilling. The majority of wells yield less than 60 gpm, although 1 well yielded 100 gpm. The maximum practi cable depth of wells is determined by the depth to salt water. In formation from logs of gas tests and wells indicates that this depth generally is about 1,000 feet, although it ranges from about 500 to about 2,000 feet.
SUMMARY OF PRINCIPAL CONCLUSIONS
Replenishment of ground water hi the Arkansas Valley region is primarily by precipitation. About 40 percent of the annual precipita tion, or 7.4 million acre-feet, is potentially available for development. Only 0.8 percent of the water potentially available was utilized from ground- and surface-water sources in 1960. The unused water is therefore in excess of 7 million acre-feet annually. Only a part of this is available for practicable development. Factors limiting de velopment of ground water are yield and depth of wells. Yield probably is less than 60 gpm for most wells of the region, but locally, wells yielding more than 60 gpm can be drilled. Salt water limits the maximum depth of wells to 1,000 feet in most places and 500 or 2,000 feet in some places.
Yields that are sufficient for farm, rural-domestic, and public needs generally can be obtained from wells less than 200 feet deep. The depth of wells is determined by the size, degree of interconnection, and number of water-bearing openings intercepted by a well and not by the rock unit.
Chemical analyses of well water in the consolidated rocks show that the bicarbonate cation and the sodium anion predominate in waters from most of the rock units of the region. The dissolved-solids content generally is less than 500 ppm, and the Atoka Formation and McAlester Shale are the rock units having waters most likely to con tain more than this amount. Only 11 percent of the water samples analyzed contained more than 4.0 ppm of iron, and most of these were from the Atoka Formation. Hardness generally is less than 200 ppm. Values of pH generally lie between 6.0 and 8.0, indicating mildly acid to mildly alkaline waters. Of the wells inventoried, objectionable iron staining occurs in about 13 percent and the odor of hydrogen sulfide in less than 1 percent. The presence of objec tionable waters cannot be predicted before drilling.
For a complete understanding of the ground-water situation hi a region it is essential that both general and detailed data be collected and correlated. The basic data that have been collected in this reconnaissance serve a dual function. First, they form a groundwork for the collection of detailed data. Second, they aid hi defining the

ARKANSAS VALLEY REGION, ARKANSAS BB33
problems that need further study. Following are suggestions for detailed studies hi the Arkansas Valley region:
1. Determine the relation of structure to ground-water movement.2. Determine the relative influence of types of openings on occur
rence and movement of ground water in the consolidated rocks.
3. Locate areas of maximum yield.4. Contour the fresh salt-water contact so that well depths can be
chosen with greater accuracy.5. Test drill in tributary alluvial areas for zones of high perme
ability.
REFERENCES CITED
Arkansas Geological Survey, 1929, Geologic map of Arkansas: Little Rock, Ark.,Arkansas Geol. Survey.
Arkansas Oil and Gas Commission, 1959, Factual data, engineer's report of oiland gas reservoirs: Arkansas Oil and Gas Comm., p. 23.
Comly, H. H., 1945, Cyanosis in infants caused by nitrates in well water: Am.Med. Assoc. Jour., v. 129, p. 112-116.
Croneis, Carey, 1930, Geology of the Arkansas Paleozoic Area: Arkansas Geol.Survey Bull. 3, 457 p.
Fenneman, N. M., 1938, Physiography of Eastern United States: New York,McGraw-Hill Publishing Co., 714 p.
Hendricks, T. A., and Parks, Bryan, 1950, Geology of the Fort Smith District,Arkansas: U.S. Geol. Survey Prof. Paper 221-E, 94 p., 6 pis.
Maier, F. J., 1950, Fluoridation of public water supplies: Am. Water WorksAssoc. Jour., v. 42, pt. 1, p. 1120-1132.
Meinzer, O. E., 1923, The occurrence of ground water in the United States,with a discussion of principles: U.S. Geol. Survey Water-Supply Paper 489.
U.S. Public Health Service, 1961, Drinking water standards: Am. Water WorksAssoc. Jour., v. 53, p. 935-945.


