
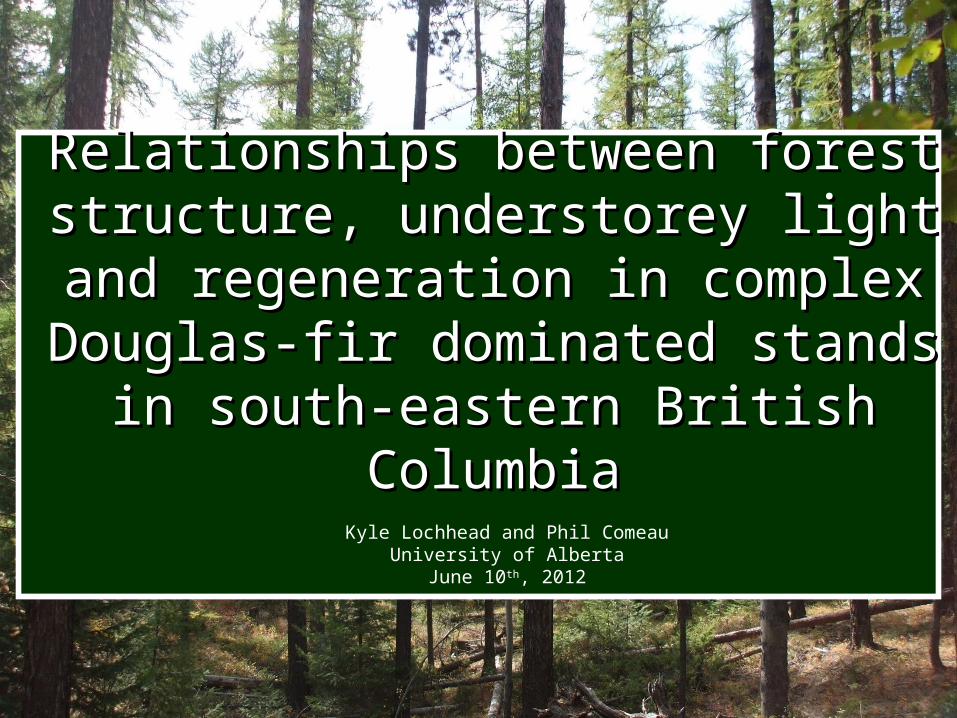
Relationships between forest Relationships between forest structure, understorey light and structure, understorey light and
regeneration in complex Douglas-fir regeneration in complex Douglas-fir dominated stands in south-eastern dominated stands in south-eastern
British ColumbiaBritish Columbia
Kyle Lochhead and Phil ComeauUniversity of Alberta
June 10th, 2012
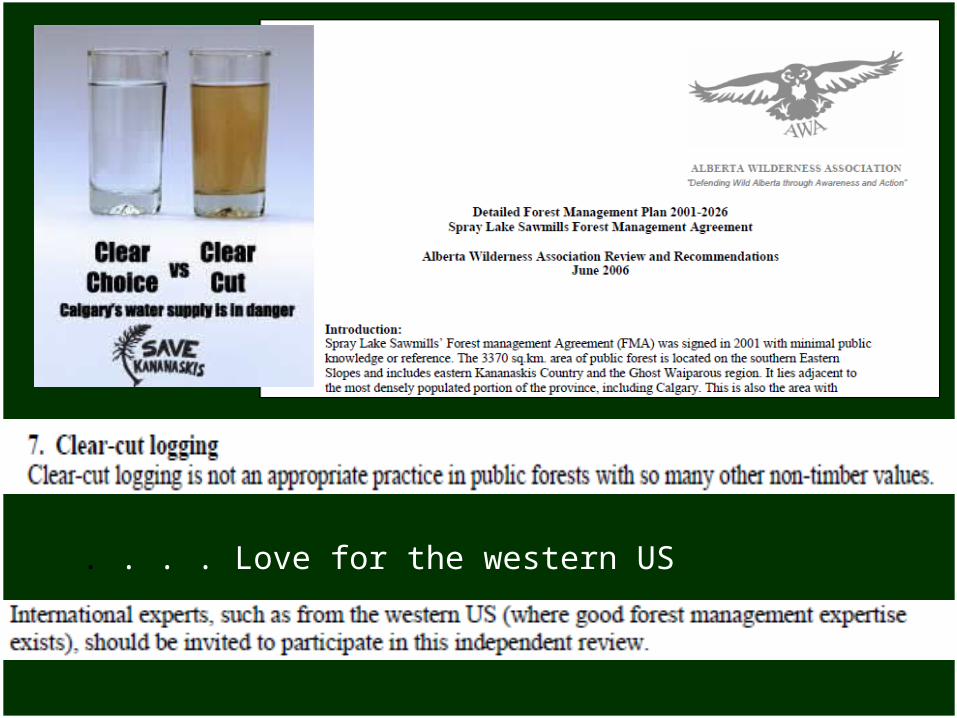
. . . . Love for the western US
Relationships between forest Relationships between forest structure, understorey light and structure, understorey light and
regeneration in complex Douglas-fir regeneration in complex Douglas-fir dominated stands in south-eastern dominated stands in south-eastern
British ColumbiaBritish Columbia
Kyle Lochhead and Phil ComeauUniversity of Alberta
June 10th, 2012

Interior Douglas FirInterior Douglas Fir• Warm (1.6 - 9.5°C) and
Dry (300 – 750 mm)
• Fd – Lw – Pl
• Fire dominated
• Large openings – Frost
• Mule deer
• Light requirements of Fd (coast); >20% survive, morphology < 40%; Fd (interior) found in 5%

StructureStructure

Characterizing light levels in the understory
• Many studies indicate that stand characteristics such as basal area (Hale 2003), SDI (Vales and Bunnell 1988), Relative Density (Comeau and Heineman 2003) can be used to predict light levels

Study SiteStudy Site
• IDFdm2• Mixed conifer
– Fd, Lw, Pl, PP
• Fire occurred 120 yrs– Lw is over 200 yrs
• Harvested in 1994• Selection harvesting
with differing residual basal areas

Experimental DesignExperimental Design
• CRD with subsampling• 4 replicates of 4 treatments
of target residual basal area (m2/ha): 8, 16, 24, and unharvested (~37 m2/ha)
• Regeneration growth• Light measurements : LAI-
2000 Plant Canopy Analzyers, Hemi-photos, Photodiodes
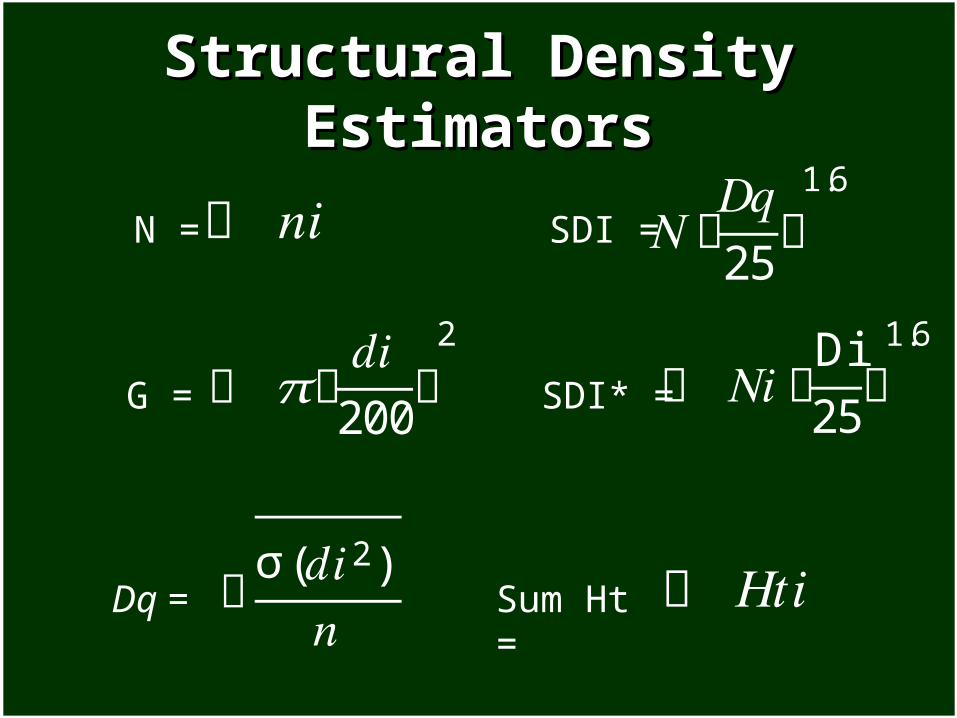
Structural Density EstimatorsStructural Density Estimators
𝜋൬𝑑𝑖200൰2
𝑁൬𝐷𝑞25൰1.6
ඨσ(𝑑𝑖2) 𝑛
𝑁𝑖൬Di25൰1.6
𝑛𝑖 N = SDI =
G = SDI* =
Dq = 𝐻𝑡𝑖 Sum Ht =
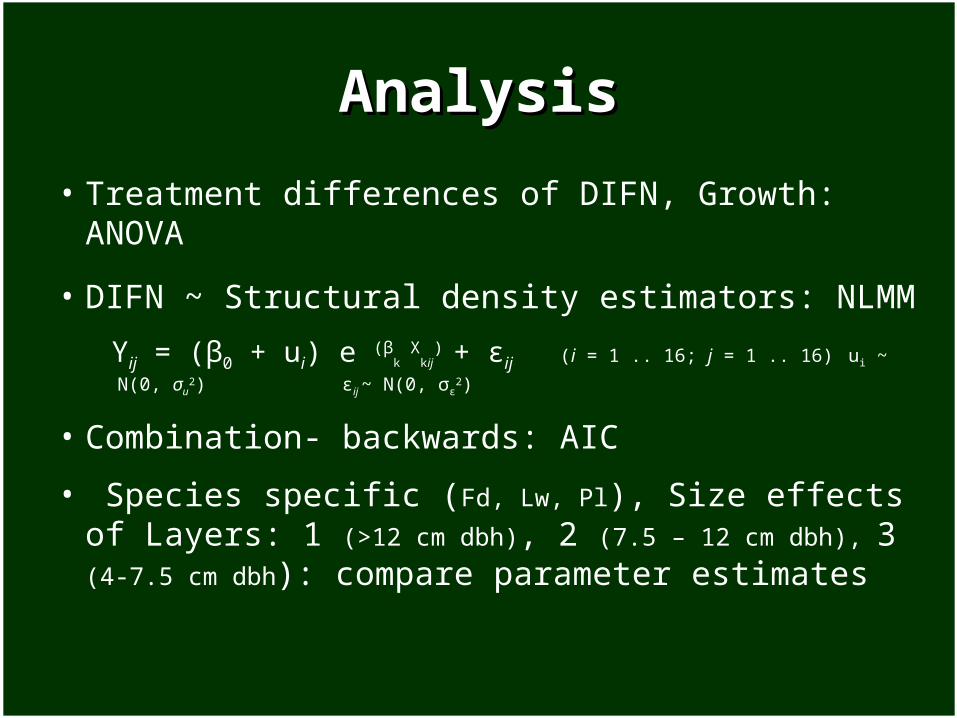
AnalysisAnalysis
• Treatment differences of DIFN, Growth: ANOVA
• DIFN ~ Structural density estimators: NLMM
Yij = (β0 + ui) e (βk X
kij) + εij (i = 1 .. 16; j = 1 .. 16) ui ~ N(0, σu
2)
εij ~ N(0, σε2)
• Combination- backwards: AIC
• Species specific (Fd, Lw, Pl), Size effects of Layers: 1 (>12 cm dbh), 2 (7.5 – 12 cm dbh), 3 (4-7.5 cm
dbh): compare parameter estimates

Understorey light availabilityUnderstorey light availability
DIFN
Tota
l PPF
D (µ
mol
/m²)
0.10 0.15 0.20 0.25 0.30 0.35 0.40 0.45
0e+0
01e
+05
2e+0
53e
+05
4e+0
55e
+05
6e+0
5
CH
LM
0.1 0.2 0.3 0.4 0.5 0.6 0.7
Diffuse Non-interceptance
Trea
tmen
t
C=H=M=L, p=0.24R2 =0.9, RMSE = 64,079

0.0 0.2 0.4 0.6 0.8 1.0
0.1
0.3
0.5
0.7
G (m²/0.01ha)
DIF
N
0 10 20 30 40
0.1
0.3
0.5
0.7
N (Trees/0.01ha)
DIF
N
0 5 10 15
0.1
0.3
0.5
0.7
SDIeven/0.01ha
DIF
N
0 5 10 15
0.1
0.3
0.5
0.7
SDI*/0.01ha
DIF
N0 20 40 60 80
0.1
0.3
0.5
0.7
Sum log(DBH)/0.01ha
DIF
N
0 100 200 300 400
0.1
0.3
0.5
0.7
Sum Height/0.01haD
IFN
Light availability and structureLight availability and structure
• At the microsite scale
adjR2: G - 0.37 (0.02) – N - 0.54 (0.24)
• Unoccupied plots predicting 31-40% full sky
•Separation by species
•SDIeven ~ SDI*
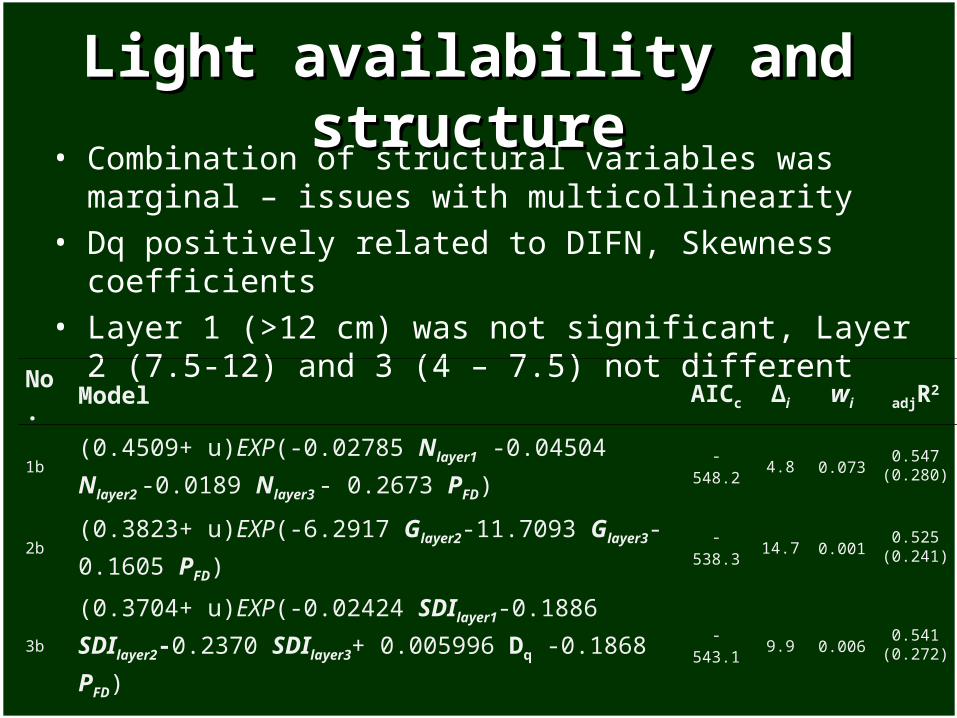
Light availability and structureLight availability and structure• Combination of structural variables was marginal – issues
with multicollinearity • Dq positively related to DIFN, Skewness coefficients• Layer 1 (>12 cm) was not significant, Layer 2 (7.5-12) and
3 (4 – 7.5) not different
No. Model AICc Δi wi adjR2
1b(0.4509+ u)EXP(-0.02785 Nlayer1 -0.04504 Nlayer2 -0.0189
Nlayer3 - 0.2673 PFD)-548.2 4.8 0.073
0.547 (0.280)
2b (0.3823+ u)EXP(-6.2917 Glayer2-11.7093 Glayer3-0.1605 PFD) -538.3 14.7 0.0010.525
(0.241)
3b(0.3704+ u)EXP(-0.02424 SDIlayer1-0.1886 SDIlayer2-0.2370
SDIlayer3+ 0.005996 Dq -0.1868 PFD)-543.1 9.9 0.006
0.541(0.272)

RegenerationRegeneration
• Height growth is slow (<20% fully sky)– 2.3 to 6.8 cm
• Treatment differences– Small (p=0.47), Medium (p =
0.56), Large (p = 0.36)
• Average 5 year leader length: R2: 31.9 - 63.3% DIFN and N best
• Abundance: Light is key

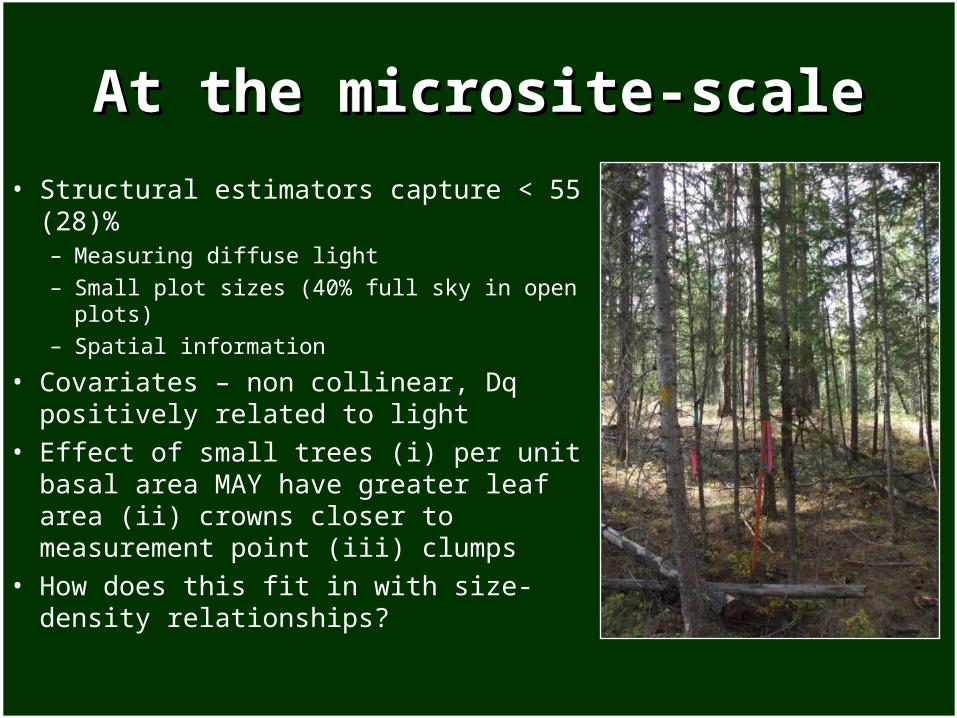
At the microsite-scaleAt the microsite-scale
• Structural estimators capture < 55 (28)% – Measuring diffuse light– Small plot sizes (40% full sky in open plots)– Spatial information
• Covariates – non collinear, Dq positively related to light
• Effect of small trees (i) per unit basal area MAY have greater leaf area (ii) crowns closer to measurement point (iii) clumps
• How does this fit in with size-density relationships?

Light and size-densityLight and size-density
• Uneven-aged – Dq can range with the same N, estimate of skewness is needed
• SDI* deals with skewness and assumes additively but in this empirical study proved similar to SDI– Truncation of smaller classes (Ducey 2009)
• Sterba and Monserud (1993) – Flatter slope– This slope is not constant- often curvi-linear, other factors
• At the microsite - individual weight G (DBH2), SDI* (DBH1.6), sum D (DBH1) and N (DBH0)

ConclusionsConclusions
• Light availability is variable at the microsite
• The linkage between management at the stand level and microsite level– Use a growth model or … use bigger plots,
include spatial info, size-density relationships with structure
• RBA below 24 m2/ha promote regeneration

Thank-you
Funding for this research provided by B.C. Ministry of Forests and RangeAssistance from Teresa Newsome and Michaela Waterhouse is gratefully acknowledged


