Volume 12, Issue 2 RELIABILITY®Magazine 13
RELIABILITY CENTERED MAINTENANCEEquations of RCMby Lynnwood Yates, CMRP, Richard Overman, CMRP & David Nelson, CMRP
Reliability Centered Maintenance (RCM) is an analytical process used to identify policies and strategies that must be implemented to preserve the function of a physical asset. The selected policy or strategy must achieve a toler-able probability of failure for failure modes with safety and environmental consequences or must be cost effective for failure modes with operational and non-operational consequences.
As an analytical process, RCM relies on various equations to identify possible function preservation strategies that are technically feasible and worth doing. The set of equations used depend on the consequences of failure. The equations for each scheduled function preserva-tion strategy are shown below and are followed by an alphabetical listing of the terms used.
An important word of caution is in order. These equations cannot be used by rote. The analyst must understand what the equations are doing and make sure they apply to the situation. If the equation gives an answer that does not make sense, it may not apply.
On-Condition Equations
On-condition (OC) tasks apply to failure modes that have both safety/en-vironmental as well as operational/non-operational consequences. For failure modes with safety/environmental conse-quences, the task interval must be short enough to ensure that the probability of missing a potential failure is reduced to the tolerable level (Ptol). For failure modes with operational/non-operational
consequences, the SM task must be cost effective. In either case, it is necessary to identify or estimate the interval between potential and functional failure (PF).
PF Interval Calculation
The PF interval can be determined by the following methods in order of preference:
1. Experimental data 2. Degradation analysis 3. Engineering judgment 4. Estimated from an existing task interval using Equation 1 and 2.
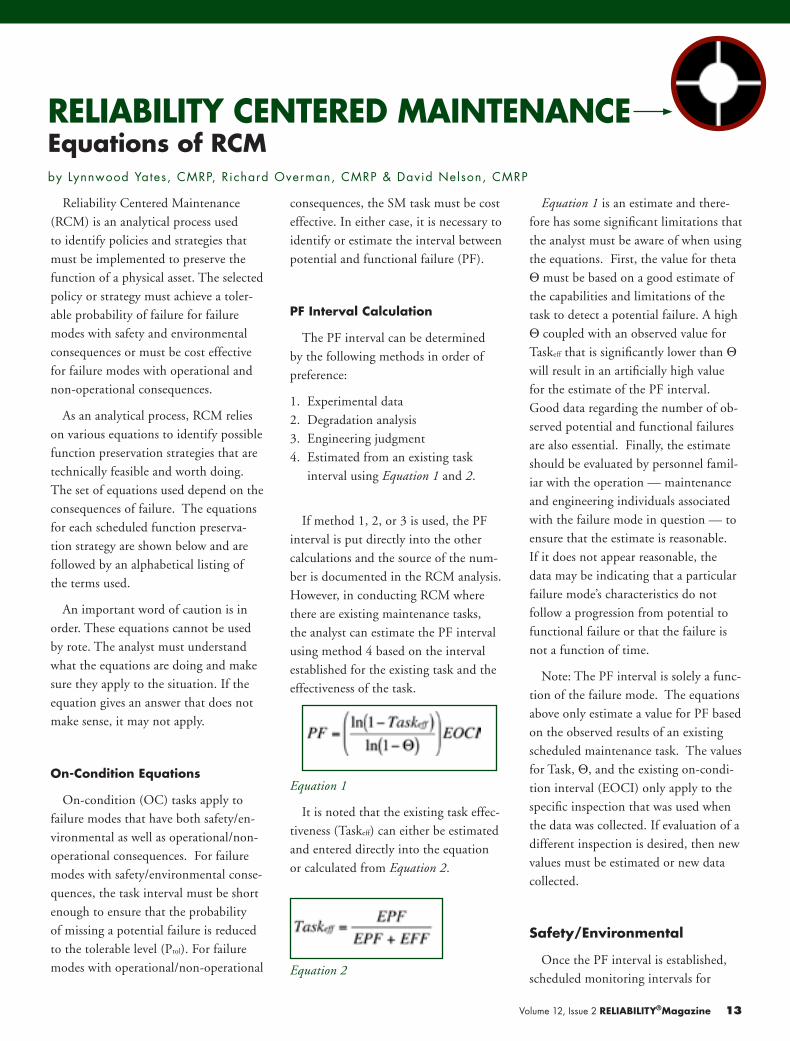
If method 1, 2, or 3 is used, the PF interval is put directly into the other calculations and the source of the num-ber is documented in the RCM analysis. However, in conducting RCM where there are existing maintenance tasks, the analyst can estimate the PF interval using method 4 based on the interval established for the existing task and the
effectiveness of the task.
Equation 1
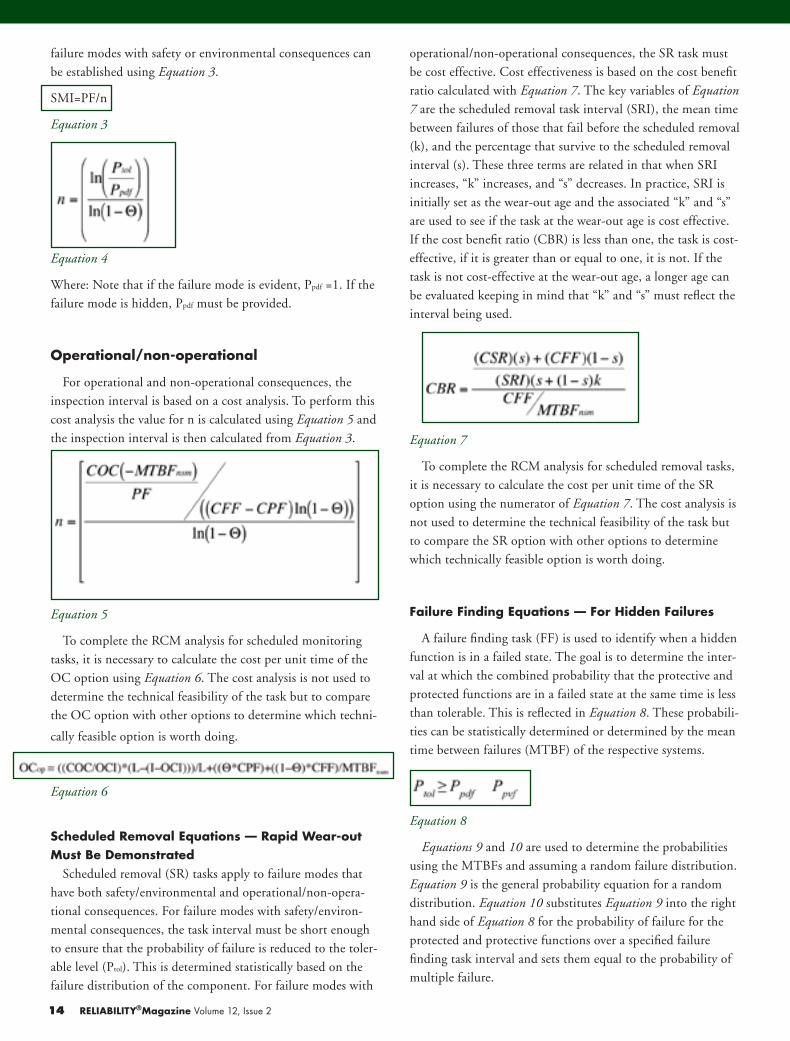
It is noted that the existing task effec-tiveness (Taskeff) can either be estimated and entered directly into the equation or calculated from Equation 2.
Equation 2
Equation 1 is an estimate and there-fore has some significant limitations that the analyst must be aware of when using the equations. First, the value for theta Θ must be based on a good estimate of the capabilities and limitations of the task to detect a potential failure. A high Θ coupled with an observed value for Taskeff that is significantly lower than Θ will result in an artificially high value
for the estimate of the PF interval. Good data regarding the number of ob-served potential and functional failures are also essential. Finally, the estimate should be evaluated by personnel famil-iar with the operation — maintenance and engineering individuals associated with the failure mode in question — to ensure that the estimate is reasonable. If it does not appear reasonable, the data may be indicating that a particular failure mode’s characteristics do not follow a progression from potential to functional failure or that the failure is not a function of time.
Note: The PF interval is solely a func-tion of the failure mode. The equations above only estimate a value for PF based on the observed results of an existing scheduled maintenance task. The values for Task, Θ, and the existing on-condi-tion interval (EOCI) only apply to the specific inspection that was used when the data was collected. If evaluation of a different inspection is desired, then new values must be estimated or new data collected.
Safety/Environmental
Once the PF interval is established, scheduled monitoring intervals for
failure modes with safety or environmental consequences can be established using Equation 3.
SMI=PF/n
Equation 3
Equation 4
Where: Note that if the failure mode is evident, Ppdf =1. If the failure mode is hidden, Ppdf must be provided.
Operational/non-operational
For operational and non-operational consequences, the inspection interval is based on a cost analysis. To perform this cost analysis the value for n is calculated using Equation 5 and the inspection interval is then calculated from Equation 3.
Equation 5
To complete the RCM analysis for scheduled monitoring tasks, it is necessary to calculate the cost per unit time of the OC option using Equation 6. The cost analysis is not used to determine the technical feasibility of the task but to compare the OC option with other options to determine which techni-
cally feasible option is worth doing.
Equation 6
Scheduled Removal Equations — Rapid Wear-out Must Be Demonstrated
Scheduled removal (SR) tasks apply to failure modes that have both safety/environmental and operational/non-opera-tional consequences. For failure modes with safety/environ-mental consequences, the task interval must be short enough to ensure that the probability of failure is reduced to the toler-able level (Ptol). This is determined statistically based on the failure distribution of the component. For failure modes with
operational/non-operational consequences, the SR task must be cost effective. Cost effectiveness is based on the cost benefit ratio calculated with Equation 7. The key variables of Equation 7 are the scheduled removal task interval (SRI), the mean time between failures of those that fail before the scheduled removal (k), and the percentage that survive to the scheduled removal interval (s). These three terms are related in that when SRI increases, “k” increases, and “s” decreases. In practice, SRI is initially set as the wear-out age and the associated “k” and “s” are used to see if the task at the wear-out age is cost effective. If the cost benefit ratio (CBR) is less than one, the task is cost-effective, if it is greater than or equal to one, it is not. If the task is not cost-effective at the wear-out age, a longer age can be evaluated keeping in mind that “k” and “s” must reflect the interval being used.
Equation 7
To complete the RCM analysis for scheduled removal tasks, it is necessary to calculate the cost per unit time of the SR option using the numerator of Equation 7. The cost analysis is not used to determine the technical feasibility of the task but to compare the SR option with other options to determine which technically feasible option is worth doing.
Failure Finding Equations — For Hidden Failures
A failure finding task (FF) is used to identify when a hidden function is in a failed state. The goal is to determine the inter-val at which the combined probability that the protective and
protected functions are in a failed state at the same time is less than tolerable. This is reflected in Equation 8. These probabili-ties can be statistically determined or determined by the mean time between failures (MTBF) of the respective systems.
Equation 8
Equations 9 and 10 are used to determine the probabilities using the MTBFs and assuming a random failure distribution. Equation 9 is the general probability equation for a random distribution. Equation 10 substitutes Equation 9 into the right hand side of Equation 8 for the probability of failure for the protected and protective functions over a specified failure finding task interval and sets them equal to the probability of multiple failure.
14 RELIABILITY®Magazine Volume 12, Issue 2

Trust The ExpertiseWe Provide• Accurate, repeatable results
• Market competitive prices
• Quick turn around times
• Familiarity with industrialenvironments
• Professional & friendlystaff
Tests That MeetYour Needs• SF6 gas• Soil and water analysis• Asbestos, metals, fuels,
oils & more
A full service laboratory, with several locationsin southern Manitoba, Manitoba Hydro
Laboratories has more than 45 yearsexperience serving specialized
testing needs.
We’re UpFor The Test
Manitoba Hydro’s OILTRACKTM
program offers high-quality, timelyand affordable oil testing services.
Electrical Insulating Oil• PCB detection
• Fault gas
• Furans & inhibitors
Lubricating Oil• Lubricant condition
• Oil analysis for predictive
maintenance of equipment
Why test with Oiltrack?• Extend the life of electrical
and mechanical equipment.
• Prevent failures through earlydetection.
• Make informed decisionsto optimize maintenancefrequency and schedulingof equipment repair andreplacement
For more information,please visit www.oiltrack.ca,or contact Joaquin Carneiro,Chief Chemist, at 1-204-782-3317
PO# 71565MHL ad - Reliability MagazineHalf page Horz: 7” x 4 7/8”Full colour
Volume 12, Issue 2 RELIABILITY®Magazine 15
Rel
iabi
lity
Shop
per
Top
10R
elia
bili
ty S
olu
tio
n P
rovi
de
rsMaintenance & Reliability Services
To learn more about these Top 10 Maintenance & Reliability Solution Providers please visit
www.reliabilityshopper.com
Excellencein
Leading the World in RCM585-349-7245
www.reliabilitysolution.com
1Maximizing the Return on Asset Reliability
918-382-9400www.alliedreliability.com
2
Rede� ning Maintenance, Delivering Reliability843-744-7110www.LCE.com
3Experts in Making Reliability Work
1-877-746-3787www.ivara.com
4
Reliability Software, Training & Engineering Services509.928.5083 / 5084
www.reliabilityusa.com
5
Masters of Reliability Process Implementation952-882-8122
www.rmgmpls.com
7
Infrared Inspection Windows and Installation Services800-281-0650
www.infraredwindow.com
10
RCM, Lean, Six Sigma, Asset Management904-264-8570
www.wylelabs.com/products/vrcm.html
8
Improving People, Process & Technology Performance770-717-2737
www.pcaconsulting.com
9
Root Cause Analysis804-458-0645
www.reliability.com
6 ReliabilityCenterInc.

Volume 12, Issue 2 RELIABILITY®Magazine 17
Equation 9
Equation 10
In practice Ptol is set equal to Pmf as shown in Equation 11. This requires an iterative solution to find the failure finding task inter-val (FFI) that provides the equality. The FFI that provides
Equation 11
Equation 11 provides the interval that achieves the tolerable probability of failure within the scheduled failure finding task interval. This can be more conservative than necessary since the goal is to reduce the probability of failure to the tolerable level over the remaining useful life of the item. To determine the scheduled failure finding task interval that achieves this goal, it is necessary to find the tolerable MTBF using Equation 12. Equation 13 can then be iterated to find the FFI that reduces the probability of failure to the tolerable level over the remaining useful life.
Equation 12
Equation 13
To complete the RCM analysis for FF tasks, it is necessary to calculate the cost per unit time of the FF option using Equa-tion 14. The cost analysis is not used to determine the technical feasibility of the task but to compare the FF option with other options to determine which technically feasible option is worth doing.
Equation 14
18 RELIABILITY®Magazine Volume 12, Issue 2
Rel
iabi
lityS
hopp
erTo
p10
Relia
bili
ty S
oftw
are
Pro
vid
ers Maintenance Software
To learn more about these Top 10 Maintenance & Reliability Software Providers please visit
www.reliabilityshopper.com
Excellencein
an i n t eg ry s c ompany
Large Enough to Lead. Smart Enough to Listen.864-458-3333
www.assetpoint.com
3 ReliabilityCenterInc.
PROACT. Eliminating Problems. Eliminating Stress.804-458-0645
www.reliability.com /proact/proact.htm
4
Asset Intelligence At Your Fingertips1-888-AVANTIS or 905-632-6015
www.avantis.net
6
A Simpler CMMS360-678-8358
www.benchmate.com
8
9
Capturing Workplace Expertise to Improve Equipment Performance
1-877-746-3787 www.ivara.com
1Maintenance Development Strategy and Spares Optimization
USA: 508-359-1966 Asia/Paci� c: +61 3 9455 2211www.strategicorp.com
2
The Sensible Approach to Maintenance ManagaementMalaysia +603 8656 9041 US 1-716-631-4750
www.cworks.com.my
5
10
RCM Software & Training Video408-365-1975
www.jmssoft.com
7
MIMOSA-based Maintenance Intelligence Software866-247-2122
www.mtelligence.net
Gold Standard in Asset Management813-621-6463
www.pdma.com
Volume 12, Issue 2 RELIABILITY®Magazine 19
Terms
Cost benefit ratio (CBR) – This is a measure of the cost effectiveness of a task.
Cost of repairing a functional failure (CFF) – When a failure occurs, it must be repaired or the function replaced. This cost includes the cost of the time and materials necessary to repair the failure. The cost of any down-time needed to perform the repair and the cost of repairing any collateral damage may also be included.
Cost of repairing a potential failure (CPF) – This is the cost of repairing a potential failure condition that is found by a SM task. This cost includes the cost of the time and materials necessary to perform the repair. The cost of any down-time needed to affect the repair may also be included.
Cost of scheduled failure finding task (CSFF) – This is the cost of performing one SFF task. This cost includes the cost of the time and materials necessary to perform the SFF task. The cost of any down-time needed to perform the task may also be included.
Cost of the scheduled monitoring task (COC) – This is the cost of performing one OC task. This cost includes the cost of the time and materials necessary to perform the OC task. The cost of any down-time needed to perform the inspection may also be included.
Cost of the scheduled removal task (CSR) – This is the cost of performing one SR task. This cost includes the cost of the time and materials necessary to perform the SR task. The cost of any down-time needed to re-place the component or system may also be included.
Functional failures not found by existing task (EFF) – The number of times that the system or compo-nent exhibited a functional failure between or not found by SM tasks.
Potential failures found by the existing task (EPF) – When there is an existing SM, the number of times that the existing SM found a potential failure con-dition is identified.
Existing on-condition task effectiveness (Taskeff) – This is a measure of the quality of the exist-ing scheduled monitoring task. It is either estimated in terms of a percentage (i.e. the task finds potential failures 80% of the time and allows functional failures 20% of the time so the task effectiveness is 0.8 or can be calculated from the EPF and EFF.
Initial task interval (I) – In some cases it is reason-able to delay implementing a SM task until some of the life is used. For example, a structural member may not need to be checked for a crack from the first day it is put into service. In these cases, an initial inspection in-terval is established. Once the initial interval is reached, the SM task is performed according to the SMI. In the structural example, I might be 1,000 operating hours and SMI might be 100 operating hours. Hence, the SM task will not be performed until the item reaches 1,000 operating hours and then performed every 100 operat-ing hours.
Total design life (L) – As the name implies, this is the total amount of time the item was designed to be used. It can also be interpreted to mean the total amount of time the user intends to use the item from the first day it enters service. It is possible that the users intended life is less than the actual design life or the design life is shorter than the desired life. In either case, use the short-est measure of the two times. This should be notated as the lesser of the two numbers.
Average life of failures before interval (k) – This is used when there are operational or non-opera-tional consequences and the SR interval is set such that some items may fail before the prescribed interval. The “k” factor is the mean time between failures of the items that fail prior to the SR interval as a percentage of the SR interval.
Mean time between failures without any scheduled task in place (MTBFnsm) – The mean time between failures when the system or component is not being protected by a scheduled maintenance task. This is normally calculated as the population operat-ing time over a specific period of time divided by the number of functional failures (or estimated number of expected functional failures) over the same period of time.
Mean time between failure of the protected function (MTBFpdf) – This is the mean time between failure of the function that is being protected by the pro-tective device. In other words, this is the mean time that the protective device’s services will be needed.
Mean time between failure of the protective function (MTBFpvf) – This is the mean time between failure of the item that is performing the protective func-tion. Looked at another way, this is the mean time that the protective device will enter into a failed state.
20 RELIABILITY®Magazine Volume 12, Issue 2
Tolerable mean time between failure (MTBFtol)– This is the mean time between failure that is required to be achieved by performing the failure finding task. This can be viewed as the tolerable MTBF that the item will be in a failed condition at the time that it is needed.
Number of inspections within the PF interval (n) – This is the number of times that the scheduled mon-itoring task is to be performed within the PF interval. This number is based on the tolerable probability of failure for safety or environmental consequences and on cost for operational or non-operational consequences.
Interval between potential and functional fail-ure (PF) – The amount of time (however defined) the system or component will operate between the devel-opment of a potential failure condition and achieving functional failure. The PF interval can be a calculated value based on relevant data or an estimate based on knowledge and experience.
Probability of failure of multiple functions (Pmf) – For hidden failures where there is a protective device, this is the probability that the protected function and the function that protects it (the protective function) will be in a failed state at the same time. It is the quotient of the probability of failure of each of the functions.
Probability of failure of the protected function (Ppdf) – For hidden failures where there is a protective device, this is the probability that the protected function will fail and the protective device will be needed. In the case of items that are designed to warn of a particular condition (e.g. fire detectors), this is the probability that the condition will occur within a specific period of time.
Probability of failure of the protective function (Ppvf) - For hidden failures where there is a protective device, this is the probability that the protective function will fail and will not be available when needed.
Tolerable probability of failure (Ptol) – This is the probability that is considered to be the highest accept-able probability that the failure mode will occur in a specific unit of time. The probability varies depending on the consequences of failure. This term is generally used for safety and environmental consequences. While it is not typically used for operational and non-operational consequences, there are situations where it could be used. As used in RCM, this term more precisely describes the probability that a particular task will fail. That is that the task will not detect a condition or prevent a failure it is designed to prevent.
Remaining useful life (RUL) – The remaining useful life is the amount of time the user intends to use the item from a specified date. It can be calculated as the design life (L) minus the life already used.
Percentage of items that survive to a SR inter-val (s) – This is used when there are operational or non-operational consequences and the SR interval is set such that some items may fail before the prescribed interval. This is the percentage (expressed as a decimal) of items that will fail prior to the prescribed interval.
Failure finding task (FF) – This is a task that is performed at regular intervals to determine if a hidden function is in a failed state.
Failure finding task interval (FFI) – The time at which a component or system is tested to determine whether it can perform its required function.
Failure finding option (FFop) – This is the analysis of the option of using a scheduled failure finding task as the function preservation strategy.
On-condition task (OC) – A task developed to look for a specific potential failure condition and the action that is taken is based on the condition in which the com-ponent or system is found. This is also known as predic-tive maintenance (PdM), on-condition task, continuous monitoring, or a scheduled inspection.
Scheduled removal (SR) – A schedule removal task is implemented as a specific point in time (however time is defined). When a system or component reaches the specified time (life) the component or system is removed and replaced with a new or overhauled component or system.
Scheduled removal interval (SRI) – The time at which a component or system is removed from service regardless of its condition. This interval is based on a sta-tistical determination of the component or system exhibit-ing a wear-out failure characteristic.
Scheduled removal option (SRop) – This is the analysis of the option of using a scheduled removal task as the function preservation strategy.
Time (t) – Any period of time. Time can be measured in clock hours, days, operating hours, landings, or any other appropriate usage measurement.
Probability of detecting a potential failure (Θ) – Theta is the probability that a potential failure will be detected with one inspection given that the potential fai-
Volume 12, Issue 2 RELIABILITY®Magazine 21
ure condition exists. This is a measure of the quality of the inspection task.
Existing on-condition (EOCI) – This is the interval of an existing OC.
On-condition interval (OCI) – This is the time between scheduled monitor-ing inspections. The interval can be as short as micro-seconds (for continu-ously monitored systems) to very long periods of time.
On-condition option (OCop) – This is the analysis of the option of using a scheduled monitoring task as the func-tion preservation strategy.
Challenge Yourself With This Example Problem!
You have been assigned to perform an RCM analysis of a system. The system contains a pump and you are ready to ana-lyze an internal failure of the pump which is one of the failure modes of the system. There is no back-up pump; so when the pump fails, the system is down. When re-searching the data you learn that the pump has been in service for 21,900 operating hours and it is intended to be used for an additional 70,000 operating hours. The pump runs an average of 20 hours each day. There are 10 pumps in service in the plant that do the same job. A sister plant has the same pumps doing the same job but does not do any scheduled mainte-nance on the pumps. They report that on the average, they have a pump failure once every two years. They also have 10 pumps that have been in service for an average of 21,900 hours (three years) each.
A vibration analysis is performed on the pump once a month. Over the last five years, the vibration analysis has found 20 pumps in the process of failing. Five pumps have failed in service without being identified as bad by the vibration analysis. It takes two man-hours to perform the vibration analysis. There are no other costs to perform the task. When the vibration analysis finds a bad pump it is replaced with an overhauled pump and sent to the shop for overhaul. The replacement pump cost $2,000 and it takes 3 man-hours to replace the pump. The system is down for a total of one hour. At your request, a quick study was performed where a pump with a known defect was tested by every vibration analyst. The defect was found 90% of the time.
A Weibull analysis has a beta of 5.67 which is indicative of a wear-out characteristic. For safety consequences, the pump has a 1X10⁻⁶ probability of failure after one year. It can also be shown that there is a linear relationship between the SRI, “s”, and “k.” That means that for every percent the SRI is decreased, “s” increases by 1% and “k” decreases by 1%. At five years, “s” is 0.95 and “k” is 0.9.
If the pump fails, it is damaged to the point that it cannot be repaired. A new pump costs $10,000. The catastrophic loss of flow in the system causes other problems. Therefore, it takes 10 man-hours to perform the repair and the system is down for five hours.

You are reading this.
Your job depends on equipment running.
You have anything to do with Maintenance or Reliability.
You manage a PdM/CBM team.
Uptime is the only publication dedicating 100% of its coverage to Predictive Maintenance and Condition Based Monitoring.
For your FREE subscription go to
www.uptimemagazine.com
IF Subscribe to Uptime
Uptime Ad.indd 1 2/9/06 10:46:17 AM

Volume 12, Issue 2 RELIABILITY®Magazine 23
From the ground rules and assumptions, you learn that an hour of down time costs the company $5,000 and a standard man-hour rate of $75.00 has been established. The Ptol is 1X10⁻⁶ for safety consequences and 1X10⁻⁴ for operational consequences.
With the above information, calculate the scheduled maintenance option for safety consequences and operational consequences that is technically feasible and worth doing.
You can find the answer on the RELIABILITY®Magazine web site at http://www.reliability-magazine.com.
Conclusion
The formulas derived for RCM are robust and well proven. As with any calculation, however, the quality of the inputs determines the accuracy of the output. Caution should be used to avoid a rote usage and always tempered with good engineering judgment. The limitations of the equations must be clearly un-derstood. Using a quantified approach to RCM, even if it involves best estimates and assumptions, provides meaningful results that make the analysis more understandable and believable. The cost data is clear and useful for putting the results of the analysis in terms that management can grasp and relate to their decision-making processes.
About the Authors
Lynnwood Yates is a Certified Maintenance & Reliability Profes-sional and is a Senior RCM Engineer for Wyle Laboratories, Inc. He has oversight for all Air Force RCM efforts within the company. Contact information: Lynnwood E. Yates, CMRP Principle RCM Engineer Wyle Laboratories, Inc. 813 Park Drive Warner Robins, GA 31088 866-922-4314 (office toll free) 478-923-0500 (office local) 478-923-0240 (fax) 478-290-9142 (cell) [email protected].
Richard Overman is a Certified Maintenance & Reliability Profes-sional and is the former Chief Engineer for Wyle Laboratories, Inc. He is the author of numerous articles on RCM and conducts RCM training for practitioners and managers.
David Nelson, CMRP, works at Wyle Laboratories as a Senior RCM Engineer.
This article was part of a presentation done at RCM 2006 – The Reliability Centered Maintenance Managers’ Forum held March 8-10, 2006 in Las Vegas, Nevada, sponsored by Reliabilityweb.com.
References
Naval Air Systems Command Reliability-Centered Maintenance Management Manual (NAVAIR 00-25-403) web-site - http://logistics.navair.navy.mil/rcm/library/00- 25403.pdf RCM II (second edition), 1997 by John Moubray.
RELIABILITY® Magazine LLC PO Box 34040Knoxville TN 37930 Tel: 888-575-1245 x6 Fax: 865-381-0506
THE MAGAZINE FOR IMPROVED PLANT PRODUCTIVITY
RELIABILITY® Magazine Subscription Form Move ahead with other RELIABILITY® Magazine readers by subscribing now at http://www.reliability-magazine.com orcomplete this form and return it to the address above.
Subscription Details
Name _______________________
Title _______________________ USA
Company _______________________ □ 3 Years (18 issues) $297
Address _______________________ □ 2 Years (12 issues) $198
_______________________ □ 1 Year (6 issues) $99
City, State, Zip _______________________ International
Country _______________________ □ 3 Years (18 issues) $297
Phone _______________________ □ 2 Years (12 issues) $198
Fax _______________________ □ 1 Year (6 issues) $99
Email _______________________
Credit Card Details AMEX MC VISA (circle one)
Card Number _______________________ Ex Date _________
Name on Card _______________________ Billing Address (this is the address where the credit card statements are delivered)
Address _______________________________________
City, State, Zip _______________________________________
Country _______________________________________
Signature _______________________________________


