
,. Report No. 2. Gove,nment Acceuion No.
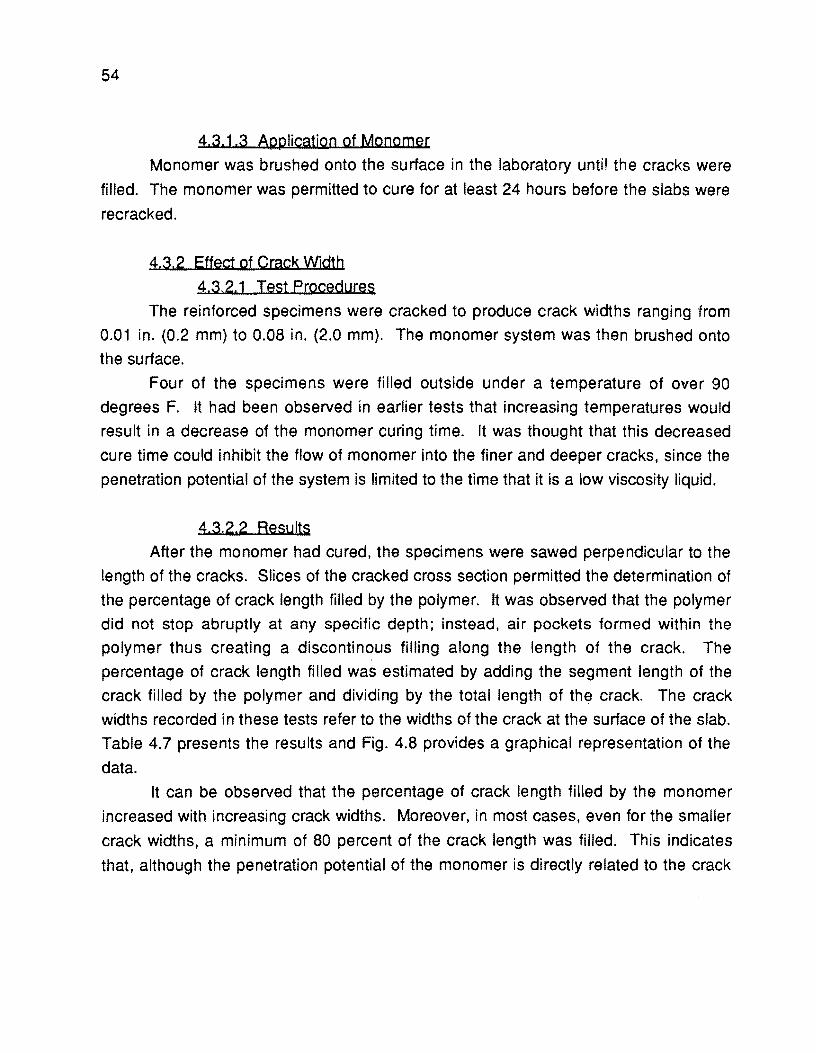
FHWA/TX-87/48+385-2F
4. Title and Subtitle
REPAIRING CRACKS IN PORTLAND CEMENT CONCRETE USING POLYMERS
1. Author/.)
Wayne D. Mangum, Alejandro J. Bermudez-Goldman, David P. Whitney, David W. Fowler, and Alvin H. Meyer 9. Perfo,minll Organization Name and Addre ..
Center for Transportation Research The University of Texas at Austin Austin, Texas 78712-1075
TECHNICAL REPORT STANDARD TITLE PAGE
l. Recipient's Cotolog No.
5. Report Dote
November 1986 6. Performing Organization Code
8. Performing Organization Report No.
Research Report 385-2F
10. Wo,k Unit No.
J 1. Controct or Grant No.
Research Study 3-18-84-385 r.-:;--;-_-:-_:-_-:-: __ ~;-:-; _________________ ...I13. Type of Report and Period Covered
12. Sponlorin" Allency Name and Add,e ..
Texas State Department of Highways and Public Transportation; Transportation Planning Division
Final
P. O. Box 5051 14. Sponlorin" A"ency Code Austin, Texas 78763-5051 15. Supplementa,y Not ..
Study conducted in cooperation with the U. S. Department of Transportation, Federal Highway Administration. Research Study Title: '~epairing Cracks in Portland Cement Concrete Using Polymers"
16. Ab.troct
Cracking in portland cement concrete pavements and bridge decks causes many problems including reduced stiffness which leads to greater deflections and additional cracking. Water and chlorides are able to penetrate cracks resulting in freeze-thaw deterioration and corrosion of reinforcement. Several methods of repairing cracks were investigated in the study. One method consisted of using polymer concrete in enlarged cracks in pavements. The cracks were enlarged with a crack cutter. Sand was placed in the crack and saturated with monomer to form a strong polymer concrete which bonded well to the portland cement concrete. Evaluations of many miles of repaired cracks on 1-610 indicate very good performance. The disadvantage of the method is the length of time required to enlarge the cracks. Epoxy injection was investigated in the laboratory using different crack widths and three different ambient temperatures in cracked slabs. The slabs were recracked to determine recracking strength and location of the second crack. For the epoxy used, the recracking strength was good for 70 degrees F and higher; the I results at 40 degrees F reflected the slow curing of the epoxy. Generally epoxy injection provided a good bond but crack preparation was found to be very important. Limited field tests were conducted. High molecular weight methacrylate monomer systems (HMWM) were investigated for brushing on the surface of cracked concrete. The monomer filled the cracks in dry laboratory slabs to 95 percent of the crack length for cracks as narrow as 0.2 mm. Moisture in the crack reduced the penetration but more than adequate filling was observed. Recracking strength was good. Some success was achieved with spraying cracked concrete overhead. 17. Key Wordl
portland cement concrete, cracks, repairs, polymers, enlarged cracks, epoxy injection, field tests
18. Olttrilaution Stotement
No restrictions. This document is available to the public through the National Technical Information Service, Springfield, Virginia 22161.
19. Security Cla .. il. (of thlt r.port)
Unclassified
20. S.curity CI ... If. (of thit , ... ,
Unc lass ified
210 No. of POI" 22. Price
122
Form DOT F 1700.7 ,8-61)

REPAIRING CRACKS
IN PORTLAND CEMENT CONCRETE
USING POLYMERS
by
Wayne D. Mangum
Alejandro J. Bermudez-Goldman
David P. Whitney
David W. Fowler
Alvin H. Meyer
Research Report Number 385-2F
Repairing Cracks in Portland Cement Concrete Using Polymers
Research Project 3-18-84-385
conducted for
Texas State Department of Highways
and Public Transportation
in cooperation with the
U. S. Department of Transportation
Federal Highway Administration
by the
Center for Transportation Research
Bureau of Engineering Research
The University of Texas at Austin
November 1986

The contents of this report reflect the views of the authors, who are responsible
for the facts and the accuracy of the data presented herein. The contents do not
necessarily reflect the official views or policies of the Federal Highway Administration.
This report does not constitute a standard, specification, or regulation.
There was no invention or discovery conceived or first actually reduced to
practice in the course of or under this contract, including any art, method, process,
machine, manufacture, design or composition of matter, or any new and useful
improvement thereof, or any variety of plant which is or may be patentable under the
patent laws of the United States of America or any foreign country.
ii

PREFACE
The authors wish to express their appreciation to Larry Buttler, 0-18, for his role
as techincal coordinator of Research Study 385 and to Jerry Daleiden, 0-8, associate
technical coordinator. Thery were always available to provide suggestions and advice
and accompanied the study supervisors on trips to visit the districts.
The authors are also indebted to Dr. Robert Gleim of the Rohm and Haas
Company for his advice and support on the use of the high molecular weight
methacrylate and to Milton Anderson of Rescon (formerly Rocky Mountain Chemical
Company) for providing the epoxy injection equipment and materials used in the
study. The assistance of Joy Suvunphugdee in typing the report is also gratefully
acknowledged.
Austin, Texas
November 1986
iii
Wayne D. Mangum Alejandro J. Bermudez-Goldman David P. Whitney David W. Fowler Alvin H. Meyer

!!!!!!!!!!!!!!!!!!!"#$%!&'()!*)&+',)%!'-!$-.)-.$/-'++0!1+'-2!&'()!$-!.#)!/*$($-'+3!
44!5"6!7$1*'*0!8$($.$9'.$/-!")':!

LIST OF REPORTS
Report No. 385-1, "Improved Method for Sealing Joints in Portland Cement Concrete
Pavements," by Alexander Collins III, Wayne D. Mangum, David W. Fowler, and Alvin
H. Meyer, describes methods and laboratory evaluations for the most commonly used
jOint sealing materials in Texas. September 1986.
Report No. 385-2, "Repairing Cracks in Portland Cement Concrete Using Polymers,"
by Wayne D. Mangum, Alejandro J. Bermudez-Goldman, David P. Whitney, David W.
Fowler, and Alvin H. Meyer, details the methods and materials involved in repairing
cracked portland cement concrete decks with polymers. November 1986.
v

!!!!!!!!!!!!!!!!!!!"#$%!&'()!*)&+',)%!'-!$-.)-.$/-'++0!1+'-2!&'()!$-!.#)!/*$($-'+3!
44!5"6!7$1*'*0!8$($.$9'.$/-!")':!

ABSTRACT
Cracking in portland cement concrete pavements and bridge decks causes
many problems including reduced stiffness which leads to greater deflections and
additional cracking. Water and chlorides are able to penetrate cracks resulting in
freeze-thaw deterioration and corrosion of reinforcement.
Several methods of repairing cracks were investigated in the study. One
method consisted of using polymer concrete in enlarged cracks in pavements. The
cracks were enlarged with a crack cutter. Sand was placed in the crack and saturated
with monomer to forn a strong polymer concrete which bonded well to the portland
cement concrete. Evaluations of many miles of repaired cracks on I 610 indicate very
good performance. The disadvantage of the method is the length of time required to
enlarge the cracks.
Epoxy injection w'as investigated in the laboratory using different crack widths
and three different ambient temperatures in cracked slabs. The slabs were recracked
to determine recracking strength and location of the second crack. For the epoxy
used, the recracking strength was good for 70 degrees F and higher; the results at 40
degrees F reflected the slow curing of the epoxy. Generally epoxy injection provided a
good bond but crack preparation was found to be very important. Limited field tests
we re co nducted.
High molecular weight methacrylate monomer systems (HMWM) were
investigated for brushing on the surface of cracked concrete. The monomer filled the
cracks in dry laboratory slabs to 95 percent of the crack length for cracks as narrow as
0.2 mm. Moisture in the crack reduced the penetration but more than adequate filling
, was observed. Recracking strength was good. Some success was achieved with
spraying cracked concrete overhead.
Numerous field studies were performed, mostly with HMWM. Good results were
obtained except in the cases where the cracks were filled with debris.
vii

!!!!!!!!!!!!!!!!!!!"#$%!&'()!*)&+',)%!'-!$-.)-.$/-'++0!1+'-2!&'()!$-!.#)!/*$($-'+3!
44!5"6!7$1*'*0!8$($.$9'.$/-!")':!

SUMMARY
Research was conducted to indentify improved methods for sealing cracks in
portland cement concrete bridge decks and pavements. The use of polymer concrete
in pavement cracks enlarged with a crack cutter proved to be effective although the
method is labor intensive. The method has been used extensively on I 610 with good
results. Epoxy injection was tested in the laboratory with crack width and temperature
as the variables. Good results were obtained for recracking strength and filling cracks
except at low temperature. Limited field studies were performed. The use of high
molecular weight methacrylate monomers proved successful in laboratory tests with
cracked concrete with variable crack widths and variable moisture. Field tests were
successful except when cracks were filled with debris.
ix

!!!!!!!!!!!!!!!!!!!"#$%!&'()!*)&+',)%!'-!$-.)-.$/-'++0!1+'-2!&'()!$-!.#)!/*$($-'+3!
44!5"6!7$1*'*0!8$($.$9'.$/-!")':!

IMPLEMENTATION STATEMENT
The methods for repairing cracks that were investigated in this study have
already been implemented. Many miles of the polymer concrete-filled enlarged cracks
have been successfully used on 1610. Epoxy injection has been used in limited cases
where cracks are small and where restoration of structural integrity is essential. The
use of high molecular weight methacrylate monomer has been used successfully on
several bridge decks in Texas. The simplicity of application and the low relative cost
make it a viable repair method.
xi

!!!!!!!!!!!!!!!!!!!"#$%!&'()!*)&+',)%!'-!$-.)-.$/-'++0!1+'-2!&'()!$-!.#)!/*$($-'+3!
44!5"6!7$1*'*0!8$($.$9'.$/-!")':!
TABLE OF CONTENTS
PREFACE....................................................................................................................... iii
LIST OF REPORTS ...................................................................................................... v
ABSTRACT .......................................................................................... ............. ............. vii
SUMMARy..................................................................................................................... ix
IMPLEMENTATION STATEMENT............................................................................. xi
CHAPTER 1. INTRODUCTION
1.1 Background ........................................................................................... 1
1 .2 Scope of Study.................................... ........ ......................................... 1
CHAPTER 2. POLYMER CONCRETE·FILLED CRACKS
2.1 Introduction ............................................................................................ 3
2.2 Repair Procedures ............................................................................... 3
2.3 Performance of Repair......................................................................... 8
2.4 Cost......................................................................................................... 9
CHAPTER 3. LABORATORY INVESTIGATION OF CRACK REPAIR WITH
EPOXY INJECTION
3.1 Introduction ............................................................................................ 11
3.2 Materials and Preparation .................................................................. 11
3.2.1 Concrete Specimens ............................................................... 11
3.2.1.1 Material ........................................................................ 11
xiii
xiv
3.2.1.2 Size......................................................................... 12
3.2.1.3 Preparation............................................ ................ 1 2
3.2.2 Epoxy.......................... .............................. ............................. 13
3.3 Testing Procedure .............................................................................. 13
3.4 Results .................................................................................................. 15
3.4.1 Recracking Strength............................................................ 15
3.4.2 Percentage of Crack Length Filled................................... 22
3.5 Summary .............................................................................................. 22
CHAPTER 4. LABORATORY INVESTIGATION OF CRACK REPAIR
WITH MONOMER
4.1 Introduction .......................................................................................... 29
4.2 Initial Investigation .............................................................................. 30
4.2.1 Materials and Preparation.................................................. 30
4.2.1.1 Concrete Specimens........................................... 30
4.2.1.2 Monomers.............................................................. 31
4.2.1.3 Application of Monomer....................................... 32
4.2.2 Percentage of Crack Length Filled................................... 33
4.2.2.1 Test Procedure...................................................... 33
4.2.2.2 Results......................... ...... ........................ ............. 33
4.2.3 Recracking Strength and Crack Location........................ 36
4.2.3.1 Test Procedure...................................................... 36
4.2.3.2 Results.................................................................... 36
4.2.4 Effect of Moisture.................................................................. 46
4.2.4.1 Test Procedure...................................................... 47
4.2.4.2 Results......................... ...................... ...... ............... 48
4.2.5 Spray Application................................................................. 49
4.2.5.1 Test Procedure...................................................... 49
4.2.5.2 Results. .......................... .................... ................ ..... 52
4.3 Additional Laboratory Tests Using Monomer 1100 .................... 53
4.3.1 Materials and Preparation ................................................. 53

xv
4.3.1.1 Concrete Specimens........................................... 53
4.3.1.2 Monomer................................................................ 53
4.3.1.3 Application of Monomer....................................... 54
4.3.2 Effect of Crack Width ........................................................... 54
4.3.2.1 Test Procedures.................................................... 54
4.3.2.2 Results.................................................................... 54
4.3.3 Recracking Strength ........................................................... 55
4.3.3.1 Testing Procedure................................................ 55
4.3.3.1 Results................................. ................................... 55
4.3.4 Effect of Moisture ................................................................. 62
4.3.4.1 Test Procedure...................................................... 62
4.3.4.2 Results......................................... .... ....................... 62
4.3.5 Spray Application ................................................................ 65
4.4 Summary of Laboratory Study........................................................ 65
CHAPTER 5. CRACK REPAIR FIELD STUDIES
5.1 Introduction .......................................................................................... 67
5.2 Repair Procedures ............................................................................. 67
5.3 Field Tests ............................................................................................ 67
5.3.1 McLean, Texas Field Study................................................ 67
5.3.1.1 Introduction............................................................ 67
5.3.1.2 Monomer Application........................................... 68
5.3.1.3 Results of Monomer Application........................ 68
5.3.1.4 Epoxy Injection...................................................... 71
5.3.1.5 Epoxy Results........................................................ 75
5.3.1.6 Conclusions........................................................... 75
5.3.2 Fort Worth, Texas Field Study............................................ 75
5.3.2.1 Introduction............................................................ 75
5.3.2.2 Monomer Application........................................... 75
5.3.2.3 Epoxy Injection...................................................... 76
5.3.2 4 Results.................................................................... 79

xvi
5.3.2.5 Conclusions........................................................... 79
5.3.3 Corpus Christi, Texas Field Study.................................... 83
5.3.3.1 Introduction............................................................ 83
5.3.3.2 Monomer Application........................................... 83
5.3.3.3 Results.................................................................... 83
5.3.3.4 Conclusions........................................................... 85
5.3.4 Monahans, Texas Field Study........................................... 85
5.3.4.1 Introduction............................................................ 85
5.3.4.2 Application of MateriaL.......... ...................... ........ 90
5.3.4.3 Results.................................................................... 93
5.3.4.4 Conclusions........................................................... 96
5.3.5 Swe,etwater, Texas Field Study......................................... 96
5.3.5.1 Introduction............................................................ 96
5.3.5.2 Application of MateriaL........................................ 96
5.3.5.3 Results........................... .......................... ............... 98
5.3.5.4 Conclusions........................................................... 98
5.4 Cost ....................................................................................................... 98
5.5 Safety..... ................................................ ............ ...................... ............. 99
CHAPTER 6. CONCLUSIONS AND RECOMMENDATIONS
6.1 Conclusions ......................................................................................... 101
6.2 Recommendations ............................................................................. 102
6.2.1 Polymer Concrete Crack Repairs...................................... 102
6.2.2 Epoxy Injection..................................................................... 102
6.2.3 High Molecular Weight Monomer Application................ 103
REFERENCES ....................................................................................................... 106
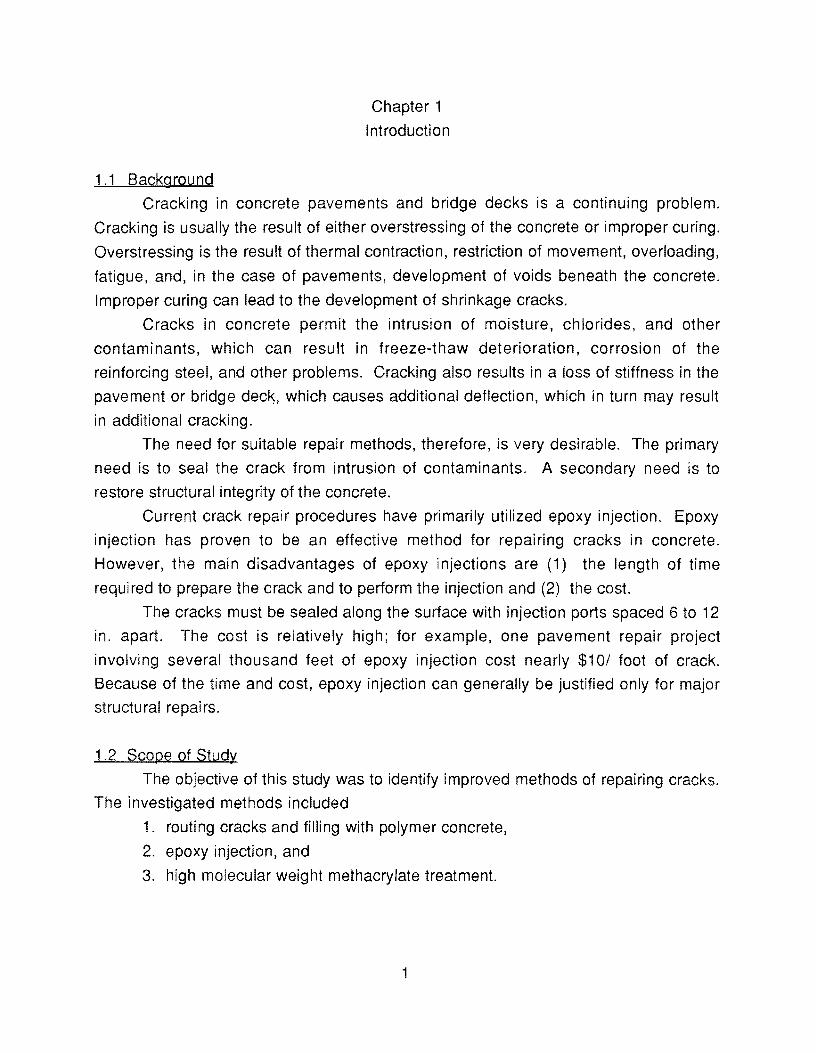
1.1 Background
Chapter 1
Introduction
Cracking in concrete pavements and bridge decks is a continuing problem.
Cracking is usually the result of either overstressing of the concrete or improper curing.
Overstressing is the result of thermal contraction, restriction of movement, overloading,
fatigue, and, in the case of pavements, development of voids beneath the concrete.
Improper curing can lead to the development of shrinkage cracks.
Cracks in concrete permit the intrusion of moisture, chlorides, and other
contaminants, which can result in freeze-thaw deterioration, corrosion of the
reinforcing steel, and other problems. Cracking also results in a loss of stiffness in the
pavement or bridge deck. which causes additional deflection, which in turn may result
in additional cracking.
The need for suitable repair methods, therefore, is very desirable. The primary
need is to seal the crack from intrusion of contaminants. A secondary need is to
restore structural integrity of the concrete.
Current crack repair procedures have primarily utilized epoxy injection. Epoxy
injection has proven to be an effective method for repairing cracks in concrete.
However, the main disadvantages of epoxy injections are (1) the length of time
requi red to prepare the crack and to perform the injection and (2) the cost.
The cracks must be sealed along the surface with injection ports spaced 6 to 12
in. apart. The cost is relatively high; for example, one pavement repair project
involving several thousand feet of epoxy injection cost nearly $101 foot of crack.
Because of the time and cost, epoxy injection can generally be justified only for major
structural repairs.
1.2 Scope of Study
The objective of this study was to identify improved methods of repairing cracks.
The investigated methods included
1. routing cracks and filling with polymer concrete,
2. epoxy injection, and
3. high molecular weight methacrylate treatment.
1

!!!!!!!!!!!!!!!!!!!"#$%!&'()!*)&+',)%!'-!$-.)-.$/-'++0!1+'-2!&'()!$-!.#)!/*$($-'+3!
44!5"6!7$1*'*0!8$($.$9'.$/-!")':!

Chapter 2
Filling Cracks With Polymer Concrete
2.1 Introduction In 1980 researchers at the Center for Transportation Research (CTR) assisted
the Urban District (now part of District 12) in developing a repair procedure for the
extensive longitudinal cracking that was present on 1-610 in Houston (Fig. 2.1). From
numerous cores which had been taken, it had been found that the cracks always
occurred above longitudinal bars, apparently because of poor consolidation of the
concrete below the reinforcing steel. The objective was to seal the cracks to prevent
water intrusion into the crack. Although the field work was not performed as part of this
investigation, the method is within the scope of the study objectives. The procedures.
performance, and cost are discussed.
2.2 Repair Procedures
The procedures developed for the repair of the longitudinal cracks involved
enlarging the crack to permit the placement of polymer concrete. Polymer concrete
(PC) consisting of aggregate with a polymer binder had been previously investigated
and reported for the repair of portland cement concrete (1-4). PC develops very good
bond to portland cement concrete.
Several methods for enlarging the crack were investigated. Sawing was not
feasible for following the irregular cracks. High pressure water jetting was not feasible
since polymer concrete does not bond well to wet surfaces and it would have been
necessary to permit the cracks to dry before placing the PC.
A single-piston pneumatic crack router was selected as the best available piece
of equipment to enlarge the cracks (Fig. 2.2). The bit usually has a 0.75-in. diameter,
and the crack is usually enlarged to a width of one in. in a single pass (Fig. 2.3). The
depth is variable, but is usually one to two in. (Fig. 2.4)
The polymer concrete is placed by filling the enlarged crack with clean dry
concrete sand and pouring methyl methacrylate (MMA) monomer system over the
sand until it is completely saturated.
3

4
Fig. 2.1 Crack router in operation

5
Fi g. 2.2 Enlarge cracks

6
Polymer concrete
, '. /} '. b,
1;>- •
, . t> I
Concrete pavement
Reinforcing steel
Area of poor , consoli dation
D
p
'"
Fig. 2.3 Cross-section of repaired crack
, Il
A

7
Fig. 2.4 Pouring monomer over sand

8
The monomer system consists of 95 percent MMA and 5 percent trimethylol
propane trimethacrylate (TMPTMA). Benzoyl peroxide (BzP) initiatior, in dispersion
form, is added at a level of about one percent (2.5 percent for 40 percent dispersion)
and a promoter, dimethyl-para-toluidine (DMPT), is added at a level of 0.5 percent,
both by weight of the MMA system. The levels of BzP and DMPT are dependent upon
the ambient temperature (3).
It is essential that monomer be reapplied to keep the sand saturated since
Monomer is lost due to evaporation and due to leakage in the crack at the bottom of
the enlarged crack.
In some repairs silicone caulking was used to seal the crack below the PC to
minimize monomer loss. In other repairs polymethyl methacrylate (PMMA) powder
was mixed with the sand before it was placed in the crack. PMMA powder acts as a
thickner and prevents leakage of the monomer.
Most repairs, however, have been made without the silicone sealant or PMMA
powder. The objective has been to have monomer penetrate into the crack and bond
the concrete.
2.3 Performance of Repair
Over 100,000 linear feet of pavement cracks on 1-610 have been repaired by
enlarging them and filling them with polymer concrete. Generally the repairs have
performed very well.
In 1981, approximately one year after the first crack repairs were made on the
West Loop (I 610), a visual examination was made by district and eTR personnel. Of
the 14,066 feet of repaired cracks, 55.8 percent were found to be in good condition,
43.2 percent in fair condition, and only one percent in poor condition.
Generally the repairs rated fair or poor showed evidence of wear on the surface,
apparently due to evaporation of monomer from the surface or depletion of the
monomer caused by leakage into the crack below the enlarged crack.When a portion
of the West Loop was scarified in preparation for placement of bonded portland
cement concrete overlays, many of the repaired cracks could easily be observed. In
nearly every case, the repairs appeared to be very sound, with the bond to each face
of the concrete still intact.
9
An inspection of repaired cracks on the South Loop (1-610) in 1985 on repairs
made approximately two years earlier, indicated that 80 to 90 percent were in good
condition. In a few cases continued lateral movement of the pavement caused
longitudinal cracks to reopen either in the repaired areas or adjacent to them. Some
wear was observed in a few repaired cracks, probably due to the reasons observed on
the West Loop.
2.4 Cost
All of the repairs on I 610 have been performed under contract by several
contractors. The cost of the crack repairs has ranged from $6 1ft. to $8 1ft.
The repair process is labor intensive. The crack routing is performed at the rate
of 25 ft.lhr. The bits must be sharpened or replaced every 175 ft. The sand and
monomer are placed manually and the sand must be rewetted several times to
maintain a saturated condition. To make the repair procedure more economical, two
improvements are needed: (1) a more rapid procedure for enlarging the cracks and (2)
a less labor-intensive method for filling the crack with polymer concrete.

!!!!!!!!!!!!!!!!!!!"#$%!&'()!*)&+',)%!'-!$-.)-.$/-'++0!1+'-2!&'()!$-!.#)!/*$($-'+3!
44!5"6!7$1*'*0!8$($.$9'.$/-!")':!

Chapter 3
Laboratory Investigation of
Crack Repair With Epoxy Injection
3.1 Introductjon
Epoxy injection has been used for many years to make structural repairs in
cracked concrete. The procedures have been well developed over the years for many
applications (5).
Epoxies used for injection are usually considerably more viscous than the
monomers used in this study. They have to be injected under considerable pressure,
usually 25 psi or more .. Epoxy injection has been found to be particularly effective for
deep, narrow cracks; cracks which are wet or filled with water; cracks containing
debris; and cracks which must be bonded to produce a structural repair. It should be
emphasized, however, that the proper epoxy and the proper techniques must be
utilized to insure a sound repair.
The disadvantages to epoxy injection are length of time required to make
repairs and the cost. The cost reflects the labor intensiveness of the process. For
some types of repairs, it is the only viable repair method, however. A limited laboratory
investigation was made on the crack sealing and bonding characteristics of epoxy
injection (6). This chapter describes the test program and summarizes the results.
3.2 Materials and Preparation
3.2.1 Concrete Specimens
3.2.1 ,1 Material
The concrete mix used throughout the testing program, expressed
as percentage by weight, was cement, 22 percent; sand, 38 percent;
coarse, 30 percent; and water, 10 percent. 80th ASTM Type I and ASTM
Type III cements were used. Type III high-early strength cement was
used at times to decrease the time required between the concrete pour
and initial cracking. A minimum of seven days curing was used when
Type III cement was used and 28 days when Type I was used. 80th the
11

12
natural sand and the coarse aggregate used in the mix were from the
Colorado River near Austin, Texas.
3.2.1.2 Size
A number of requirements had to be considered when determining
the dimensions of the concrete specimens to be used in the testing
program. First, and probably most important, the thickness of the
specimen had to be large enough to allow simulation of the crack depths
experienced in the field. Next, the length of the specimen between the
points of load application had to be large enough for the specimen to
crack in flexure rather than in shear. Finally, the width of the specimen
had to be large enough to approach the length of the cracks experienced
in the field. As a result of these considerations, specimen dimensions of
12 in. wide x 5-1/2 in. thick x 14 in. long (30 cm x 14 cm x 36 cm) were
selected. However, the manufacturer of the epoxy used in the study
suggests that the distance between injection ports be limited to between
4 and 8 inches (10 cm and 20 cm). Therefore, the width of the specimen
was decreased to 7 inches (18 cm).
3.2.1.3 Preparation Four strands of 10-gauge wire were placed in each specimen so
that the specimen would not break apart when cracked. These strands of
wire ran along the 14-in. (36-cm) length of the specimens and were
evenly spaced along its 12-in. (30-cm) width. The concrete specimens were cracked by center point loading to
produce different crack widths. After they were cracked, a polyester putty
was placed over the sides of the specimens along the crack depth. This
putty, when cured, restricted the flow of the crack sealant out of the side
of the crack during the epoxy injection process.

13
3.2.2 Epoxy
Niklepoxy Concrete Injection Resin #3, which is produced by Rocky Mountain
Chemical Company, was used in the epoxy injection tests. This low viscosity epoxy is
supplied as a two-component system. It is designed to restore complete structural
integrity of the cracked concrete. Niklepoxy Injection Resin is 100 percent solids and
conforms to ASTM C881 Type 1 Grade 1.
3.3 Testing Procedure
Tests were performed at three temperatures: 40 degrees F, 70 degrees F, and
100 degrees F. The specimens were divided into three crack width categories: small
(0.008 to 0.02 in.) (0.2 to 0.6 mm); medium (0.03 to 0.04 in.) (0.7 to 1.1 mm); and large
(0.05 to 0.08 in.) (1.2 to 2.0 mm).
In each test the specimens were first saturated with water. They were then
allowed to dry for periods of 12 hours, one day, and two days. Some specimens were
injected immediately after being saturated with water. The drying took place at the
designated temperatures so that the temperature of the specimens would correspond
to the recorded ambient temperature of the test. The zero drying time specimens were
placed under their respective testing temperatures 12 hours before injection and then
filled with water immediately before injection.
Two types of injection ports were used in this experiment. The epoxy
manufacturer suggests that drilled ports be used with cracks with widths smaller than
0.015 in. (0.034 mm). Therefore, these drilled ports were used for all of the small
cracks (0.2 to 0.6 mm). The placement of these ports was accomplished by first drilling
a hole at the ends of the crack with a hollow core drill bit. A vacuum-attached swivel
drill chuck was used in the drilling process in order to assure that the concrete dust
from the drilling did not clog the crack. The drilled ports were then placed in the hole
and recessed 1/2 in. A small reservoir below the port was provided in order to aid in
the resin flow. A further description and photographs of these ports may be seen in
Section 5.3.1, which describes the McLean, Texas, field study.
Surface ports were used for all medium (0.7 to 1.1 mm) and large (1.2 to 2.0
mm) cracks. These ports were placed directly over the surface of the crack and held in
14
place by placing polyester putty over their attached tabs. These ports are also further
described in the McLean field study.
Putty was placed over the entire length of the crack after the ports were in place
in order to prevent the epoxy from flowing out of the crack. This step in the injection
preparation process is very important. If the putty is not applied properly, the epoxy
will leak out of the crack, thus making the pressure injection impossible.
In the 40 degrees F tests, specimens were dried in a cooler which was set at 49
degrees F. The average relative humidity in the cooler was measured to be 65
percent. The surface temperature of the blocks at the time of injection was 42 degrees
F. The time required for the injections in this test varied from less than one minute for
large cracks (1.2 to 2.0 mm) to up to 10 minutes for the small cracks (0.2 to 0.6 mm).
The epoxy was allowed to cure for two days before the specimens were removed and
cut.
The 70 degrees F tests were performed in the lab at an average temperautre of
72 degrees F and a realtive humidity of about 50 percent. The epoxy was allowed to
cure for 24 hours before the specimens were cut.
The 100 degrees F tests were performed in a temperature chamber which
maintained this temperature throughout the experiment. The relative humidity inside
the chamber was 25 percent. The specimens remained in this chamber 24 hours
following the injection, before they were removed and cut.
After the specimens were removed from the temperature chambers they were
cut lengthwise, perpendicular to the direction of the crack. The resulting segments of
the original specimen had widths of 3 and 4 in. The 3-in.-wide segment was further
sliced across the crack. The percentage of the crack filled by the epoxy was
determined from these samples.
The 4-in.-wide portion of the original specimen was recracked under the center
point loading conditions that were used for the initial cracking. The recracking stress
was then calculated and compared with the initial cracking stress.

15
3.4 Results 3.4.1 Recracking Strength
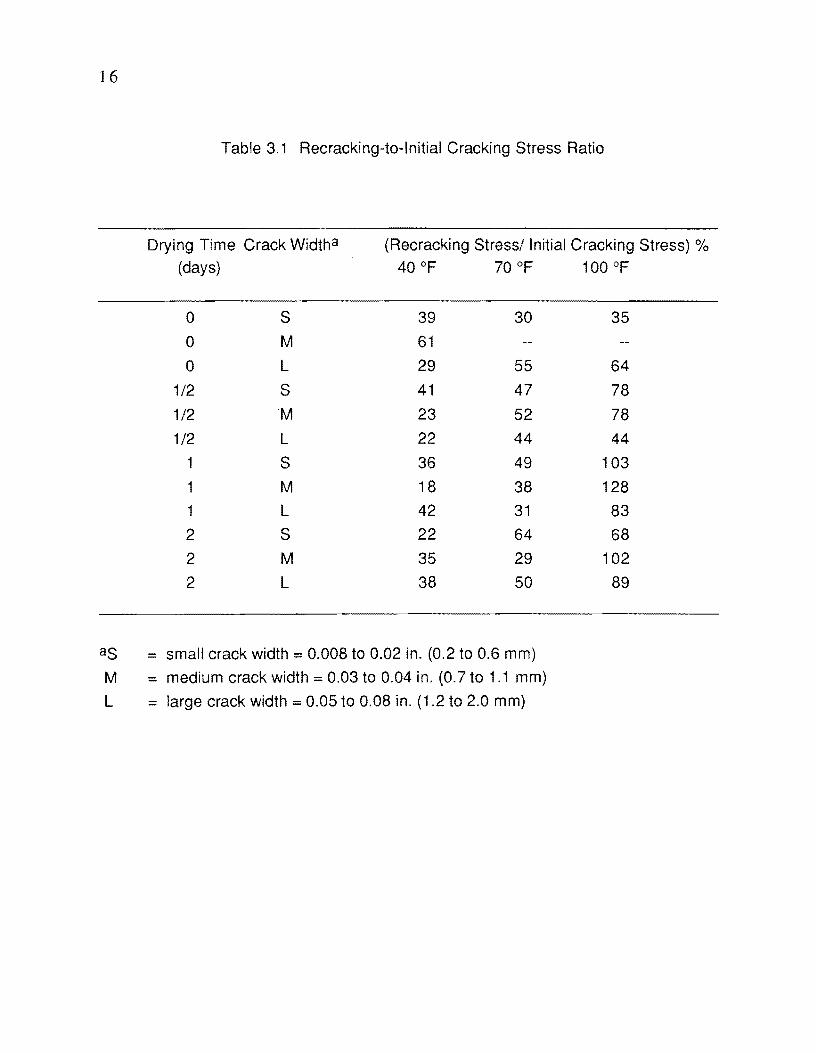
Table 3.1 and Figs. 3.1 through 3.3 show the relationship between the ratio of
recracking to initial cracking stress and drying time for the various temperatures. In
general, for the tests performed at 40 degrees F, the ratio fell within the range of 0.2 to
0.4. For the 70 degrees F tests, the range for this stress ratio rose to a range of
between 0.3 to 0.5. And for the tests performed at 100 degrees F, the ratio of
recracking to original cracking stress rose to a range of between 0.4 and 1.0. This
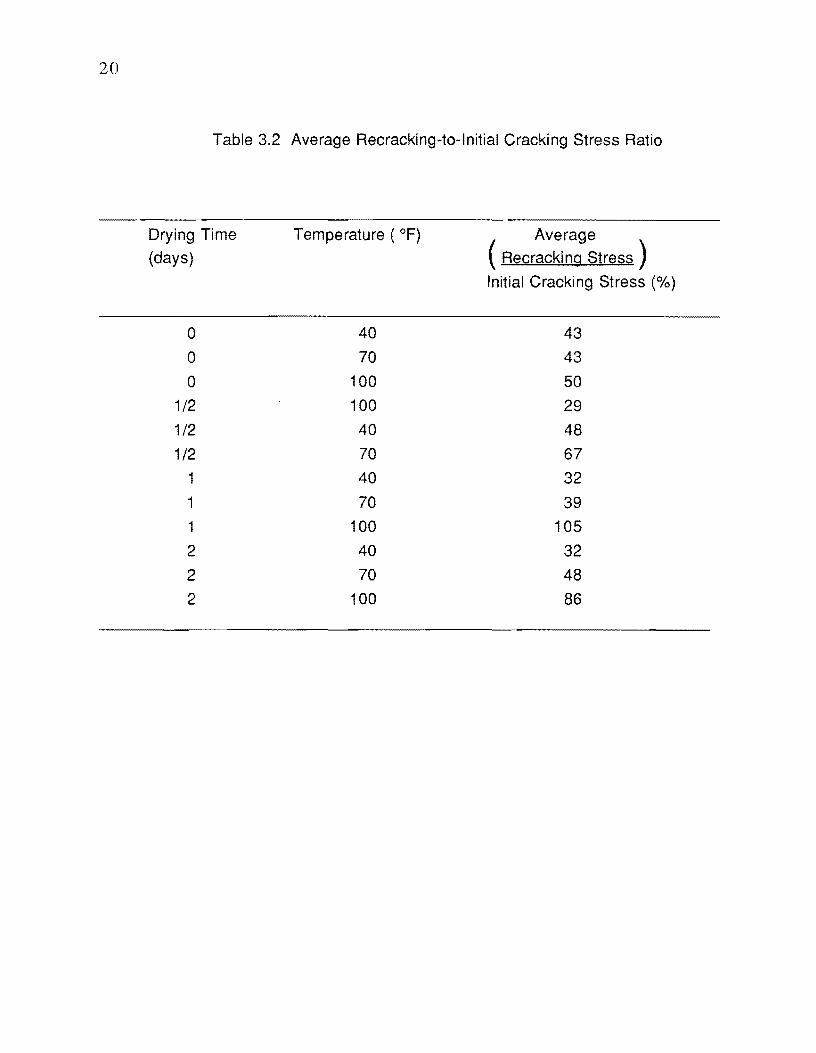
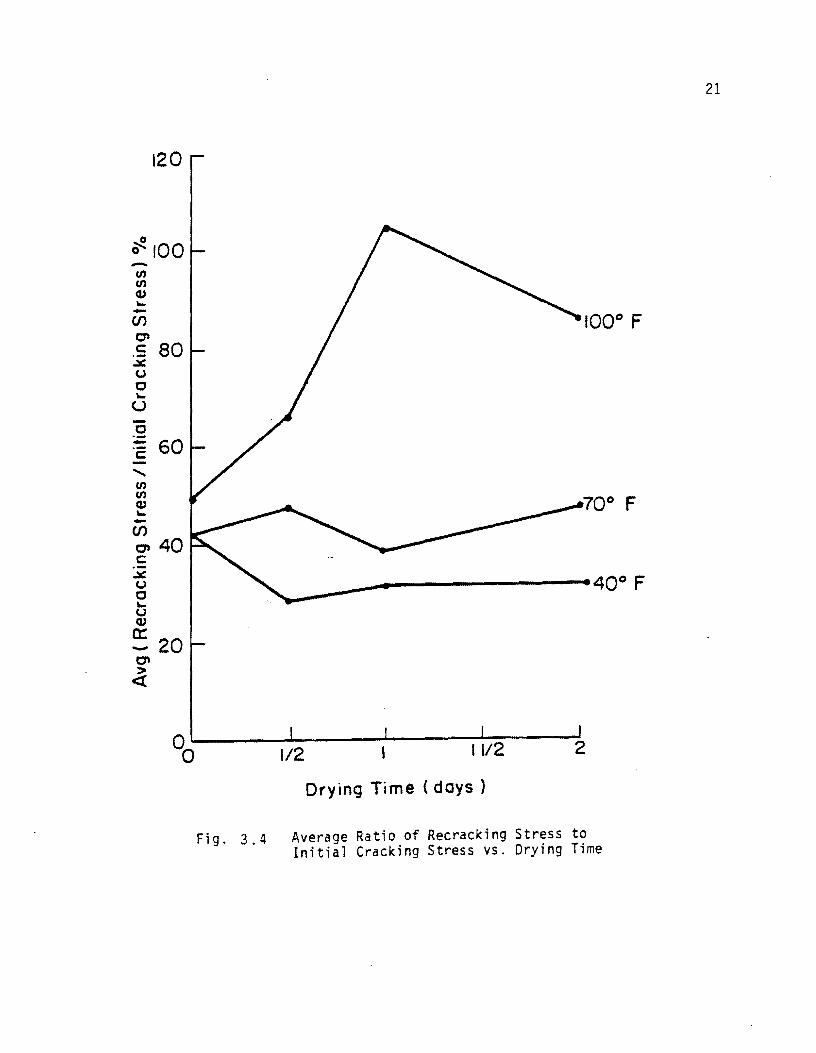
general rise in recracking strength with increased temperature is shown in Table 3.2
and Fig. 3.4, in which the recracking stress to original cracking stress values for the
small, medium, and large crack widths were averaged for each drying time and
temperature.
Although there was a general increase in recracking strength with
corresponding increases in temperature at application, no trend was recognizable
concerning the effects of changes in moisture and crack width. The recracking
strength-to-original cracking strength ratio generally fell within a given range for a
particular temperature, regardless of the crack width or the drying time.
16
Table 3.1 Recracking-to-Initial Cracking Stress Ratio
Drying Time Crack Widtha (Recracking Stress/ Initial Cracking Stress) %
(days) 40 of 70 of 100 of
0 S 39 30 35
0 M 61
0 L 29 55 64
1/2 S 41 47 78
1/2 'M 23 52 78
1/2 L 22 44 44
1 S 36 49 103
1 M 18 38 128
1 L 42 31 83
2 S 22 64 68
2 M 35 29 102
2 L 38 50 89
as = small crack width = 0.008 to 0.02 in. (0.2 to 0.6 mm)
M = medium crack width = 0.03 to 0.04 in. (0.7 to 1.1 mm)
L = large crack width = 0.05 to 0.08 in. (1.2 to 2.0 mm)

100
-U')
~ .!: 80 CJ)
C'I C
.::I! (J
C "-
U
:§ := c
......... U') U')
----~------~ 40a-.-~-'''''''''''' - L
M CJ)
C'I C
.::I! (J
C
U 20 (1)
a::: -112 \112
Drying Time (days)
Legend: S=Small Crack tiidth (D.2 to D.6mm) M=Medium Crack Width (D.7 to 1.lmm) L=Large Crack ~lidth (1.2 to 2.Dmm)
Fig. 3.1 Ratio of Recracking Stress to Initial o Cracking Stress vs. Drying Time at 4D F
17

18
~ 0 -(/) (/) C1J '--en 0'1 c:: .--" u 0 '-u -0 ~ c::
....... (/) (/)
C1J '--en 0'1 c:: -" u 0 '-u C1J a: -
100
80
60
40
20
-------------------
112 11/2
Drying Time (days)
Le~end: S= mall Crack Width (0.2 to 0.6mm) M=Medium Crack Width (0.7 to 1.lmm) L=Large Crack Width (1.2 to 2.0mrn)
Fig. 3.2 Ratio of Recracking Stress to Initial o Cracking Stress vs. Drying Time at 70 F

120
100
-(/l (/l
~ 80 (f)
:¥ u c '-
u 60 c :.;:: '2 ....... (/l (/l
~ 40 -(f)
C'I c::
.::J!:. U c ::;.20 cu a::: -
M
s
------------ .... ~--
o o 1/2 11/2
Drying Time (days)
Legend: S=Small Crack Width (0.2 to 0.6mm) M=Medium Crack Width {O.7 to l.lmm} L=Large Crack Width (1.2 to 2.0mm)
Fig. 3,3 Ratio of Recracking Stress to Initial 0 Cracking Stress vs. Drying Time at 100 F
19
20
Table 3.2 Average Recracking-to-Initial Cracking Stress Ratio
Drying Time Temperature ( OF) Average
(days) ( Recracking Stress)
Initial Cracking Stress (%)
0 40 43
0 70 43
0 100 50
1/2 100 29
1/2 40 48
1/2 70 67
1 40 32
1 70 39
1 100 105
2 40 32
2 70 48
2 100 86
120
0 ~IOO -f/) f/) (IJ "--CJ)
0' C 80 .-
..:w::: u 0 "-u .2 - 60 '2 ..... f/) f/) (IJ "--CJ)
0' 40 c
..:w::: u 0 "-u (IJ
ex:: 20 -0'
> <t
1000 F
400 F
1/2 11/2 2
Drying Time (days)
Fig. 3,4 Average Ratio of Recracking Stress to Initial Cracking Stress vs. Drying Time
21

22
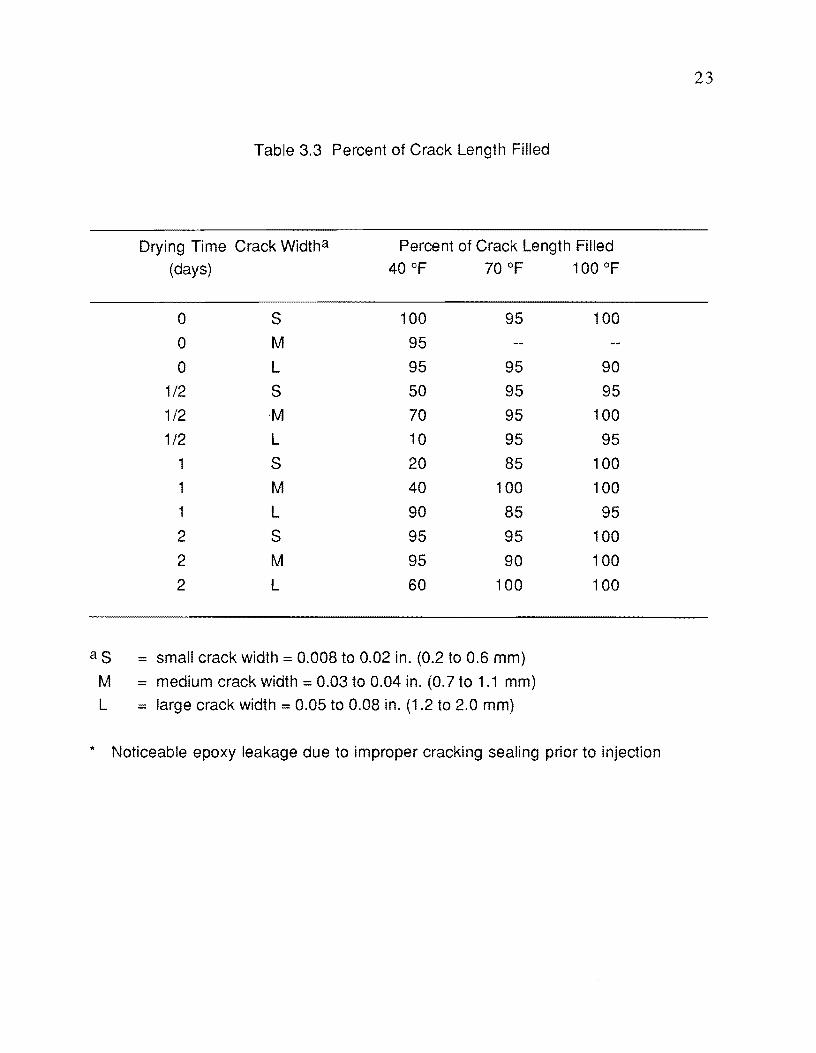
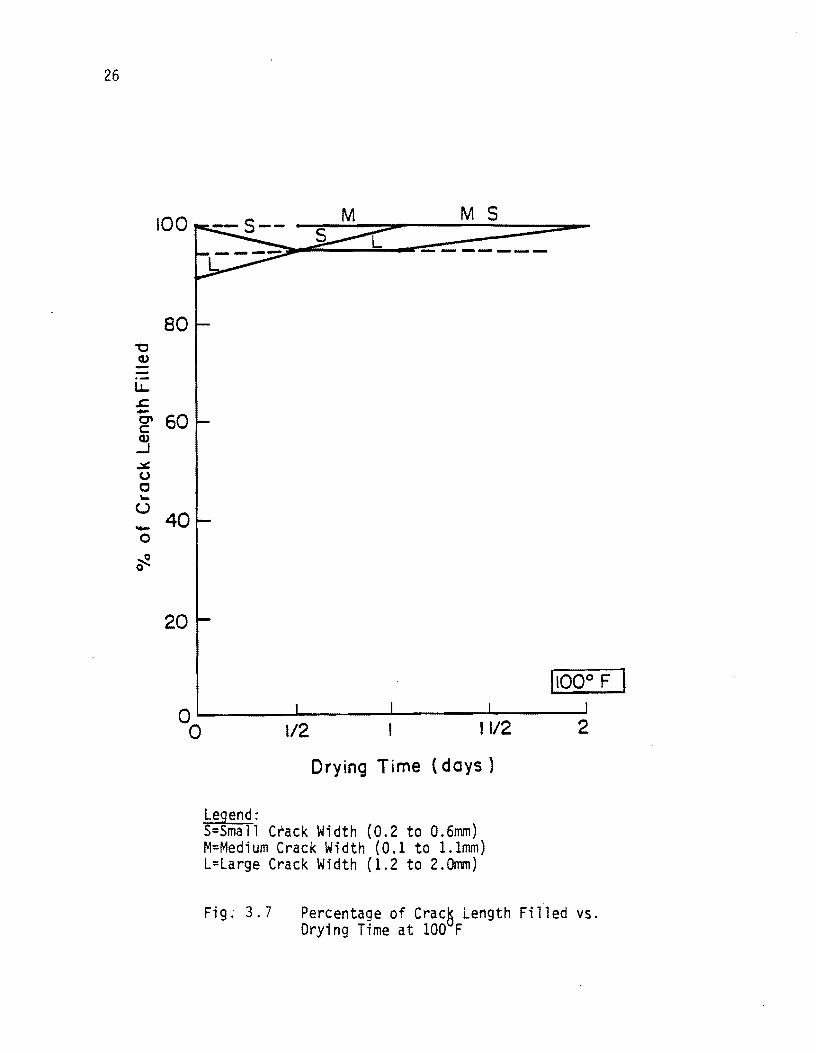
3.4,2 Percentage of Crack Length Fjlled
The percentage of the crack length filled for each specimen is recorded in Table
3.3 and plotted in Figs. 3.5 through 3.7. In general, when the specimens were
prepared properly, between 95 and 100 percent of the total crack length was filled by
the epoxy. However, as can be seen in Fig. 3.5, proper preparation is critical. The
decrease in percentage filled shown in Fig. 3.5 was due to insufficient sealing of the
crack with putty around the injection port or underneath the specimen if the crack
extended through its depth. This allowed the epoxy to escape from the crack during
the injection, either from around the injection port or from underneath the specimen.
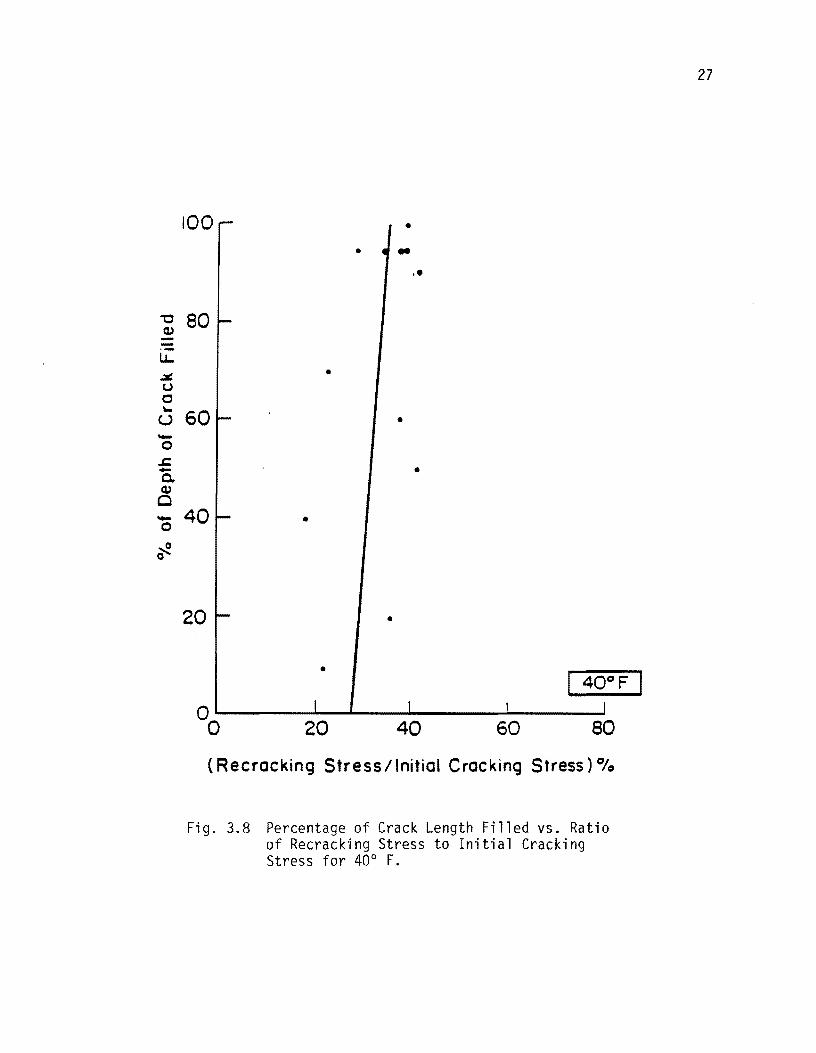
Initially, it was thought that the lower filling percentage values were responsible
for the low recracking values of the 40 degrees F test. However, as shown in Fig. 3.8,
the recracking-to-initial-cracking stress ratio decreased only slightly with decreases in
percentage of the crack depth filled. These decreases were probably due to
incomplete curing of the epoxy at low temperatures. The epoxy in the 40 degrees F
specimens was still tacky when they were cut.
3.5 Summary
These tests would suggest that the epoxy will generally fill a crack almost
entirely, regardless of its width and whether or not it is wet. As was observed during
these tests, the epoxy displaced any water present within the crack when it was
injected. When a great deal of water was present in the specimens, it would flow out of
the injection port first, followed by the epoxy. However, the success of the injection
depends greatly on proper preparation of the crack.
as M L
Table 3.3 Percent of Crack Length Filled
Drying Time Crack Widtha Percent of Crack Length Filled
= = =
(days) 40 of 70 of
0 S 100 95
0 M 95
0 L 95 95
1/2 S 50 95
1/2 ·M 70 95
1/2 L 10 95
1 S 20 85
1 M 40 100
1 L 90 85
2 S 95 95
2 M 95 90
2 L 60 100
small crack width = 0.008 to 0.02 in. (0.2 to 0.6 mm)
medium crack width = 0.03 to 0.04 in. (0.7 to 1.1 mm)
large crack width = 0.05 to 0.08 in. (1.2 to 2.0 mm)
100 of
100
90
95
100
95
100
100
95
100
100
100
.. Noticeable epoxy leakage due to improper cracking sealing prior to injection
23

24
100
80 "0 Q.) --
LL. .s::. -C" 60 c: Q.)
...l .::JI! U c .... u
40 -0
~ 0
20
0 0
-----s--------~~------M
------------
-MX
-s
-Mx
.Sx
·Lx I 40°F I
112 11/2 2
Drying Time (days)
Note: x-Imprcper Crack Sealing Preparation Prior to Injection
Lege!1d: S=Small Crack Hidth (0.2 to 0.6 mm) r,t=Med;um Crack Width (0.7 to 1.1mm) L=Large Crack Width (1.2 to 2.0mm)
Fig. 3.5 Percentage of Crask Length Filled vs. Drying Time at 40 F

'0 Q) --
lL.. s::; -C' c: Q)
..J
.;,t. (J
0 '-u -0
~ 0
100
80
60
40
20
700F
°0L-----~----~------~----~2 1/2 11/2
Drying Time (days)
Legend: S=Small Crack Width (0.2 to 0.6mm) M=Medium Crack Width (0.7 to l.lmm) L=Large Crack Width {1.2 to 2.Omm}
Fig. 3.6 Percentage of Cra8k Length Filled vs. Drying Time at 70 F
25
26
"'0 (1.)
I.L. .c -C' c (1.)
..J .::tt:. (,)
C .... () -0
~ 0
100 M S
----- ..... -
80
60
40
20
11000 F 1 °0L-----~------~----~----~2
112 1112
Drying Time (days)
Legend: S=Smal1 Crack Width (0.2 to a.6mm) M=Med;um Crack Width (a.l to l.lmm) L=Large Crack Width (1.2 to 2.amm)
Fi g. 3. 7 Percentage of Crac5 Length Fi 11 ed vs. Drying Time at lOa F
"0 Q.) -.-
I.J.. .:II: U C "-u -0
.t::. -0. Q.)
0 -0
~ 0
100 • • ..
••
80
•
60 •
•
40 •
20 •
•
20 40 60 80
(Recracking Stress/Initial Cracking Stress) 0/0
Fig. 3.8 Percentage of Crack Length Filled vs. Ratio of Recracking Stress to Initial Cracking Stress for 40° F.
27

!!!!!!!!!!!!!!!!!!!"#$%!&'()!*)&+',)%!'-!$-.)-.$/-'++0!1+'-2!&'()!$-!.#)!/*$($-'+3!
44!5"6!7$1*'*0!8$($.$9'.$/-!")':!
4.1 Introduction
Chapter 4
Laboratory Investigation of
Crack Repair with Monomers
Finding a way to use low viscosity monomer to seal cracks in portland cement
concrete has been the objective of CTR researchers for several years. In the 1970s,
several attempts were made to broom MMA monomer into bridge deck cracks. The
Harbor Bridge in Corpus Christi was treated, but cores indicated that none of the
monomer polymerized in the cracks. A bridge deck at an interchange in Dallas
adjacent to the district office developed shrinkage cracks over an area of about 2600
sq. ft. during constructi(~>n. MMA was broomed into the cracks in a small test area.
Cores taken from test area indicated that little polymer was present in the cracks even
though the silicone sealant dikes were placed around some of the cracks to cause
ponding of the MMA. The bridge was eventually repaired using epoxy injection at a
cost of approximately $95,000.
It was theorized that the MMA, which has a viscosity about the same as water,
penetrated the cracks but either leaked out the bottom or into the side walls of the
crack or evaporated. MMA was never found to be a suitable material for the repair of
narrow cracks.
In the 1970s the Rohm and Haas Company developed high molecular weight
methacrylate (HMWM) monomers which had many of the same qualities as MMA: low
viscosity, good mechanical properties when used as a binder for polymer concrete,
and rapid polymerization. In addition, the HMWM has little odor and a significantly
higher flash point than MMA. It was used at first to produce PC overlays.
In November 1981 HMWM was used in an attempt to seal cracks on the lift span
of the Rio Vista Bridge near Sacramento, California. The concrete was worn and
cracked, and during rainy weather the deck absorbed so much water that the counter
weights had to be adjusted so that the span could be lifted properly. HMWM was
mopped onto the surface and allowed to cure. In the five years following, the bridge
has functioned properly without the need to adjust the counter-weights, which
indicates that the bridge was sealed and has remained sealed.
29
30
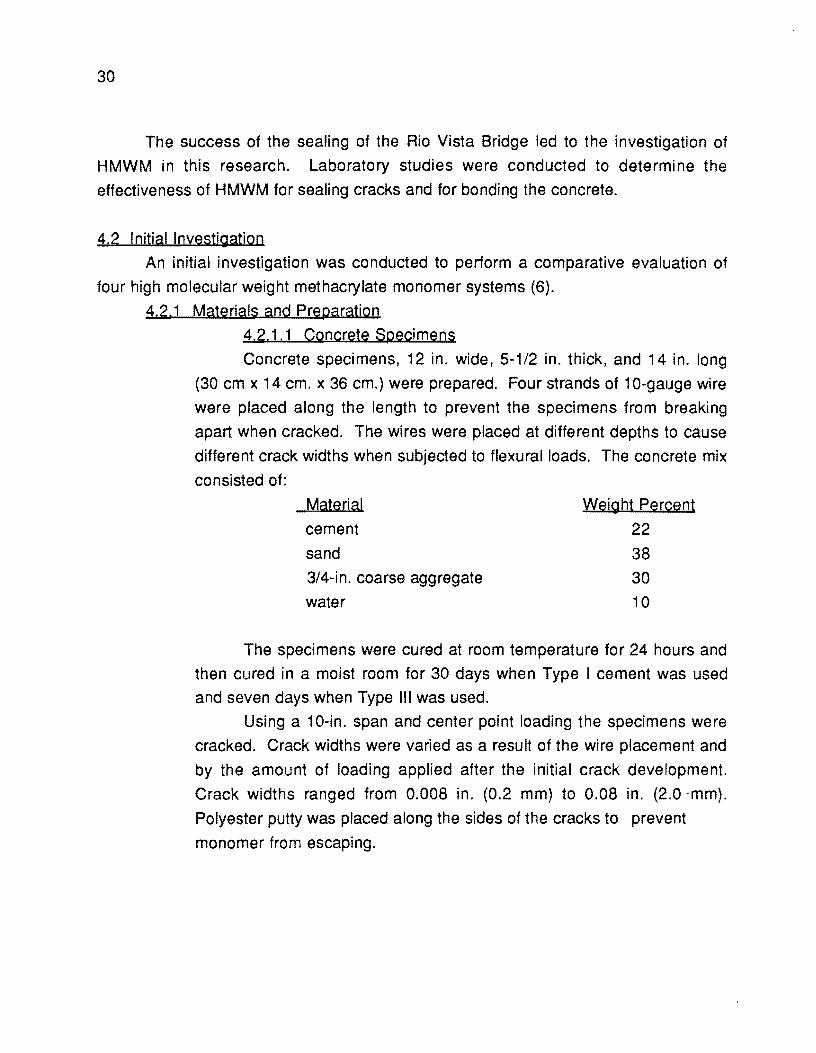
The success of the sealing of the Rio Vista Bridge led to the investigation of
HMWM in this research. Laboratory studies were conducted to determine the
effectiveness of HMWM for sealing cracks and for bonding the concrete.
4.2 Initial Investigation
An initial investigation was conducted to perform a comparative evaluation of
four high molecular weight methacrylate monomer systems (6).
4.2.1 Materials and Preparation
4.2.1.1 Concrete Specimens
Concrete speci mens, 12 in. wide, 5-1/2 in. thick, and 1 4 in. long
(30 cm x 14 cm. x 36 cm.) were prepared. Four strands of 1 O-gauge wire
were placed along the length to prevent the specimens from breaking
apart when cracked. The wires were placed at different depths to cause
different crack widths when subjected to flexural loads. The concrete mix
consisted of:
Material
cement
sand
3/4-in. coarse aggregate
water
Weight Percent
22
38
30
10
The specimens were cured at room temperature for 24 hours and
then cured in a moist room for 30 days when Type I cement was used
and seven days when Type III was used.
Using a 10-in. span and center pOint loading the specimens were
cracked. Crack widths were varied as a result of the wire placement and
by the amount of loading applied after the initial crack development.
Crack widths ranged from 0.008 in. (0.2 mm) to 0.08 in. (2.0 ·mm).
Polyester putty was placed along the sides of the cracks to prevent
monomer from escaping.
31
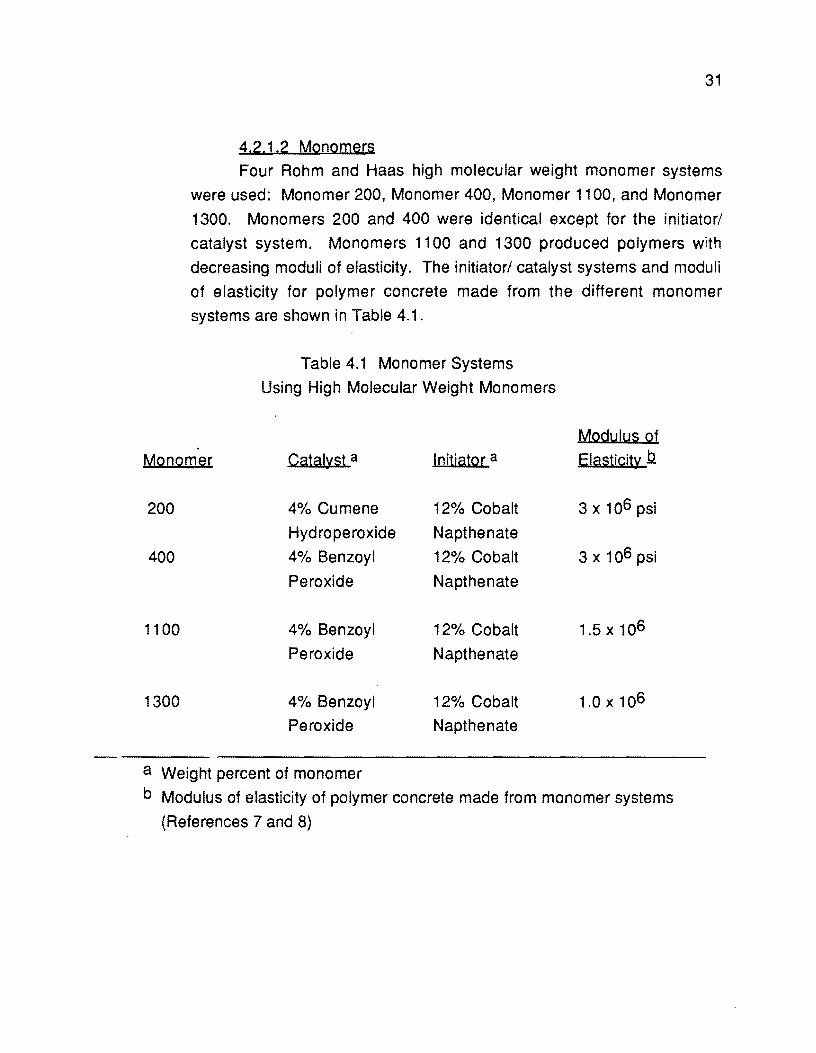
4.2.1.2 Monomers
Four Rohm and Haas high molecular weight monomer systems
were used: Monomer 200, Monomer 400, Monomer 1100, and Monomer
1300. Monomers 200 and 400 were identical except for the initiator/
catalyst system. Monomers 1100 and 1300 produced polymers with
decreasing moduli of elasticity. The initiator/ catalyst systems and moduli
of elasticity for polymer concrete made from the different monomer
systems are shown in Table 4.1.
Table 4.1 Monomer Systems
Using High Molecular Weight Monomers
Monomer Catalyst a Initiator a Modulus of
ElastiCity 12
200 4% Cumene 12% Cobalt 3 x 10⁶ psi
Hydroperoxide Napthenate
400 4% Benzoyl 12% Cobalt 3 x 10⁶ psi
Peroxide Napthenate
1100 4% Benzoyl 12% Cobalt 1.5 x 10⁶
Peroxide Napthenate
1300 4% Benzoyl 12% Cobalt 1.0 x 10⁶
Peroxide Napthenate
a Weight percent of monomer
b Modulus of elasticity of polymer concrete made from monomer systems
(References 7 and 8)

32
It should be noted that during this study the Rohm and Haas
Company reported that some of the monomers had indicated high levels
of toxicity in a laboratory test program. Testing proceeded with caution,
with protective clothing use to mii1imize skin contact with the monomer.
Within the past year, monomers having properties similar to those of the
original monomers but with acceptable levels of toxicity were developed.
4.2.1.3 Application of Monomer
After cracking, the concrete slabs were typically air dried in the
laboratory for a rninimum of 24 hours. The monomer system to be used
was mixed just prior to use and brushed onto the concrete surface until
the crack was filled with monomer. The monomer was permitted to cure
for a minimum of 24 hours before the slabs were recracked.
One specimen was saturated with water prior to the monomer
application in order to give some indication of the effect of water on the
success of the application. The specimen was placed in a wet chamber
for eleven days following its initial cracking. The specimen was prepared
and treated with monomer immediately upon removal from the chamber.
It was totally saturated with water and its crack was entirely full of water
when the monomer was applied. One specimen was filled with the
monomer, outside, at a temperature of over 90 degrees F.
A decrease in cure time with increased temperature had been
noticed in earlier tests. It was thought that the decreased cure time would
inhibit the flow of the monomer into the finer portions of the cracks. The
continual lowering of the surface level of the monomer in the crack
throughout the duration of its cure in earlier tests was believed to be due
to the monomer's penetrating into the finer widths of the cracks prior to its
cure.
After the monomer cured, the specimens were cut lengthwise in
the center of the specimen (perpendicular to the crack). One of the
specimen halves was cut into thin slices perpendicular to the crack to
determine the percentage of crack length filled, and the other half was

33
recracked to determine the load (and stress) required to crack the
specimen and to determine the location of the crack with respect to the
repaired crack.
4.2.2 Percentage of Crack Length Filled
4.2.2.1 Test Procedure
After the monomer had cured, the specimens were sliced
perpendicular to the length of the cracks. Slices of the cracked cross
section were viewed and the percentage of the crack filled by the
monomer was estimated. The monomer almost never terminated at any
single depth. Instead, air pockets usually formed in the monomer,
making the polymer discontinuous along the length of the crack. The
percentage of the crack filled was estimated by dividing the summation of
the lengths of the segments of the depth of the crack filled by the
monomer by the total depth of the crack. The crack widths recorded in
these tests were the widths at the surface of the slab. Since the crack
width and the percentage of the crack which was filled by the monomer
varied slightly along the length of the crack, the values from the various
slices of each specimen were used to calculate average crack width and
percentage filled values for the specimen.
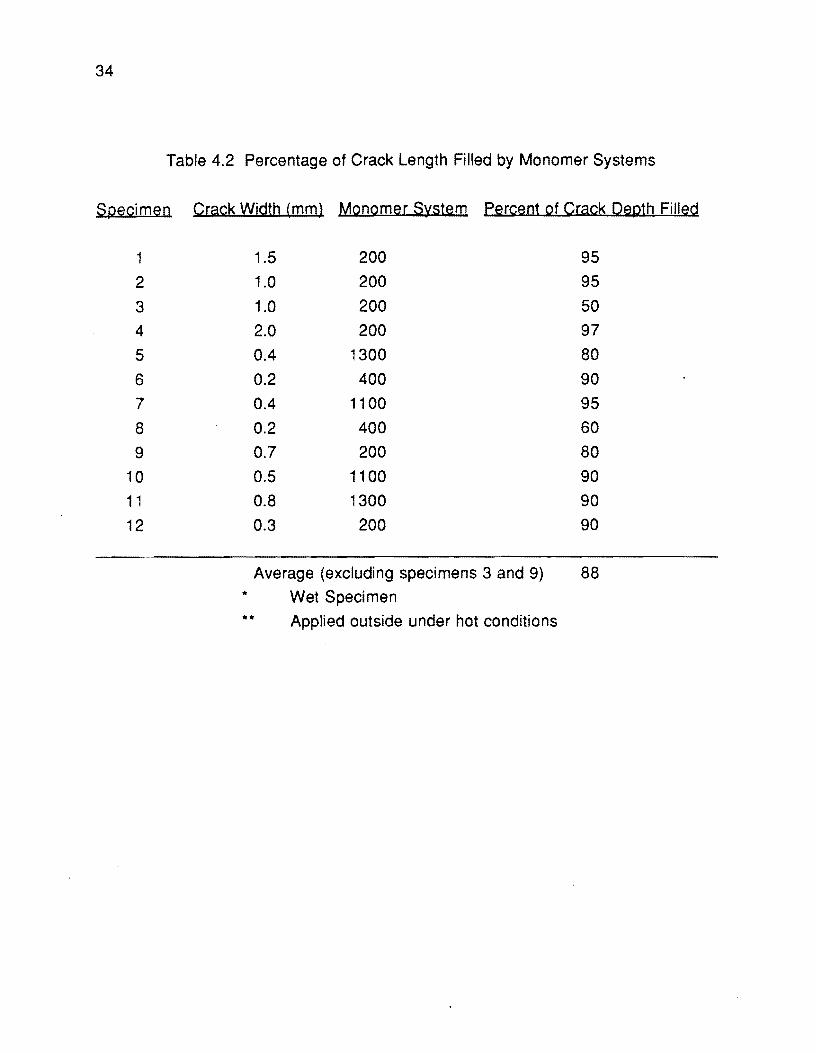
4.2.2.2. Results
The results of this test are tabulated in Table 4.2 and plotted in Fig.
4.1. Figure 4.1 reveals that the percentage of the crack filled by the
monomer increased as the crack width increased. No specimen
(besides the wet specimen) was filled less than 60 percent. This
indicates that. although the expected success of the monomer
application is directly related to the crack width, the majority of the depth
of even very narrow cracks can be filled under dry and clean conditions.
34
Table 4.2 Percentage of Crack Length Filled by Monomer Systems
Specimen Crack Width (mm) Monomer System Percent of Crack Depth Filled
1 1.5 200 95
2 1.0 200 95
3 1.0 200 50
4 2.0 200 97
5 0.4 1300 80
6 0.2 400 90
7 0.4 1100 95
8 0.2 400 60
9 0.7 200 80
10 0.5 1100 90
11 0.8 1300 90
12 0.3 200 90
Average (excluding specimens 3 and 9) 88 * Wet Specimen
** Applied outside under hot conditions

100
80 "0 (1)
u... .J::. -g' 60 (1)
...J
.:s:. u 0 ,... u 15 40 ~ 0
20
& 0
(;)
(;) o xx
0
0 x
0.5 1.0 1.5 2.0
Width of Crack (mm )
legend:
o Monomer 200 a Monomer 400 & Monomer 1100
o Monomer 1300
Note:
x Wet Specimen
xxApplied Outside Under Hot Conditions
Fig. 4.1 Wi dth of Crack vs. Percentage of Crack Length Fill ed
35

36
The single data point for the wet specimen indicates that the
presence of standing water in the crack greatly affects the performance of
the monomer. The cross sections of the wet specimen used in this test
revealed that only 50 percent of the crack length contained monomer.
This is compared to an expected value of 95 percent (Fig. 4.1) for dry
cracks of the same width. Apparently the monomer could not displace
the water and fill the crack properly. The effect of moisture is more
thoroughly investigated in Section 4.2.4.
The performance of the monomer seemed to also be adversely
affected by hot conditions during its application. The percentage of the
length of the crack filled for the specimen treated outside was 80 percent.
This is slightly lower than the 94 percent value for cracks with the same
width filled at 72 degrees F.
The four monomer systems did not exhibit a significant difference
in their crack filling capabilities.
4.2.3 Recrackjng Strength and Crack Location
4.2.3.1 Test Procedure
The second half of the specimen was recracked under loading
conditions indentical to those used for the initial cracking. The recracking
loads were recorded and initial cracking and recracking stresses were
calculated for each specimen. These values are tabulated in Table 4.3
and plotted in Fig. 4.2. After each specimen was recracked, it was
examined to determine the amount of the length of the crack 'from this test
that coincided with the initial crack. These observations are recorded in
Table 4.4. Figure 4.3 shows typical cracking patterns.
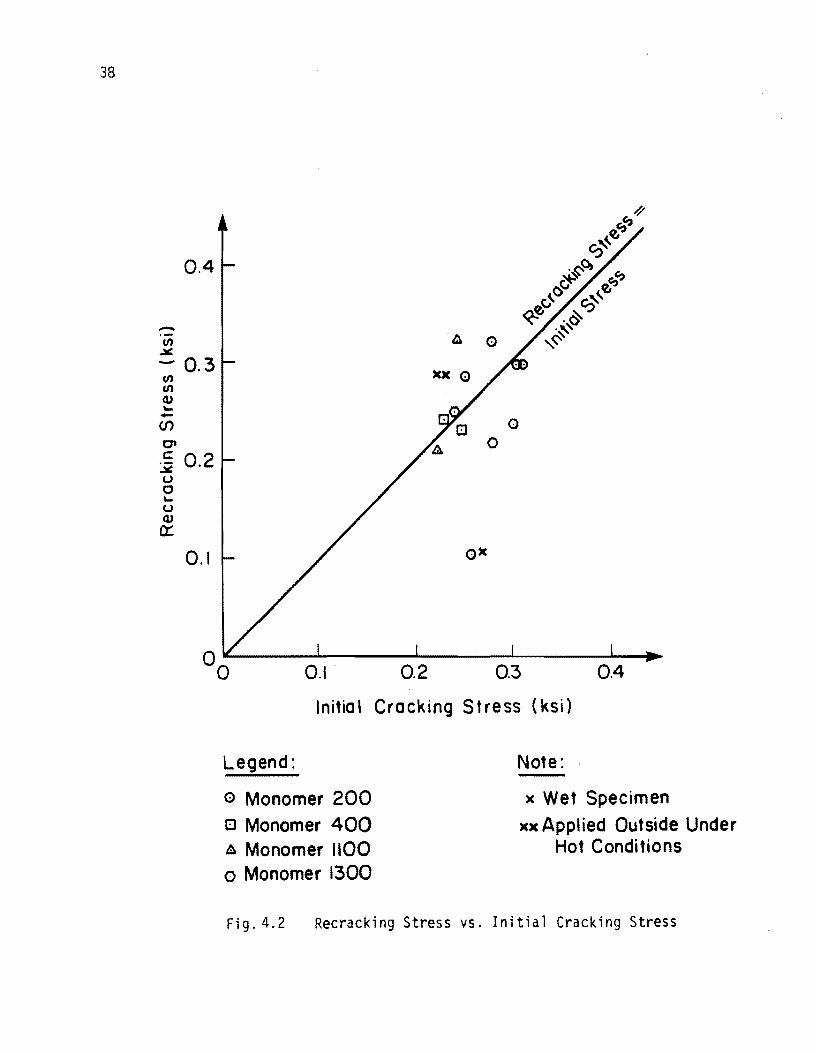
4.2.3.2 Results
The data plotted in Fig. 4.2 reveal that the ratio of recracking stress
to initial cracking stress for specimens repaired under cool, dry
conditions in general follows the line of equality between initial stress

37
Table 4.3 Initial and Recracking Stresses
Specimen Crack Monomer Percent of Initial Recracking Recracking Stress
Width Used Crack Depth Cracking Stress Initial Cracking
(mm) Filled Stress (ksi) Stress
(ksi)
1 1.5 200 95 0.298 0.238 0.80
2 1.0 200 95 0.278 0.322 1.16
3 1.0 200 50 0.254 0.105 0.41
4 2.0 200 97 0.302 0.298 0.83
5 0.4 1300 80 0.278 0.218 0.78
6 0.2 400 90 0.245 0.232 0.94
7 0.7 1100 95 0.241 0.324 1.32
8 0.2 400 60 0.227 0.243 1.07
9 0.7 200 80 0.248 0.287 1.16
10 0.5 1100 90 0.221 0.211 0.96
11 0.8 1300 90 0.240 0.248 1.03
12 0.3 200 90
13 1.3 200 0.308 0.298 Q...91
Avg. 0.99
* Wet Specimen
** Applied outside under hot conditions
38
-en .::.:
0.4
- 0.3 en en QJ
"'" -en C"
c: 0.2 :.i o o "'" o QJ
ex::
0.1
0.1 0.2
o o
0.3 0.4
Initio I Crocking Stress (ksi)
Legend:
o Monomer 200 t:J Monomer 400 bI. Monomer 1100 o Monomer 1300
Note: .
x Wet Specimen
xx Applied Outside Under Hot Conditions
Fig.4.2 Recracking Stress vs. Initial Cracking Stress

39
Table 4.4 Location of Recracking Crack
Specimen Crack Width Recracking Stress Position of Recracking
(mm) Initial Cracking Crack in Relation to
Stress Original Crack*
1 1.5 0.80 Parallel
2 1.0 1.16 Partially inside
3 1.0 0.41 Partially inside
4 2.0 0.83 Totally inside
5 0.4 0.78 Parallel
6 0.2 0.95 Parallel
7 0.4 1.34 Parallel
8 0.2 1.07 Partially inside
9 0.7 0.16 Mostly paralle I
10 0.5 0.96 Mostly inside
1 1 0.8 1.03 Totally inside
12 0.3
13 1.3 0.97 Totally inside
* Fig. 4.3 Defines cracks locations

Original Crack (Typ.)
Recracking Crack ( Typ.)
Parallel Mostly Porallel Portially Inside Mostl y Inside
Fig. 4.3 Location of Recracking Crack Relative to Initial Crack
-
+::0 o
..............
Totally Inside

41
and recracking stress. The average variation between the initial and
recracking stresses was 13 percent (Table 4.4).
The average value of the ratio of recracking stress to initial stress
was 0.99. However, it should be noted that many of the lower recracking
stress values were offset by values of recracking which were higher than
the recorded initial cracking stress. These higher stress values could be
due to slight differences in positions of the supports or the point of load
application for the initial cracking and recracking loadings. However, it is
quite likely that, when the initial crack was repaired, the next crack
developed at a higher flexural stress.
As can be seen in Fig. 4.4, often the crack produced in this test did
not coincide with the initial crack of the specimen. The observations
~ecorded in Table 4.4 reveal that, in general, cracks resulting from the
recracking test coincided with the initial crack along less than half its
length in specimens where the recracking stress values are larger than
the initial stress values. Even when the second crack did not coincide at
all with the original crack, the recracking stress was sometimes lower.
This is most likely due to the fact that during the first loading
microcracking developed that resulted in cracking which caused failure
at lower loads during the second loading. Although there is a significant
variation in the recracking to initial stress ratio, it is apparent that the
monomer treatment restores a great deal of the strength to the concrete.
The recracking stress value of the wet specimen is also plotted in
Fig. 4.2. This specimen yielded a recracking to initial cracking stress
ratio of less than 0.5.

42
Fig. 4.4 Recracked Monomer - Filled Specimen
43
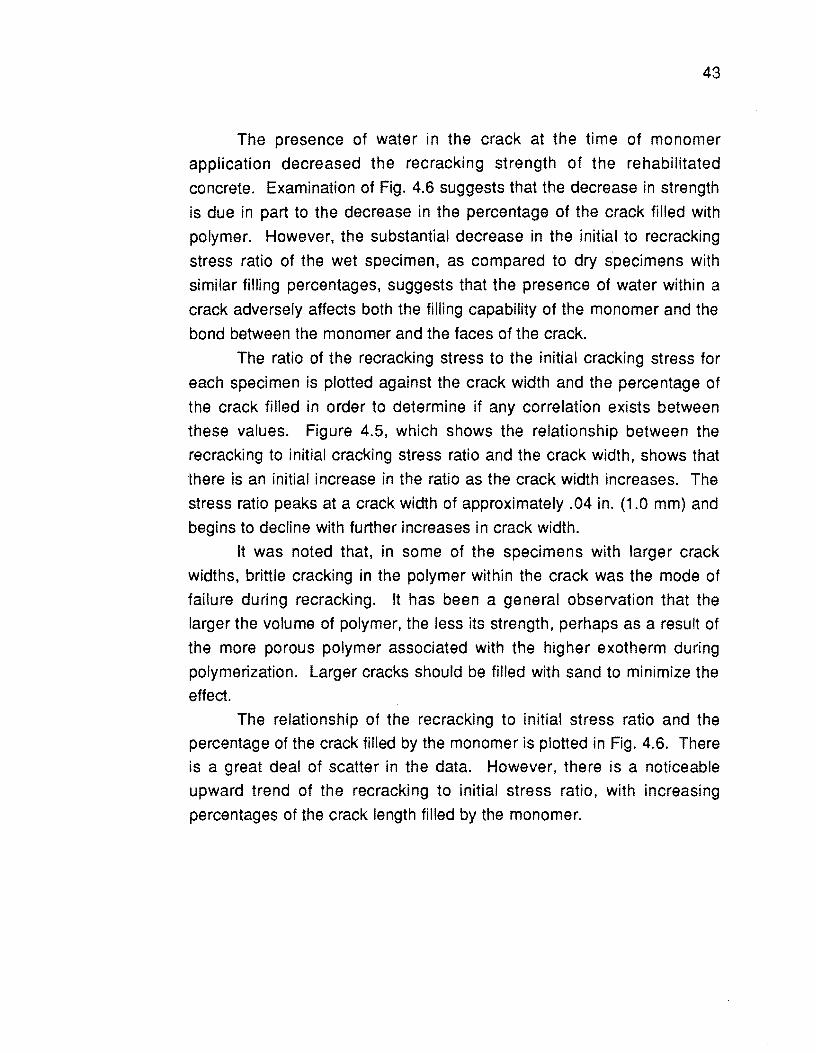
The presence of water in the crack at the time of monomer
application decreased the recracking strength of the rehabilitated
concrete. Examination of Fig. 4.6 suggests that the decrease in strength
is due in part to the decrease in the percentage of the crack filled with
polymer. However, the substantial decrease in the initial to recracking
stress ratio of the wet specimen, as compared to dry specimens with
similar filling percentages, suggests that the presence of water within a
crack adversely affects both the filling capability of the monomer and the
bond between the monomer and the faces of the crack.
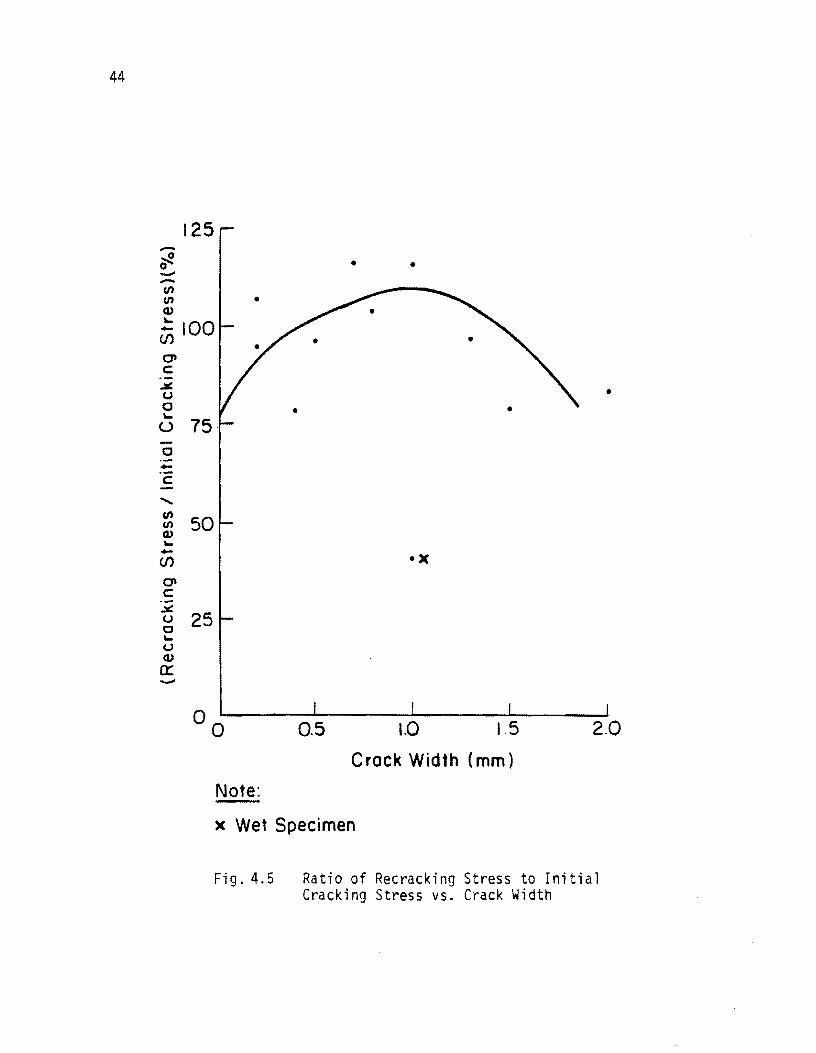
The ratio of the recracking stress to the initial cracking stress for
each specimen is plotted against the crack width and the percentage of
the crack filled in order to determine if any correlation exists between
these values. Figure 4.5, which shows the relationship between the
recracking to initial cracking stress ratio and the crack width, shows that
there is an initial increase in the ratio as the crack width increases. The
stress ratio peaks at a crack width of approximately .04 in. (1.0 mm) and
begins to decline with further increases in crack width.
It was noted that, in some of the specimens with larger crack
widths, brittle cracking in the polymer within the crack was the mode of
failure during recracking. It has been a general observation that the
larger the volume of polymer, the less its strength, perhaps as a result of
the more porous polymer associated with the higher exotherm during
polymerization. Larger cracks should be filled with sand to minimize the
effect.
The relationship of the recracking to initial stress ratio and the
percentage of the crack filled by the monomer is plotted in Fig. 4.6. There
is a great deal of scatter in the data. However, there is a noticeable
upward trend of the recracking to initial stress ratio, with increasing
percentages of the crack length filled by the monomer.
44
125 -~ 0 --en en GJ
!:IOO (/)
C'I c:
.::6! U C "-
U
c -c: ........ en
50 ((I
GJ "--(/) C'I c: .x
25 u 0 "-U GJ
a::: -
• •
•
·x
0.5 1.0 1.5 2.0
Crack Width (mm)
Note:
x Wet Specimen
Fig.4.5 Ratio of Recracking Stress to Initial Cracking Stress vs. Crack Width

125
-~ 0 -:; 100 (/) Q,) '--CJ)
C7l C
.:a: 75 u c '-
U -c -c 50 ....... (/) (/)
Q,) '--CJ)
C7l 25 c
.:.:. u 0 '-u Q,)
n::: -
•
•
• • •
• )(
20 40 60 80 100
% of Crack Length Filled
Note: X Wet Specimen
Fig.4.6 Ratio of Recracking Stress to Initial Cracking Stress vs. Percentage of Crack Length Filled
45

46
Visual observation of the cut specimens indicated that in several
cases the level of polymer was below the surface of the concrete even
though care was taken in the treatment to completely fill the crack. This
was undoubtedly due to the continued but slow penetration of the
monomer into the narrower part of the crack at the bottom of the
specimen and perhaps wicking into the pores of the concrete. While
presence of the polymer in the crack all the way to the surface is not
essential for resotration of water tightness and structural integrity, it is
desirable from a visual inspection standpoint. When polymer is not
visible at the surface, it is difficult to determine the effectiveness of the
treatment without taking cores. For that reason, it is desirable to have
continued or intermittent brooming of the monomer into the cracks for 10
or 15 minutes after the initial application.
4.2.4 Effect of Moisture
As can be seen in Figs. 4.1 and 4.2, the presence of moisture in a
crack can greatly affect both the amount of filling of the monomer and the
resulting recracking strength of the repaired concrete. These data
suggest that the presence of moisture lowered the percentage of the
crack filled by approximately 50 percent and also caused a reduction of
more than 50 percent in recracking strength. In other words, by allowing
a crack to dry, the success of the monomer application, in terms of percent of the crack length filled and the strength of the rehabilitated
concrete will be increased by approximately 100 percent.

47
4.2.4.1 Test Procedure In an effort to quantify the amount of drying time necessary in order
to achieve a particular level of success, drying tests were performed.
Two sets of five specimens were prepared in the manner described in
section 4.2.1. After the specimens were cracked, they were placed in a
wet chamber for approximately two weeks, until they were saturated and
the cracks were entirely full of water.
Tests run on the first five specimens were performed under nearly
ideal field drying conditions. These specimens were taken out of the
moist room and immediately placed outside under direct sunlight. The
outside temperature during the drying of the specimens ranged from the
mid-70s at night to the mid-90s under sunny to partly sunny conditions
during the day. The relative humidity remained below 50 percent
throughout the duration of the drying peroid. This environment is
subsequently referred to as "dry conditions." Also, in an effort to create
improved drying conditions, four of the five specimens contained medium
sized cracks (0.7 mm to 1.1 mm). It was believed that larger crack sizes
would be more conducive to rapid drying. The fifth specimen, containing
a small crack (0.5 mm), was used to test the validity of this assumption.
The specimens were brought inside and treated with monomer after
drying times of 8 hours, 16 hours, 1 day, 2 days, and 3 days.
Five other specimens used in the second set of tests were dried
under very poor conditions. They were placed in an environmental
chamber upon removal from the wet chamber. This enviromental
chamber was equipped with adjustable temperature and humidity
controls. The specimens were dried at a temperature of 65 degrees F
and 90 percent relative humidity subsequently referred to as "wet
conditions." These five specimens were removed from the chamber and
filled with monomer at intervals of 8 hours, 16 hours, 1 day, 2 days, and 3
days. These specimens contained small cracks (0.2 to 0.6 mm). One
other specimen was filled with the monomer immediately upon removal
from the wet chamber in order to determine the effect of zero drying time.

48
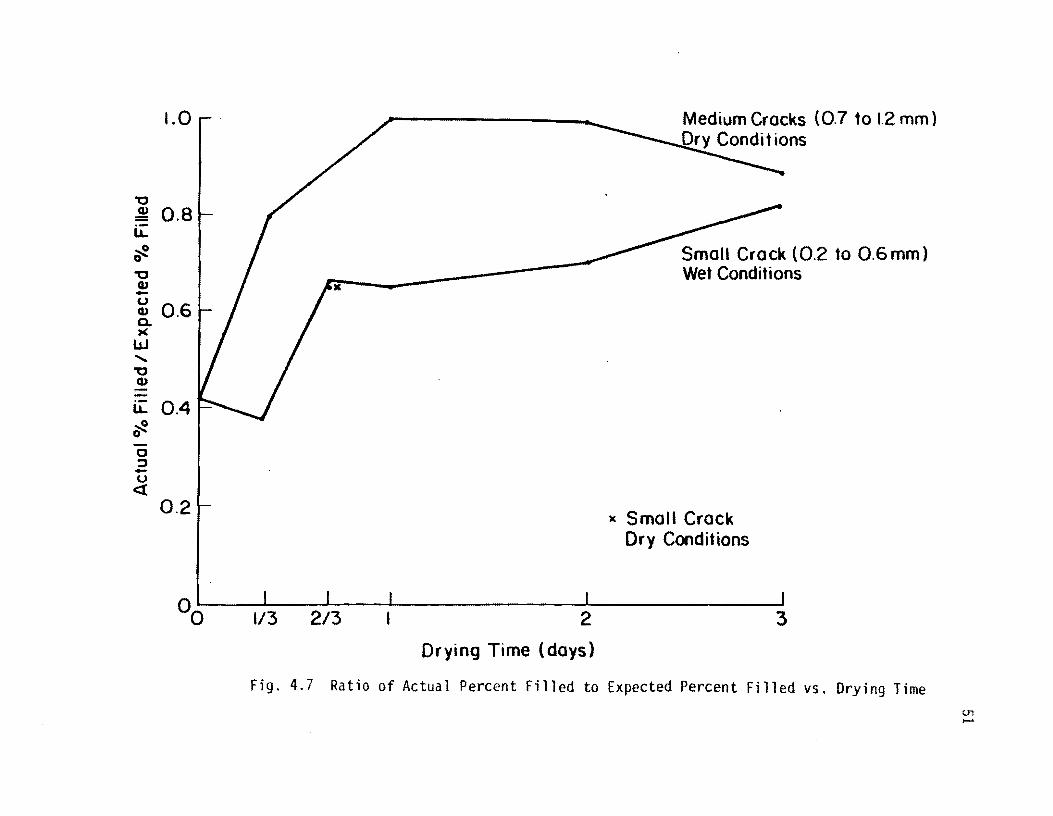
4,2.4,2 Results
The crack widths of the specimens used in these tests varied,
However, there was not only variation in widths between the small and
medium width cracks: there were also smaller variations within the two
crack size classifications, As shown in Fig. 4.1, the percentage of the
crack filled by the monomer under dry conditions is affected by the crack
width. Therefore, in order to negate the effects of crack width from the
wet versus dry results and yet still maintain the crack width effects in the
drying time results, the filling percentages from these tests were divided
by the average filling percentages for the same crack width from Fig. 4.1.
These values are recorded in Table 4.5 and plotted versus drying time in
Fig. 4.7. A 100 percent value in Fig. 4.7 indicates that the crack was filled
as completely as if the specimen were completely dry.
It should be noted from Fig. 4.7 that the assumption that the larger
cracks would lead to faster drying is affirmed by the point labeled "small
crack, dry conditions." Although this point should theoretically plot above
the line for the specimens dried under humid conditions, it should be
recognized that it is very much below the data pOints for the specimens
dried under dry conditions.
The results of these tests suggest that the pressence of moisture
does in fact have a significant effect on the filling capability of the
monomer. The monomer is obviously not able to displace the water from
the crack.
These tests were performed with the intent of establishing the
drying time for saturated concrete required to insure the desired level of
success. The conditions under which the first set of tests were run could
be considered close to ideal for field conditions. Therefore, the results of
this set of tests could be used in estimating the minimum drying time
required for a particular level of success. The drying conditions for the
second set of tests could be considered close to the worst conditions
which would be experienced. The results of this set of tests could,
therefore, be used in predicting the minimum level of success which

49
could be expected for a particular drying time. For example, if the cracks
in a particular slab are subjected to dry conditions for one day after
steady rain, the results obtained from applying the monomer could be
expected to be 90 percent or more as good as if the monomer had been
applied to a perfectly dry crack. Even for very humid, cool drying
conditions, the results would be in excess of 60 percent of that expected
for dry concrete. It can be concluded that long drying times in hot, dry
weather are not required in order to obtain an adequately sealed bridge
deck or pavement.
4,2.5 Spray Application
It is often desirable to seal cracks on a vertical surface or on the
underside of a horizontal concrete slab, such as a bridge deck, as
described in previous sections, Monomer applications are unsuccessful
because either the surface which is cracked can not be easily reached or
pouring the monomer into the crack is impossible. Therefore, it becomes
necessary to examine methods of application such as spraying.
4.2,5.1 Test Procedure
In order to make preliminary estimates of the success which could
be expected by using this technique, three specimens were prepared in
the manner described in Section 4.2,1. These specimens contained
cracks of 0.01,0.02, and 0.08 in. (0.3 mm, 0.5 mm, and 2.0 mm).
Two of these specimens were elevated between two supports with
the crack positioned on the underside of the specimen. In order to
determine the effect of varying crack widths, one specimen contained a
large (2.0-mm) crack and another contained a small (0.3-mm) crack. The
monomer was sprayed on the cracked surfaces of the specimens using
an airless electric sprayer, the same sprayer that was used to inject the
monomer in the Fort Worth, Texas, bridge deck field study (Section
5.3.2).

50
Table 4.5 Results of Drying Tests
Crack Width Expected Actual Drying Drying Actual Percent Filled
(mm) Percent Percent Time Condition Expected Percent Filled
Filled Filled (days)
(from Fig. 9.1)
1.0 96 40 0 42
0.8 95 75 1/3 Dry 79
0.5 91 60 2/3 Dry 66
0.8 95 95 1 Dry 100
1.0 96 95 2 Dry 99
0.8 95 85 3 Dry 89
0.5 91 35 1/3 Wet 38
0.2 82 55 2/3 Wet 67
0.4 93 60 1 Wet 65
0.3 86 60 2 Wet 70
0.5 91 75 3 Wet 82
1.0
'0
.! 0.8 i.L :-! 0
'0 cu -<.J cu 0.6 Co )(
W ...... '0 cu
i.L 0.4 :-! 0
0 ::J -U «
0.2.
00
/
1/3 2/3
Medium Cracks (0.7 to 1.2 mm) Dry Condi t ions
~ Small Crack (0.2 to 0.6mm)
2
Drying Time (days)
Wet Conditions
)( Small Crack Dry Conditions
3
Fig. 4.7 Ratio of Actual Percent Filled to Expected Percent Filled vs. Drying Time U1 ........
52
The third specimen was positioned so that the length of the crack
ran in a vertical direction. Monomer was also sprayed on the cracked
surface of this specimen with the airless electric sprayer.
It should be noted that spraying monomer requires protection
clothing in cluding protection for the eyes and face. Respirators may be
necessary to prevent inhalation of the vapors.
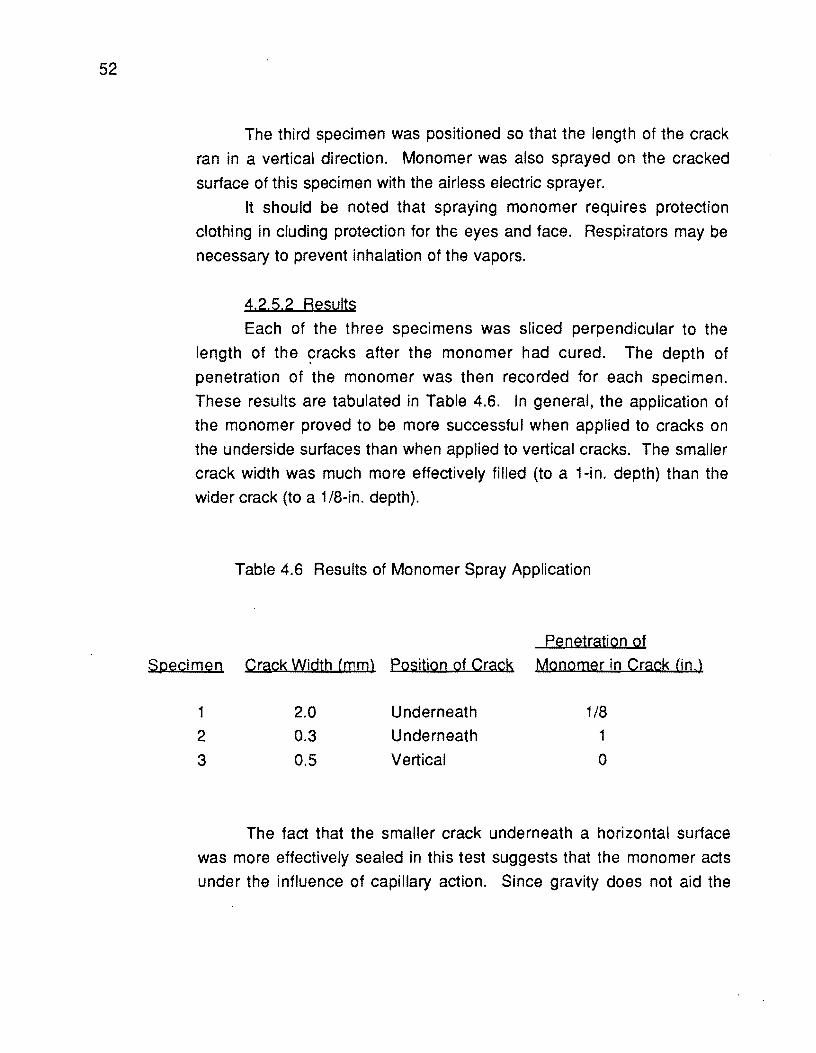
4,2.5.2 Results
Each of the three specimens was sliced perpendicular to the
length of the ~racks after the monomer had cured. The depth of
penetration of the monomer was then recorded for each specimen.
These results are tabulated in Table 4.6. In general, the application of
the monomer proved to be more successful when applied to cracks on
the underside surfaces than when applied to vertical cracks. The smaller
crack width was much more effectively filled (to a 1-in. depth) than the
wider crack (to a 1/S-in. depth).
Table 4.6 Results of Monomer Spray Application
Penetration of
Specimen Crack Width (rom) Posjtion of Crack Monomer in Crack (in.)
1
2
3
2.0
0.3 0.5
Underneath
Underneath
Vertical
lIS 1
o
The fact that the smaller crack underneath a horizontal surface
was more effectively sealed in this test suggests that the monomer acts
under the influence of capillary action. Since gravity does not aid the

53
flow of the monomer into cracks on vertical surfaces and the underside of
horizontal surfaces, this is the only force available to assist the monomer
in penetrating the crack.
Another alternative for application of the monomer into cracks
where pouring is impossible is to inject the cracks with the monomer.
The crack would have to be sealed as in epoxy injection applications.
The monomer could be injected with the airless sprayer.
4.3 Additional Laboratory Tests Using Monomer 1100.
As a result of the success a achieved in the initial test program, additional tests
were performed using Monomer 1100 (7). Monomer 1100 was selected since it has a
lower modulus than Monomer 200 and 400, and it was theorized that the lower
modulus would provide more ductility. Monomer 1300 has an even lower modulus;
however, it was more difficult to use because of its "stickiness".
4.3.1 Materials and Preparation
4.3.1.1 Concrete Specimens
Concrete specimens were prepared with wire reinforCing as described in
section 4.2.1 (1). The concrete mix design,however, was slightly different.
Material
Cement
Sand
3/4-in. coarse aggregate
Water
Weight Percent
14.1
32.1
48.2
5.6
Curing and cracking were performed as described in section 4.2.1 (1 ).
4.3.1.2 Monomer
The only monomer used was Monomer 1100. The initiator and catalyst levels
are given in Table 4.1.
54
4.3.1.3 Application of Monomer
Monomer was brushed onto the surface in the laboratory until the cracks were
filled. The monomer was permitted to cure for at least 24 hours before the slabs were
recracked.
4.3.2 Effect of Crack Width
4.3.2.1 Test Procedures
The reinforced specimens were cracked to produce crack widths ranging from
0.01 in. (0.2 mm) to 0.08 in. (2.0 mm). The monomer system was then brushed onto
the surface.
Four of the specimens were filled outside under a temperature of over 90
degrees F. It had been observed in earlier tests that increasing temperatures would
result in a decrease of the monomer curing time. It was thought that this decreased
cure time could inhibit the flow of monomer into the finer and deeper cracks, since the
penetration potential of the system is limited to the time that it is a low viSCOSity liquid.
4.3.2.2 Results
After the monomer had cured, the specimens were sawed perpendicular to the
length of the cracks. Slices of the cracked cross section permitted the determination of
the percentage of crack length filled by the polymer. It was observed that the polymer
did not stop abruptly at any specific depth; instead, air pockets formed within the
polymer thus creating a discontinous filling along the length of the crack. The
percentage of crack length filled was estimated by adding the segment length of the
crack filled by the polymer and dividing by the total length of the crack. The crack
widths recorded in these tests refer to the widths of the crack at the surface of the slab.
Table 4.7 presents the results and Fig. 4.8 provides a graphical representation of the
data.
It can be observed that the percentage of crack length filled by the monomer
increased with increasing crack widths. Moreover, in most cases, even for the smaller
crack widths, a minimum of 80 percent of the crack length was filled. This indicates
that, although the penetration potential of the monomer is directly related to the crack

55
the majority of the depth of even very narrow cracks can be filled under dry and clean
conditions. The performance of the monomer seemed to be slightly affected by the hot
conditions at the time of application. This effect was more significant in the case of
specimens with smaller crack widths. In all the cases, however, a minimum of 85
percent of the crack length was filled.
4,3.3 Recracking Strength
4.3.3.1 Testjng Procedure
Specimens were prepared and cracked to produce a range of crack widths.
The monomer system was then burshed onto the slabs and allowed to cure.
Specimens were then recracked under the same center point loading arrangement
used for the initial cracking. The recracking loads were recorded and initial cracking
and recracking stresses were calculated for each specimen. Results are presented in
Table 4.8 and represented graphically in Fig. 4.9. The specimens were then sliced
perpendicular to the crack. These observations are recorded in Table 4.9; typical
cracking patterns are shown in Fig. 4.3.
4.3,3.2 Results
Even though the average ratio of recracking stress to initial cracking stress was
0.91, only two of the second cracks were even partially inside the original cracks. The
lower recracking stress apparently was due to microcracking caused by the first
loading which served as a plane of weakness duing the second loading.
The ratio of the recracking stress to the initial cracking stress for each specimen
was plotted against the corresponding crack widths in order to determine if any
correlation existed between these values (Fig. 4.10). The plot shows that considerable
scatter exists in the data and that no strong conclusion can be drawn, Nearly all the
ratios, however, ranged between 75 and 100 percent so it could be safely assumed
that in general the ratio of the recracking to the initial cracking stress would fall
between these values.

56
Table 4.7 Percentage of Crack Length Filled by Polymer System Using
Monomer 1100
Crack Depth Percent of
Width of Crack Crack Depth
Specimen (mm) (in.) Full
1 0.60 4.0 98
2* 0.35 3-7/8 85
3 1.40 4-1/8 92
4 0.25 4-5/8 98
5 0.50 4-1/2 85
6 0.40 4-3/8 50
7 1.0 4-1/2 98
8 0.65 4-1/2 98
9 1.80 4-1/2 100
10* 1.0 4.0 90
11 * 2.0 5.0 100
12* 0.5 4-1/4 97
* Applied outside under Hot Conditions
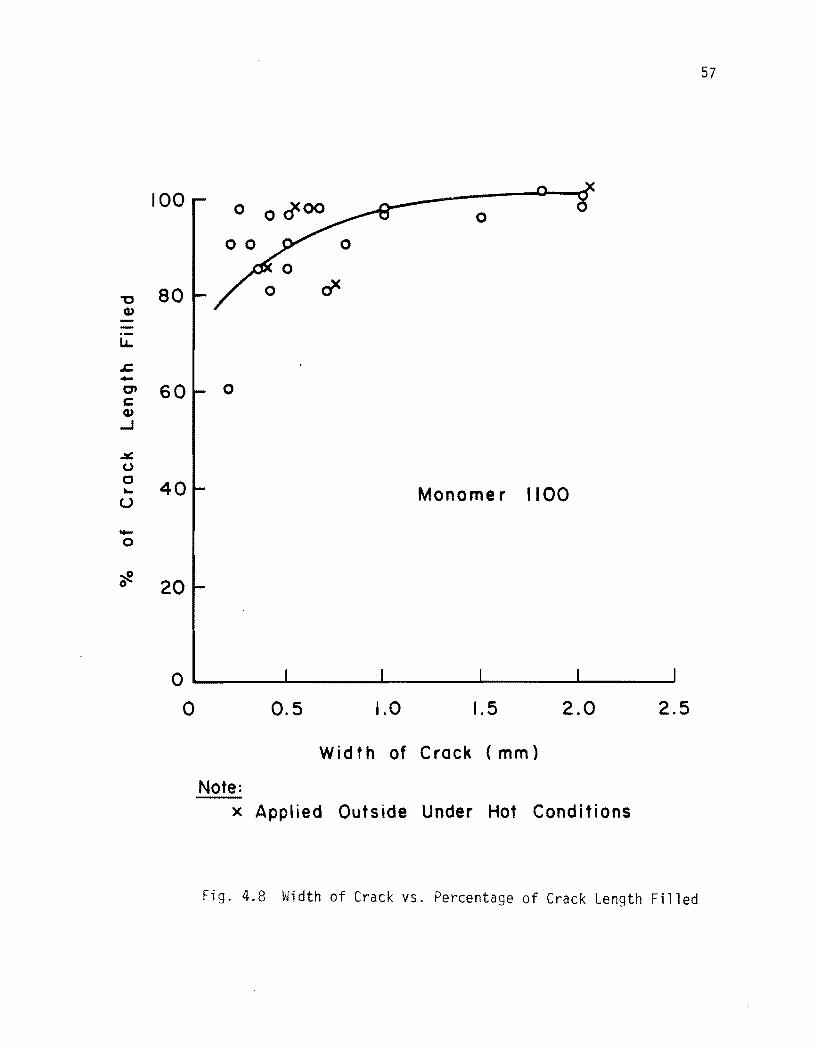
57
100 o
"D 80 Q>
LL.
.J:. -a- 60 0 c:: Q> ...J
~ ()
0 40 "- Monome r 1100 u
-0
~ 0 20
o ~----~------~~------~------~----~ o 0.5 1.0 1.5 2.0 2.5
Width of Crock (mm)
Note: x Applied Outside Under Hot Conditions
Fig. 4.8 Width of Crack vs. Percentage of Crack Length Filled
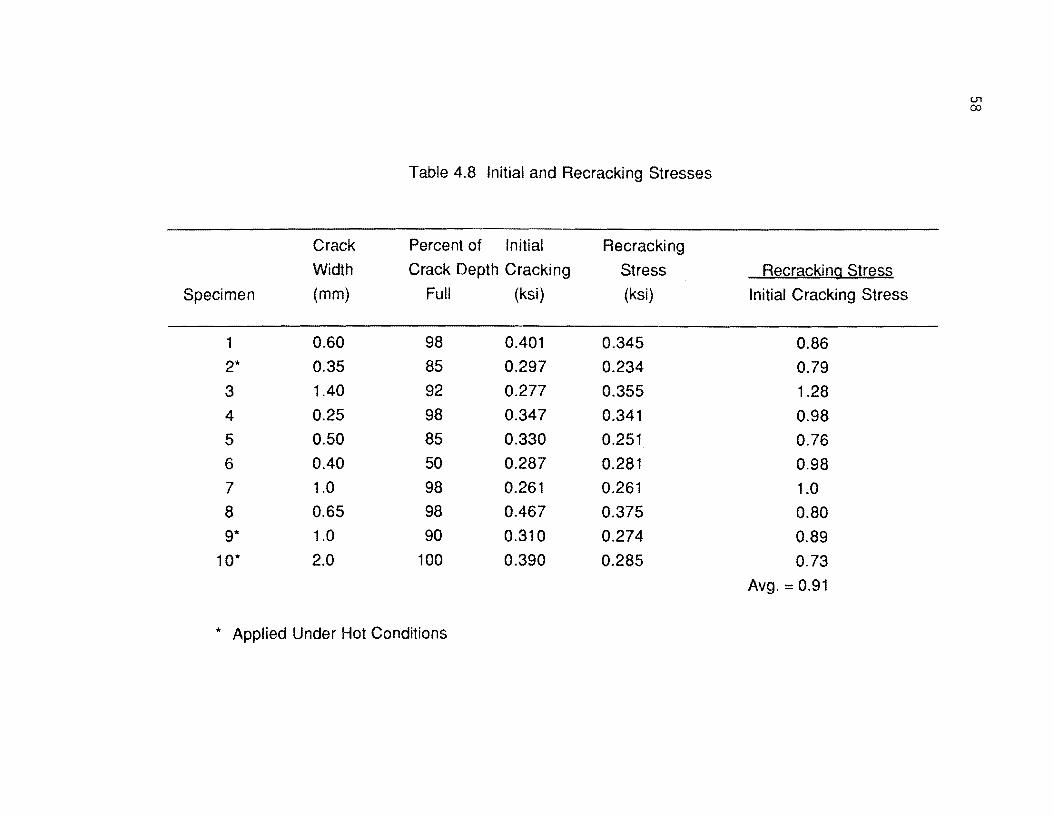
Table 4.8 Initial and Recracking Stresses
Crack Percent of Initial Recracking
Width Crack Depth Cracking Stress
Specimen (mm) Full (ksi) (ksi)
1 0.60 98 0.401 0.345
2* 0.35 85 0.297 0.234
3 1.40 92 0.277 0.355
4 0.25 98 0.347 0.341
5 0.50 85 0.330 0.251
6 0.40 50 0.287 0.281
7 1.0 98 0.261 0.261
8 0.65 98 0.467 0.375
9* 1.0 90 0.310 0.274
10* 2.0 100 0.390 0.285
* Applied Under Hot Conditions
Recrgcking Stress
Initial Cracking Stress
0.86
0.79
1.28
0.98
0.76
0.98
1.0
0.80
0.89
0.73
Avg. = 0.91
U1 co

59
0.5
0.4 - 0 en 0 ~ 0 -en 0 0 en 0.3 CD '- xo -(/)
C'I 0 c: ~ 0 () 0.2 0 '-()
CD 0::
0.1 Monomer 1100
o o 0.1 0.2 0.3 0.4 0.5
Initial Cracking Stress (ksi )
Note: x Appl i ed Outs ide Under Hot C ond i t ions
Fig. 4.9 Recracking Stress vs. Initial Cracking Stress

60
Table 4.9 Location of Recracking Crack
Crack Position of Recracking
Width Recracking Stress Crack in Relation
Specimen (mm) Initial Cracking Stress to Origi nal Crack ..
1 0.60 0.86 Parallel
2 0.35 0.79 Parallel
3 1.40 1.28 Mostly Parallel
4 0.25 0.98 Parallel
5 0.50 0.76 Partially Inside
6 0.40 0.98 Parallel
7 1.0 1.0 Mostly Parallel
8 0.65 0.80 Parallel
9 1.0 0.89 Partially Inside
10 2.0 0.73 Parallel
.. Fig. 7 illustrates terms
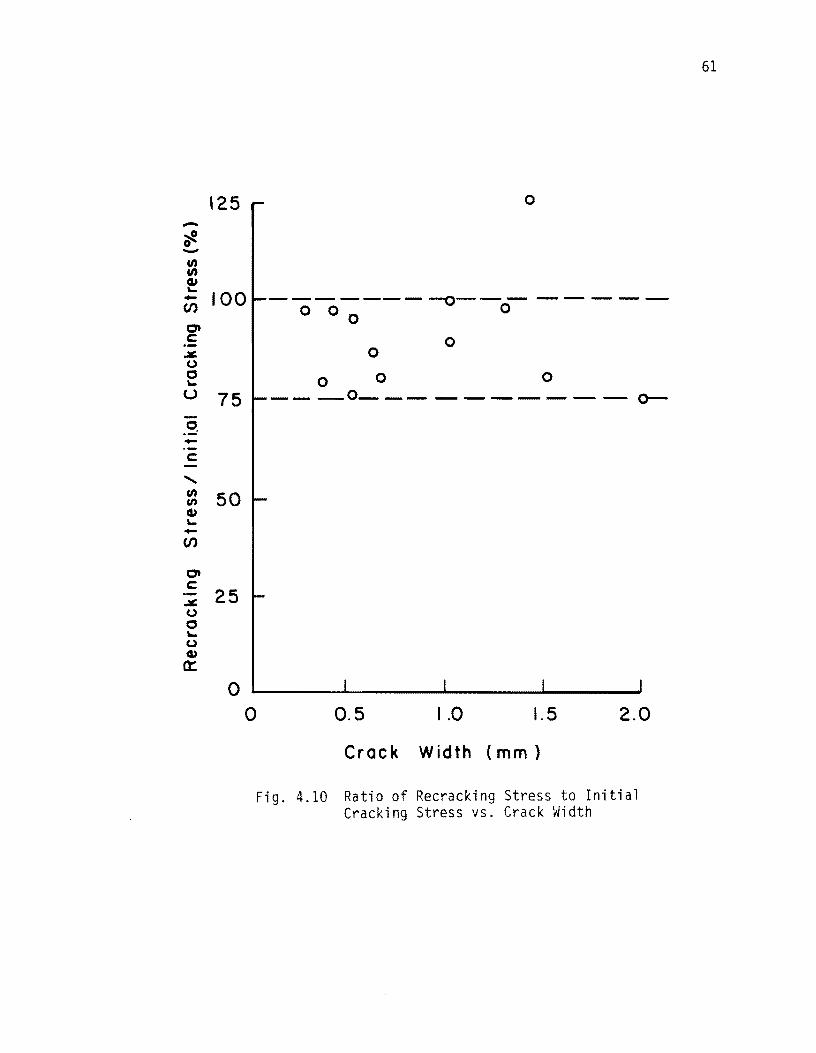
-~ o -en en ell
125
!: 100 en o c .¥ (,,)
o '-
U 75
.9 -.-c ...... en 50 en ell '--en
0 c .¥ 25 (,,)
0 '-(,,)
ell a::
0 0
o
--------0---- -----o 0 0 0
o o
000 ___ 0 __________ 0-
0.5 1.0 1.5 2.0
Crack Width (mm)
Fig. 4.10 Ratio of Recracking Stress to Initial Cracking Stress vs. Crack Width
61

62
Although there is a significant variation in the ratio of recracking stress to initial
cracking stress, it is evident from the results of this test that the monomer system
significantly restored structural integrity and strength to the cracked slabs.
4.3.4 Effect of Moisture
In the initial test program it was found that moisture in the concrete significantly
affected the ability of the monomer to fill the crack completely (section 4.2.4).
Additional slabs were cracked, saturated, and permitted to dry varying lengths of time
before monomer application.
4.3.4.1 Test Procedure
Five reinforced slabs were prepared and cracked as described in 4.3.1. The
specimens were placed in a moist chamber for approximately a month. The slabs
were taken immediately outside and permitted to dry in direct sunlight. The
temperature ranged from the mid·70s at night to the high 90s during the day. Relative
humidity ranged from 50 to 75 percent.
In order to examine the effects of varying size of cracks. each specimen
contained a different crack width. ranging from small (0.25 mm) to large (1.3 mm)
cracks. The specimens were brought inside and brushed with monomer after drying
times of 4 hours. 6 hours. 12 hours, 1 day, and 1-1/2 days. After curing for at least 24
hours, the specimens were sawed into thin sections to permit the percentage of crack
length filled to be determined.
4.3.4.2 Results
Table 4.10 gives the results of the percentage of the crack length filled. The
results were surprisingly good. Even after only 4 hours of drying, the specimen with a
crack width of 0.45 mm was filled to 85 percent of its crack length. The specimen with
the smallest crack width, 0.25 mm. was 94 percent filled after only 12 hours drying. To
eliminate the effect of crack width so that the effect drying time could be determined,
the percent filled values for the wet slabs were divided by the percent filled values for
the same crack width for dry slabs (Fig. 4.8). The results are shown in Table 4.10 and
Fig. 4.11.

Table 4.10 Results of Drying Tests
Expected Actual Drying
Crack Width Percented Percent Time
Full (days)
(from Table 7.1)
0.25 98 94 1/2
0.35 85 80 1/4
0.45 85 85 1/6
0.65 98 94 1-1/2
1.30 95 94 1
AQtual Percent Full
Expected Percent Full
96
94
100
96
99
0'1 W

64
100 0 0 - 0 0-0 -~ 0 ,-"C"C .!Q) 75 --._-LL .-
LL .t::. - .t::. cp_ ccp Q) C ...JQ) 50 ...J ~ (.)~ 0(.) '-0 u'-
u Monomer 1100 O"C 25 ;:, Q) --(.)(.) «Q) ~ )(
LLJ
a 0 0.5 1.0 1.5 2.0
Drying Time (days)
Fig. 4.11 Ratio of Actual Crack Length Filled to Expected Crack Length Filled vs. Drying Time for Small to Medium Size Cracks.
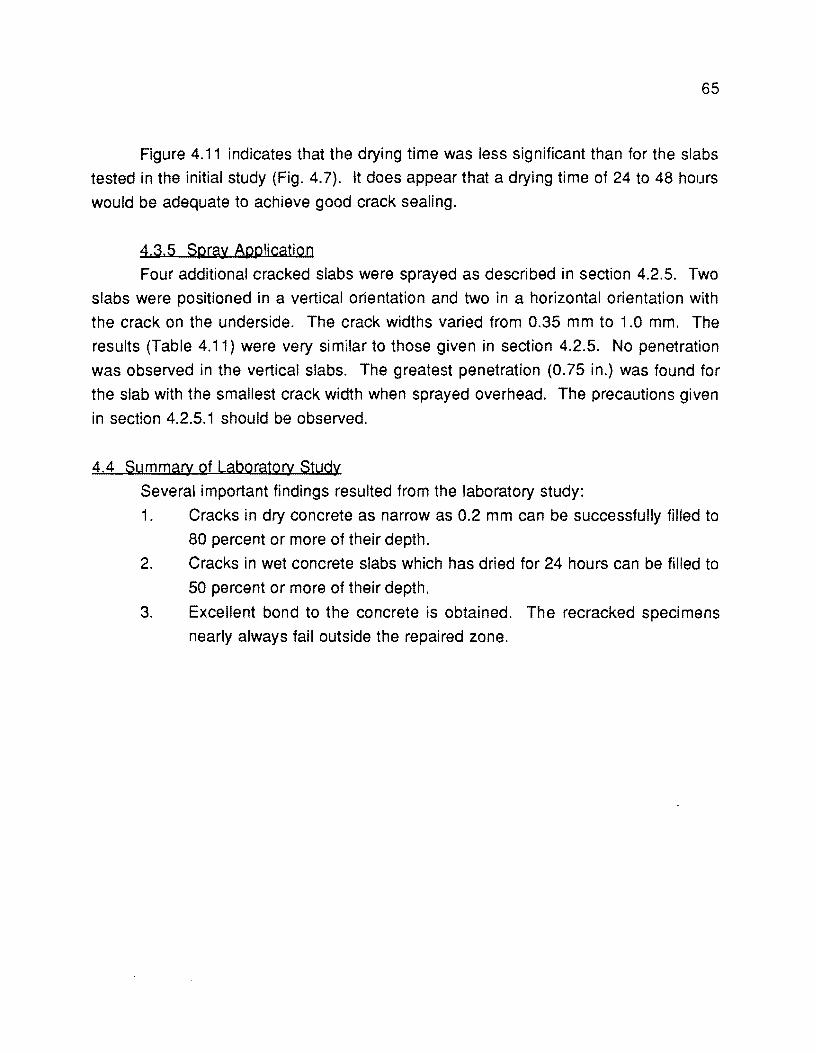
65
Figure 4.11 indicates that the drying time was less significant than for the slabs
tested in the initial study (Fig. 4.7). It does appear that a drying time of 24 to 48 hours
would be adequate to achieve good crack sealing.
4.a.5 Spray Application
Four additional cracked slabs were sprayed as described in section 4.2.5. Two
slabs were positioned in a vertical orientation and two in a horizontal orientation with
the crack on the underside. The crack widths varied from 0.35 mm to 1.0 mm. The
results (Table 4.11) were very similar to those given in section 4.2.5. No penetration
was observed in the vertical slabs. The greatest penetration (0.75 in.) was found for
the slab with the smallest crack width when sprayed overhead. The precautions given
in section 4.2.5.1 should be observed.
4.4 Summary of Laboratory Study
Several important findings resulted from the laboratory study:
1. Cracks in dry concrete as narrow as 0.2 mm can be successfully filled to
80 percent or more of their depth.
2. Cracks in wet concrete slabs which has dried for 24 hours can be filled to
50 percent or more of their depth.
3. Excellent bond to the concrete is obtained. The recracked specimens
nearly always fail outside the repaired zone.

!!!!!!!!!!!!!!!!!!!"#$%!&'()!*)&+',)%!'-!$-.)-.$/-'++0!1+'-2!&'()!$-!.#)!/*$($-'+3!
44!5"6!7$1*'*0!8$($.$9'.$/-!")':!

Chapter 5
Crack· Repair Field Studies
5.1 Introduction
The previous chapters describe laboratory evaluations of polymer repair
methods and materials. This chapter describes field tests performed in several areas
of the state tests (6, 7).
5.2 Repair Procedures
This chapter is primarily concerned with field applications of high molecualr
weight methacrylate (HMWM). Polymer concrete (PC) crack repairs are discussed in
Chapter 2. It was noted that field work was not done as part of this research study, but,
since the method has been found to be successful for repairing cracks in pavements,
the repair procedures, performance and cost are discussed in Chapter 2.
Epoxy injection laboratory studies were performed. but only limited field tests
were conducted since (1) the procedures are well understood. having been in use for
many years and (2) the HMWM proved to be preferable due to its much greater
simplicity of application and lower cost.
5.3 Field Tests
5.3.1 McLean. Texas Fjeld Study
5.3.1.1 Introduction This crack repair field study was performed on April 11. 1984, on the
eastbound bridge on 1-40 in McLean. The bridge deck, which had not been opened to
traffic, had exhibited plastic shrinkage cracking. The resulting cracks ranged in size
from 1/32 in. (0.8 mm) to 1/16 in. (1.6 mm) in width and from 1.5 ft (.5 m) to 6.1 ft (2 m)
in length (Fig. 5.1). Two methods of crack filling were tested. The Monomer 400
system was applied to three areas of the bridge. Two other cracks were filled by epoxy
injection. It should be noted that it had rained lightly on the previous day and the
cracks were still noticeably moist at the time of the study.
67

68
5,3,'.2 Monomer Agglicatjon
An attempt was made to dry out one of three sections to which Monomer 400
was applied by means of a butane burner (Fig, 5.2). However, the high winds present
made it very difficult to keep the flame directly over the cracks. Therefore, this drying
method did not prove to be very effective. Two applications of monomer were made to
one of the remaining two sections and only one coat was applied to the other section.
Monomer 400 was mixed with benzoyl peroxide and cobalt napthanate at the
site and then poured directly onto the surface. It was then spread over the surface with
a squeegee (Fig. 5.3) and further pushed into the cracks with a paint brush.
The cracks appeared to remain saturated with the monomer. This was very
different than what was usually experienced with laboratory specimens, in which the
surface level of the monomer in the crack recessed over a period of time. This
lowering of the surface level suggests continuing penetration of the monomer into the
finer portions of the cracks. Since the cracks on the bridge deck remained full of
monomer, a second application of monomer appeared to have no effect on the amount
of penetration of the monomer.
5.3.1,3 Results of Monomer Agplication
Cores were taken from each of the three test areas. These cores were sliced
perpendicular to the length of the crack and examined through the use of a binocular
microscope and then under ultraviolet light. Examination of the slices revealed that a
great deal of silt had accumulated in the crack just beneath the surface of the slab .
. This moist silt apparently blocked the penetration of the monomer into the crack. No
polymer could be seen by the naked eye below this line of silt. However, under the
microscope, polymer could be seen coating the walls of the crack periodically along its
depth. These traces of polymer were highlighted when the slices were placed under
ultraviolet light.
Cores from the three different test sections did not exhibit significant differences
in amount of penetration of the monomer.

N
L.{)
til ~
U to s...
U
r-to U
69
a.
~
L.{)
70
Fig. 5.3 Monomer Application
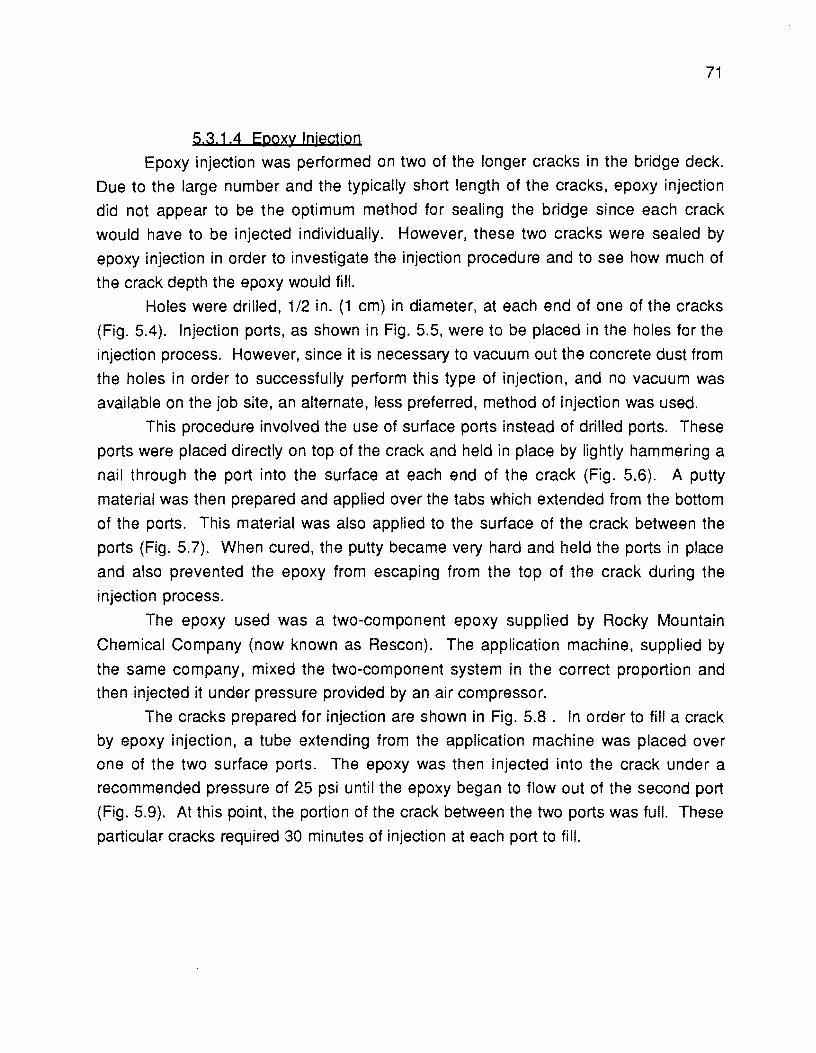
71
5.3.1.4 Epoxy Inject jon
Epoxy injection was performed on two of the longer cracks in the bridge deck.
Due to the large number and the typically short length of the cracks, epoxy injection
did not appear to be the optimum method for sealing the bridge since each crack
would have to be injected individually. However, these two cracks were sealed by
epoxy injection in order to investigate the injection procedure and to see how much of
the crack depth the epoxy would fill.
Holes were drilled, 112 in. (1 cm) in diameter, at each end of one of the cracks
(Fig. 5.4). Injection ports, as shown in Fig. 5.5, were to be placed in the holes for the
injection process. However, since it is necessary to vacuum out the concrete dust from
the holes in order to successfully perform this type of injection, and no vacuum was
available on the job site, an alternate, less preferred, method of injection was used.
This procedure involved the use of surface ports instead of drilled ports. These
ports were placed directly on top of the crack and held in place by lightly hammering a
nail through the port into the surface at each end of the crack (Fig. 5.6). A putty
material was then prepared and applied over the tabs which extended from the bottom
of the ports. This material was also applied to the surface of the crack between the
ports (Fig. 5.7). When cured, the putty became very hard and held the ports in place
and also prevented the epoxy from escaping from the top of the crack during the
injection process.
The epoxy used was a two-component epoxy supplied by Rocky Mountain
Chemical Company (now known as Rescon). The application machine, supplied by
the same company, mixed the two-component system in the correct proportion and
then injected it under pressure provided by an air compressor.
The cracks prepared for injection are shown in Fig. 5.8. In order to fill a crack
by epoxy injection, a tube extending from the application machine was placed over
one of the two surface ports. The epoxy was then injected into the crack under a
recommended pressure of 25 psi until the epoxy began to flow out of the second port
(Fig. 5.9). At this point, the portion of the crack between the two ports was full. These
particular cracks required 30 minutes of injection at each port to fill.

72
Vl -l-> So 0-
c: o 'r--l-> U Q)
'1'""')
c: ...... "'0 Q)
'r-S
O
l()
L.(')
'r-L.J...
c: o 'r--l-> U Q)
'1'""')
c: ...... » >< o 0.
W
SO
'+-
en c:
SO
en
L.J...
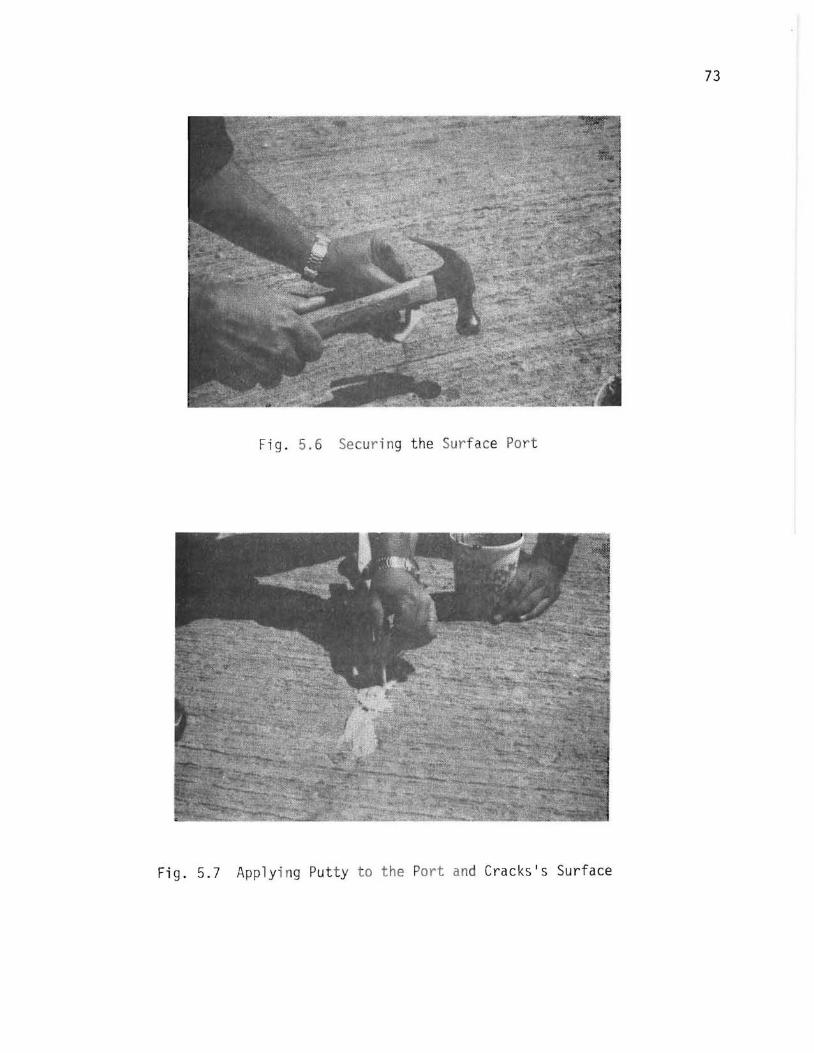
73
Fig. 5. 6 Securi ng the Su r fa ce Port
Fig. 5.7 Applyi ng Pu t ty to the Port and Cracks's Surface

74
Fig. 5.8 Cracks Prepared for Epoxy Injection
Fig. 5.9 Epoxy Flowing From Full Crack

75
5,3,1,5 Epoxy Results
One core was taken immediately after the injection and pulled apart at the crack
before the epoxy had set. The epoxy appeared to have penetrated the entire 4-in. (10-
cm) depth of the crack. Other cores were later taken. Slices were made from these
cores and examined as previously described for those treated with the monomer.
These slices showed a very small amount of void space in the epoxy. It had
apparently penetrated the entire depth of the core.
5.3,1,6 Conclusions
The poor performance of the monomer system could probably be attributed to
the damp silt in the crack. Although the results of the epoxy injection were very
favorable, it would have taken an enormous amount of time to fill the number of cracks
on the bridge using this process,
5.3.2 Fort Worth, Texas Field Study
5,3.2.1 Introduction
This field test was performed on the deck of the 1-20 overpass bridge, over 1-30,
west of Fort Worth in Parker County. The concrete slab, which was supported by
continuous steel plate girders, experienced random cracking due to plastic shrinkage
of the concrete. This study was performed on June 20, 1984. Several days of dry
weather preceded the day on which the study was performed. However, to ensure that
the cracks were dry at the time of 'filler application, tape had been placed over the
cracks several days before the study. The tape also served to keep dirt and debris out
of the cracks. Both epoxy injection and monomer application were performed on these
cracks.
5.3.2,2 Monomer Application
The Monomer 200 system was used to fill two of the cracks, It was poured into
one and injected into the second. The Monomer 200 system was prepared at the site
and then poured into the first crack. A broom was then used to sweep the excess
material toward the crack in order to keep it full as the monomer penetrated into the
crack.
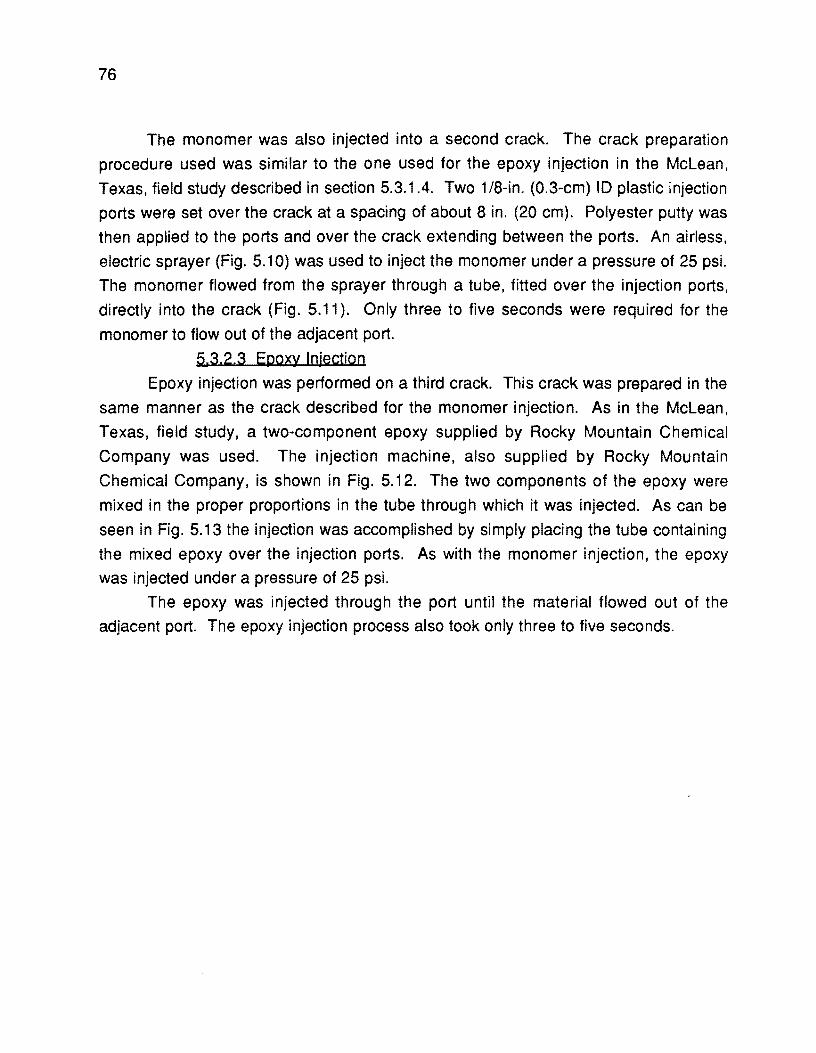
76
The monomer was also injected into a second crack. The crack preparation
procedure used was similar to the one used for the epoxy injection in the McLean,
Texas, field study described in section 5.3.1.4. Two 1/8-in. (0.3-cm) 10 plastic injection
ports were set over the crack at a spacing of about 8 in. (20 cm). Polyester putty was
then applied to the ports and over the crack extending between the ports. An airless,
electric sprayer (Fig. 5.10) was used to inject the monomer under a pressure of 25 psi.
The monomer flowed from the sprayer through a tube, fitted over the injection ports,
directly into the crack (Fig. 5.11). Only three to five seconds were required for the
monomer to flow out of the adjacent port.
5.3.2.3 Epoxy Inject jon
Epoxy injection was performed on a third crack. This crack was prepared in the
same manner as the crack described for the monomer injection. As in the McLean,
Texas, field study, a two-component epoxy supplied by Rocky Mountain Chemical
Company was used. The injection machine, also supplied by Rocky Mountain
Chemical Company, is shown in Fig. 5.12. The two components of the epoxy were
mixed in the proper proportions in the tube through which it was injected. As can be
seen in Fig. 5.13 the injection was accomplished by simply placing the tube containing
the mixed epoxy over the injection ports. As with the monomer injection, the epoxy
was injected under a pressure of 25 psi.
The epoxy was injected through the port until the material flowed out of the
adjacent port. The epoxy injection process also took only three to five seconds.
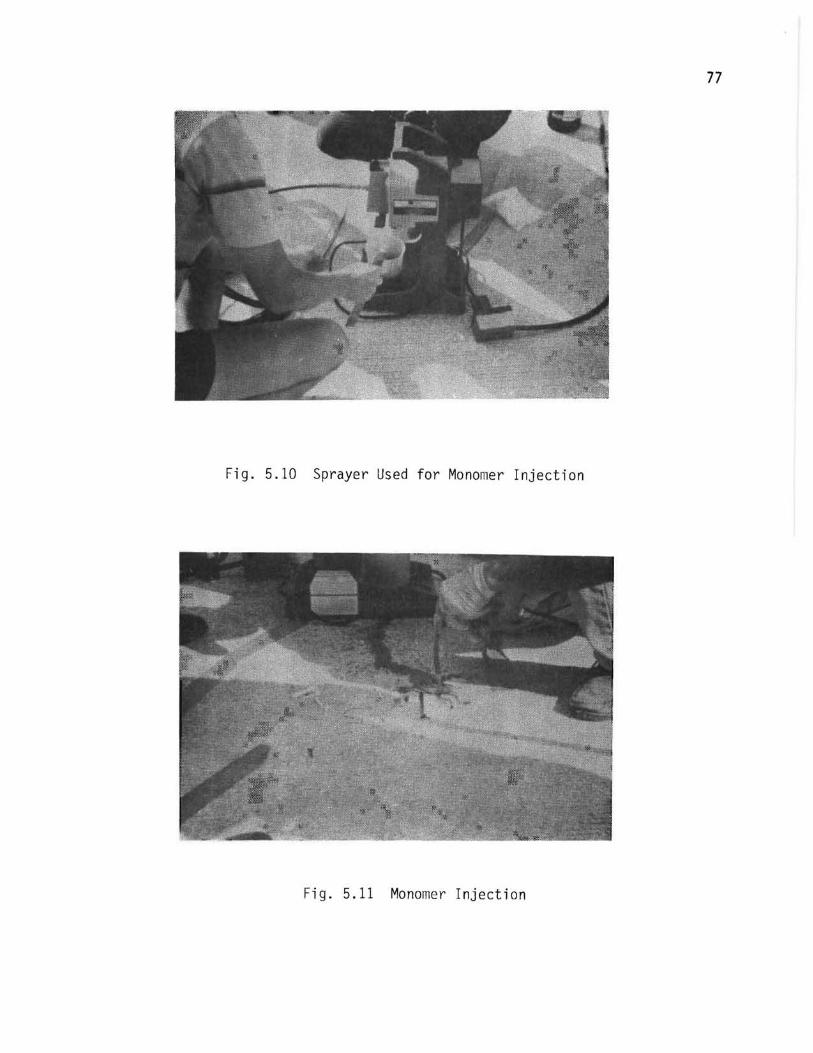
77
Fig. 5.10 Sprayer Used for Monomer Injection
Fig. 5.11 Monomer Injection

78
Fig. 5.12 Apparatus for Epoxy Injection
Fig. 5.13 Epoxy Injection

79
5,3,2.4 Results
Two days after the cracks were filled, several cores were taken, including one
core from each of the three cracks filled by the various methods, These cores were
sliced perpendicular to the direction of the crack in order to approximate the
percentage of the crack full and the depth of penetration of the sealants into the crack,
The width of the cracks in the cores, measured at the slab surface, ranged from
0.04 to 0.05 in. (0.95 to 1.3 mm). Compared to the typical crack widths experienced in
the field studies, these widths could be considered average to large. The depth of the
cracks ranged from 5-1/8 to 8-114 in. (13 to 21 cm). On the average, 95 percent of the
crack volume was filled and from 90 to 97 percent of its depth was filled. These
observations are summarized in Table 5.1.
It was observed that in the core injected with the epoxy, the portion of the crack
which was not filled was located at the bottom of the crack. Also, toward the center of
the core, voids existed in the epoxy. The crack into which the monomer was poured
and filled all the way to the bottom except for a couple of air pockets in the lower half of
the cores. The core containing the crack which was injected with monomer had a void
space at the very top of the crack, directly underneath the putty. The bottom portion of
the crack was completely filled. However, in some areas near the top of the cores, the
polymer just coated the walls of the crack. Cross-sections of these three cores are
shown in Figs. 5.14, 5.15, and 5.16.
5.3.2.5 Conclusions
80th the monomer and epoxy effectively sealed the cracks, thereby preventing
the intrusion of water. In each case almost the entire depth of the crack was
completely filled, except for a few isolated areas. The success of each application
could probably by attributed to the cleanness and dryness of the cracks. The
monomer pour method was selected for treating the entire bridge due to its simplicity
and low cost. Only the cracks were treated.
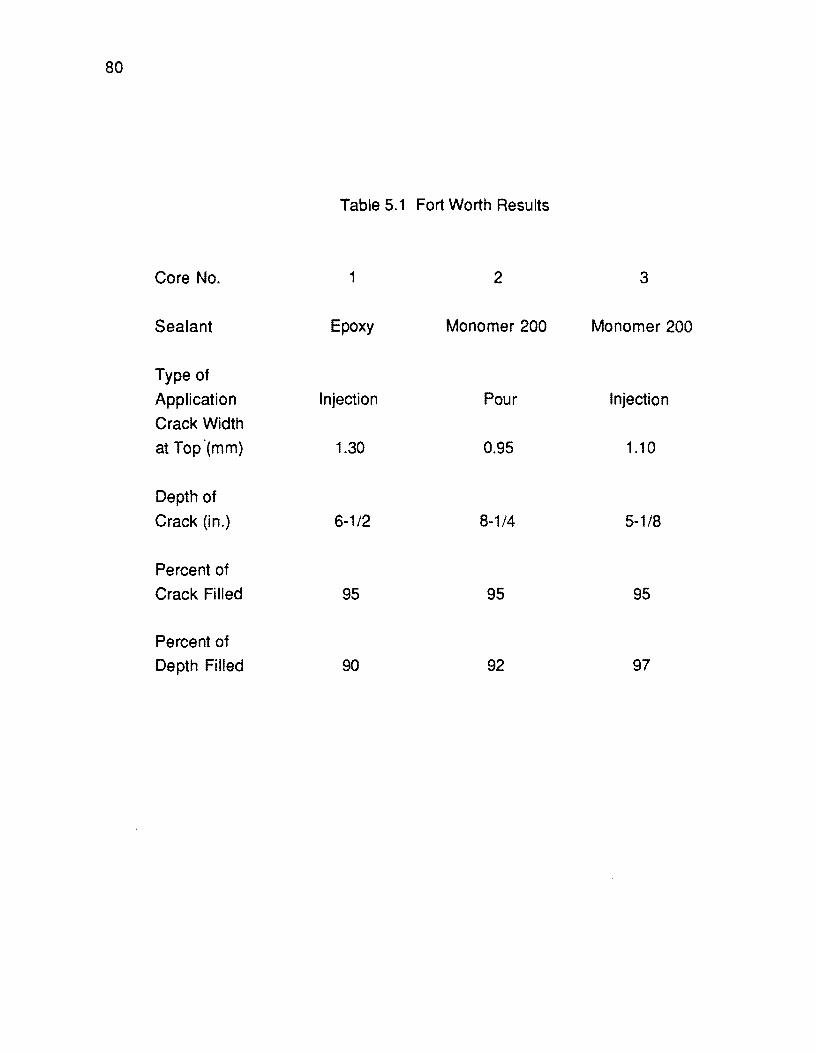
80
Table 5.1 Fort Worth Results
Core No. 1 2 3
Sealant Epoxy Monomer 200 Monomer 200
Type of
Application Injection Pour Injection
Crack Width
at Top"(mm) 1.30 0.95 1.10
Depth of
Crack (in.) 6-1/2 8-1/4 5-1/8
Percent of
Crack Filled 95 95 95
Percent of
Depth Filled 90 92 97
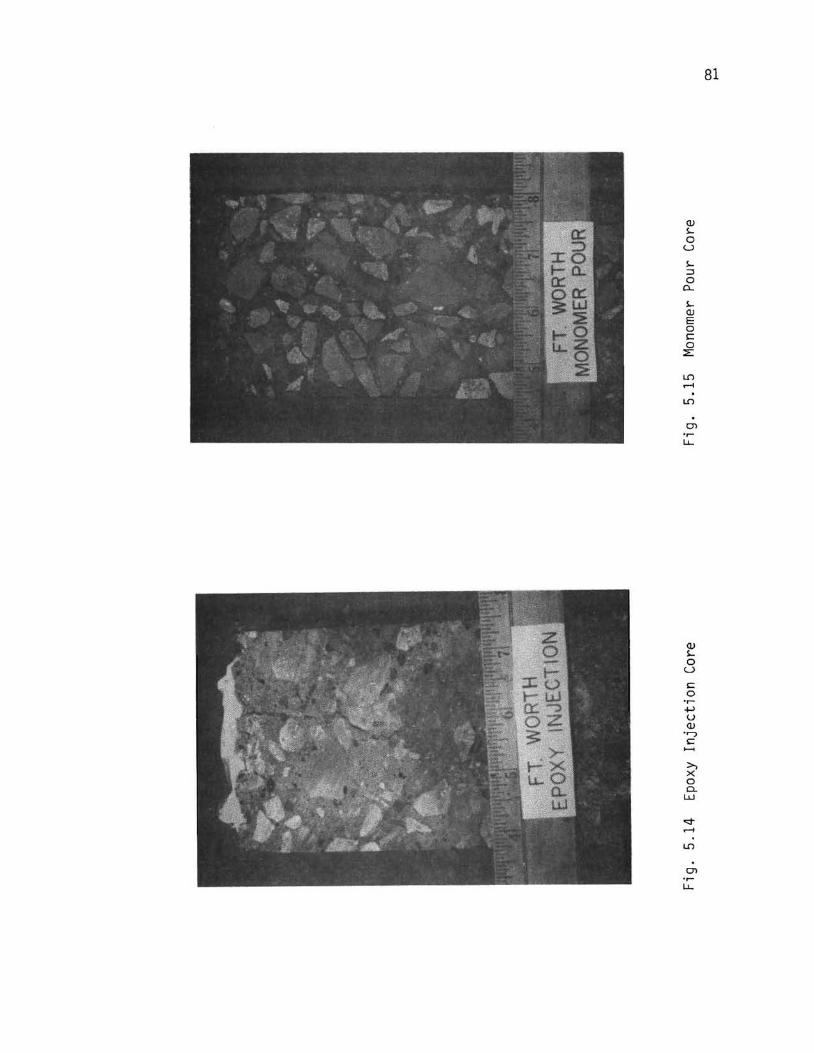
Q) ~ o u ~ :::l o
0...
~ Q)
E o t: o
::E
...... LL.
Q) ~ o
U
t: o ......
-+J U Q)
.r-:> t:
» x o 0..
W
en ...... LL.
81

82
Fig. 5.16 Monomer Injection Core

5.3.3 Corpus Christi. Texas Field Study
5.3,3,1 Introduction
83
This field study was performed on the deck of the Corpus Christi Harbor Bridge
(US 181), The lightweight aggregate concrete bridge deck had developed random
cracking and spalling, thought to have been caused by the screeding procedure used
at the time of concrete placement. The study was performed on July 26, 1984. Three
different HMWM systems were applied to test sections: Monomer 200, Monomer 1100,
and Monomer 1300. The widths of the cracks were noticeably larger than the widths
encountered in previous field studies (Fig, 5.17). These cracks ranged in width from
0.08 to 0.2 in. (2 to 6 mm). It was thought that the larger widths would facilitate the
pouring method of monomer application. Therefore. this was the only application
method used.
5.3.3.2 Monomer Application
Each of the three monomer systems was mixed on the site and then poured
directly onto the slab. A broom was then used to sweep the excess material towards
the cracks in order to keep them full. One of the sections was sandblasted before it
was filled.
A pot hole was also repaired by placing layers of sand in the hole and
saturating each layer of the sand with Monomer 200. thereby forming polymer
concrete.
~,3!3.3 Results
The day after the study was performed. six cores were taken from the various areas of monomer application. A core was also taken at the edge of the treated
pothole patch.
This bridge was built more than 25 years ago. Cracking, reportedly, had
occurred soon after its slab was poured. As could be expected. over the years a large
amount of debris. including salt. had accumulated in the crack. The penetration of
debris into the cracks was facilitated by the large width of the cracks at the slab
surface. Examination of the sliced cores revealed debris in large amounts near the
slab surface.
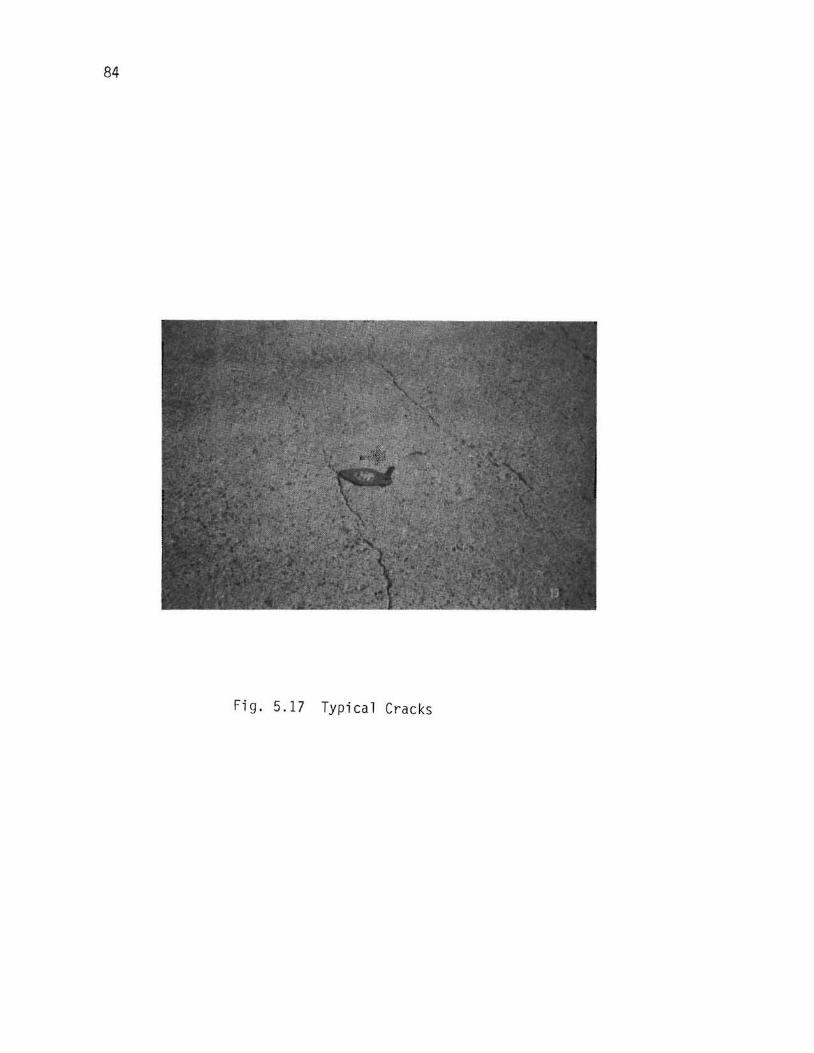
84
Fig. 5.17 Typical Cracks

85
Examination of the cross-sections of these cores also reveled the surprising fact
that the depths of the cracks were sometimes smaller than their widths at the surface.
The width of the cracks decreased very rapidly from the top to the bottom of the crack
(Figs. 5.18 and 5.19). Obsevations of the cores filled with the three different monomer
systems are recorded in Tables 5.2 and 5.3. The core taken from the pothole which
was patched displayed good bond between the existing concrete and the new
polymer concrete. Also, as shown in Fig. 5.20, some of the monomer flowed through
the sand and into the crack extending below the spall, thereby sealing the crack.
5.3.3.4 Conclusions
The monomer did not penetrate the entire depth of the crack. This appeared to
be due to the debris in the crack and the small width of many of the cracks below the
surface. Therefore, the monomer did not restore complete structural integrity to the
slab. It did, however, seal the cracks at the slab surface.
5.3.4 Monahans. Texas Field Study
5,3.4.1 Introduction
A crack repair field study was performed on the Westbound 1-20 overpass
bridge deck over Texas Park Road 41, five miles east of Monahans.
The four-year-old bridge deck carries the two westbound lanes. The bridge is
160 ft. long with three prestressed concrete girder spans (40 ft-80 ft., and 40 ft.) and a
7.5-in.-thick deck slab. The girders are simply supported and the slab is continuous
over the interior bents. The overall width of the bridge is 44 ft and the clear roadway width is 42 ft. Internally sealed concrete was used in the construction of the bridge
deck. Internally sealed concrete is a portland cement concrete in which a small
portion of the aggregate is repalced with an equal amount of small spherical particles
of wax. After the concrete has hardened, the deck is heated to a temperature of
approximately 185 degree F, which causes the wax to melt and flow into the pores and
capillaries of the concrete. Upon removal of the heat, the wax solidifies and the
capillary network becomes a discontinuous, closed system that effectively blocks the
penetration of water and chlorides.
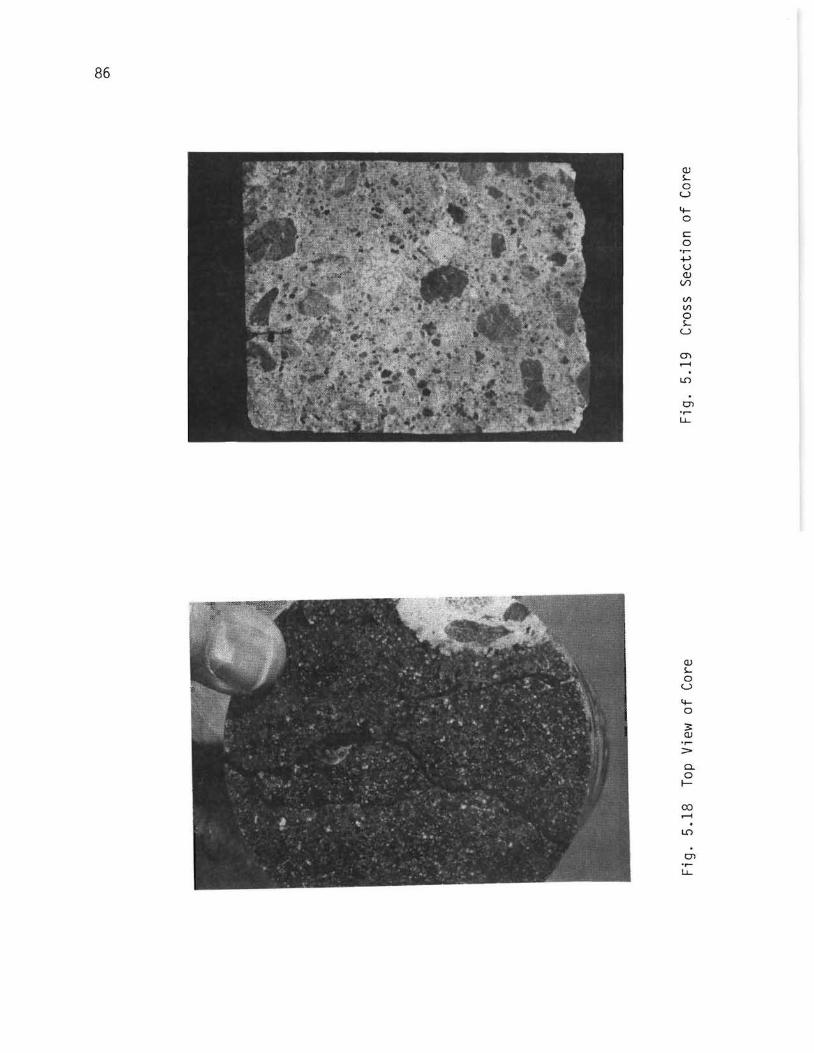
86
Q.)
~ o
U
4-o s:: o
or-+> u Q.)
Vl
Vl Vl o ~
u
m ......
Q.)
~ o
U
4-o 3 Q.)
or-:=>
CL o I-
co ...... LD
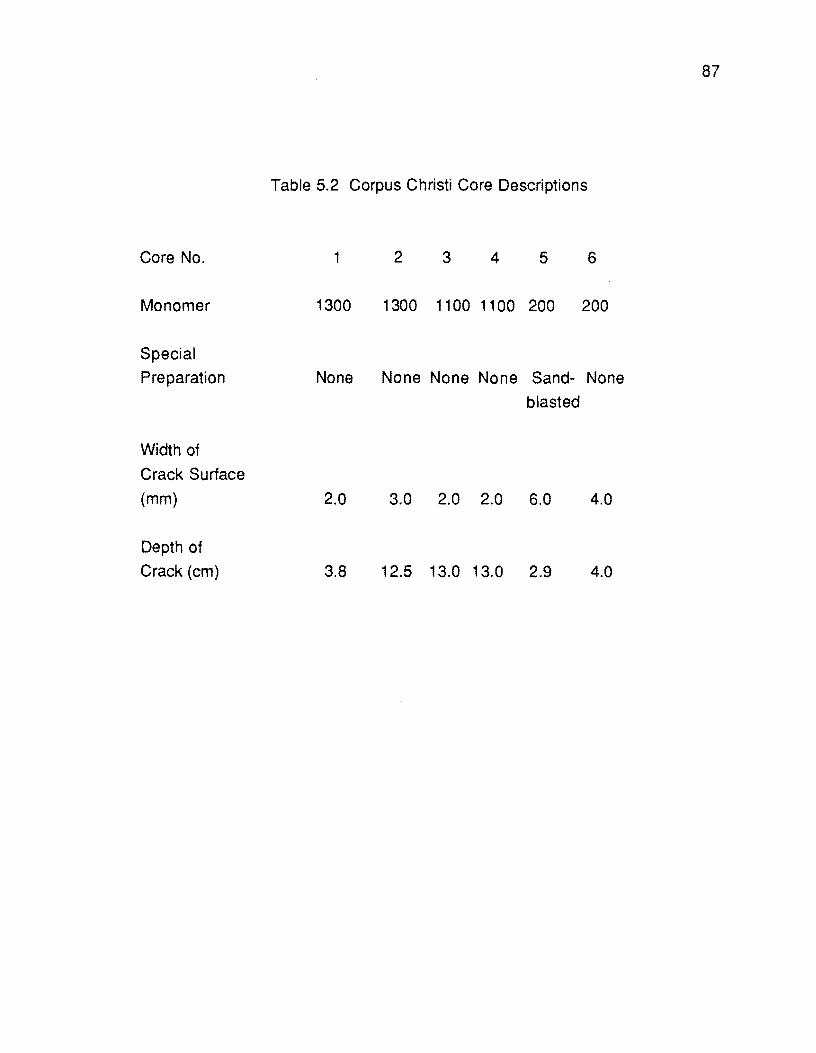
87
Table 5.2 Corpus Christi Core Descriptions
Core No. 1 2 3 4 5 6
Monomer 1300 1300 1100 1100 200 200
Special
Preparation None None None None Sand- None
blasted
Width of
Crack Surface
(mm) 2.0 3.0 2.0 2.0 6.0 4.0
Depth of
Crack (cm) 3.8 12.5 13.0 13.0 2.9 4.0
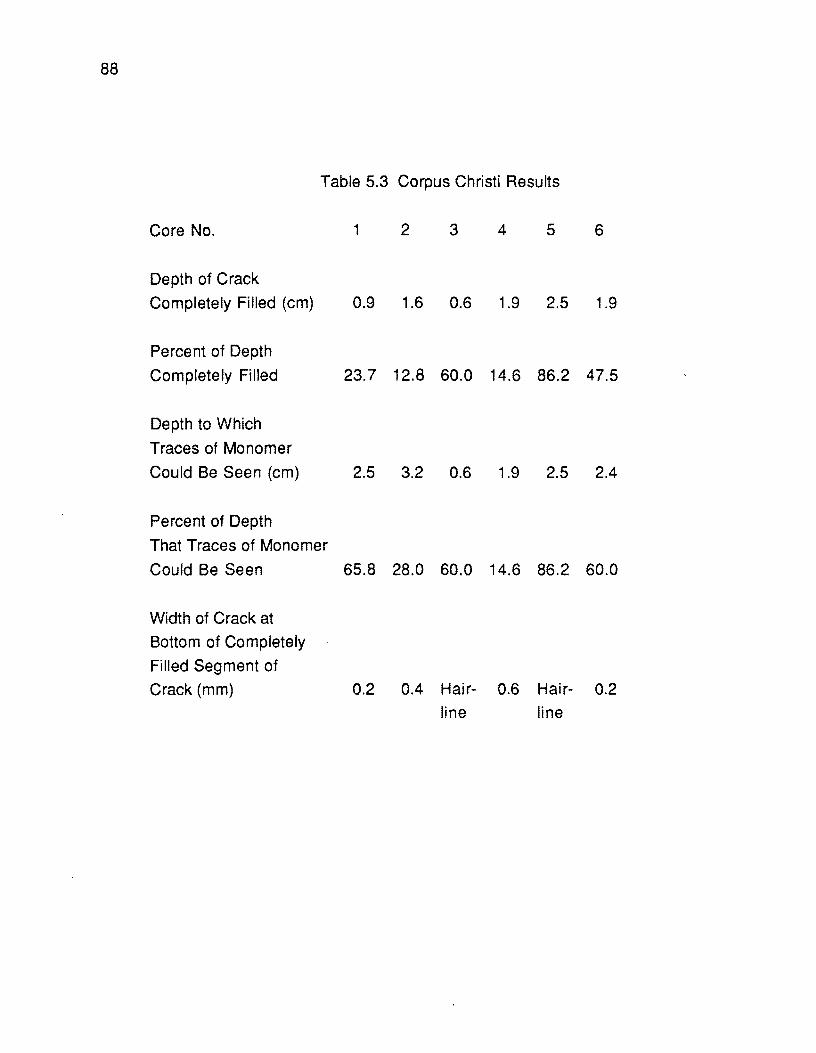
88
Table 5.3 Corpus Christi Results
Core No.
Depth of Crack
Completely Filled (cm)
Percent of Depth
Completely Filled
Depth to Which
Traces of Monomer
Could Be Seen (cm)
Percent of Depth
That Traces of Monomer
1 234 5 6
0.9 1.6 0.6 1.9 2.5 1.9
23.7 12.8 60.0 14.6 86.2 47.5
2.5 3.2 0.6 1.9 2.5 2.4
Could Be Seen 65.8 28.0 60.0 14.6 86.2 60.0
Width of Crack at
Bottom of Completely
Filled Segment of
Crack (mm) 0.2 0.4 Hair- 0.6 Hair- 0.2
line line

89
Fig. 5.20 Core from Repaired Pot Hole

90
The internally sealed, normal weight concrete bridge deck experienced random
cracking, probably caused by the high temperature used to melt the wax. District
personnel reported that water leaked through the deck during rainy weather, and a
visual inspection of the underside of the deck indicated extensive cracking through
which water had penetrated. The following sections describe the technique and
materials used to treat and seal the entire deck and summarize the results obtained.
5.3.4.2 Application of Material
This field study was performed on July 7, 1985. Several days of hot, dry
weather preceded the day on which the study was performed. The Monomer 1100
system was used to fill the cracks. The formulation used is described in Table 4.1.
The three materials were mixed at the site (Figs. 5.21 and 5.22) and then poured
directly onto the slab (Fig. 5.23). Before application of the sealant, the deck was swept
with brooms. The entire deck as well as the east approach slab was sealed. The
materials were mixed and poured onto the deck. Push brooms and squeeges were
then used to sweep the excess material towards the cracks in order to keep them filled
(Fig. 5.24). At the beginning of the application the temperature on the surface of the
deck was about 100 degrees F. Because of the high temperature the material at first
cured very quickly, thus giving little time to work it into the cracks. Fourteen-and-a-half
batches of 5 gallons each, a total of 72.5 gallons, were used to seal both the deck and
the approach slab. The coverage rate for the bridge deck and approach slab was
about 106 sq. ttl gal. At cu rrent prices, the cost of the monomer system would be about
$0.35/ sq. ft.
In order to provide more time to work with the material, an extender was added
to the mix. This extender, provided by Rohm and Haas personnel, decreased the
curing rate of the monomer system. The extender was used from the fifth batch on.
Unfortunately, the temperature of the deck kept increasing (up to about 120 degree F
within an hour after the application was begun), which in turn accelerated the rate of
curing of the material. Thus, even with the added extender, not much time was
available to work with the material. In slight depressions, the material ponded and set
very quickly, creating slick spots on the deck. In order to prevent this, sand was
poured on these areas, right after the monomer was poured, to restore the surface skid
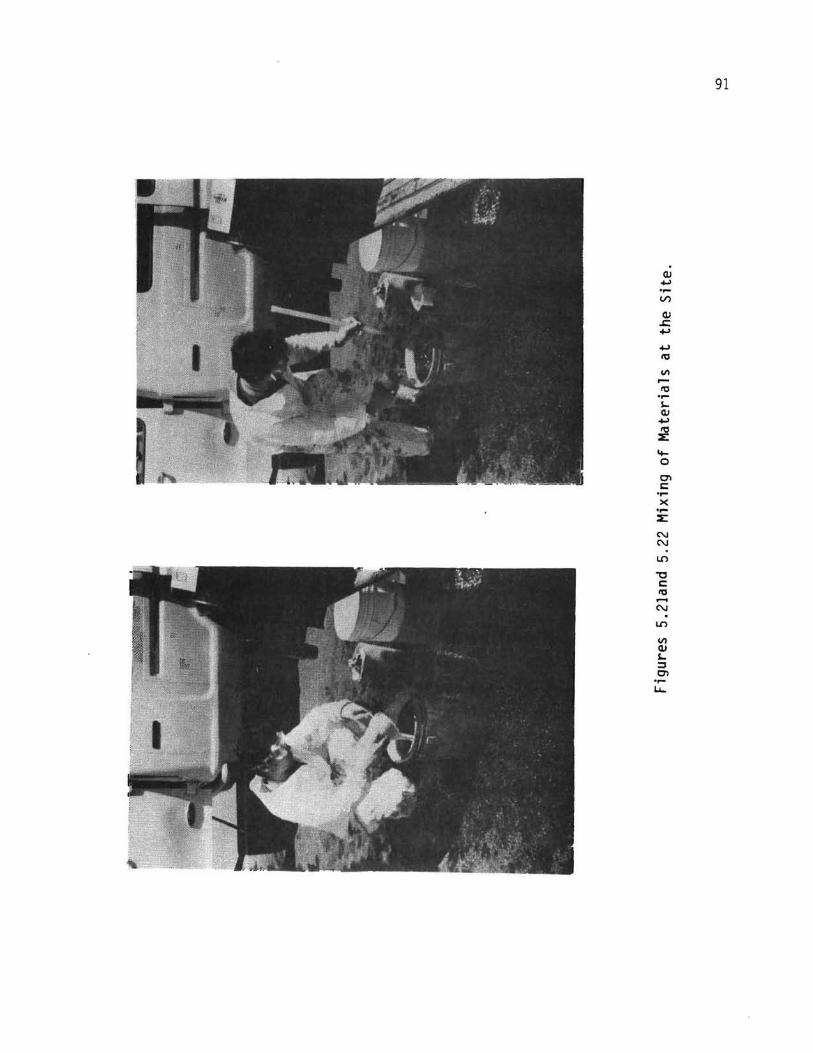
'" '" L()
"'0 s:: 10 ...... '" L()
VI Q) .I.. ::::I 0'1 .,...
LI...
91
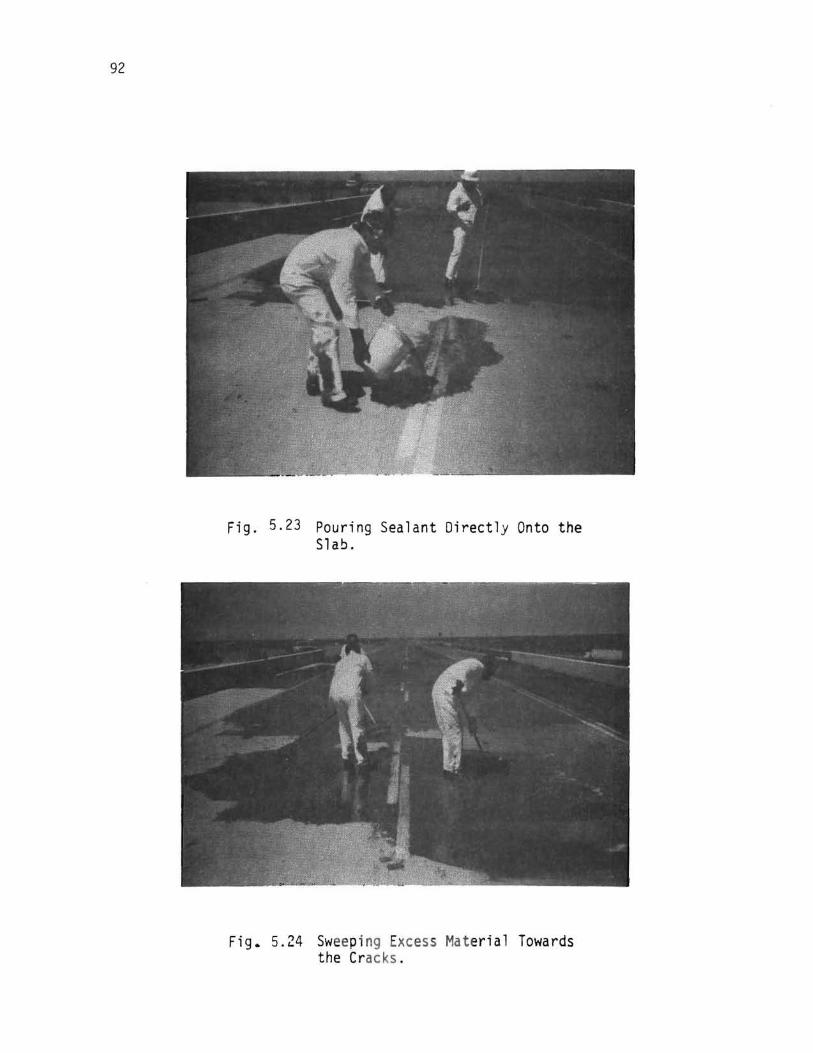
92
Fig. 5.23 Pouring Sealant Directly Onto the Slab.
Fig. 5.24 Sweeping Excess Material Towards the Cracks .
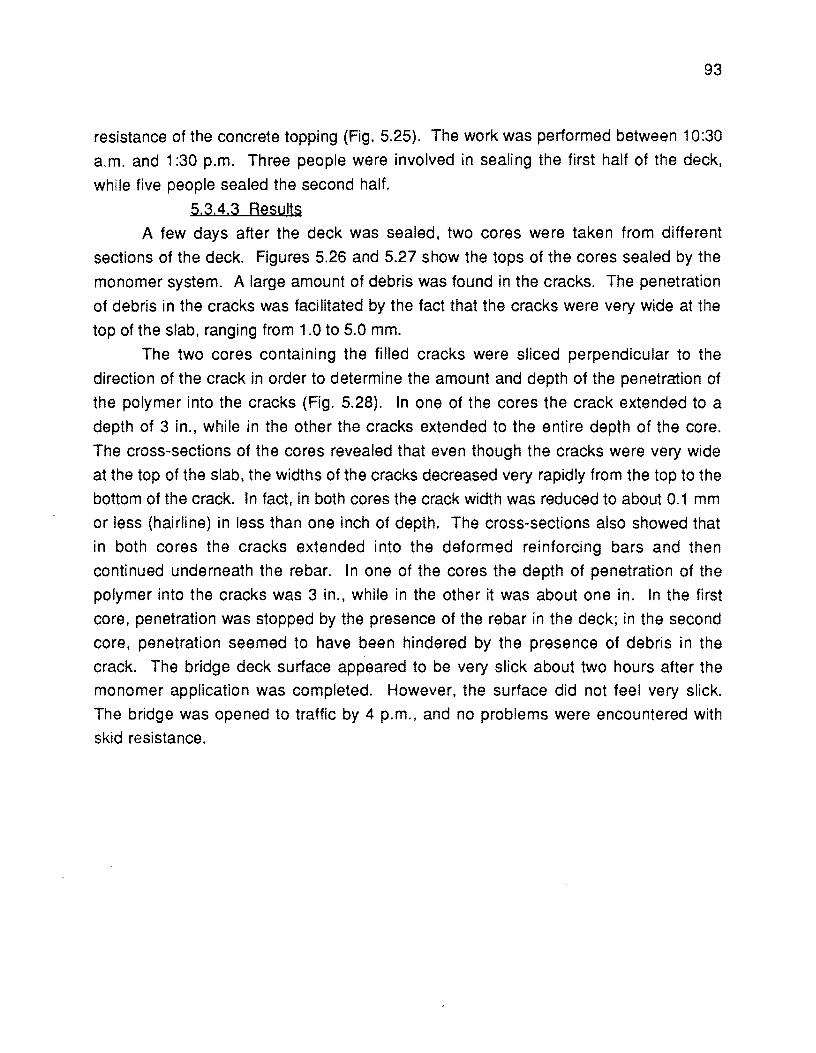
93
resistance of the concrete topping (Fig. 5.25). The work was performed between 10:30
a.m. and 1 :30 p.m. Three people were involved in sealing the first half of the deck,
while five people sealed the second half.
5.3,4.3 Results
A few days after the deck was sealed, two cores were taken from different
sections of the deck. Figures 5.26 and 5.27 show the tops of the cores sealed by the
monomer system. A large amount of debris was found in the cracks. The penetration
of debris in the cracks was facilitated by the fact that the cracks were very wide at the
top of the slab, ranging from 1.0 to 5.0 mm.
The two cores containing the filled cracks were sliced perpendicular to the
direction of the crack in order to determine the amount and depth of the penetration of
the polymer into the cracks (Fig. 5.28). In one of the cores the crack extended to a
depth of 3 in., while in the other the cracks extended to the entire depth of the core.
The cross-sections of the cores revealed that even though the cracks were very wide
at the top of the slab, the widths of the cracks decreased very rapidly from the top to the
bottom of the crack. In fact, in both cores the crack width was reduced to about 0.1 mm
or less (hairline) in less than one inch of depth. The cross-sections also showed that
in both cores the cracks extended into the deformed reinforcing bars and then
continued underneath the rebar. In one of the cores the depth of penetration of the
polymer into the cracks was 3 in., while in the other it was about one in. In the first
core, penetration was stopped by the presence of the rebar in the deck; in the second
core, penetration seemed to have been hindered by the presence of debris in the
crack. The bridge deck surface appeared to be very slick about two hours after the
monomer application was completed. However, the surface did not feel very slick.
The bridge was opened to traffic by 4 p.m., and no problems were encountered with
skid resistance.

94
Fig. 5.25 Pouring Sand Onto the Slab in order to Restore the Surface Skid Resistance of the Concrete Topping.
Fig. 5.26 Top of Core 1.

95
Fig. 5.27 Top of Core 2
Fig. 5.28 Cross-section of Core

96
5.3.4.4 Conclusions
The monomer penetrated one in. in on~ core and 3 in. in the second core.
Penetration did not extend to the full depth of the cracks, apparently due to (1) the
presence of either debris in the cracks or reinfo:"cement running through the cracks; (2)
the small widths of the cracks below the surface; andl or (3) the high temperature of the
deck surface, which led to rapid curing of the material and thus a decrease in the
available time for penetration. The monomer did, however, seal the cracks, which will
prevent the intrusion of water.
Inspection after 15 months showed skid resistance to be good. The glazed
appearance has worn off, and no water is coming through the deck. However some
new cracking has develope'd and it is assumed that the cracking was caused by
contractions andl or flexural stresses since the old crracks have been rebonded.
5.3.5 Sweetwater. Texas Fjeld Study
5.3.5.1 Introduction
A field study in sealing a cracked concrete bridge deck overlay with HMWM was
conducted on the U. S. 70 bridge over Sweetwater Creek in Nolan County just south
of Sweetwater, Texas. The bridge is 40 ft. x 221 ft. (8840 square feet), a two lane traffic
surface with adjacent 8-ft. shoulders. The structure was overlaid in April 1985 with a 2-
in. overlay of portland cement concrete. As significant cracking in the overlay became
apparent a surface treatment for sealing the entire deck with HMWM was scheduled
for August. Additionally the surface was reported as smooth so it was expected that
. the monomer treatment with sand would improve the friction on the deck. It should
also be noted that the deck was aCCidentally sealed with the typical linseed oil
treatment prior to the monomer treatment. The methods of application and materials
involved are described in the following section.
5,3.5.2 Application of Material
After several days of dry weather the entire deck was sanblasted to remove any
road film from the deck surface. The following morning, August 12, 1986, the treatment
began.

97
The monomer system used is a new one. with reduced toxicity, which is
manufactured by the Rohm and Haas Company under the name of PCR 1500 and is
similar to Monomer 200. PCR 1500 is a new monomer that exhibits low toxicity. PCR
1500 uses the same formulation as Monomer 200 (Table 4.1). which allows 40
minutes working time on the deck surface (20 minutes in bulk) at an ambient
temperature of 95 degrees F. The deck temperature ranged from approximately 100
degrees F at 9:30 a.m. to 110 degrees F by 1 :30 p.m.
The deck was closed on one side of the centerline to allow the sealing
operations to proceed, and traffic used the other half of the bridge. After the first
application cured (in approximately two hours) the traffic was switched to the other
side to permit sealing the second half of the deck.
The treatment consisted of hand-mixing the monomer and the catalyst and
initiator in a five-gal. open top can and pouring the mixture onto the deck. Because of
the quantity of cracking and because of the need to permanently seal the deck while
healing the cracks, the material was moved with push brooms and squeegees. The
monomer system was broomed back and forth across the cracks at short intervals to
insure that the cracks were filled and that, as monomer slowly seeped deeper into the
cracks, the crack would remain 'filled.
The squeegees helped to make sure that only a thin coating of monomer was
applied to the entire deck. This was done not only to get a good application rate but to
avoid ponded areas of monomer in slight surface depressions and irregularities, since
ponded monomer will cure to a glossy surface with poor skid resistance. However, a
good sealing job with HMWM will cure to a textured sheen which gives the false appearance of poor skid resistance. This has been noted on many bridges throughout
the U. S. Although unponded monomer treatments have resulted in good skid
properties, the best skid numbers are insured by broadcasting a light application of dry
sandblast sand (typically 10 to 20 seive size) at a rate of 0.2 Ib per sq. yd. (about 4500
sq. ft. per 100 Ib). This sand application was made on this bridge deck. However, the
first section began to harden before the sand was spread so that one-sixth of the
surface area had very little sand texturing.
While the monomer application rate typically ranges from 80 to 120 sq. ft.l gal.,
the actual rate on this deck was 160 sq. ft.! gal. This unusually high application rate

98
was due to the fact that the deck had inadvertantly been treated with linseed oil one
month earlier by personnel who were unaware of the scheduled monomer treatment.
The linseed oil treatment is part of the routine general bridge maintenance
procedures.
~.3!5.3 Results
Even as the traffic was turned onto the sealed bridge the slightly glazed
appearance caused doubts about proper skid resistance on the deck. Two weeks
after the monomer application, a skid trailer was run over the bridge. The six skid
readings ranged from 37 to 45 with an average of 42, a very acceptable skid number
forthe SDHPT.
No cores have been obtained for evaluation of the crack filling.
~.3.5.4 Conclusions
At this time, until the cores are evaluated for depth of monomer penetration, the
only conclusion to be drawn is that the monomer treatment provided a good skid
resistant coating on the deck.
After a year or two it will be easier to determine longer term sealing properties.
However, at this pOint the SDHPT personnel are pleased with the treatment.
* Cores will be evaluated in time for the final report.
5.4 Cost
The cost of the HMWM monomer has varied over the time the field studies were
conducted. The cost as of November 1987 is approximately $371 gal. The application rate in generally in the range of 80 to 120 sq. ft.l gal which results in a monomer cost of
$.31 to $.46/ sq. ft. Labor costs can vary considerably depending upon many
variables: area to be treatd, method of application, weather conditions, condition of
deck, and traffic conditions. The Monahans bridge deck required about 15 manhours
of labor (including the person mixing the monomer) or a rate of approximately 500 sq.
ft.lmanhour. This rate includes monomer application only; mobilization, travel, clean
up, and traffic control are not included. If the effective rate were 100 sq. ft.l manhour at

99
an average rate of $101 hour, the labor cost would only be $0.101 sq. ft., resulting in a
cost considerably less than $1.001 sq. ft.
One of the attractive features of the HMWM is that it can be applied by
maintenance personnel, eliminating the need for outside contractor. Some training of
personnel in the use of the materials would be required, but it would not require
extensive time or unusual skills. Special equipment would not be required unless very
large areas are treated. Spray bars are available from one of the manufacturers (the
Rohm and Haas Company).
5.5 Safety
Some of the HMWM monomers used in this study have been forced to be toxic.
The use of those materials requires protective clothing and minimal skin contact.
However new monomers have been developed that exhibit low toxicity. One of these,
PCR 1500, very similar to Monomer 200, was used in the Sweetwater bridge
treatment. The new low toxicity monomer will be furnished in the future. However, the
manufacturer's instructions concerning safety and handling should be carefully
followed.
The initiator and catalyst (Table 4.2) should never be mixed together in
concentrated form since a violent reaction will occur.

!!!!!!!!!!!!!!!!!!!"#$%!&'()!*)&+',)%!'-!$-.)-.$/-'++0!1+'-2!&'()!$-!.#)!/*$($-'+3!
44!5"6!7$1*'*0!8$($.$9'.$/-!")':!
Chapter 6
Conclusions and Recommendations
6.1 Conclusions Three methods were investigated for repairing cracks in concrete: (1) enlarging
cracks with a crack cutter and filling with polymer; (2) epoxy injection; and (3) high
molecular weight methacrylate monomer treatment. All three methods were found to
be effective for some conditions.
The following specific conclusions can be drawn:
1. Relatively wide cracks in concrete pavements can be enlarged to a one~in.
width and a depth of one to two in. and then filled with polymer concrete consisting of
sand saturated with a low viscosity monomer system. The polymer concrete bonds
well to the cqncrete. Many miles of cracks have been repaired successfully on I 610
since 1980.
2. Laboratory tests on epoxy injection indicated that 85 to 90 percent of cracks
in concrete test specimens could consistently be filled. However, temperatures of 40
degrees F were found to significantly increase the cure time and to reduce the
recracking strength of the repaired crack. Field tests indicated that debris-filled cracks
can be successfully filled, but considerable time is required.
3. The use of high molecular weight methacrylate monomer system to repair
cracks proved very beneficial for most applications. Laboratory tests showed that
concrete with crack widths as small as 0.2 mm can be filled to 95 percent or more of
their depth by mopping the monomer system on to the surface. For saturated concrete,
small cracks (0.2 to 0.6 mm) can be filled to about 50 percent of their depth after 24
hours of drying; wider cracks can be filled even more.
The monomer treatment can provide a bond stronger than the concrete. Many
specimens, upon recracking, form cracks outside the repair zone.
Many field tests were performed, primarily on bridge decks. The treatments
were generally successful in sealing the cracks unless the cracks were filled with silt or
debris. The application rate ranged from 80 to 160 sq. ft.l gal., and 2000 to 3000 sq. ft.l
hr. of bridge deck can be treated without the use of mechanical equipment. The
101
102
monomer cures in one to two hours to a glazed finish which has an adequate skid
resistance, particularly if a light application of sar,d is broadcast on the surface.
The current cost of the monomer is approximately $37/ gal. For application
rates of 80 to 120 sq. ft.l gal, the cost of monomer will range from $.31 to $.46/ sq. ft.
6.2 Recommendations
6,2.1 Polymer Concrete Crack Repairs
Polymer concrete can be used to seal cracks and restore some structural
integrity to the concrete. The crack must be sufficiently wide for the polymer concrete
to be placed. The following procedures are recommended:
1, Enlarge the crack (unless the width is at least 0.5 in.) with a crack cutter or
router to a width of one in. and a depth of 2 in. Water should not be used in
the cutting operation since it will fill the crack below the enlarged zone,
preventing the monomer from penetrating the crack.
2, Blowout the crack with compressed air.
3. Fill the enlarged crack with clean, dry, well-graded concrete sand.
4. Saturate the sand with a methyl methacrylate (MMA) monomer system,
described in Reference 4. The monomer can be mixed and poured over the
sand by means of a sprinkler can. The sand should be rewetted with
monomer every few minutes to replace the monomer which has evaporated
and/ or penetrated into the narrow crack below, Polyethylene membrane
can be placed over the crack to minimize evaporation. In lieu of MMA, a
high molecular weight monomer system, described in Chapter 4, can be
used. The repaired surface can generally be turned back to traffic within one
to two hours.
6.2.2 Epoxy Injection
Epoxy injection can be effectively used where one or more of the following
conditions exist; (1) structural integrity must be fully restored; (2) cracks are deep and
narrow; and (3) cracks contain debris and/ or moisture.
103
Most epoxy injection is performed by professional applicators, and detailed
recommendation on procedures will not be made since they are dependent upon the
existing conditions, type of injection equipment, and type of epoxy used.
2,2.3 High Molecular Weight Monomer Application
The use of high molecular wieght methacrylate monomer system has been
shown to provide good crack sealing and bonding for concrete bridges and
pavements. The recommended procedures are as follows:
1. The concrete should be dry after a rain; a minimum of at least one
day and preferably two should elapse prior to monomer
application. It is also desirable to have the surface relatively cool
to ensure open cracks and to prevent prenative polymerization of
the monomer.
2. The surface should be clean. If the surface has been exposed to
traffic, a light sandblast should be applied.
3. One of the monomer systems, preferably Monomer 1100 or the
equivalent, should be mixed in accordance with the formulation
given in Table 4.2. Precaution should be taken not to directly mix
the initiator and catalyst together since a violent raction will occur.
If the monomer is to be applied by hand, four to five gallion
batches should be mixed and poured over the deck. Workers
dressed in protective clothing should spread the monomer with
push brooms or squeegees. The monomer should be pushed
back and forth over the cracks to provide an adequate supply of
monomer to keep the cracks full. Excess monomer should be
pushed onto untreated portions of the deck before it begins to gel.
Monomer should not be permitted to pond in depressions; if
ponding cannot be prevented, clean dry sand should be sprinkled
over the ponded areas.
4. For large areas, monomer spray bars are available from one of the
monomer manufacturers (the Rohm and Haas Company). The
spray bar can be pulled behind a tow vehicle at one to three miles
104
per hour. The monomer, initiator, and catalyst can mixed
mechanically in correct proportions.
5. After the monomer has been applied and before it has cured, a light application of sand at the rate of 0.25 to 0.30 Ib/ sq. yd. should
be made. 6. Cleaning of brooms, tools, and containers can be done with plain
soap and water while the monomer is still liquid. After the
monomer polymerizes it can often be cleaned up with acetone,
methyl ethyl ketone, or chlorinated hydrocarbon solvents like methylene chloride, or trichloroethylene.
The monomer manufacturer should be consulted for specific recommendations
concerning safety and handling of the monomer.

REFERENCES
1. Meyer, Alvin H., McCullough, B. Frank, and Fowler, David W., "Polymer Concrete for
Precast Repair of Continuously Reinforced Concrete Pavement on IH 30, Near
Mt. Pleasant," Research Report 246-1, Project 3-18-79-246, Center for
Transportation Research, Bureau of Engineering Research, The University of
Texas at Austin, August 1981.
2. Fowler, David W., Meyer, Alvin H., and Paul, Donald R., "Polymer Concrete for
Pavement Repair and Rehabilitation," Research Report 246-3, Project 3-18-79-
246, Center for Transportation Research, Bureau of Engineering, The University
of Texas, May 1983.
3. Fowler, David W., Meyer, Alvin H., and Paul, Donald R., "Implementation Manual for
Polymer Concrete Repair," Research Report 246-4F, Project 3-9-79-246,
Center for Transportation Research, Bureau of Engineering Research, The
University of Texas at Austin, December 1983.
4. Marsh, Danny, Simonsen, W.J., and Fowler, David W., "Machine Application of
Polymer Concrete for Highway Repairs, "Polymer Concrete Uses. Materials.
and Properties, Publication SP-89, American Concrete Institute, pp. 1-17.
5. "Use of Epoxy Compounds with Concrete," American Concrete Institute, ACI 50312-
80, 1980, Detroit, Michigan.
6. Mangum, Wayne D., "Improved Methods for Sealing Joints and Cracks in Portland
Cement Pavement," M. S. Thesis, The University of Texas at Austin, December
1984.
8. Bermudez-Goldman, Alejandro J., "Mechanical and Durability Investigation of a
Modified High Molecular Weight Methacrylate Polymer Concrete," M. S. Thesis,
University of Texas at Austin, May 1986.
105


