
REPORT ON STUDIES OF
SOIL MODULUS AND DAMPING
SAN ONOFRE SITE
June 4, 1985
8506060505 850604 PDR' ADOCK 05000206 R PDR
REPORT ON STUDIES OF
SOIL MODULUS AND DAMPING
SAN ONOFRE SITE
1.0 INTRODUCTION
This report has been prepared to answer questions which have
been raised by the. staffs of NRC and LNL regarding the effects of sample disturbance, test conditions, and other
possible sources of inacurracy in the determination of the
soil moduli and damping at the site of the San Onofre
reactors. The evaluation of modulus and damping parameters
was done in the early 1970s and documented as the design
basis for the SONGS 2 and 3 project. The questions
presently being asked were reviewed internally within the
Woodward-McNeill organization during that time period. The
present report is the result of a review of the files from
that period to compile from various sources the reasoning
and actions on each point, and to present the results in
condensed form for review.
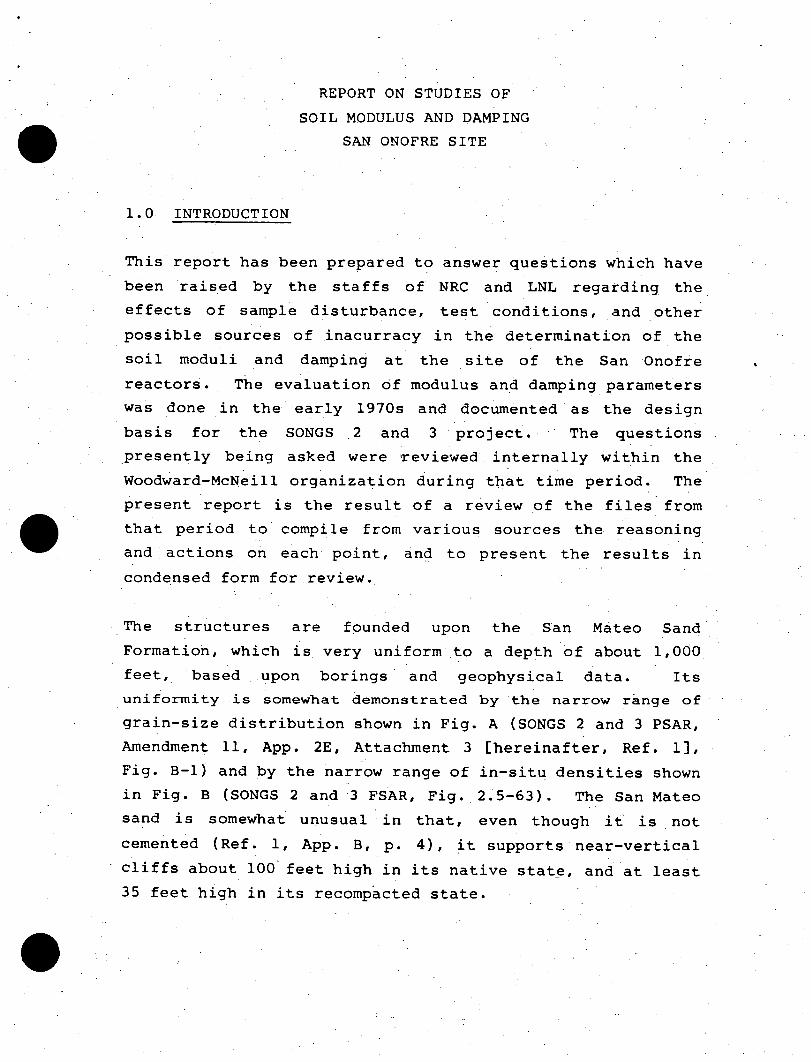
The structures are founded upon the San Mateo Sand
Formation, which is very uniform to a depth of about 1,000
feet, based upon borings and geophysical data. Its
uniformity is somewhat demonstrated by the narrow range of
grain-size distribution shown in Fig. A (SONGS 2 and 3 PSAR,
Amendment 11, App. 2E, Attachment 3 [hereinafter, Ref. 1],
Fig. B-l and by the narrow range of in-situ densities shown
in Fig. B (SONGS 2 and 3 FSAR, Fig. 2.5-63). The San Mateo
sand is somewhat unusual in that, even though it is not
cemented (Ref. 1, App. B, p. 4), it supports near-vertical
cliffs about 100 feet high in its native state, and at least
35 feet high in its recompacted state.
-2
The tests performed, and to be reported here, were: density
tests, in the laboratory on intact Modified California,
Pitcher and hand-carved samples, and in the field.by sand
cone methods; conventional field crosshole seismic tests;
cyclic laboratory tests measuring deformation from platen to
platen in most cases and in the middle third of the sample
in two cases; controlled field dynamic-response experiments
on large-scale (10-ft diameter, 5-ft thickness) concrete
foundations and field attenuation tests. The modulus -and
damping results will be summarized here, along with the
derivations of the resulting.design curves.
2.0 EFFECTS OF SAMPLE DISTURBANCE
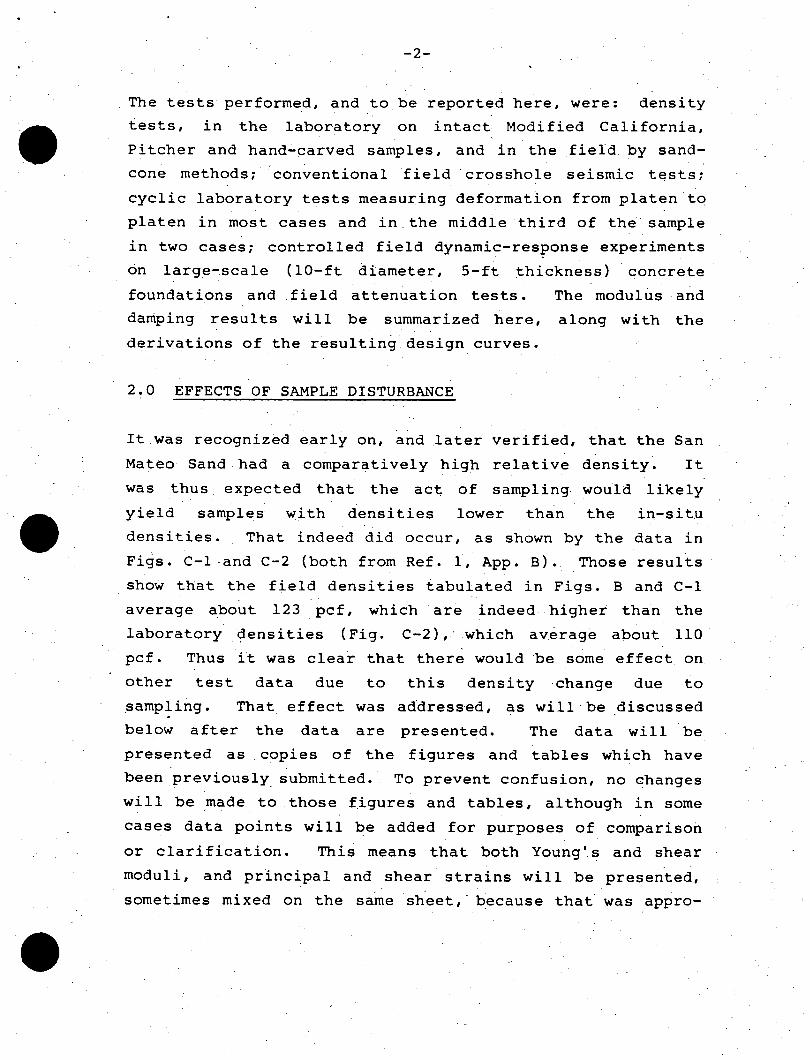
It was recognized early on, and later verified, that the San
Mateo Sand had a comparatively high relative density. It
was thus. expected that the act of sampling would likely
yield samples with densities lower than the in-situ
densities. That indeed did occur, as shown by the data in
Figs. C-1-and C-2 (both from Ref. 1, App. B). Those results
show that the field densities tabulated in Figs. B and C-1
average about 123 pcf, which are indeed higher than the
laboratory densities (Fig. C-2), which average about 110
pcf. Thus it was clear that there would be some effect on
other test data due to this density -change due to
sampling. That effect was addressed, as will be discussed
below after the data are presented. The data will be
presented as copies of the figures and tables which have
been previously, submitted.. To prevent confusion, no changes
will be made to those figures and tables, although in some
cases data points will be added for purposes of comparison
or clarification. This means that both Young's and shear
moduli, and principal and shear strains will be presented,
sometimes mixed on the same sheet,' because that was appro-

-3
priate for the use of the original document at that time.
Thus, in the material below, it will be necessary to remain
continuously aware of which parameter is being presented.
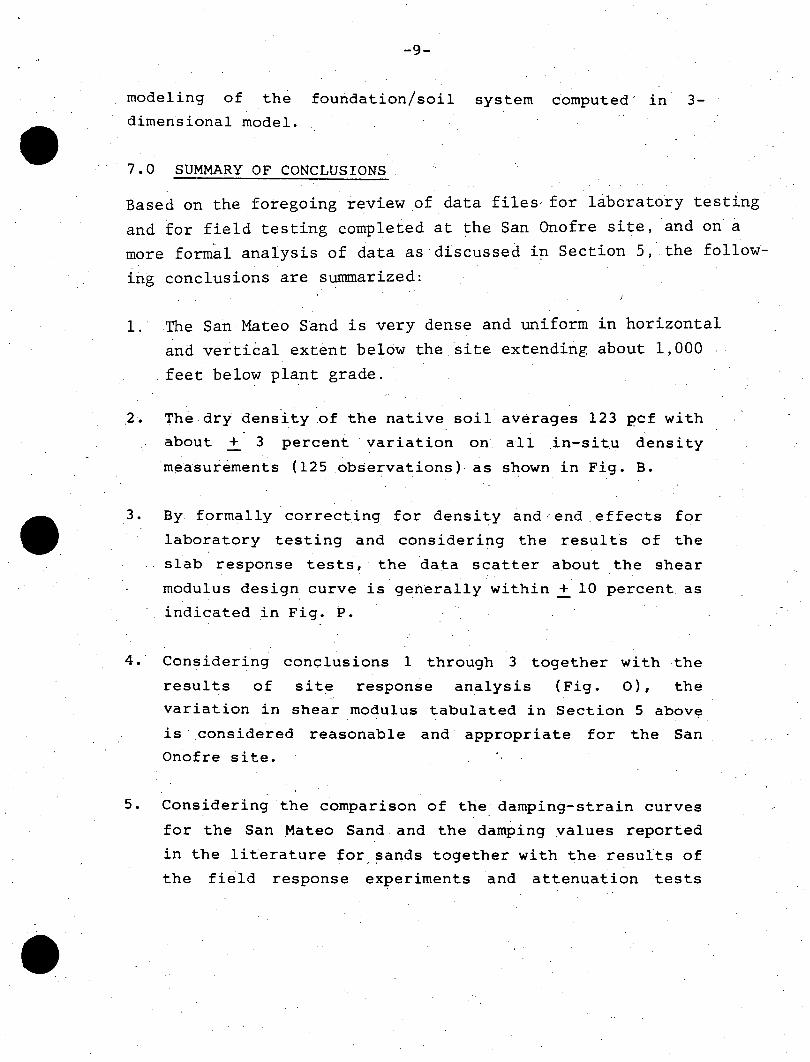
The basic data for modulus as a function of confining
pressure and strain are given in Fig. D (Ref. 1, App. B).
Those are cyclic triaxial data, for which the strains are
computed from the platen-to-platen deformations. It was
recognized at that time that the platen-to-platen strains
can in some cases be larger than the strain in the soil at
some distance away from the platen, near the center of the
sample. This is due to boundary conditions at the soil
platen interface, and because the density at the lesser
disturbed center of the sample are probably more nearly
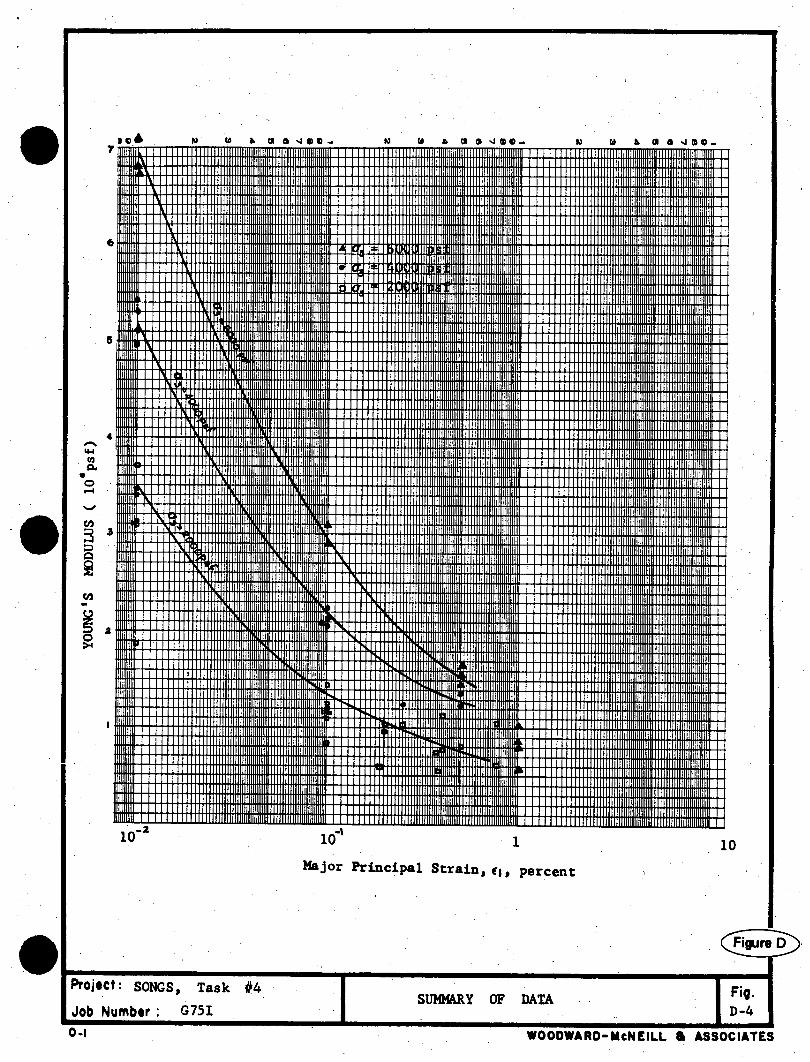
equal to those in the field. For that reason, a special
(for that time) test was done to evaluate the possible
effect. Fig. E (Ref. 1, App. E) shows the test set-up, in
which the deformations were simultaneously measured between
the platens and between the one-third points along the
sample height. The samples were 4-inch diameter by 8-inch
high. The results showed that the platen-to-platen strains
were about'2.5 times the third-point strains. Because the
strain enters into the modulus calculation, it was necessary
to multiply the (platen-to-platen) moduli by 2.5, and of
course to multiply all strains by 1/2.5 = 0.4, as is demon
strated by lines 1 and 2 in Fig. F (Ref. 1,-App. E).
Recognizing that the San Mateo Sand is an unusual material,
it was felt prudent to -.investigate whether dependence of
modulus upon the conventional 1/2 power of confining
pressure would apply to this material. The results of that
study are given in Fig. G (Ref. 1,, App. E). A close fit to
the data for the range of strains of interest shows that the
modulus depends more nearly upon the 2/3 power of the con-
-4
fining pressure, so that value has been used for the
* project..
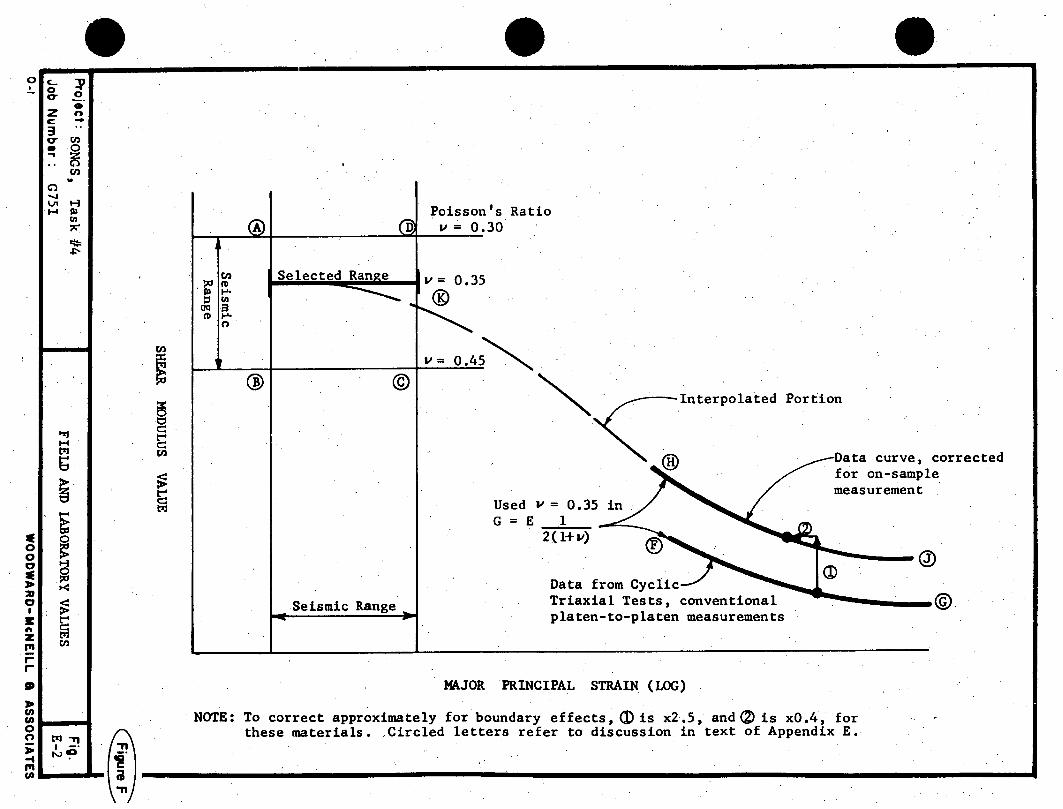
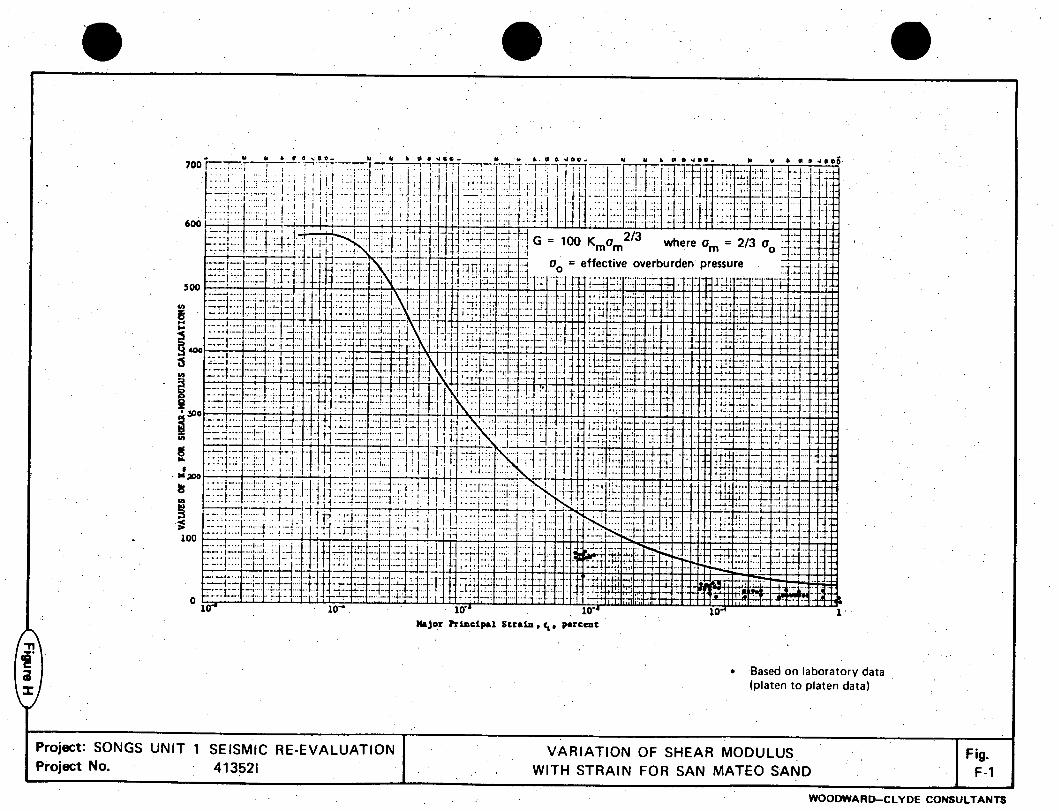
The raw data are shown again in Fig. H, along with the
resulting corrected modulus-strain curve, recommended for
analysis for the SONGS 1 project ("Soil Backfill Conditions"
enclosure to letters K. P. Baskin [SCE] to D. M. Crutchfield
[NRC] dated 18 April and 1 September 1983 [hereinafter Ref.
2], App. F, Fig. F-1, with data points added).
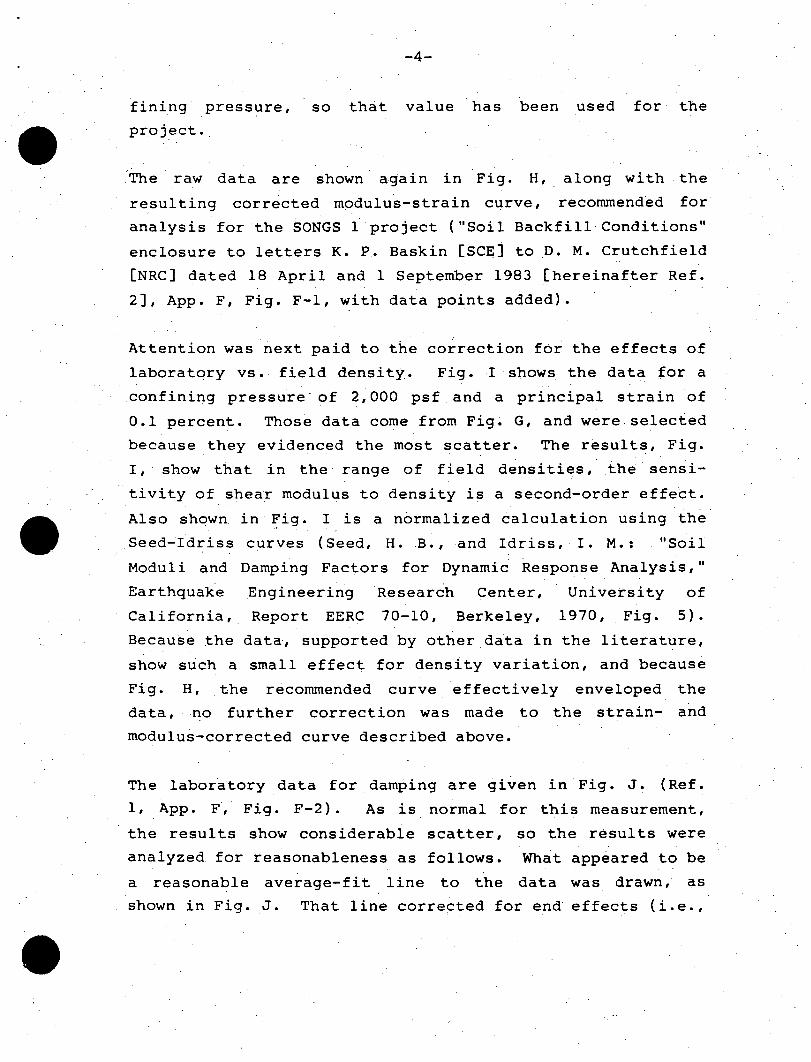
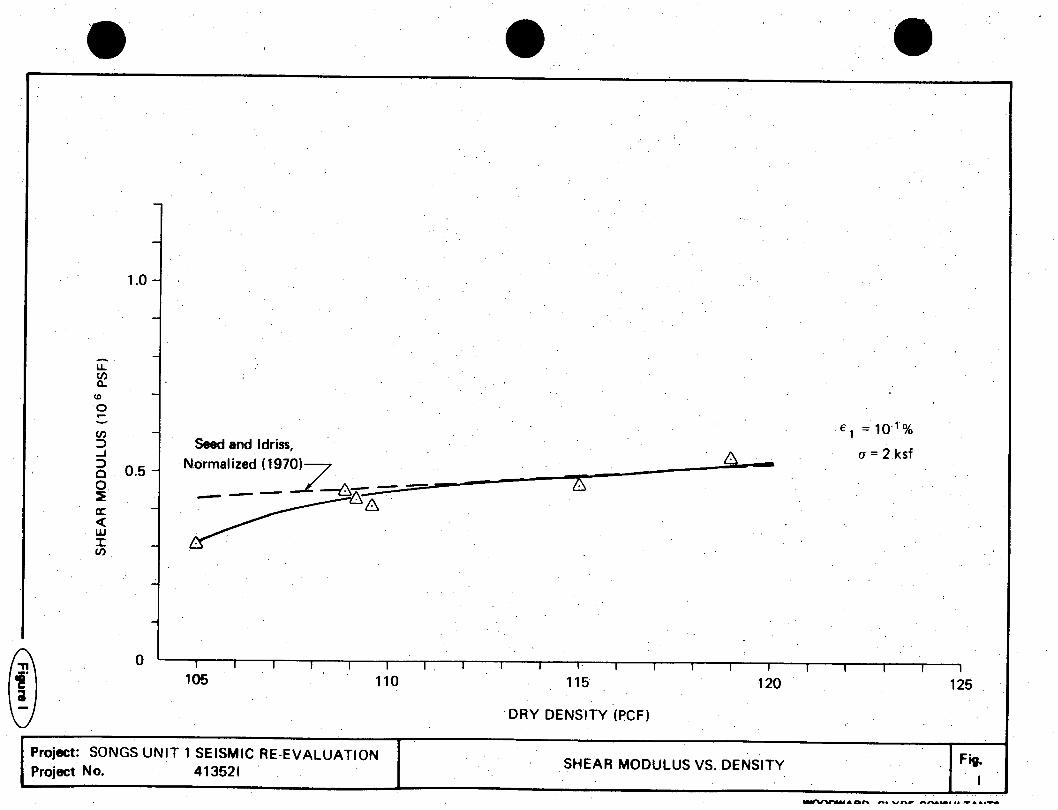
Attention was next paid to the correction for the effects of
laboratory vs. field density. Fig. I shows the data for a
confining pressure of 2,000 psf and a principal strain of
0.1 percent. Those data come from Fig. G, and were selected
because they evidenced the most scatter. The results, Fig.
I, show that in the range of field densities, the sensi
tivity of shear modulus to density is a second-order effect.
Also shown in Fig. I is a normalized calculation using the
Seed-Idriss curves (Seed, H. B., and Idriss, I. M.: "Soil
Moduli and Damping Factors for Dynamic Response Analysis,"
Earthquake Engineering Research Center, University of
California, Report EERC 70-10, Berkeley, 1970, Fig. 5).
Because the data, supported by other data in the literature,
show such a small effect for density variation, and because
Fig. H, the recommended curve effectively enveloped the
data, no further correction was made to the strain- and
modulus-corrected curve described above.
The laboratory data for damping are given in Fig. J. (Ref.
1, App. F, Fig. F-2). As is normal for this measurement,
the results show considerable scatter, so the results were
analyzed for reasonableness as follows. What appeared to be
a reasonable average-fit line to the data was drawn, as
shown in Fig. J. That line corrected for end effects (i.e.,

-5
strain times 0.4) is shown drawn as "San Mateo Sand" in Fig.
K (Ref. 2, App. F, Fig. F-6), for comparison to data from
the literature (see Seed and Idriss, 1970, referenced above,
Fig. 10) That comparison shows that the selected damping
curve lies in the range of, or a little below the data in
the literature. Considering the unusual nature of the San
Mateo sand the comparison was, found to be reasonable, so the
curve of Fig. J was used, in the form of Fig. K.
3.0 FIELD EXPERIMENTS
A. number of large-scale dynamic response experiments were
performed upon 10-foot diameter foundations which were 5
feet thick. The totality of the data and analysis are given
in the Units 2 and 3 FSAR, App. 3.7C, to which further
reference will be omitted in the rest of this section. The
experiments involved setting the slabs into transient motion
in various modes, and measuring their responses with respect
to time. Setting the slabs into motion was accomplished by pulling on the foundations in the proper direction to excite
the desired mode, using various force links designed to
break at given loads. The latter allowed the excitation of
various strain levels-.
The moduli were calculated using the measured amplitudes and
the spring constant for that foundation in that mode using
the theory of the elastic half-space (see, for example,
McNeill. R. L.: "MACHINE FOUNDATIONS, The State of the
Art," Proceedings, Specialty Session on Soil Dynamics,
Seventh International Conference on Soil Mechanics and
Foundation Engineering, 1969). The dampings were calculated
using the rate at which the vibrations decayed (See McNeill,
reference above).
-6
The results for shear moduli are shown overplotted on the
recommended design curve in Fig. L (Ref. 2, App. F, Fig. F-1
with data points added). The points reasonably fit the
design curve, and give support for the raising and shifting
of the curve described in Section 2 above.
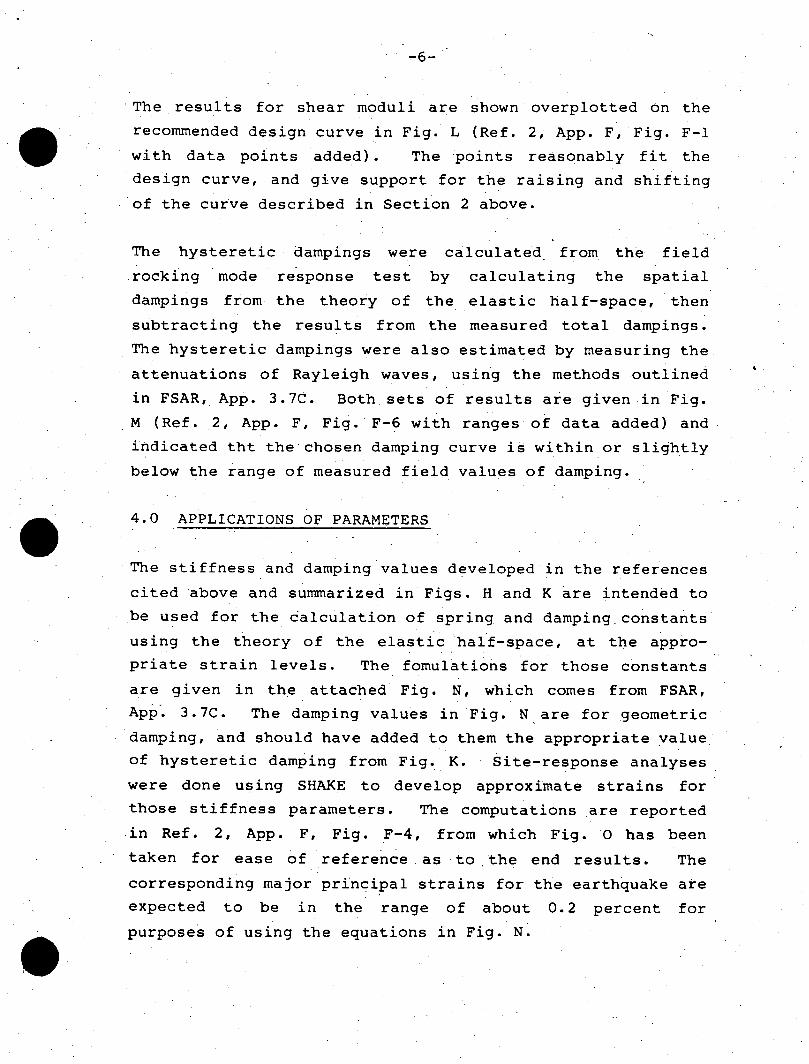
The hysteretic dampings were calculated from the field
rocking mode response test by calculating the spatial
dampings from the theory of the elastic half-space, then
subtracting the results from the measured total dampings.
The hysteretic dampings were also estimated by measuring the
attenuations of Rayleigh waves, using the methods outlined
in FSAR, App. 3.7C. Both.sets of results are given in Fig.
M (Ref. 2, App. F, Fig. F-6 with ranges of data added) and
indicated tht the chosen damping curve is within or slightly
below the range of measured field values of damping.
4.0 APPLICATIONS OF PARAMETERS
The stiffness and damping values developed in the references
cited above and summarized in Figs. H and K are intended to
be used for the calculation of spring and damping constants
using the theory of the elastic half-space, at the appro
priate strain levels. The fomulations for those constants
are given in the attached Fig. N, which comes from FSAR,
App. 3.7C. The damping values in Fig. N are for geometric
damping, and should have added to them the appropriate value
of hysteretic damping from Fig. K. Site-response analyses
were done using SHAKE to develop approximate strains for
those stiffness parameters. The computations are reported
in Ref. 2, App. F, Fig. F-4, from which Fig. 0 has been
taken for ease of reference as to the end results. The
corresponding major principal strains for the earthquake are
expected to be in the range of about 0.2 percent for
purposes of using the equations in Fig. N.

-7
5.0 VARIATION OF PARAMETERS
All. of the stiffness data have been plotted in Fig. P to
allow an evaluation of the range of variation, but the data
have been treated more formally than previously, as
discussed below:
The raw data from Fig. H have been corrected for density
variation between field and laboratory to 123 pcf using the
data typified by Fig. I (which is an example of the broader
suite of data), and the results are shown by the solid
triangles in Fig. P. A curve, the lower dashed one, has
been fitted to those density-corrected data; and that curve
has been strain-corrected by the methods of Fig. F to
achieve the Laboratory-Corrected curve, which is the upper
dashed curve in Fig. P. The density-corrected laboratory
data at high strains show a variation of less than 10
percent from the fitted (lower dashed) curve; and the
strain-corrected curve from those data agrees exactly with the design curve, except for a small variation (less than 5
percent) at the lower strains which, Fig. 0, are below the
range of interest to this project.
The data in Fig. P also include the platen-to-platen and
center-third dynamic triaxial data, shown as the solid
squares. These were the basis for the corrections made as
shown in Fig. F. Of the modulus values measured directly
from -the center-third of the sample (Points B and D), one
point (B) lies on the design curve; and the other (D) lies
slightly above (about 10 percent) that curve (the test
conditions of test C-D were suspect, in that the platens did
not appear to have been properly seated at the start of the
test. These data were therefore not relied upon for this
project, but are shown here for the sake of completeness).
0I

The field test data are shown in Fig. P as the solid dots.
Those data lie within 10 percent of the design.curve, except
for the two low strain points that lie below the curve by
about 15 to 20 percent.
On the basis of these data, the variations shown below were
recommended.
Resulting Variation Source of Variation Stiffness Parameters
Flexible Structure Large Rigid with Strip and Foundation Isolated Foundation
Soil Properties
due to areal variations 0 + 5 percent at the site
due to + 30 percent + 10 percent + 10 percent variation in seismic induced strain
SSI Methodology + 10 percent + 20 percent
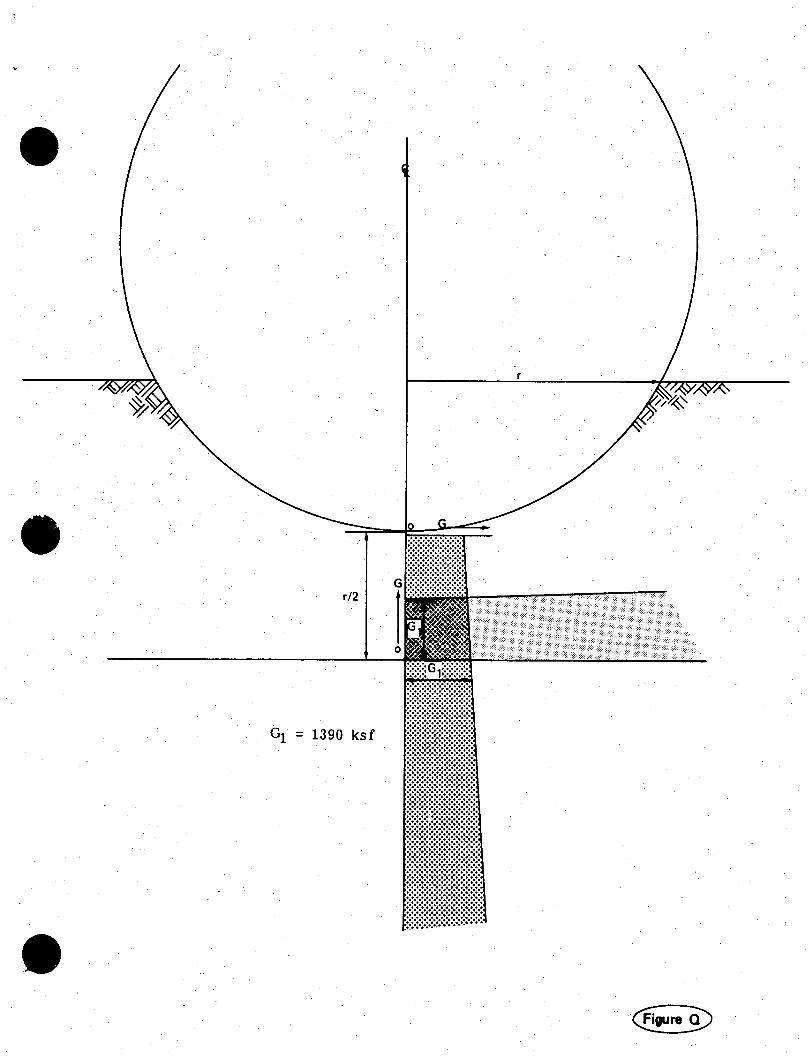
6.0 DESIGN VALUES FOR CONTAINMENT
The design shear modulus for the Unit 1 Reactor Building has
been calculated at a plane under the structure at a depth of
half the radius of the sphere at the ground surface. That
depth choice is not particularly important because the
modulus does not vary strongly in either the vertical or the
horizontal planes, as shown in Fig. Q. That value of shear
modulus is 1,390 ksf, for the assumptions described, and
using a shear strain of about 0.2 percent from Fig. 0.
The design damping should be made up of two parts: a
constant value of 12 percent (Fig. K) for hysteresis; and a
geometric value, which is dependent on 3-dimensional
0I
-9
modeling of the foundation/soil system computed' in 3dimensional model.
7.0 SUMMARY OF CONCLUSIONS
Based on the foregoing review of data files for laboratory testing
and for field testing completed at the San Onofre site, and on a
more formal analysis of data as discussed in Section 5, the follow
ing conclusions are summarized:
1. The San Mateo Sand is very dense and uniform in horizontal
and vertical extent below the site extending about 1,000
feet below plant grade.
2. The dry density of the native soil averages 123 pcf with
about + 3 percent variation on all in-situ density
measurements (125 observations)as shown in Fig. B.
3. By formally correcting for density and end effects for
laboratory testing and considering the results of the
slab response tests, the data scatter about the shear
modulus design curve is generally within + 10 percent as indicated in Fig. P.
4. Considering conclusions 1 through 3 together with the
results of site response analysis (Fig. 0), the
variation in shear modulus tabulated in Section 5 above
is considered reasonable and appropriate for the San
Onofre site.
5. Considering the comparison of the damping-strain curves
for the San Mateo Sand and the damping values reported
in the literature for sands together with the results of
the field response experiments and attenuation tests

-10
shown in Fig. M, it is concluded that the hysteretic
damping curve is both reasonable and appropriate for
design and analysis purposes.
6. The uniformity of the site subsurface conditions (i.e.,
no layering) and the compatibility of the field response
experiments results with elastic half space theory
(SONGS 2 and 3 FSAR, App. 3.7C) support the use of the
relationships for spring constant and spatial damping
shown in Fig. N for design and analysis of structures.
7. In the case of the Unit 1 Reactor Building, for which
special analysis is being completed, the shear modulus
and hysteretic damping parameters for input to the
analysis are computed based on conclusions 1 through 5
to be 1390 ksf and 12 percent, respectively.

PERCENT PASSING
00
0
W c L4 v
-------------------------------->0
4
w z
22
w
fn N PECN PASN
Prj c ONS.a k 4Fg
I.JobNumber G75IGRAIN IZE DITRIBUINCUVS 0- ODWR -MNEL ,SSCAF

30.
4.4
-H
20-.
(A
0 2 4.1Z
10.
116 118 120 122 124 126 128
Dry Density (pdf)
SAN ONOFRE NUCLEAR GENERATING STATION
Units 2 & 3
RESULTS OF SAND CONE TESTS ON INSITU SAN MATEO SAND
Figure 2.5-63
e07-11D-559
2SE

TABLE B-1
Field Density Data
In-Situ In-Situ Water
Test Depth Below Dry Density, Content Test Pit No. Existing Grade pcf %
TP-1 .1 5 ft 128.0 2.0
TP-2 1 ground surface 123.5 0.3
TP-2 2 ground surface 125.0 0.3
TP-2 3 9 ft 116.1 2.4
TP-2 4 10 ft 113.7 2.2
f

TABLE B-II
Laboratory Density Data
Depth Below Dry Water
oring or Sample Existing Sample Density Content est Pit No. Grade (ft) Type pcf %
TP-1 1 6 HC 105 4.7 TP-2 1 9 HC 115 3.0 TP-2 2 9 HC 111.9 B2 la 16 PB 106.9 16.9 B2 lb 16 PB 109.6 15.6 B2 lc 16 PB 109.2 15.6 B2 2a 18 PB 106.8 16.1 B2 2b 18 PB 108.6 16.0 B2 2c 18 PB 108.9 15.3 B4 4a 40 PB 107.3 17.1 B4 4b 40 PB 111.8 16.5 B4 C4 18 SP 106.6 2.1
C5 23 SP 100.7 3.0 C6 28 SP 114.2 12.1 C7 33 SP 120.1 10.1
Key (see Appendix A.2)
PB = Pitcher Barrel HC * Hand Carved SP = Standard Penetration
Pot 4 0ee 0ee -40 4 a ' CDCee a A ha 0e
I 11111 i l ' '
I I I I IIIIIt l
lillil il A I I I il]l 1
111...T1m 11111iil i
I I 1 13 4_lI f i 1111 1
I IIM IA tiHill111 I l il]II
I li 1 111
Im 1I 11 I
4 Il1 Il I
11117 1 1 1 1 1 1 1 1 1 1 11 illliIIl . .I J A lilN III it 1 1 i t] 1 .1 1
IliI B li I
IllII! I Nm dllll a B ! I ll111iill
111IIIN IIlR I 11 111 iI IIIIIIH11
Ilfl 11ill i l I iIIh I 1 1 1111 1id I I
1011 10 1 10 MI jori Prnia Stan Is percent
Jo Number ; G75 D-Itil
0 d4 WOODWARD-McNEILLf&lASSOIATE

Air Pressure for Dynamic Cyclic Deviator Stress ( lcps for these tests)
Electrical Force Link Vertical LVDT
To Read-Out Instruments
Horizonta Vertical LVDT s.V
*. .Triaxial Cell
. .. ,S eci en encas d in w ter air-proo membrane
NOTE:*LVDT(Linear Variable Differential Transformer) reads displacement *Force Link reads load *All 6 traces are displayed on light sensitive paper with load and displacement as the ordinate and time as the abscissa (similar data presentation as Fig. D-1) *Pore pressure may be read out also, if appropriate
Figure E
Project. SONGS, Task #4 POISSON'S RATIO TEST Fig. Job Number G75I Schematic Diagram E-1 0-1 WOODWARD-McNEILL S ASSOCIATES
0( 0 0 *
Zn
3. eO
Poisson's Ratio v=0.30
Select 0.35
0 0.35
Interpolated Portion
Data curve, corrected for on-sample measurement
M Used v =0.35 in GE1 0~G E 17 a o 2 (1+ v)
oJ 0 .~0
Data from Cyclic
Seismic Range Triaxial Tests, conventional ]c platen-to-platen measurements
z M
r
MAJOR PRINCIPAL STRAIN (LOG)
NOTE: To correct approximately for boundary effects, D is x2.5, and 0 is xO.4, for 0 these materials. Circled letters refer to discussion in text of Appendix E.
4
-4 t'~ i"n

143 7 - 17
1
IT L:11 I
411.F
ITZ t. I + .
3-.
Co fi ii Pr s u e .1i (kfi ilf)o I~t Job Nubr WM51 I I E- j K1. 1 WOOAR-MNElL-4 &! ASOIA.
70 V 0 CV- 4 -J so w* ** 0 0 1Ol & a04 B a. q. 0 wms 70 r-7=.--IiV77] Lij~I ~~i
................ ... ..
mo000
. . . . .J i l lj .
LI w 10.
Strai YT 1.e4 et T 1
paeo plte data).. :.
Projct:SONG UNT 1 EISIC E-EVLUAION ARITIO OF HEA MODLUSFig Proec No 415WTHSRIFOSAMTESNDF
WODWRDCLD COSUTAT
1.0
0
- e1 = 101% Seed and Idriss, a 2.ksf
D 0.5 Normalized (1970) 0.5-
,
105 110 115 120 125
DRY DENSITY (PCF)
Project: SONGS UNIT 1 SEISMIC RE-EVALUATION SHEAR MODULUS VS..DENSITY Fig. Project No. 413521

11~ ~ ~ ~ ~ ~~~1 11il1 _H1Itl 111111
If ~ ~ ~ ~ ~ ~ ~ ~ 1 IS1 1-............
I 11 fill~~~1 1111 I
11~~l ] i
it~ ~~ II III I
A IIIII~~ III..... 20
II M1 li.. I~ Hil I fil11
it~~~~~1 11il 111 1 ...
11
1~~~ ~ ~ ~ 1 ....... it~~ IIIW l
16 IIt1
Job Nuber G71 F1
I-i IO1D1ARD-.....LL......OCIAT.S
I ~ ~ ~ ~ ~ ~ 1 II A r ....
1111111 filil
H ll i il l
111 11l 11 fillI I l
I II i l
Major Principal Strain, fil, percent
Figur J
Prjc SONGSP Task #4 Fig SUMMARY OF DATA Job Number : G751F
0-1 WOODWARD- McNEILL II ASSOCIATE3

28
A Weissman and Hart (1961) leg a Hordin (1965)
24 o Drnevich, Hall and Richart (1966) G Matsushita, Kishido and Kyo(1967) * Silver and Seed (1969)
20 - A Donovan (1969) V Hardin and Drnevich (1970) -e
V Ki shido and Tokono (1970)
16
0
.S 12A E
101
a X San Mateo Sand
8
4A
- 0' -41
Shear Strain-percent
Project: SONGS UNIT 1 SEISMIC RE-EVALUATION DAMPING RATIOS FOR SANDS (after Seed and Idriss 1972) Fig. Project No. 413521 COMPARED TO THE SAN MATEO SAND DAMPING RATIOS F-6
WOODWARD-CLYDE CONSULTANTS

700 r..., ~~f~ '
7!-:: 1J 2/3 :.774 effective overburden pressure
Jl .- - :11 1.1 ; - L :4 So I :d I L - 7-1 ;I '-- , [7 ! qi 1
lkT -*,
.I-tL .1 2 1'; [
F-, 221J~:
~~J -w :t jl 4F. L14f:L -7
66 4: -I.~. ......... :2:
Bae n il ia epns et
Prjet:SO G UIT1 EIMC E-VA UAI N ARATON O S EA'M DU U "J !:j: r
Project~ ~ ~ [_ No T151O1 IHSRINFRSNMTOSN
W14AD-LD CONULmaT

28
A Weissman and Hart (1961) a Hardin (1965)
24 e Drnevich, Hall and Richort (1966) 0 G Matsushita, Kishida and Kyo(1967) * Silver and Seed (1969)
20A Donovan (1969) .. *1 1 e 20 ~V Hardin and Drnevich (1970) A
C .
0 /
w ~~ Ki shido and Tokono (1970) J
6
.512 a- o SONGS Field
Dynamic Response
81 SONGS Field R-Wave Attenuation Tests
4 0-----
10 0 10 Shear Strain-percent
L Project: SONGS UNIT 1 SEISMIC RE-EVALUATION DAMPING RATIOS. FOR SANDS (after Seed and Idriss 1972) Fig. Project No. 413521 COMPARED TO THE SAN MATEO SAND DAMPING RATIOS F-6
WOOOWARD-CLYDE CONSULTANTS

TABLE I
DESIGN PARAMETERS
tobde of Nbtion
Parameters VERTICAL HDRIZONTAL TRANSLATION TRANSLATION FOCKING TWISTING
Inertia m, mass of m, mass of I , mass moment It, mass moment of foundat ion foundation and r t and machine machine of inertia about inertia about twist
rocking axis axis Radius 8LBL. 4 B 3 . 4 L( 2 L 2 )
ir = r =-r= r= BL(
Inertia B (1-v)m Bh = 7 - 8v)m B r= 3 I-v) Bt t 4pre e pre pre
Effective Inertia for m m r r r I Design. See Appendix E
for value of n r
Stiffness k 4GrC 32(1-v) GrCk 8Gr'C 16Gr 3C Coefficient-(1-v) h (-V ) r T(v k
Geometric 0.425 A 0.288 0.15 0.50 Damping D - T--- Dh - DB D 0 ~ o General Case 0 C=eC1 C2 C1 0.81 C1 =1.0 C1 = 0.66 C1 0.41
C2 See Fig. 8 C2 = See Fig. 8 C2 = See Fig. 8 C2 See Fig. 8 o.~~
Containment o Structure 1.08 1.09 0.60 insufficient data t4 Z Value of C
* For rectangular shaped foundations, calculation should Note: for square or rectangular footingbe based on equations of pgs. 350 and 351, Richart, Hall and Woods, "Vibrations of Soil and Foundation." B = width of foundation in plan
(parallel to axis of rotation) re = 0.6r for translation modes
L =length of foundation in plan re = 0.8r for rotational modeF (perpendicular to axis of rotation)

I I I II I I II I II
G (pef) =100 Km( )2/3 Native San Mateo Sand m
m =2/3ev 500
o= effective overtuden pressure (psf)
1/100g Desed curvee webased en sepe enelyses with the indicated acceleration
400 giving the peak ground acceleration used in analysis.
300 Km SS%+ It a ve Conpection
1/20 g* 200
1/10 g
02/10 g 100 1/3 g *
2/3g
10 10-3 10-2 10.1 100
O Sheer Strain 7%
Project: SONGS UNIT 1 SEISMIC RE-EVALUATION MODULUS AS A FUNCTION OF STRAIN AND Fig Project No. 413521 PEAK GROUND ACCELERATION F-4
TWOODWARD-CLYDE CONSULTANTS

300
Laboratory Corrected Curve
200
D2
100 Recommended Design Curve
Uncorrected Laboratory Data scaled.
to 7d 123 pcf
C
10 - 10-2 10-1 1
LEGEND Major Principal Strain, e1 percent
* Field Slab response tests from Figure L G 100Kmam2 /3 whrea 2/30 & Laboratory modulus tests scaled for density to 123 pcf = effective overburden pressure * Laboratory modulus tests for which central 1/3 strain measurements were made
A&C represent platen-to-platen measurements B&D represent central 1/3 measurements
Project: SONGS RE-EVALUATION Fig. Project No. 413521 P
WOODWARD-CLYDE CONSULTANTS
G r/2
= 1390 ksf
:+.... .. .
:+:... .. .


