
Sentencing Risk Assessment: A Follow-up Study of the Occurrence and Timing of Re-Arrest among Serious Offenders in Pennsylvania
Submitted to
The Pennsylvania Commission on Sentencing
Prepared by
Matthew DeMichele, PhD
Julia Laskorunsky, MA
This report was partially funded by the Pennsylvania Commission on Sentencing and Penn State University’s Justice Center for Research. We thank Mark Bergstrom, Cynthia Kempinen., Leigh Tinik, Doris MacKenzie, Gary Zajac and Barbara Cox for technical and administrative assistance throughout this project. We thank the Pennsylvania State Police for providing arrest records, and thank Brett Bucklen and Robert Flaherty from the Pennsylvania Department of Corrections for providing release and other statistics. The views, opinions, and inferences expressed as well as any errors are solely the responsibility of the authors, and do not reflect the views of the Pennsylvania Commission on Sentencing, Penn State University’s Justice Center for Research, or the individuals named above.
May 2014

Contents
Executive Summary 3
Introduction 5
Social Science and the Law 10
Smart Sentencing: The Missouri Approach 12
Research on the Development of a Risk Assessment in Criminal Justice Settings 14
Expected Associations with Recidivism 17
Data and Methods 22
Analysis Plan 26
Coding and Variable Definitions 27
Findings 29
Descriptive Statistics 29
Kaplan-Meier Survival Analysis 37
Cox Proportional Hazards Models 41
Predictive Validity: Comparing the Area Under the Curve 46
Risk Assessment Scoring and Classification 49
Kaplan Meier Survival Plots of Recidivism by Risk Groups 53
References 59
Appendices 67
Appendix A 68
Appendix B 74
Appendix C 78
2

Executive Summary
The purpose of this report is to inform efforts by the Pennsylvania Commission on Sentencing (PCS) to develop a risk assessment instrument for judges to use at sentencing. Risk factors for recidivism are identified in a group of serious (level 5) offenders sentenced and released in Pennsylvania. Focusing on information judges have at sentencing, this study analyzes the relationship between offender and case characteristics and likelihood of recidivism up to an eleven and a half year period.
Risk assessments are consistently shown to predict outcomes more accurately than clinical judgment.
A sentencing risk assessment instrument compiles factors judges currently use at sentencing and presents it in a structured format.
The majority (66 percent) of serious offenders are sentenced for a violent crime. About 40 percent have a previous conviction, for any type of crime, on their record.
The overwhelming (69 percent) majority of level 5 offenders are sentenced to prison. About 23 percent and 8 percent are sentenced to jail and community–based sanctions, respectively.
Almost two-thirds (62 percent) of all offenders recidivated within the study period. Of all the offenders who recidivate, 44 percent do so within the first year.
This study identifies three risk groups: low, medium, and high based on likelihood and timing to recidivism.
About 45 percent of offenders in the low risk group recidivated, while offenders in the highest risk group recidivated almost twice as much (85 percent).
Risk groups are categorized based on eight case and offender characteristics that significantly and consistently predict recidivism:
o Maleo Offender is under 30 years of age at sentencingo A prior record score (PRS) of 1 or above o Juvenile arrest recordo 12 or more prior arrests o Current offense is a sex crimeo Current offense is a drug crime (predicts less recidivism)
3
o Offense gravity score of 11 or above (predicts less recidivism)
Number of previous arrests is the strongest and most consistent predictor of risk.
Offenses gravity score (OGS) was found to have a consistently significant and negative effect on recidivism, meaning that offenders who committed more serious crimes were less likely to recidivate.
4

Introduction
Criminal sentencing is one of the most serious governmental powers in a democratic
state. Important issues to consider when punishing is the distribution and effectiveness of
sentences. Judges make sentencing decisions based on the severity of the current offense, the
length and seriousness of the offender’s previous record, and their perceptions of the offender’s
dangerousness to public safety (Albonetti, 1991; Spohn, 2009; Tonry, 1996). Sentences are
intended to balance retribution, deterrence, incapacitation, and rehabilitation. Judges have fairly
broad discretion when making sentencing decisions (Savelsberg, 1992) and display a significant
amount of variation (Nagin and Snodgrass, 2012), despite constraints related to sentencing
guidelines. The federal government and many state governments have enacted sentencing
guidelines to establish a uniform set of sentencing standards and to reduce sentencing disparity.
In Pennsylvania, sentencing guidelines are voluntary; however judges sentence within the
guidelines about 90 percent of the time (Kramer, 1995; Pennsylvania Commission on
Sentencing, 2012). Even more recently, a host of scholars, judges, and sentencing professionals
have called for the adoption of evidence-based sentencing (Bergstrom, 2010). Evidence-based
sentencing is the process of using evidence-based practices to sentence offenders in the most
effective way possible (Gottfredson, 1999; Missouri Sentencing Advisory Commission, 2010a,
2010b; Silver and Chow-Martin, 2001; Virginia Criminal Sentencing Commission, 2001;
Vigorita, 2003). The National Center for State Courts has called for states to ‘get smarter about
sentencing’ by using risk assessments and predictive instruments to assist judges to select
sentencing options that protect the public, hold offenders accountable, and reduce recidivism.
The push for smarter criminal justice decision making reflects a growing reliance on
social science analysis to make better use of scarce correctional resources (Bergstrom and
5

Mistick, 2010; Chaneson, 2003, 2005). At least since the mid-1970s, states have sentenced more
offenders to prison for longer periods of time (Garland, 2001; Wacquant, 2002). These
sentencing patterns have resulted in more than 2 million incarcerated adults and nearly five
million adults on probation and parole. The Pew Center on the States (2009) surveyed the states
and found that 1 in 31 adults are on some form of correctional supervision, and they
demonstrated that growth in correctional spending has outpaced all other forms of public sector
spending. Figure 1 is a graph of criminal justice population rates - using Bureau of Justice
Statistics (BJS) data - from 1980-2010 within the U.S. in which probation, prison, and parole
populations have all risen. Evidence based sentencing and corrections are attempts to stem the
growth of the correctional population while maintaining public safety.
Figure 1: U.S. Criminal Jusitce Population Rates per 100,000, 1980-2010*
050
010
0015
00
1980 1990 2000 2010Year
probation rate/100,000 parole rate/100,000prison rate rate/100,000
U.S. Criminal Justice Population Rates, 1980 - 2010
*Data compiled by the authors from the Bureau of Justice Statistics’ online correctional database.
The situation in Pennsylvania is similar to the rest of the country with steady growth
among correctional populations. Figure 2 is a graph of probation, parole, and prison rates for
6

Pennsylvania from 1977-2010 and reflects growth patterns very similar to what has occurred
across the country (using BJS data).
Figure 2: Pennsylvania. Criminal Jusitce Population Rates per 100,000, 1980-2010*
050
010
0015
00
1970 1980 1990 2000 2010Year
probation rate per 100,000 parole rate per 100,000prison rate per 100,000
Pennsylvania Corrections Populations Rates, 1977-2010
*Data compiled by the authors from the Bureau of Justice Statistics’ online correctional database.
This report was sponsored by the Pennsylvania Commission on Sentencing (PCS) and
Penn State University’s Justice Center for Research to inform efforts to develop a judicial risk
assessment instrument. The Pennsylvania legislature mandated for PCS to develop a sentencing
risk assessment instrument with the passage of Senate Bill 1161. Pennsylvania sentencing
guidelines provide suggested punishment ranges according to broad offense types that range
from level one to level five. The PCS has compiled several recidivism studies of individuals
sentenced within levels three and four (http://pcs.la.psu.edu/).. Our analysis focuses on offenders
convicted at the highest possible sentencing guideline level in Pennsylvania, and reflects the
population most likely to have the greatest impact upon correctional populations.1 Level five
1 Level 5 does not include Murder 1 and Murder 2 offenses, which fall outside of the sentencing guidelines. These offenders receive either lifetime imprisonment or the death penalty, and therefore are not included in the analysis.
7
offenders, for the most part, are considered the most dangerous or serious given the nature of
their crimes. Consequently, they face the longest sentences and will place the greatest burden on
the correctional system. This report will fit within the prior research from PCS studying
recidivism with lower level offenders, and is intended to provide a glimpse into the correlates of
rearrest among this population.2
In this report, we provide analysis of outcome data from Pennsylvania using level 5
offenders sentenced between 2001 and 2005. The purpose of this report is to inform sentencing
and criminal justice professionals about the relationship between offender characteristics
available at sentencing and re-arrest. The three overarching research questions are:
1. What offender characteristics are associated with recidivism?
2. How are individual and offense characteristics associated with the timing to rearrest?
3. Can offenders be grouped according to their combinations of risk factors to predict
recidivism?
Appropriate statistical techniques are used to answer these questions, and criminological
theories guide the analyses. The recidivism analysis reported here includes 10,002 offenders
with up to 11 years and 8 months of follow-up data. The most serious current offense is used to
describe the offender’s current conviction. That is, many individuals are convicted for multiple
offenses, and the PCS includes an indication of the offense that is considered the most serious
within that judicial proceeding. Using the most serious current offense, we find that two-thirds
(66 percent) of the sample have a current violent offense, 16 percent have a current drug offense,
13 percent have a current sex offense, and the remainder have a property or and “other” current
2 The dependent variable is a composite of rearrest and parole violations resulting in revocation and we refer to these failures as recidivism. Arrest records were obtained from the Pennsylvania State Police and include all arrests recorded in Pennsylvania only. We did not conduct a national records check for arrests in other states.
8

conviction.3 Among offenders who recidivated, the longest survival period was 10 years and 10
months, with a means survival time of nearly 1 year and 9 months.
The report is structured in the follow manner. First, we position risk assessment within
the evidence-based practices movement, and discuss the benefits and implications of using social
sciences methods in corrections and sentencing. Second, we provide a brief example of the
implementation of smart sentencing in Missouri. Third, we discuss the research behind
developing a risk assessment for use in criminal justice settings. Fourth, we outline the
associations between offender characteristics and recidivism. Fifth, we introduce our methods,
data, and analysis strategy. Sixth, we present descriptive statistics and regression findings.
Seventh, we develop a risk classification schema and compare recidivism rates based on risk
scores. Lastly, we conclude this report with discussion of the policy implications and
recommendations for future sentencing research.
Correctional resources are limited, which necessitates the use of available tools to
improve the efficiency of sentences and the accuracy of prediction. To date, criminologists have
worked to develop smart policing (Sherman, 1998; Weisburd, Telep, Hinkle, and Eck, 2010) and
evidence-based community corrections policies (Andrews, Zinger, Hoge, et al., 1990; Gendreau,
Little, and Goggin, 1996; MacKenzie, 2006), but evidence-based sentencing has received less
attention (for exception, see Kleiman, Ostrom, and Cheeseman, 2007). The current research is
intended to address this gap in knowledge and practice by demonstrating the relationship among
recidivism and offender characteristics that judges have access to at sentencing.
Social Science and the Law3 A total of 13,285 Level 5 offenders were sentenced during 2001-2005, but 2,880 had yet to be released from prison, which prevents them from being in our recidivism study. Further, we restricted the analysis to offenders that had at least a six month window of time in which they could recidivate (i.e., a release date of no later than March, 1, 2012 with a September 1, 2012 follow-up period). More is said about this in the Data & Methods section.
9

Before discussing the methods and findings from the data analysis, we situate this
research within a broader movement occurring within the criminal justice policy community.
Most criminal justice researchers, policy makers, and practitioners are familiar with the notions
of “what works,” evidence-based practices, and data driven policies (see Andrews, Zinger, Hoge,
et al., 1990; Andrews and Bonta, 2006; Gendreau, Little, and Goggin, 1996; Lowenkamp,
Latessa, and Holsinger, 2006; MacKenzie, 2006; Taxman, 2008). These terms refer to the use of
social science methods to identify cost-effective criminal justice solutions. Evidence-based
initiatives have occurred mainly in law enforcement and corrections fields, with emerging
support within the courts (Chaneson, 2003; Hyatt Bergstrom, and Chaneson, 2011; Warren,
2007).
Actuarial risk assessments, such as those commonly used in correction settings can cause
some concern for judges and court professionals. Risk assessment tools, similar to sentencing
guidelines, are a way to formalize and standardize judicial decision making, which may raise
concerns of discounting professional perspectives and expertise. However, risk assessments can
also be looked at as a structured way to collapse judicial “intuition” (Tonry, 1987). That is,
judges already consider risk of recidivism when making sentencing decisions. But, this
consideration is unsystematic and based on perceptions of the relationships between general
offender characteristics (e.g., age, gender) and recidivism. Sentencing risk assessments can fit
into this structure by integrating social-science knowledge and provide a standardized way for
judicial actors to assess the relevant factors related to an offender’s risk of recidivism (Kleiman
et al. 2007; Vigorita, 2003). According to Hyatt at al., “In order to better use the predictive value
of such information, as well as ensure uniformity in its application, the nature and mechanics of
risk assessment should become a standard part of sentencing procedure” (2011: 266).
10
Actuarial (i.e., formalized) decision making has been found to improve outcomes in
human services professions at least since Meehl’s (1956; Grove and Meehl, 1996) review of
research on statistical risk prediction. A growing body of literature also suggests that actuarial
assessments offer an improved approach to predict future offender behavior (Gottfredson, 1999;
Monahan, 2006; Monahan and Walker, 2011; Tonry, 1987). Such approaches are not intended
“to control judicial decision making, but rather to better inform judges about the potential
outcomes of sentencing” (Hyatt et al., 2011: 266). Social science cannot determine appropriate
sentences. Rather, it will take human assessment to answer “normative questions [that] remain
beyond the reach of science” (Moore, 2002: 42). Standardized risk assessments can be blended
with judicial wisdom and equity under the law to improve the effectiveness and fairness of
criminal sentences.
Several notable legal scholars have commented on the usefulness of incorporating
scientific study into the judicial process. Chanenson (2003: 1) pointed out that “data can help
legislatures and sentencing commissions more intelligently address such crucial issues as setting
or revising mandatory minimums and molding the contours of criminal history categories.” And,
Hyatt and colleagues (2011) state that the use of risk assessment at sentencing “underscores an
overall shift in the purposes of sentencing” by replacing the traditional sentencing orientation of
proportionality, uniformity, and concerns of disparity, with a “forward looking utilitarian goal”
of sentencing according to risk (266). In this sense, the utility of a sentencing risk assessment is
not limited to sentencing decisions, but can be used to restructure the modern–day courtroom
into one driven by data and outcomes.
Smart Sentencing: The Missouri Approach
11
There are several states currently using or exploring the use of sentencing risk assessment
tools (Minnesota, Oregon, Virginia, etc.). In Missouri, diverting non-violent criminal from
incarceration has been a goal of the sentencing risk assessment. Michael Wolff (2008), Supreme
Court Judge of Missouri, stated that “we have begun to look at the question of sentencing
outcomes from an overall perspective, as well as to look at which sentences – for which
categories of offenders – produce positive results in terms of avoiding recidivism” (2008: 320).
He identified that nearly half of state prisoners are sentenced for nonviolent crimes, and 97
percent of all state prisoners are going to be released at some point (Petersilia, 2004; Wolff,
2008). Below, we provide a brief description of Missouri’s judicial system development and
successful implementation of a risk assessment instrument (MSAC, 2010a, 2010b).
Missouri, similar to Pennsylvania, is a sentencing guidelines state. Their guidelines are
nonbinding, in which a judge does not have to provide any justification for disregarding the
guidelines (Chanenson, 2005). (Similarly, Pennsylvania judges are free to depart from the
guidelines; however they must provide a reason for doing so.) They have developed an
integrated risk assessment approach to structure both sentencing and release decisions. The
MSAC’s approach to sentencing assessment development recognized the importance of
providing judges with information about potential outcomes related to multiple sentencing
options. For this reason, the MSAC developed a risk assessment instrument that includes three
sentencing ranges: presumptive, aggravated, and mitigated. The presumptive sentence is the most
typical or modal sentence handed out within the state for a particular offense and individual. The
second sentence range allows for considering aggravating circumstances that necessitate a more
punitive response. And, third, the mitigated sentencing option is one in which “the circumstance
12

of the crime or the risk presented by the offender justify a less severe sentence” (MSAC, 2010b,
p. 2).
MSAC sought to inform all criminal justice actors involved in commitment and release
decisions—judges, probation, parole, attorneys, and prison officials. They did a three-year follow
up of offenders to determine the differences in recidivism rates among certain lower level
felonies sentenced to community sanctions compared to those given institutional sentences.
MSAC focused on offender criminal history to determine the most severe sentences. In an effort
to incorporate a holistic understanding of the impact of sentencing options on offender behavior,
the recommended punishments are provided to judges as part of the pre-sentence investigation
report—referred to as a Sentencing Assessment Report (SAR). The SAR is a comprehensive
information packet about the individual offender that focuses on: the current offense, offender
risk factors, suggested management plan, Commission recommendation, and release guidelines
for the Parole Board to consider (Wolff, 2006, p.95). This sentencing approach provides central
sentencing decision makers with crucial information that they may not have had or considered
previously, while still maintaining full discretion to implement the recommendations or alter
them when making sentencing decisions. Since implementing the new guidelines and assessment
instrument, Missouri has experienced a decline in their prison population (Wolff, 2006).
Research on the Development of a Risk Assessment in Criminal Justice Settings
Researchers study ways to increase the accuracy and efficiency of organizational actors
and incorporate research findings into the courtroom (see Monahan and Walker, 2011). For
13

example, Paul Meehl (1954) demonstrated the efficacy of statistical methods to predict future
behavior over clinical judgment. In a later meta-analysis, Groves and Meehl (1996; Groves,
Zald, Lebow, Snitz, and Nelson, 2000) analyzed 136 research studies and found that decisions
guided by statistically-derived tools provided a more accurate result than clinical assessment. In
an ideal world, the judiciary would be able to easily identify the difference between individuals
that will recidivate and those that will not. However, recidivists and dangerous individuals
cannot be identified by sight or surface level characteristics alone.
The use of risk assessment tools to guide criminal justice actors’ decision-making is not
new. In fact, Burgess (1928) worked with the Illinois State Parole Board to develop a parole
release instrument that relied on an additive binary assessment instrument of 21 factors to predict
which offenders were most likely to succeed and fail on parole. As a comparison, three trained
psychiatrists also made predictions on a subsample of the 3,000 offenders involved in Burgess’
study. The clinicians were found to be slightly more precise at identifying parole successes, but
significantly less accurate in predicting parole failures. Reviewing Burgess’ research, Groves and
Meehl (1996, p. 293) stated that the “conclusion was clear that even a crude actuarial method
such as this was superior to clinical judgment in accuracy of prediction.”
The judiciary (and all criminal justice positions for that matter) present researchers
developing theoretically guided risk assessment instruments with particular challenges due to the
need to sentence individuals according to specific legally defined rules. While this is the case,
others have pointed out that using actuarial risk assessments can increase sentencing uniformity,
consistency, and objectivity while enabling judicial actors to “manage resources more efficiently
by directing them toward the higher risk cases” (Silver and Miller, 2002, p. 143). Gottfredson
(1999, p. 110) suggested that sentencing rationality improves “when sentencing theory
14
incorporates risk as a relevant and justifiable consideration.” Risk assessment instruments should
be perceived as tools to assist decision making, not instruments meant to limit courtroom actor
agency.
Criminological theory and research provides strong evidence that there are similar
pathways to chronic criminal lifestyles that are rooted in structural characteristics (Morenoff and
Sampson, 1997; Sampson and Groves, 1989), social-psychological characteristics (Gottfredson
and Hirschi, 1990), and these characteristics supersede the specific technical aspects of any
criminal activity (Sutherland, 1937). It is unreasonable to expect judicial actors to consistently
apply both their knowledge of the particular individual’s legal rights and needs, as well as situate
this individual within larger offender populations to form a complete picture of how a particular
sanction will likely shape this person’s future behavior. Instead, risk assessment instruments
allow professionals to integrate specific technical knowledge of a field (e.g., legal philosophy),
with the merits of any particular situation (i.e., the particular offender to be sentenced) and
situate the individual within larger groups.
In the case of SB 1161, the Pennsylvania Legislature has made it clear that while
conserving the resources of the criminal justice system is important, public safety is paramount.
This calls for differentiating, and possibly diverting, lower-risk offenders who pose little threat to
the public from higher-risk offenders who may need to be incapacitated. In the former situation,
a community or mixed sanction might be most appropriate, whereas a more severe institutional
sanction might be used for high-risk offenders. Recently, the Virginia Criminal Sentencing
Commission (VCSC, 2001) worked with the National Center for State Courts (Kleiman et al.,
2007) to evaluate a sentencing risk assessment instrument used to differentiate among low- and
high-risk offenders suitable for non-incarcerative sanctions, and to increase the amount of time
15

served by violent offenders and those with a prior record of violent offenses. Similar to SB
1161, the VCSC was mandated to respond to policy development within Virginia mandating the
preparation of guidelines for sentencing courts to identify appropriate candidates for diversion
from incarceration, based on the relative risk that a felon will become a threat to public safety
(Kleiman et al., 2007, p. 107). The risk assessment fits within Virginia’s voluntary sentencing
guidelines.
Kleiman et al. (2007, p.120) found that the risk assessment instrument as a whole - the
total risk score - provides a significant capability to differentiate recidivists from nonrecidivists.
This research is essential for differentiating and effectively sanctioning low versus high-risk
offenders. Prior research has found that low-risk offenders who receive more severe
punishments designed for high-risk offenders have higher recidivism rates than expected
(Lowenkamp, Latessa, and Holsinger, 2006; Lowenkamp, Latessa, and Smith, 2006 ). Risk
assessment instruments use groups of factors that covary with reoffending to form classification
schemes to place offenders into groups that have little within-group variation on reoffense rates,
but have significant between-group variation on reoffense rates (Kleiman et al., 2007). This is
not to suggest that every offender placed into a certain group will have identical behavioral
outcomes, but rather it is an approach to reduce data into theoretical categories based upon
empirical facts. The use of risk assessment has been cited by many as not only cost effective and
more accurate, but also better at achieving criminal justice goals related to punishment (e.g., Pew
Center on the States, 2009).
Expected Associations with Recidivism
The research reported here is intended to provide information about offender outcomes
after release based on information available at sentencing. Our analysis is intended to contribute
16
to the ongoing efforts of the PCS to work toward developing a risk assessment instrument by
analyzing a sample of individuals who are convicted at the highest sentencing level within
Pennsylvania. Sentencing level is determined by a combination of two factors: the offense
gravity score (OGS) and the prior record score (PRS), which measure the offense seriousness
and the seriousness and quantity of the offenders previous convictions, respectively. These items
tap into two important concepts related to criminal punishment. First, there is a strong connection
between perceptions of offense severity and the public’s desire for punishment, in that crimes
that are more serious are often punished more severely. Second, longer sentences are given out to
offenders who have prior convictions, and in particular, to those who have a serious prior record
(Roberts, 2008). These items provide measures of two central issues that judges consider when
sentencing, and that sentencing commissions weigh when making sentencing recommendations.
The question we investigate, however, is to what degree these measures are related to offender
outcomes? We also go beyond the prior record score and the offense gravity score to look at
research relevant demographic and case characteristics.
The PCS has completed six interim reports investigating risk and the development of risk
assessment instruments at sentencing that are publically available on the PCS website. 4 In their
first report, PCS gathered information on the current use of risk assessments by other
jurisdictions, identified risk factors used in other instruments, and the availability of information
that is gather at the pre-sentence investigation phase in 25 Pennsylvania counties (Pennsylvania
Commission on Sentencing, Report 1). The second report included a sample of level 3, 4, and
limited number of level 5 offenders to show the relationship between the OGS and PRS scores
(Pennsylvania Commission on Sentencing, Report 2). They demonstrated that lower OGS and
4 The PCS maintains a publication series at http://pcs.la.psu.edu/publications-and-research/research-and-evaluation-reports/risk-assessment
17

higher PRS scores are associated with shorter survival times (i.e., higher recidivism). The third
report extended PCS’ previous research and used logistic regression analysis to find significant
positive relationships between recidivism and number of prior arrests, prior property and prior
drug arrests. They found negative relationships with OGS, age at sentencing, and sentenced in a
rural county (Pennsylvania Commission on Sentencing, Report 3). In this report, PCS also found
that, although many offenders commit a broad spectrum of types of crimes, there is a tendency
for a smaller subset of offenders to specialize in certain types of crimes.
In the fourth report, PCS scored individual attributes using three approaches – Burgess,
weighted Burgess, and Predictive attribute analysis – and found all three to have similar
predictive utility (Pennsylvania Commission on Sentencing, Report 4). But, they found the
Burgess approach to be the easiest to implement, understand, and use in the field. In their fifth
interim report, the PCS, provided analysis to classify offenders in two different ways: using two
groups (i.e., high versus low) and three groups (i.e., high, medium and low). They determined
choice of grouping approach is a matter selecting how one prefers to balance false positive (i.e.,
predicting someone as high risk when they do not recidivate) or false negative rates (i.e.,
incorrectly predicting someone to be low risk that recidivates), as each of these approaches had
nearly identical predictive accuracy (Pennsylvania Commission on Sentencing, Report 5). In
their sixth interim report, they found the risk assessment instrument was best at identifying lower
risk offenders (Pennsylvania Commission on Sentencing, Report 6). Finally, Report 7 tested the
validity of their risk scores on a sample of level 3 and 4 offenders with mostly drug and property
convictions. The current report builds upon these previous efforts by PCS to identify correlates
of recidivism among higher risk offenders to inform sentencing decision making.
18

Prior research routinely finds associations between crime and demographic
characteristics. Three of the strongest relationships between individual characteristics and crime
are gender, race and age. First, males are known to commit the overwhelming majority of crime,
and they typically have shorter crime free periods once released into the community. It is
regularly found that despite temporal or spatial location men have higher rates of violence,
aggression, and criminality (Archer, 2004; Simons and Burt, 2011). Criminological research and
crime incidence data demonstrates that males are significantly more likely to engage in crime, be
under some form of criminal justice control, and be a victim of crime.
Second, many researchers have found that minorities, especially blacks have higher crime
rates (Kleiman et al., 2007). The over-representation of minorities in correctional populations has
been studied for a long time and linked to the structural limitations to which minorities are
typically exposed (Shaw and McKay, 1942; Sampson and Groves, 1989; Wilson, 1987).
Specifically, researchers have identified the effects of social characteristics related to
disadvantage and inequality that minority races and ethnic groups experience. Kleiman et al.
(2007) found that being black explained a significant portion of the variance in recidivism, but
there are obvious ethical considerations when using race as a predictor to make sentencing
decisions (Tonry, 1987).
Third, the age-crime curve is one of the more generally agreed upon relationships within
the criminology, as individuals commit more crime when they are younger (i.e., the age-crime
curve follows a normal distribution from 12 to around 25 years of age). Some suggest, that as
people move through life, informal control mechanisms and stakes in conformity reduce their
rate of offending (e.g., marriage, work) (Laub and Sampson, 1993; Toby, 1957). Others (e.g.,
Terrie Moffit, 1993) accept a more psychological perspective, which suggests that crime and
19
delinquency proclivity fits along two developmental paths: adolescence limited and life-course
persistent. Moffitt’s research and others suggests that criminal propensity for most people is age-
graded, and only in about 5%-10% of study samples is crime a more persistent behavior.
Although as Laub and Sampson (2003) have pointed out, everyone eventually ages out of crime.
More recently, Frank Cullen (2011, p. 310) offered further support for age-graded criminology
by stating that “Life-course criminology (LCC) is criminology” (Laub, 2006).
Research often shows that past behavior is the best predictor of future behavior, and
criminologists also find that individuals with previous criminal offenses are more likely to
commit future crimes (Andrews and Bonta, 2006). The number of misdemeanors, felony arrests,
and convictions are related to future criminal involvement (Kleiman, 2007; Silver and Chow-
Martin, 2002). Both arrest and convictions are important because conviction indicators are
affected by process issues related to obtaining a conviction (e.g., charges may be dropped due to
lack of evidence or police misconduct), whereas arrest provides a more general indication of the
level of criminal involvement. Most individuals arrested as adults were arrested as juveniles, but
most individuals arrested as juveniles do not go on to be arrested as adults (Blumstein, Cohen,
and Visher, 1986). Among samples of offenders, having a juvenile arrest record is a strong
predictor of recidivism. Similarly, the younger a person is involved with the criminal justice
system the more likely they are to continue their criminality into adulthood (Piquero, Brame, and
Lynam, 2004).
Along with demographics and prior criminal involvement, characteristics of current and
prior offenses are also an important indicator of risk of re-offense. Prior research has found that
differences in recidivism rates exist for sex, violent, property, and drug offenders. For example,
property crimes are committed more often than personal crimes (Blumstein and Cohen, 1979), so
20

the re-offense rates of property offenders are likely to be higher than other types of offenders.
Federal data shows that property offenders consistently recidivate at a higher rate than other
types of offenders (Beck and Shipley, 1989; Langan and Levin, 2002). Despite public concern,
several studies find that the rate of overall recidivism is lower for sex offenders than other types
of offenders (Langan, Smith, & Durose, 2004; Sample & Bray, 2003; Hanson, Scott & Steffy,
1995). The research on drug offenders and violent offenders is mixed. Lo, Kim, and Cheng’s
(2008) retrospective study suggest that both drug and violent offenders are more likely to
experience long periods of no arrest. Data from the Bureaus of Justice Statistics (Langan and
Levin, 2002) shows that drug offenders are less likely to recidivate than property offenders, but
more likely to recidivate than other types of offenders. However, studies on serious drug
offenders suggest that they are more likely to recidivate than other types of offenders (e.g.,
Spohn and Holleran, 2002). Likewise, some studies on violent offenders show that they are less
likely to return to prison than non-violent offenders (Schwaner, 1998), while other studies show
that violent offenders have a lengthy criminal history compared to non-violent offenders and
commit a disproportionate amount of crime (Moffitt, 1989; Farrington, 2003).
An interesting line of criminological research is to determine the proclivity of individuals
to specialize in specific crime types. Some individuals may commit only certain types of crime
(specialists), whereas others are willing to commit a general range of crimes. Several
criminologists have suggested that criminal offenders operate more like a “cafeteria menu,”
committing a little of many types of crimes depending on opportunity structures (Gottfredson
and Hirschi, 1990). It is likely that generalists will have a higher recidivism rates because their
opportunity structures are broader.
21

Another important criminal offense characteristic is the seriousness of the offense. While
offenders with more serious offenses (i.e., offenses that cause more harm) are likely to get
harsher sentences, the relationship between offense gravity and recidivism is more complicated.
For example, the PCS’s Report 2 found that the relationship between offense gravity and
recidivism was negative; meaning that those sentences for more serious crime were less likely to
commit another offense. Other risk assessments research has also found that lower-level offenses
are linked with a higher recidivism rate (e.g., Texas Parole Board, Ohio-ORAS). Lower level
crimes, such as burglary or drug use, require a level of pre-meditation and are often done by
younger, risk-seeking individuals that are likely to recidivate. Sex and violent offenses are
considered the most serious in terms of harm, but are not related to a higher risk of recidivism in
this and other risk assessment studies. Other markers of offense seriousness, such as weapon
and/or gun possession also have mixed research findings. For example, Huebner, Varanos, and
Bynum (2007), found that gun use was not associated with an increased risk of post-release
recidivism, while Daniel (2010) found that firearm involvement increased the risk of recidivism
for gang offenders only.
Data and Methods
Three datasets are used to conduct this study: a sentencing dataset provided by the
Pennsylvania Commission on Sentencing (PCS), an incarceration dataset from the Pennsylvania
Department of Corrections, and an arrest dataset provided by Pennsylvania State Police (PSP).
The PCS data includes sentencing data from 2001 to 2005 for all offenders sentenced in
Pennsylvania courts. Each data year has over 100,000 sentencing cases, separated by offender
State ID (SID) numbers, which are unique to every offender. The DOC dataset includes the date
22

an offender was released from prison and/or sent back to prison for a probation or parole failure.
Arrest data (e.g., rap sheets) from Pennsylvania State Police (PSP) provides an indicator of
whether the offender has recidivated and all previous arrest data.
Our level of analysis is the individual offender. Pennsylvania relies on a unique SID for
each offender, as well as a unique number for each judicial proceeding (JP). The SID number is
used to track individuals across different branches of the Pennsylvania criminal justice system
(e.g., courts, corrections, and police). The JP number is used to differentiate offenders who had
multiple court cases over the course of the 5-year period of interest.
As mentioned above, the PA sentencing system has five levels to indicate the severity of
the offender and the offense, with level 1 being the lowest level and 5 being the highest
sentencing level. These levels correspond to the sentencing guideline range. Our study is
interested in the recidivism patterns and predictors of level 5 offenders only. Previous research
(mentioned above) by the PCS analyzed recidivism patterns and predictors for offense levels 3
and 4. The PCS, in response to legislative mandate 1161, wants to understand offender behavior
across all sentencing levels. That is, it is important to determine if different types of offenders
have varying recidivism patterns. The purpose of this report is to detail the recidivism patterns
for a large set of level 5 offenders sentenced between 2001 and 2005 in Pennsylvania.
Years 2001-2005 were selected for several reasons. First, level 5 offenders, for the most
part, face long incarceration sentences, which necessitated using a set of years that allowed for
enough time for offenders to be released. We found that 2,880 out of 14,026 level 5 offenders
sentenced between 2001 and 2005 were still incarcerated during our study. Obviously, we cannot
calculate recidivism patterns for these individuals. However, calculating recidivism rates for
individuals sentenced to long (10+ years) sentences is less important for the purposes of this
23

study. Because crimes these individuals receive fall on the far end of the sentencing spectrum,
shorter sentences or incarceration alternatives are rarely considered anyway.5
The second reason we selected these years is because the PCS made changes to their data
collection system in year 2000 — moving over to a computer based system. According to PCS
representatives, 2001 was the first year in which accurate and complete data could be easily
retrieved. Third, these years provide us with five years of sentencing data, which lends further
credibility that our findings are not unduly biased by unobservable temporal trends.
Our study began with a PCS dataset of all levels of offenders for 2001 to 2005, in which
there were 624,035 total entries. We restrict these cases to level 5 sentences only, which resulted
in 26,111 judicial proceeding and 14,026 unique individuals. In order to obtain one record per
individual, we further restricted the dataset to obtain the most serious offense in the most recent
judicial proceeding between 2001 and 2005. (Concurrent offenses were controlled for in our
models of offense history.) This allowed us to have 14,026 unique offenders, with one current
offense per individual. Next, cases were removed that had excessive missing or incomplete
records, if the offenders had died, were transferred, escaped, or were still incarcerated. Lastly, we
removed offenders that had not been released for at least six months (n=360). Given that
offenders can enter the study at different times (i.e., staggered entry), we wanted to ensure that
offenders had the ability to be in the community and hence measured as recidivating for a
minimum period of time. Therefore, we removed offenders that had been released between
March and September, 2012.
Table 1: Sample Development of Level 5 Offenders Sentenced in Pennsylvania, 2001-2005
5 This is an interesting methodological issue in that individuals that remain incarcerated are considered the most dangerous. While analysis of this subpopulation would be theoretically interesting, it nonetheless, would have little policy-relevance.
24

Total Level 5 Sentencing Events 26,111Unique offenders6 14,026 Missing in State Police Data 232Missing in DOC Data 269Died7 178Escaped from Prison 43Trf. to a Mental Hospital 19Still incarcerated 2,880
Not out at least 6 months 360Illogical entries 438
Final Sample 10,002
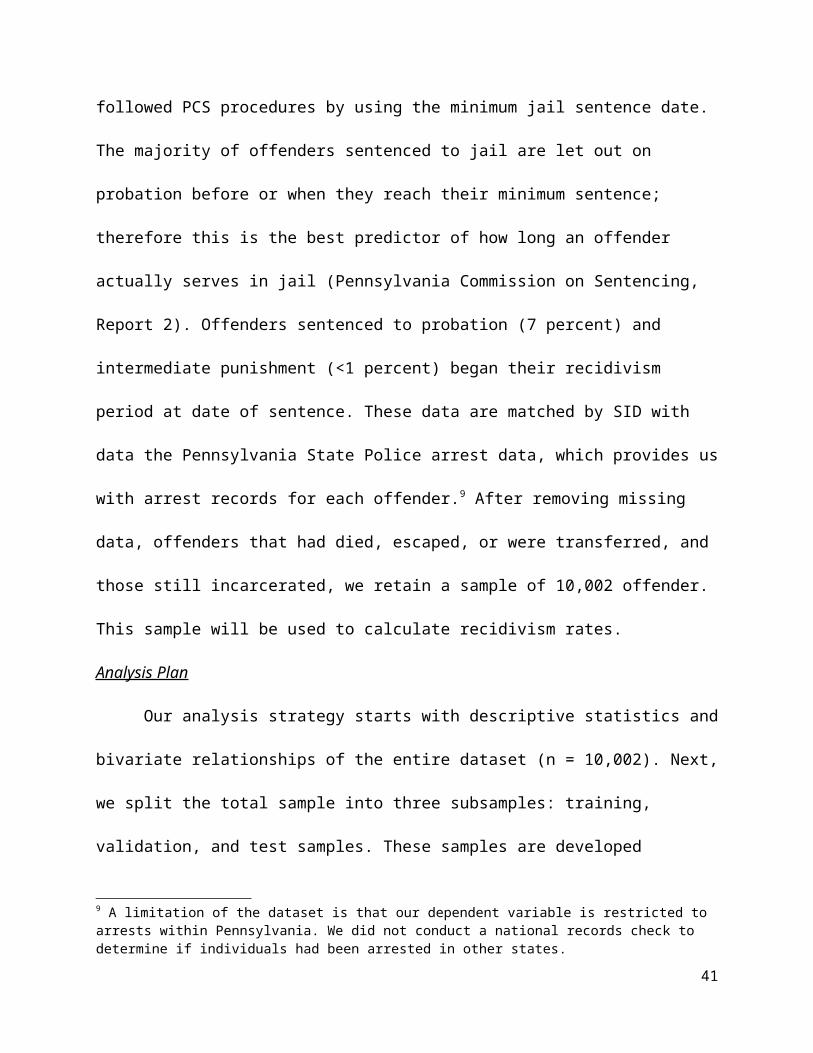
The PCS sentencing data was matched with the Pennsylvania Department of Corrections
to obtain the release date for offenders sentenced to prison (70 percent). In order to determine
release dates for those sentenced to jail (22 percent), we followed PCS procedures by using the
minimum jail sentence date. The majority of offenders sentenced to jail are let out on probation
before or when they reach their minimum sentence; therefore this is the best predictor of how
long an offender actually serves in jail (Pennsylvania Commission on Sentencing, Report 2).
Offenders sentenced to probation (7 percent) and intermediate punishment (<1 percent) began
their recidivism period at date of sentence. These data are matched by SID with data the
Pennsylvania State Police arrest data, which provides us with arrest records for each offender.9
After removing missing data, offenders that had died, escaped, or were transferred, and those still
incarcerated, we retain a sample of 10,002 offender. This sample will be used to calculate
recidivism rates.
6 We used most current offense and most serious offense within a judicial proceeding. 7 These offenders died either while serving out their sentence or within a year of release.8 The bulk of these individuals were deleted due to date entries in which the sentencing or arrest date occurred before the date of birth. 9 A limitation of the dataset is that our dependent variable is restricted to arrests within Pennsylvania. We did not conduct a national records check to determine if individuals had been arrested in other states.
25

Analysis Plan
Our analysis strategy starts with descriptive statistics and bivariate relationships of the
entire dataset (n = 10,002). Next, we split the total sample into three subsamples: training,
validation, and test samples. These samples are developed randomly and intended to minimize
the likelihood that the findings are a matter of over-fitting the data (i.e., the findings are simply
due to idiosyncrasies peculiar to the sample) (Hastie, Tibshirani, and Friedman, 2008). The
training sample consists of 50 percent (n = 5,001) of the total sample and the test and validation
samples are 25 percent of the entire sample (n = 2,501 and n = 2,500, respectively). Splitting the
sample in this way allows for a more rigorous test of what variables to use to classify individuals
by their propensity to reoffend. Our strategy uses standard statistical testing procedures in which
we advance simple models including only demographic characteristics and include additional
criminal history and offense related characteristics to later models. A final model is tested with
each sample that includes the variables that achieved statistical support in the prior models. Final
variable selection is made by selecting indicators that received the greatest support across the
three samples. More is said below when we describe the Cox regression models.
After providing descriptive statistics of the entire sample, we turn to a series of regression
analyses to predict the occurrence of recidivism using survival analysis methods. Our regression
analysis is directed by theory and prior criminological findings, with the goal being to find the
most parsimonious and practical set of covariates that maximize predictive validity. That is, this
research is to assist the PCS’ work toward development of a sentencing risk assessment
instrument, which necessitates that we keep in mind the utility of our findings. For this reason,
we restricted our variable selection to items that judges either currently have access to, or could
easily gain access to, before the sentencing decision is made. Many of these items are basic
26

demographics, such as offender’s age and gender. Others, such as the offender’s criminal history,
can be obtained from the pre-sentence report. To further the utility of this research, we wanted to
identify as few items as possible that maintained predictive power to allow court personnel to
provide judges with a short set of predictive attributes.
Coding and Variable Definitions
Our dependent variable is a new arrest or parole revocation following release from
prison, jail, or while on probation. We were able to obtain parole revocations from the DOC
records, however this includes only offenders whose parole revocation resulted in a return to
prison, not jail. Technical violations are not criminal offenses, per se, but they are a significant
driver of incarceration populations. We only include technical violations that result in a return to
prison (e.g., the most serious violations). The recidivism variable is constructed in two formats.
First, it is a binary indicator of whether a person recidivated (=1) or not (=0) during the follow-
up period, which ended in September 1, 2012. Second, the outcome is recorded as the duration
between entry into the study – i.e., release from prison or jail and start of probation – and either
recidivating (i.e., arrest, revocation) or not (i.e., right censored, surviving) as a continuous
measure of time recidivism. Table 2 includes a description of variable labels and coding.
The analysis measures the association between recidivism, a set of individual
characteristics, and nature of prior and current criminal offenses. We include demographic
characteristics such as sex, race, and age at sentencing. The type of current offense (violent, sex,
property, drug, and other) and the nature and seriousness of offenses in their criminal history are
included. (See Appendix A and B for a list offenses in each category.) The PCS uses the prior
record score (PRS) to indicate the number and seriousness of the offender’s criminal history, as
well as an offense gravity score (OGS) to indicate the seriousness of the offender’s current
27
offense. The number of total arrests is also included, as well as an indicator of a juvenile arrest.
Finally, we developed indicators to measure the criminal career patterns of offenders convicted
of at least two offenses. By using a specialization threshold we divided criminal specialists —
that is, offenders who have committed 75 percent or more of their crimes in the same category —
from those that have committed a variety of different crime types (<75 % in the same category).10
This provides some measure of the relationship between the variety of an offender’s criminal
history and their likelihood to re-offend. This technique mirrors those done in previous
specialization research (see Cohen, 1986; Harris et al., 2009; Miethe et al. 2006; Tracy and
Kempf-Leonard, 1996; Wikstrom, 1991).
Case characteristics were also included with measures of whether the offense was completed,
whether the individual faced multiple counts and whether the offender possessed or used a
deadly weapon or gun during the commission of the crime.
Table 2: Coding and Variable Definitions
1. Black: = 12. Male: = 13. Age30+: 30 years old or older at time of sentencing=14. PRS0: PRS score of 1 or more =15. OGS11+: OGS score of 11-14 =16. Juvenile Arrest: first arrest was under 18 years of age =17. C[Offense type]: current conviction is for a violent (reference), sex, property, drug or
other crime 8. Prior[Offense type]: a prior conviction of violent (reference), sex, property, drug or other
crime 9. Arrests12+: offender has 12 or more arrests =110. Specialization: offender is a specialist, generalist, or first-time offender11. Complete: the most recent conviction is for a completed crime =112. Multiple Counts: convicted for multiple offenses within the most current judicial
proceeding =113. Gun Possession: possession of a gun during the commission of the most recent crime =1
10 We use prior convictions as a proxy for criminal incidents. Specialists and generalists are offenders who have committed at least two offenses.
28

Findings
Descriptive Statistics
The descriptive statistics are provided in table 3. The outcome variable – recidivism – is a
measure of a new arrest or return to prison for a technical violation, and 62 percent (n = 6,255) of
the offenders recidivated within the study period. This was more than 11 years for some
offenders. The mean length of months free for those recidivating was nearly 22, with a maximum
length of 130 months. Our data shows that 27 percent (n = 2,739), 41 percent (n = 4,153), and 49
percent (n = 4,971) of all offenders recidivated by years 1, 2, and 3, respectively.11 The
remainder of recidivists (n = 1,284) did so after the first three years. These temporal patterns are
explored later in the survival analysis. Further, it should be noted that out of offenders who
recidivated, 44% did so in the first year.
Table 3: Descriptive Statistics of Level 5 Offenders Sentenced in Pennsylvania, 2001-2005 N=10,002 ______
N (%) Mean Min Max #Recid (%) 12 Recidivism 6,255 62.54 21.9 months <1 130No Recidivism 3,747 37.46 67.0 months 6 139
GenderMale 9,135 91.33 5,839 (63.9)Female 867 8.67 416 (47.9)
RaceBlack 4,447 44.46 3,026 (68.0)13
White 4,373 43.72 2,613 (59.7)Hispanic 916 9.16 470 (51.3)Other 266 2.66 146 (54.8)
11 These figures represent the percentage of all cases included in the final sample (n = 10,002), but the rate by which offenders recidivate is more stark when considering the percentage compared to the number of offenders at risk which goes down as offenders drop out of the sample.12 Over the 11.5 year period.13 For analysis, this variable has been dichotomized as Black and Other Race (Hispanic, White, and Other).
29

Table 3 (continued): Descriptive Statistics of Level 5 Offenders Sentenced in Pennsylvania, 2001-2005 N=10,002 ______
N (%) Mean Min Max #Recid (%)
Age Age at Sentencing 30.13 14.77 78.63 Juvenile Arrest 2,332 23.32 1,777 (76.2)
Current OffenseViolent 6,661 66.60 4,145 (62.2)Sex 1,284 12.84 928 (72.2)Property 213 2.13 163 (76.5)Drug 1,689 16.89 908 (53.7)Other 155 1.55 111 (71.6)
Prior OffenseViolent 855 8.55 587 (68.6)Sex 120 1.20 75 (62.5)Property 747 7.47 550 (73.6)Drug 2,179 22.79 1,472 (67.5)Other 2,054 20.54 1,467 (71.4)
Criminal Career PatternPrior arrest # 6.50 1 63 3,691 (80.4)14
Specialist 694 6.94 438 (63.1)Generalist 3,121 31.21 2,169 (69.4)Prior Record Score 1.72 0 7 1,694 (69.9)15
Case ConditionCompleted offense 9,310 93.08 5,850 (62.8)Multiple charges 3,179 31.78 1,970(61.9)Offense Gravity Score 9.89 1 14 946 (51.3)16
Gun possession 1,024 10.24 632 (61.7)
The overwhelming majority of the sample is male (91 percent), however there are enough
females in the sample (n=867) for statistical analysis. The sample is split between black (44
14 Prior arrest #=number recidivate with an arrest 12+(mean + 1 standard deviation) (x=6.5, sd = 5.6 = 12.1; n =3,691)15 PRS = number recidivate with a PRS 1+ (based on differentiating offenders who have prior convictions from those who don’t)16 OGS = number recidivate with OGS 11+ (mean + 1 standard deviation) (x = 9.9, sd =1.4 = 11.3; n = 904)
30

percent) and white (44 percent) offenders, with non-white Hispanic offenders accounting for
about 9 percent of the total sample. The average age of the offender at the time of sentencing is
30 years old, with almost 23 percent of the sample having been arrested as a juvenile (i.e., under
18 years old).
At sentencing, judges will have access to current and prior criminal history information.
Such factors are routinely found to be associated with criminal behavior. Table 3 provides prior
and current conviction information about each offender. The current sample is composed of two-
thirds (n = 6,661) of individuals in which a violent offense is the most serious current offense.
Drug offenders account for 16 percent (n = 1,689), sex offenders account for 13 percent (n =
1,284), and property offenders account for two percent (n = 213). This shows that level five
offenders in Pennsylvania are mostly convicted for serious (i.e., violent) crimes. A small portion
(2 percent) of offenders had crimes that could not be categorized into one of the previously
mentioned categories and were included in an “other” offense category.
The seriousness and nature of the current offense is an important consideration at
sentencing, but so are prior convictions. The prior offense category in table 3 indicates the total
number of offenders with a previous conviction, or convictions, in any of the five offense
categories.17 Nearly 40 percent of these offenders have at least one prior conviction (n=6,083),
with the majority being in the drug (23 percent) category. Less than nine percent of the total
sample of offenders had a prior conviction for a violent offense (n = 855) or a property offense
(n=747). Less than two percent had a prior conviction for a sex crime. Contact crimes are rare
events and it appears that even in a sample of serious offenders, a previous conviction for a
violent or a sex crime is less common than non-contact crimes.
17 These figures do not add to 100 percent because any one offender could have prior convictions across several categories, or no prior conviction at all (60 percent of the sample).
31
Specialization and generalization measures (detailed in the Data Description section) are
included in the analysis. A 75 percent threshold is used to define specialists and generalists
among those with more than one conviction. Specialists are 7 percent (n = 694) of the total
sample (i.e., those repeatedly committing a similar type of crime), and nearly one-third of the
total sample (n = 3,121) are considered generalists — meaning they commit a variety of crimes
over their offending career. This is similar to previous research showing that the majority of
offenders are versatile criminals (Farrington, Snyder, and Finnegan, 1988; Harris, Smallbone,
Dennison, and Knight, 2009; Simon, 1997).
Along with measures for specialization, other aspects of the offender’s criminal history
are explored. The average number of arrests is 6.5, with a range of 1 to 63. The arrest is treated
as a binary variable in later analysis to compare those with many prior arrests (12 or more) to
those without a lengthy arrest record. The prior record score (PRS) is a seven point measurement
of the number and seriousness of prior convictions, with this sample having an average PRS
score of 1.7. 18 We dichotomized this variable into those with PRS scores of 0 and 1 or above.
This was done because the largest difference in recidivism rates occurred between offenders who
had no prior convictions to those that had any prior convictions.
Finally, we include different measures for the seriousness of the crime. The offense
gravity score (OGS) ranges from 0 to 14 and provides a measure of the seriousness of the current
crime. The average OGS score for this sample is almost 10. We dichotomized this variable into
groups of scores of 1-10 and 11-14. Nearly all of the convictions were for completed (as
opposed to inchoate) offenses (93 percent), and nearly one-third (n = 3,351) had multiple charges
18 The PRS actually ranges from 0-5 with additional indicators measuring repeat offender categories, which collapsed to extend the range (REFEL = 6 and REVOC = 7).
32
46% 56%
46%
65%60%
73%
62%
80%
0.2
.4.6
.8Fa
ilure
Rat
e
No Youth Arrest Youth ArrestOther Race Black Other Race Black
Recidivism by Sex, Race, and Youth Arrest
Female Male
as part of their case. About 10 percent (n = 1,024) of the total sample used a gun during
commission of the crime.
Figure 3: Recidivism Rates by Sex, Race, and Youth Arrest
Figure 3 shows the difference in overall recidivism rates over the course of the 11.8-year
follow-up period between males and females, blacks and non-blacks, and individuals that were
arrested as a juvenile and those who had no youth arrests. Without controlling for other factors,
males recidivate at a higher rate than females in all four comparisons (10 to 19 percent more).
This difference is particularly stark between black females and black males (18 to 19 percent
more). It is also interesting that black females recidivate at only a slightly higher rate than non-
black females (0 to 2 percent more) whether they were arrested as juvenile or not, but black
males recidivate at a rate that is 7 to 9 percent higher than males of other races. We also see that
having been arrested as a youth consistently increases the rate of recidivism when offenders are
33

62%
72%77%
54%
72%
0
.2.4
.6.8
Failu
re R
ate
Violent Sex Property Drug Other
Recidivism by Current Offense
matched on race and gender. The 80 percent recidivism rate for black males who have had a
youth arrest is higher than most any other combination of demographic factors.
Figure 4: Overall Recidivism Rates by Current Offense
__________________
Figure 4 includes the overall recidivism rates over the 11.5-year recidivism period by
most serious current offense. Offenders with drug crime as their most serious current offense
have the lowest rate of arrest or parole revocation (54 percent), while property offenders have the
highest overall rates of failure (77 percent). Sex offenders have a higher than expected
recidivism rate at 72 percent, which is about 10 percent higher than the rate for violent offenders.
Finally, offenders who committed an offense that did not fit into the sex, violent, drug, or
property categories have a 72 percent recidivism rate.
34

Figure 5: Overall Recidivism Rates by Offense Gravity Scores
.60
.83
.75
.80
.74
.65 .67.63
.51
.71
.32
.37
0.2
.4.6
.8Fa
ilure
Rat
e
1 3 5 6 7 8 9 10 11 12 13 14
Recidivism Rates by Offense Gravity Scores
The OGS is a 14-point scale developed by the PCS as a way to quantify the severity of an
individual’s current offense, with a higher score denoting a more serious offense.19 While the
OGS may be a useful indicator of the severity of the offense, our calculations show that it is a
non-intuitive predictor of recidivism — in that a more serious offense is associated with lower
recidivism. Figure 5 shows that there is a relatively strong negative (r = -.12, p <.000)
19 Sentencing levels 2 and 4 are not represented in our sample of serious offenders.
35
relationship between failure and OGS, as those with the highest OGS scores have the lowest
rates of recidivism.
Figure 6: Overall Recidivism Rates by Prior Record Scores
.61
.71
.70
.67
.70
.64
.67
.56
0 .2 .4 .6 .8Failure Rate
7
6
5
4
3
2
1
0
Recidivism Rates by Prior Record Scores
PRS is a 7 point scale used to measure the seriousness of the offender’s criminal record, with a
higher score indicating a higher number of convictions and/or more serious past convictions.
Repeat felony offenders (REFL) and repeat violent offenders (REVOC) are given the
designations of 6 and 7, respectively, and are given longer sentences. Offenders who have no
prior convictions are given a score of 0. Figure 6 shows that prior records scores have a positive
36

relationship with recidivism (r = .11, p <.000) rates, meaning that offenders who have a more
serious criminal record are more likely to recidivate. The biggest spike in recidivism rates occurs
when an offender goes from having no prior convictions (PRS=0) to having a PRS of 1. Also,
repeat violent offenders (7), while often being given the longest sentences, show a lower
recidivism rate than almost all other offenders with lower PRSs. However, there are only 13
offenders who have the REVOC designation.
Associations with Time: Survival Analysis
To provide some understanding of the patterning of recidivism over time we report
survival regression models. Survival analysis (also referred to as hazard and event history
analysis) is commonly used by criminologists to measure timing to recidivism (Allison, 1984;
Chung, 1991, Schmidt, and Witte, 1991). This method received its name because it is commonly
used by medical researchers predicting patient survival under various conditions. The purpose is
to measure the influence of covariates in the time until an event occurs by treating time as a
study variable ranging from 0 to the end of the follow-up period, which in this analysis was up to
11 years and 8 months. The longest follow-up time for a recidivist was 10 years and 10 months.
As is common in many event history analyses our sample is right-censored because we
are not be able to observe each offender until the event of interest (e.g., recidivism) occurs. This
is because many offenders were arrest free during the follow-up period. An important survival
analysis assumption is that the censored data are “noninformative” and “unlikely to bias
estimates of the effects of independent variables” (Kruttschnitt, Uggen, and Sheldon, 2000: 70,
footnote #10). That is, censoring occurs randomly, and the offenders with censored observations
are not different from those with uncensored observations with respect to their chance of
experiencing recidivism in a given time period. Survival analysis is ideal for dealing with
37

staggered entry times of participants because it deals only in study time (i.e., offender’s time at
risk). Each offender’s study time begins upon their release date, starts at time = 0, and continues
until they fail or are censored at the end of the follow-up.
Kaplan-Meier Survival Analysis
Kaplan-Meier survival analysis shows relationships between offender attributes and
survival at specified times (i.e., at 1, 3, and 5 years out) The results in Table 4 provide estimates
of the probability of survival (not recidivating) at 1, 3, and 5 years for all the covariates,
independent of each other. In this analysis, survival refers to the probability that an offender with
certain characteristics will not recidivate (i.e., survive, censored) at a given time period (t),
assuming they have not already failed (i.e., probability of surviving longer than time t) and not
controlling for other covariates. Time (T) is treated as a continuous random variable,20 and the
survival function will have a decreasing shape over time as offenders recidivate. This can be
written as S(t|xi) = P (Ti >= t).
Turning to table 4, we see that the probability of surviving 1 year is .71 for men and .84
for women. This means that men had a 71 percent chance of not recidivating before 365 days,
versus 84 percent for women. This can also be thought of as a 29 percent probability of failure
(recidivism) for men and a 16 percent probability of failure for women at the one–year mark. By
year 5, men have a 36 percent chance of surviving, compared to 57 percent for women. The log-
rank test shows that these differences are significantly different at the .05 level.21 This means that
females recidivate at a lower rate than males. To get a better sense of what these paths look like,
20 Study time is calculated from the time someone is released from prison or jail, or placed on probation until their recidivistic event or the end of the study period. 21 All differences in survival rates in the table are statistically significant (p < 0.05) with the exception of prior sex offense (vs no prior sex offense). This means that all but one covariate is predictive of recidivism.
38

as well as the number of people at risk in each year, the KM survival curves for each covariate
are included in Appendix C.
Recidivism rates are higher for males, blacks, and those with a juvenile arrest record
relative those without these characteristics. Offenders under 30 at time of sentencing are more
likely to recidivate. Offenders with a current conviction for a property offense have lower
survival rates compared to those with a current conviction for a sex, violent, drug, or other
current offense. Those with a violent, sex, property, drug, or other type of crime in their criminal
record recidivate at a higher rate than those who don’t have that particular crime type (but may
have another type of crime). The difference is most stark between offenders who have a crime in
the catch all “other” category and those who don’t – with 25 percent vs 41 percent surviving
after 5 years, respectively. Offenders with 12 or more arrests are much more likely to recidivate
than those with less. Generalists recidivate at a lower rate than specialists. Having a complete
offense, multiple charges or using a gun during the commission of a crime is also associated with
a higher rate of recidivism. Having a higher OGS is associated with a lower rate of recidivism,
however. These bivariate` relationships are explored further within the multivariate analysis
provided next.
Table 4: Kaplan Meier Survival Functions by Covariates and 1, 3, and 5 Year Rates N=10,002
1 year 3 year 5 year Gender Male .71 .47 .36Female .84 .66 .57
RaceBlack .69 .42 .31Other Race .71 .46 .35
Age Juvenile Arrest .61 .32 .21
39

No Juvenile Arrest .76 .54 .43
Age at Sentencing <30 .70 .53 .43Age at Sentencing >30 .75 .63 .55
Current OffenseViolent .73 .48 .37Sex .62 .42 .32Property .60 .31 .22Drug .80 .58 .47Other .65 .39 .33
Table 4 (continued): Kaplan Meier Survival Functions by Covariates and 1, 3, and 5 Year Rates, N=10,002 ____
1 year 3 year 5 year
Prior OffenseViolent .65 .37 .28No Violent .73 .5 .39
Sex .66 .42 .35No Sex .73 .49 .38
Property .64 .34 .25No Property .73 .5 .39
Drug .67 .40 .29No Drug .74 .51 .4
Other .63 .35 .25No Other .75 .52 .41
Criminal Career Pattern12+ Arrests .55 .23 .131-11 Arrests .75 .53 .43
Specialist .69 .45 .35Generalist .65 .38 .27
1 + Prior Record Score22 .67 .4 .3
0 Prior Record Score .78 .57 .46
22 This includes offenders who are Repeat Violent Offenders and Repeat Felony Offenders.
40
Case ConditionComplete Offense .71 .48 .37Inchoate Offense .81 .57 .44
Multiple Charges .72 .47 .36One Charge .72 .50 .39
11-14 Offense Gravity Score .75 .55 .451-10 Offense Gravity Score .72 .46 .36
Gun Possession .72 .44 .33No Gun Possession .73 .49 .39 Log-rank tests of group equality were used to determine significant differences between group survival times. All of the groups had significantly different survival times (p < 0.05), with the exception of the prior sex offense and no prior sex offense. Cox Proportional Hazards Models
The Kaplan Meier analyses are instructive to identify individual factors that are related to
recidivism. These analyses are restricted to assessing single factors at a time, and we use Cox
proportional hazards models to explore the relationship among several factors simultaneously.
The Cox model is a flexible, non-parametric technique used to analyze the determinants of
failure or event time and does not require researchers to make any assumptions about the shape
of the baseline hazard function as parametric techniques require (Box-Steffensmeier and Jones,
2004; Cox and Oakes, 1984). This is a semi-parametric technique that allows for analyzing the
predictors of survival time with censored observations (Cox and Oates, 1984). The hazards
function refers to the effect of time (after controlling for the covariates in the model) on the risk
of experiencing the event of interest at any given point in time. For example, regardless of
individual characteristics, offenders may be inherently more (or less) likely to recidivate as time
passes due to unobservable influences.23 Failing to control for such an effect may bias the results
of a survival analysis. Most survival analysis techniques deal with this issue in different ways.
One class of models, generally referred to as parametric models (e.g. Weibull, exponential, log-
23 These unobservables could be individual idiosyncrasies or external forces that change over time that are not included in this design.
41

normal, gamma), require the researcher to make some assumptions about the effect of time on
the risk of failure (or survival). The Cox model has the added benefit of controlling for the
effects of time without requiring researchers to impose assumptions about the temporal patterns
and thus is often preferred by analysts for this reason (Box-Steffensmeier and Jones, 2004; Cox
and Oates, 1984).
The Cox proportional hazards regression models are reported in table 5.24 The modeling
approach relies on theory and prior research to advance a baseline model (not reported) including
black (=1, all other races =0), male, years of age at sentencing, PRS1, and OGS11+. We advance
the baseline model by including sets of variables to account for current conviction, prior
offenses, criminal career, and case characteristics. Table 5 includes the hazards ratios from the
test subsample. The models were developed using three randomly drawn samples by splitting the
sample in half for a training sample, and then dividing the other half of the sample into validation
and test samples that are each 25 percent of the total sample. The findings between these samples
were nearly identical, which led us to estimate the final set of models in table 5 using the test
sample.
The model building procedure resulted in seven models estimated using theoretically-
relevant sets of predictors of recidivism (the baseline model is not reported here). We used the
training (50 percent, n = 5,001) and validation (25 percent, n = 2,501) samples to test each of the
sets of variables, and applied a standard 95 percent confidence interval (i.e., standard confidence
needed to suggest that the relationship is not a matter of chance) to determine the variables to test
in the “Full” model. The goal is to identify a parsimonious model of characteristics that have
high predictive validity with recidivism. Therefore, we test the models across three samples to
24 Log-rank tests and univariate Cox models were run to confirm that categorical and continuous covariates met the proportional hazards assumption inherent to Cox regression.
42

provide a stringent examination of relationships for the training and for the validation sample
tables for the Cox regression analysis. There were overall consistent findings across all three
samples, but there were some slight differences. The training sample included one model in
which prior drug offense was significant, but this was not found in any of the other samples.
And, prior other offense is only significant in the test sample (reported below, models 3 and 6).
The generalist offender measure was significant in all three of the “Career Criminal” models
(#4), but never reached significance in the full models in each of the three samples. PRS was
found significantly related to recidivism in all models that did not include number of prior
arrests. The prior arrest variable is the strongest indicator of recidivism.
Therefore, the full model includes a refined set of variables that are routinely found to be
significant in previous tests. The tables report hazard ratios, with those exceeding 1 indicative of
a positive effect on hazard and those below 1 indicative of a negative effect on hazard.
Table 5: Test Sample: Cox Regression Models, N = 2,500 (Hazard Ratios) _ Onset Current Criminal Career Case Full___ Black 1.174** 1.291*** 1.143* 1.195*** 1.188*** 1.222***Male 1.586*** 1.470*** 1.617*** 1.623*** 1.616*** 1.420***Age<30 1.286*** 1.514*** 1.657*** 1.459*** 1.464*** 1.522***PRS1 1.498** 1.622*** 1.318*** 1.497*** 1.554*** 1.358 *** OGS11+ 0.915 0.801*** 0.949 0.912 0.913* 0.822***Juvenile Ar. 1.406*** 1.359***
Current Sex 1.960*** 2.098***Current Property 1.446 1.310 Current Drug 0.742*** 0.761** Current Other 1.163 0.965
Prior violence 0.980 Prior sex 0.950 Prior prop 0.977 Prior drug 0.938 Prior other 1.229** 1.296** Arrests 12+ 2.035*** 2.003***
43

Specialist 0.774* 1.049
First-Time 0.904 1.111
Complete offense 1.132 Multiple counts 1.074 Gun possession 0.966 ______ ______ Reference categories: non-black, female, age>30, PRS 0, OGS 1-10, no juvenile arrest, current violent offense, no prior violence, sex, property, drug, or other conviction, prior arrests 0-11, generalist, inchoate offense, charged with one count, no gun possession. * p<0.05, ** p<0.01, *** p<0.001
In table 5, model 1, being black and male is related to a 17 and 59 percent higher hazard
rate relative to non-blacks and females, respectively. Both of these variables continue to have a
statistically significant effect on crime throughout the models. Offender age at sentencing are
found to have strong associations, and a prior record score of 1 or more (PRS1+) is a significant
predictor of recidivism in five of the six models reported. Having an offense gravity score of 11
or more (OGS 11+) has a consistent significant and negative relationship with recidivism,
meaning that offenders with more severe crimes (as they are currently defined by PCS) are less
likely to recidivate. This finding is similar to previous PCS reports. The first column in table five
lists the hazard ratios for juvenile arrest as a binary measure of whether an individual was
arrested prior to turning 18 years of age, and the analysis shows that individuals with a juvenile
arrest (under 18 years of age) are 41 percent more likely to recidivate.
The second model in table 5 reports the current offense measures. This model shows that
current sex offenders have a significantly higher rate of recidivism, whereas drug offenders have
a significantly lower recidivism rate. In fact, sex offenders are 96 percent more like and drug
offenders are 26 percent less likely to recidivate, relative to violent offenders (the reference
category).
44

The third model in table 5 reports the effect of particular priors on recidivism, as well as
arrest. The only prior that is significant is a category called “other” which includes crimes that
could not be easily put into the sex, violent, property, or drug categories. Offenders are more
likely to recidivate if they have a prior in the “other” category. Also, those with 12 or more prior
arrests (i.e., mean + 1 standard deviation) have a 123 percent greater likelihood of recidivism.
The career criminal model (column 4, table 5) indicates that specialist offenders have
significantly lower odds of recidivating. However, none of the case characteristics in model 5
have a significant effect on recidivism.
The full model (column 6, table 5) provides a robust set of relevant predictors to consider
in sentencing risk assessment development. We included all variables found to be significant in
the previous model. The only variables that diminished in significance were current drug
conviction; however it is still significant at the .01 level. We then move all consistently
predictive variables to the final model in table 6. Prior other was not included because it was not
found to be significant in the training and validation samples.
Table 6 provides the Cox regression model of results from the final sample that reaffirms
the findings from the analyses reported previously. The eight variables below were found to have
consistently strong and significant relationships with recidivism and they provide a basis of static
measures to predict recidivism. Males are nearly 40 percent more likely to recidivate than
females, and people less than 30 years of age at sentencing were nearly 60 percent more likely
than those 30 or older.
Table 6: Test Sample: Cox Regression Final Model, N = 2,500 __________ Hazard Ratios ________________
HR z P>z 95% C.I Male 1.38 3.21 0.001 1.134 -1.684Age <30 1.56 7.36 0.000 1.389 -1.763PRS1+ 1.30 4.70 0.000 1.166 - 1.454
45
OGS11+ .820 -3.12 0.002 .7248 - .929Juvenile Ar. 1.51 6.71 0.000 1.344 - 1.716
CurrentSex 1.86 7.92 0.000 1.597 - 2.173Drug .791 -3.11 0.002 .6831 - .9171Arrest12+ 2.35 11.98 0.000 2.048 - 2.711
Those with a PRS score of 1 or more, meaning those with any prior record, were 30 percent more
likely to recidivate compared to those with a zero score. Individuals with a juvenile arrest have a
51 percent greater chance of recidivating than individuals that had their first arrest as an adult.
For the analysis in table 6, the current offense variables were recoded as dummy variables of
current sex (=1) and current drug (=1) compared to those with a different current offense (=0).
Sex offenders have a nearly 90 percent higher probability of recidivating and drug offenders
have a nearly 20 percent lower probability of recidivating compared to individuals with a violent,
property, or “other” current offense. The prior number of arrests indicator continues to be the
strong predictor of recidivism as those with 12 or more prior arrests have a 135 percent greater
likelihood of recidivating.
The analyses thus far have focused on how each of the predictors are related to
recidivism, net of the other covariates in the models, but risk assessment development requires
developing these factors into composite scores to determine how sets of important factors are
related to recidivism. Before presenting our risk scoring procedures, we provide brief analysis
using Receiver Operator Characteristics (ROC) to estimate the Area Under the Curve (AUC)
statistics comparing the predictive power of each of the three subsamples used to develop the
risk attributes. After comparing the AUCs, the significant variables from the final model are used
46

to estimate risk scores from which we can classify offenders into risk groups, and plot the
probability of recidivism across the different risk groups.
Predictive Validity: Comparing the Area Under the Curve
The area under the curve (AUC) estimates from the receiver operating characteristics
(ROC) analysis demonstrate the predictive validity of the full models and final model to provide
comparative statistics between the training, validation, and test samples. ROC analysis is a plot
of the sensitivity (i.e., offenders predicted to recidivate who do so within the study period) and 1-
specificity (i.e., offenders predicted to recidivate who do not recidivate during the study period)
pairs that are produced as a single decision threshold is moved from lowest to highest possible
values. Sensitivity is the true positive rate and 1- specificity is the false positive rate, and these
rates are the probability of positive prediction among cases with or without a failure,
respectively. ROC estimates provide a way to compare the relative predictive validity of each of
the regression models from the test, training, and validation samples.
The challenge of prediction is often represented with a contingency table similar to the
one below. Column 1, row A demonstrate the true positive rate, or hit rate: individuals the
model predicted to recidivate who actually did so. And, Column 2, row A reports the false
positive rate or the false alarm rate, which includes individuals predicted to recidivate who did
not. Row B, column 1, shows the false negative rate, or offenders who were predicted to not
recidivate, but did so. And, finally, the true negative rate is reported in row B, column 2, which
are offenders predicted to not recidivate who survived throughout the entire follow-up (i.e.,
censored cases).
Table 7: Contingency Matrix of Observed and Predicted Recidivism
47

Column 1Recidivism
Column 2No Recidivism
Row APredictRecidivism
True Positive False Positive
Row BPredictNo Recidivism
False Negative True Negative
The goal of any prediction exercise is to maximize the true positive and true negative
rates. In a perfect sentencing scenario, for instance, this would mean that judges would identify
all the offenders who never commit another crime (true negative) and all the offenders who
reoffend (true positive). Unfortunately, such perfect prediction is impossible, but ROC estimates
provide a measure of how well each model balances true positives (i.e., benefits) and false
positives (i.e., costs).
The AUC estimate the probability that a classifier, which differs by model, will rank a
randomly chosen positive instance higher than a randomly chosen negative instance. It varies
from 0.5 (accuracy is not improved over chance) to 1.00 (perfect accuracy). In table 8, the AUCs
are reported from the training, validation, and test samples using the full model and the final
model from the training sample (table 6). The analysis shows a consistently high predictive
validity across the samples (69.7-70.7 percent accuracy) to suggest that the findings are not a
matter of chance or peculiarities of any one sample drawn. There are at least two other important
findings revealed from this analysis. First, the AUC estimates are significant at the 95 percent
confidence level in each of three samples, indicating that each predicts recidivism statistically
better than chance. And, second, the AUCs are nearly identical suggesting that our findings are
48

not the result of over-fitting, but rather are indicative of real relationships between level 5
offenders and recidivism.
Table 8: Comparing Predictive Accuracy of Training, Validation, and Test Final Cox Proportional Hazards Models
AUC S.E. 95% C.I. Train Full 0.707 0.007 0.693 - 0.722Validation Full 0.697 0.010 0.676 - 0.717Test Full 0.705 0.010 0.685 - 0.727Test Final 0.701 0.010 0.680 - 0.722
Risk Assessment Scoring and Classification
The analysis to this point has identified robust relationships between certain offender
characteristics and recidivism. However, risk assessment development requires aggregating these
characteristics in different ways. Development a risk assessment instrument requires that
researchers make decisions regarding what issues are most important to practitioners —there
must be a balance between public safety, over prosecution, ethical concerns, and practicality.
Burgess’ (1928) method of using unweighted binary factors to classify offenders has been
embraced by several researchers, and the PCS found this scoring approach predicted equally as
well as a weighted version and a more advanced statistical approach (also, see Monahan,
Steadman, Silver, Appelbaum, et al., 2001). This approach maximizes practicality because it
relies on summing binary (0, 1) indicators across factors, and identifying different cutoffs related
to recidivism. Additionally, recent research by the Pennsylvania Department of Corrections has
found a similar approach using only static items to predict recidivism as well as more
complicated risk assessments (i.e., Level of Service Inventory-Revised).
The survival analysis identified a set of indicators that were scored (0, 1) and summed so
that larger values were related to recidivism. Table 9 provides a description of our coding
49

scheme for developing the risk scores. Risk assessment development requires that researchers
make practical judgments related to ethics and practical necessity. For this reason, offender race
is not included in the scoring procedure. 25 Gender (male = 1) and age at sentencing, which is
coded as a binary factor of below the mean age at sentencing (< 30 years old = 1) and above the
mean age sentencing (=> 30 years old = 0) are included in the scoring procedure. A PRS score of
0 (=1) is included in the scoring procedure and an offense gravity score of 11 or higher
(OGS11+), which had a consistently negative association with recidivism.
Table 9: Coding and Variable Definitions
______
1. Male=12. PRS1+: Prior record score of 1 or above = 1 3. Juvenile Arrest: First arrest <18 =14. Age < 30 = 15. Arrests12+: Offender had 12 or more arrests = 16. Current Offense: drug offense = 0, violent, property, and other offenses = 1, and sex
offense = 27. OGS < 11 = 1
__________________________________________
Juvenile arrest and 12 or more arrests (mean plus one standard deviation) were each
scored as 0,1 positive indicators. Two offense types were consistently related to recidivism in the
survival analyses: current sex conviction and drug convictions. Current sex conviction is
positively related to recidivism, and drug conviction was found to be negatively related to
recidivism. To provide some weighting for these relationships between current offense and
25 Using race as a risk factor for recidivism is not in line with many other goals of the criminal justice system, such as reducing minority over-representation and racial bias.
50

7.7%
30%
39.6%
50.7%
65%
76.3%
84.2%88%
0.2
.4.6
.8Fa
ilure
Rat
e
0 1 2 3 4 5 6 7
Recidivism by Risk Score
recidivism, the following coding scheme was used: drug =0, violent, property, and other = 1, and
sex =2. The risk classification method has a potential range of 0-8.
Figure 7 and table 10 show the positive linear relationship between recidivism and risk
score. Figure 7 shows the percent failing by each risk score and table 9 gives a breakdown of
how many offenders are in each group. The individuals scoring 0 (i.e., female drug offenders
without any of the other risk factors) have less than an 8 percent failure rate, with 2 of these 26
people failing. The failure rates increase to 30 percent and 39 percent for those with scores
between 1 and 2, respectively, which is nearly half the overall failure rate. The failure rates peak
at 84 percent and 88 percent for those scoring between 6 (494/587) and 7 (81/92) points,
respective.
Figure 7: Recidivism Rates by Overall Risk Score for the Entire Sample, 10,002
Table 10: Raw Risk Scores for the Entire Sample, 10,002
51

Risk Score 0 1 2 3 4 5 6 7 Total #Survived 24 219 570 1,039 1,191 600 93 11 3,747 %Survived 92.31 69.97 60.45 49.29 35.03 23.69 15.84 11.96 37.46
#Recidivated 2 94 373 1,069 2,209 1,933 494 81 6,255 %Recidivism 7.69 30.03 39.55 50.71 64.97 76.31 84.16 88.04 62.54 Total 26 313 943 2,108 3,400 2,533 587 92 10,002
These raw scores serve as the basis for developing risk group classifications. These
scores were collapsed into low (0-3), medium (4-5), and high (6-7) groups based upon their
failure rates. In table 11 we report the risk group classifications and recidivism rates. Table 11
reports the failure rates by risk group in which 45 percent (1,538/3,390), 70 percent
(4,142/5,933), and 85 percent (575/679) of the low, medium, and high risk groups recidivated
during this study, respectively.
Table 11: Risk Classifications and Recidivism for the Entire Sample, 10,002 Risk Group Low Medium High Total #Survived 1,852 1,791 104 3,747 % Survived 54.63 30.19 15.32 37.46
#Recidivated 1,538 4,142 575 6,255 %Recidivism 45.37 69.81 84.68 62.54 Total 3,390 5,933 679 10,002
These descriptive statistics provide initial support for the factors selected and the scoring
procedures used to develop the risk classifications. In table 12, we report univariate Cox
regression models to provide further evidence of the association between these groups and
recidivism. The hazard ratios provide an initial exploration of the relationship between the risk
groups and recidivism for the test, validation, and training sample.26 Compared to offenders in
26 A similar cross validation technique was used for the analysis in table 11, but the three random samples were redrawn because we do not want to test the risk groups on the same samples as was used for development.
52

the low risk group (reference category) the medium risk group is 95 percent to 126 percent more
likely to recidivate. Offenders in the high risk group are 223 percent to 341 percent more likely
to recidivate than the low risk group.
Table 12: Cox Proportional Hazards Regression Analysis of Risk Groups and Recidivism
Test Validation Training Low (reference) Medium 2.244*** 1.953*** 2.260***High 4.056*** 3.228*** 4.407***
BIC 49521.8 22614.2 22277.2 * p<0.05, ** p<0.01, *** p<0.001
Kaplan Meier Survival Plots of Recidivism by Risk Groups
A final step in the analysis is to consider the survival plots across the three risk groups.
One of the added benefits of Kaplan Meier survival analysis is the ability to provide easy to
interpret graphs about the performance of groups over time regarding the outcome variable. In
figures 3, we plot the survival probability estimates for the three risk groups to provide a visual
of how each group performs over time with regard to recidivism. All individuals enter the study
at t = 0 and there is a 100 percent survival at that time (as can be seen at the upper left-hand
corner of each of the figures).
Figure 8 shows the survival rates that individuals in the low risk (solid line) group have a
much higher survival probability throughout the study than those in the other three groups. In
fact, the differences here are rather stark, and start immediately upon entering the study, which
means that low risk offenders not only have a lower chance of recidivating, but when they do
recidivate, they do so at a slower rate.
53

Figure 8: Kaplan Meier Survival Estimates for Risk Groups ______
0.00
0.25
0.50
0.75
1.00
0 1 2 3 4 5 6 7 8 9 10 11 12analysis time
Low MediumHigh
Risk Group Survival Rates
Conclusions
The analyses are a first step in understanding the long-range recidivism patterns among
offenders sentenced at the highest sentencing level in Pennsylvania. Our statistical approach was
rooted in prior research and criminological theory to locate a parsimonious set of factors which
predicted recidivism. While we were constrained to using factors that judges had at the
sentencing stage, all of the factors studied and selected are strongly related to recidivism. The
case and offenders characteristics identified are factors that judges currently use to make
decisions. The assessment process compiled these factors into a structured instrument that has
the potential to make judges more aware of the relationship between offender characteristics and
recidivism.
The research reported here incorporated criminological theory and prior research findings
with a detailed analytical plan. The data is composed of offenders sentenced at level 5 in
54
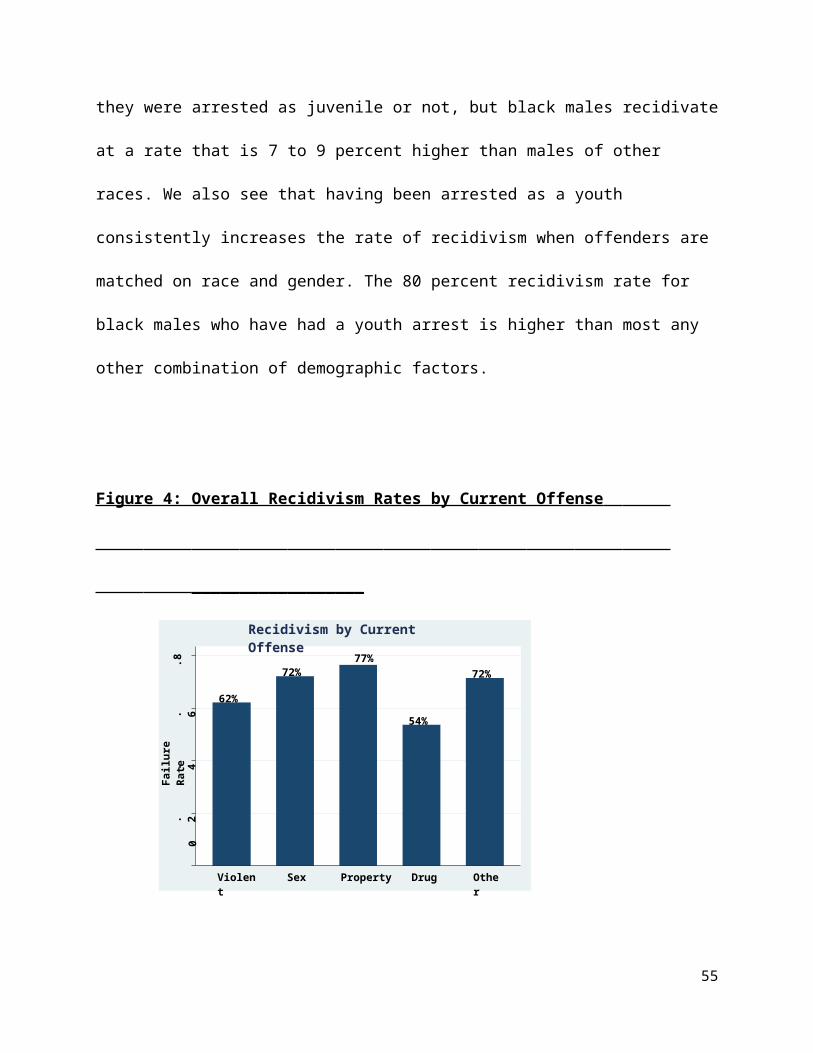
Pennsylvania between 2001 and 2005, who were released for at least 6 months at the start of the
study.27 The outcome variable was gathered from PA state police arrest records and from the PA
Department of Corrections (i.e., parole revocations). The analysis started with descriptive
statistics of the entire dataset (n = 10,002) before we split the sample into training, development,
and test samples to follow advanced approaches in statistical learning for cross-validation (Hastie
et al., 2006). Kaplan-Meier survival analysis and Cox Proportional Hazards regression analysis
were used to identify covariate patterns with recidivism. The Cox regression models advanced a
baseline model by estimating an additional five models in which the covariates that met the
standard 95 percent confidence level (α = .05) and had practical validity were included in the
final regression analyses.
The analyses were performed on all three datasets using the following steps. First, we
explored associations and model strength with the training sample. Second, we verified the
results with the validation sample, and when we found inconsistencies, we returned to the
training sample for continued analysis. Third, we continued to go back and forth between the
training and validation samples until we found highly consistent results. Fourth, we estimated all
models with the test dataset. The only adaptations made with the test sample were minor, and
namely involved recoding certain variables. ROC analysis was used to estimate AUC
coefficients across the three samples in which we found nearly identical estimates, with all
estimates predicting significantly better than chance. The statistical approach we used relied on
survival analysis to allow for a staggered entry to the study time and control for right censoring
(i.e., those not recidivating), but we also performed discrete time logistic regression analyses
(that are unreported) to confirm that the results were not dependent on particular time periods.
27 Some offenders recidivated before 6 months, but all were given the potential to recidivate for at least 6 months.
55

These analyses resulted in the development of three risk classification groups using a risk
scale composed of 8 characteristics. These items are static criminal justice and demographic
factors. The characteristics used to classify offenders are:
1. Male=12. PRS1+: Prior record score of 1 or above = 1 3. Juvenile Arrest: First arrest <18 =14. Age <30 = 15. Arrests12+: Offender had 12 or more arrests = 16. Current Offense: drug offense = 0, violent, property, and other offenses = 1, and sex
offense = 27. OGS < 11 = 1
Hyatt and Bergstrom (2011) point out that sentencing is a matter of balancing art and
science, and risk assessment development must also maintain such a balance. Thus, we made
several decisions to select factors and to score individuals into different risk groups. These
decision were made in consultation with PCS and by following precedents set in risk assessment
literature. However, ultimately, research cannot speak to the legality or the morality of these
decisions. First, we followed conventional ethical norms and excluded race as a consideration in
the risk scoring procedures. Race was controlled for in the statistical analyses, although it would
have also improved classification if included in the risk scoring procedure. Second, we have
decided to include OGS in the final risk scale. A higher OGS was found to have a consistent
negative relationship with recidivism, which replicates what PCS has found with less serious
offenders. However, it should be noted that practitioners may take issue with a risk assessment
that puts offenders with more serious crimes into lower risk categories — particularly if this
instrument is used to divert lower risk offenders away from prison. Third, while race was left
out, age and gender were included in the risk assessment scoring procedure. Offenders have no
control over their age or gender, thus criticism has been put forth about whether these factors
56

should be included in a risk assessment, and particularly whether this is a legal practice. These
are issues that research cannot answer and that the PCS will need to explore as they move
forward with this mandate. On a more practical note, interaction terms between PRS and OGS
were considered, but ruled out because such measures move away from the ease and practical
utility of the ten items that were selected. A surprise is that current sex offense conviction was
found to be significant and positively related with recidivism, despite past literature to the
contrary. Initially, it was thought this might be a matter of over-fitting, but this finding was
supported across both cross-validation samples (and in numerous unreported analyses). We
suggest further research into this finding, as it stands in contrast to much sex offender recidivism
literature.
As with any research project, this study has limitations. First, the outcome measure is
broad and captures any arrest or revocation. In the future, it would be interesting to look at the
nature of the recidivism offense, especially as it relates to violent recidivism. Separating
outcomes by arrests, revocation, and reconviction would also show different pathways of
recidivism for offenders — particularly as this relates to type of current offense. Second, the
study does not consider the potential differences in the covariate pattern of predictors for females
(i.e., this resulted in some female offenders scoring zero, but recidivating). The findings signal a
need for more nuanced study of gender differences to tease out the different recidivism pathways
for women and men. Third, the analyses do not account for within individual changes, or
organizational, legal, and cultural changes that occurred during the time of the study that
potentially influenced the results. Analyses are needed that provide a more intricate investigation
of time-varying covariates and the nested nature of offenders within broader social contexts.
Finally, and perhaps most importantly, this report does not provide guidance on how to best use a
57

risk assessment tool at sentencing. Risk of recidivism is only one consideration that judges use to
make sentencing decisions and our analysis cannot speak to the relative importance of other
considerations, such as retribution or rehabilitation potential. These issues become particularly
salient for a state like Pennsylvania because sentencing guidelines already prescribe the intended
punishment without consideration of risk. Interested parties in Pennsylvania will have to decide
the logistics of adopting a sentence risk assessment instrument as per SB 1161. Despite these
limitations, the analysis provides a glimpse into the covariate patterns of level five offenders and
an initial risk assessment scoring procedure that can be integrated with previous research and
enhanced by future endeavors.
The use of risk assessment tools has gained prominence within the corrections field. In
fact, many jurisdictions require probation and parole officers to conduct general assessments,
substance abuse assessments, and specialized assessment for sex or domestic violence offenders.
And, in several states prisons rely on intake units to conduct a battery of assessments when new
inmates are admitted. Regardless of the setting, however, these assessments are used with the
hopes of improving offender outcomes by reducing recidivism, and maximizing resources by not
over supervising low risk offenders or placing offenders in inappropriate programs.28 There are
several reasons for the increased use of risk assessments in corrections, but one overriding reason
is related to the consistent finding that desired outcomes are more likely to be achieved when
actuarial decision making is used. Meehl’s (1954) well-known review of research nearly 60 years
ago provided a strong footing for such a claim. And, numerous criminologists have since
supported the use of risk assessment in corrections because they are related to improved
outcomes for offenders (Andrews and Bonta, 2006; MacKenzie, 2006).
28 Researchers have found that placing low risk individuals in treatments designed for high risk offenders tends to increase recidivism (Lowenkamp et al., 2006).
58

Criminal justice professionals make difficult decisions every day. These decisions have
implications for public safety, justice, and the civil liberties of offenders. Currently, there is
potential to blend social science methods into the sentencing decision making process in order to
give the courts more information at sentencing. We have completed this report with the hopes of
contributing to this literature, and providing the PCS with initial research into level five
offenders.
References
Albonetti, C. (1991). An integration of theories to explain judicial discretion. Social Problem, 38(2): 247-266.
Allison, P. (1984). Event history analysis: Regression for longitudinal event data. Beverly Hills, CA: Sage.
Andrews, D. and Bonta, J. (2006). The psychology of criminal conduct, 3rd edition. Cincinnati, OH: Anderson Publishing.
Andrews, D., Zinger, I., Hoge, R., Bonta, J., Gendreau, P., and Cullen, F. (1990). Does correctional treatment work? A clinically relevant and psychologically informed meta-analysis. Criminology, 28(3), 369-404.
Archer, John. 2004. Sex differences in aggression in real-world settings: A meta-analytic review. Review of General Psychology 8:291–322.
Beck, A. and Shipley, B. (1989). Recidvism of Prisoners Released in 1983. Bureau of Justice Statistics.
Bergstrom, M. and Mistick, J. (2010). Danger and opportunity: Making public safety job one in Pennsylvania’s Indeterminate sentencing system. Justice Research and Policy, 12(1): 73-88.
Bergstrom, M. (2011). Thoughts from Pennsylvania on Imprisonment and crime: Can both be reduced? Criminology and Public Policy, 10(1):55-62.
59
Blumstein, A., Cohen, Jeffery A. Roth, and Christy A. Visher. Washington, DC: National Academy Press.
Box-Steffensmeier, J. and Jones, B. (2004). Event history modeling: A guide for social scientists. New York: Cambridge University Press.
Burgess, E. (1928). Factors determining success or failure on parole. In The Working of the Indeterminate Sentence Law and the Parole System in Illinois (eds. A. Bruce, A. Harno, E. Burgess, and J. Landesco), pp. 205-249. Springfield: State Board of Parole.
Chanenson, S. (2003). Sentencing and data: The not-so-odd couple. Federal Sentencing Reporter, 16(1): 1-7.
Chanenson, S. (2005). The next era of sentencing reform. Emory Law Journal, 54(1): 378-460.
Chung, C., Schmidt, P., Witte, A. (1991). Survival analysis: A survey. Journal of Quantitative Criminology, 7(1): 59-98). Cohen, J. (1986). Research on criminal careers: Individual frequency rates and offence seriousness. In A. Blumstein, J. Cohen, J. A. Roth, & C. A. Visher (Eds.), Criminal careers and “career criminals”(pp. 292-418). Washington, DC: National Academy Press.
Cox, D. and Oakes, D. (1984). Analysis of survival data. London: Chapman and Hall.
Cullen, F. (2011) Beyond Adolescence-Limited Criminology: Choosing Our Future—The American Society of Criminology 2010 Sutherland Address. Criminology, 49 (3):287-330.
Daly, K., and Bordt, R. (1995). Sex effects and sentencing: an analysis of statistical literature. Justice Quarterly 12: 141-175.
Scott, D. (2010). Firearm Involvement Influences on the Recidivism of Gang Members Compared to Non-Gang Members. Sociological Imagination, 46(1), 65-80.
Farrington, D. P., Snyder, H. N., & Finnegan, T. A. (1988). Specialization in juvenile court careers. Criminology, 26(3), 461–488.
Farrington, D. P. (2003). Key results from the first 40 years of the Cambridge Study in Delinquent Development. In Thornberry T. P. and Krohn, M.D. (Eds.)Taking Stock of Delinquency: An Overview of Findings from Contemporary Longitudinal Studies.(pp. 137–183).New York: Kluwer/Plenum.
Frazier, E., Bock, E., and Heretta, C. (1983). The role of probation officers in determining gender differences in sentencing severity. Sociological Quarterly. 24: 305-318.
Garland, D. (2001). The culture of control: Crime and social order in contemporary society. Chicago: University of Chicago Press.
60

Gendreau, P., Little, T., and Goggin, C. (1996).A meta-analysis of the predictors of adult offender recidivism: What works! Criminology, 34, 575-607.
Gottfredson, M., and Hirschi, T. (1990). A general theory of crime. Stanford, CA: StanfordUniversity Press.
Gottfredson, D. (1999). Effects of judges’ sentencing decisions on criminal career. Research in Brief. National Institute of Justice, November: 1-12.
Griset, P. (1999). Criminal sentencing in Florida: Determinate sentencing’s hollow shell. Crime and Delinquency, 45: 316-333.
Grove, W.M., and Meehl, P.E. (1996). Comparative efficiency of informal (subjective, impressionistic) and formal (mechanical, algorithmic) prediction procedures: The clinical-statistical controversy. Psychology, Public Policy, and Law, 2, 293–323.
Grove, W. M., Zald, D. H., Lebow, B. S., Snitz, B. E., and Nelson, C. (2000). Clinicalvs. mechanical prediction: A meta-analysis. Psychological Assessment, 12, 19-30.
Hanson, R. K., Scott, H., & Steffy, R. A. (1995). A Comparison of Child Molesters and Non-Sexual Criminals: Risk Predictors and Long-term Recidivism. Journal of Research in Crime and Delinquency, 32(3), 325-337.
Harris, D. A., Smallbone, S., Dennison, S., & Knight, R. A. (2009). Specialization and versatility in sexual offenders referred for civil commitment. Journal of Criminal Justice, 37(1), 37–44. doi:10.1016/j.jcrimjus.2008.12.002
Harris, D. A., Knight. R. A., Smallbone, S., & Dennison, S. (2011) Post-release specialization and versatility in sexual offenders referred for civil commitment. Sexual Abuse: Journal of Research and Treatment 23(2): 243-259.
Harris, D. A., Smallbone, S., Dennison, S., and Knight, R. A. (2009). Offense specialization and versatility in the criminal histories of adult male sexual offenders referred for civil commitment. Journal of Criminal Justice 37: 37-44.
Hastie, T., Tibshirani, R., and Friedman, J. (2008). The elements of statistical learning: Data mining, inference, and prediction. New York: Springer.
Huebner, B. M., Varano, S. P., & Bynum, T. S. (2007). Gangs, guns, and drugs: recidivism among serious, young offenders*. Criminology & Public Policy, 6(2), 187-221.
Hyatt, J., Bergstrom, M., and Chanenson, S. (2011). Follow the evidence: Integrate risk assessment into sentencing. Federal Sentencing Reporter, 23(4): 266-321).
61

Kleiman, M., Ostrom, B., and Cheesman, F. (2007). Using risk assessment to inform sentencing decision for nonviolent offenders in Virginia. Crime and Delinquency, 53(1): 106-132.
Kruttschnitt, C. Uggen, C. and Sheldon, K. (2000). Predictors of desistance among sex offenders: The interaction of formal and informal social controls. Justice Quarterly, 17(1): 61-87.
Langan, P. A., Greenfeld, L. A., Smith, S. K., Durose, M. R., & Levin, D. J. (2001). Contacts between Police and the Public: Findings from the 1999 National Survey. Washington, DC: Bureau of Justice Statistics.
Langan, P.A., & Levin, D.J. (2002). Recidivism of Prisoner Released in 1994. Bureau of Justice Statistics.
Langan, P.A., & Levin, D.J. (2002). Recent State Reforms II: The Impact of New Fiscal and Political Realities, Federal Sentencing Reporter Vol. 15, No. 1, pp. 58-65
Laub, John H. 2006. Edwin H. Sutherland and the Michael-Adler report: Searching for the soul of criminology—The American Society of Criminology 2005 Sutherland Address. Criminology 44: 235–57.
Laub, John H., and Robert J. Sampson. 2003. Shared Beginnings, Divergent Lives: Delinquent Boys to Age 70. Cambridge, MA: Harvard University Press.
Little Hoover Commission (2007). Solving California’s Corrections Crisis: Time Is Running Out. At http://www.lhc.ca.gov.
Lo, C.C., Kim, Y.S., & Cheng, T.C. (2008). Offense Specialization of Arrestees An Even Hisotry Analysis. Crime and Delinquency:54(3) 341-365
Lowenkamp, C., Latessa, E., and Holsinger, A. (2006). The risk principle in action: What we have learned from 13,676 offenders and 97 correctional programs. Crime and Delinquency, 52(1), 1 – 17.
Lowenkamp, C, Latessa, E., and Smith, P. (2006). Does correctional program quality really matter? The impact of adhering to the principles of effective intervention. Criminology and Public Policy, 5(3), 575 – 594.
Lynam, D. R., Piquero, A. R., and Moffitt, T. E. (2004). Specialization and the propensity to violence: Support from self-reports but not official records. Journal of Contemporary CriminalJustice, 20, 215-228.
MacKenzie, D. (2006). What Works in Corrections? Reducing the Criminal Activities of Offenders and Delinquents. Cambridge, UK: Cambridge Press.
Matza, David. 1964. Delinquency and Drift. New York: John Wiley and Son.
62

Meehl, P. (1954). Clinical versus Statistical prediction: A theoretical analysis and a review of the evidence. MN: University of Minnesota University.
Miller, M. (2005). A map of sentencing and a compass for judges: Sentencing information systems, transparency, and the next generation of reform. Columbia Law Review, 105: 1-48.
Missouri Sentencing Advisory Commission. (2010a).Evidence based sentencing to reduce recidivism: A judge’s report. Smart Sentencing, 2(4): 1-3.
Missouri Sentencing Advisory Commission. (2010b). Sentencing information on www.mosac.mo.gov now includes costs of recommended sentences and risks of reincarceration. Smart Sentencing, 2(5): 1-3.
Moffitt, T.E., Mednick S.A., and Gabrielli, W.F. (1989). Predicting criminal violence: descriptive data and predispositional factors. In D. Brizer & M. Crowner (Eds.) Current approaches to the prediction of violence (pp 13-34). New York, NY: American Psychiatric Association Press.
Moffitt, T.E. (1993). Adolescence-limited and Life-course-persistent antisocial behavior: A developmental taxonomy. Psychological Review, 100, 674-701.
Monahan, J., Steadman, H., Silver, E., Appelbaum, P., Robbins, P., Mulvey, E., Roth, L., Grisso, T., and Banks, S. (2001). Rethinking Risk Assessment: The MacArthur Study of Mental Disorder and Violence. New York: Oxford University Press.
Monahan, J. (2006). A jurisprudence of risk assessment: Forecasting harm among prisoners, predators, and patients. Virginia Law Review, 92: 391-435.
Monahan, J. and Walker, L. (2011). Twenty-five years of social science in law. Law and Human Behavior, 35: 72-82.
Moore, M. (2002). The limits of social science in guiding policy. Criminology, 2(1): 33-42.
Morenoff, Jeffrey and Robert Sampson. (1997). Violent crime and the spatial dynamics of neighborhood transition: Chicago, 1970-1990. Social Forces 76: 31-64.
Nagin, S.D., Cullen, T.F., and Johnson, C.L., (2009). Imprisonment and Reoffending. In Crime
and Justice. A Review of Research(Michael Tonry, ed.), Vol. 38
Nagin, D., and Snodgrass, G. (2012). The effect of incarceration on re-offending: Evidence from a natural experiment in Pennsylvania. Working Paper. Pittsburgh, PA: Carnegie Mellon. Paternoster, R., Brame, R., Piquero, A., Mazerolle, P., & Dean, C. W. (1998). The forward specialization coefficient: Distributional properties and subgroup differences. Journal of Quantitative Criminology, 14(2), 133–154.
63

Pennsylvania Commission on Sentencing, Risk Assessment Project, Interim Report on Review of Risk Assessment Instruments. Available at http://pcs.la.psu.edu/publications-and-research/research-and-evaluation-reports/risk-assessment
Pennsylvania Commission on Sentencing, Risk Assessment Project, Interim Report 2 on Initial Recidivism Information. Available at http://pcs.la.psu.edu/publications-and-research/research-and-evaluation-reports/risk-assessment
Pennsylvania Commission on Sentencing, Risk Assessment Project, Interim Report 3 on actors that Predict Recidivism for Various Types of Offenders. Available at http://pcs.la.psu.edu/publications-and-research/research-and-evaluation-reports/risk-assessment
Pennsylvania Commission on Sentencing, Risk Assessment Project, Interim Report 4 on Development of Risk Assessment Scale (revised). Available at http://pcs.la.psu.edu/publications-and-research/research-and-evaluation-reports/risk-assessment
Pennsylvania Commission on Sentencing, Risk Assessment Project, Interim Report 5 on Developing Categories of Risk. Available at http://pcs.la.psu.edu/publications-and-research/research-and-evaluation-reports/risk-assessment
Pennsylvania Commission on Sentencing, Risk Assessment Project, Interim Report 6 on Impact of Risk Assessment Tool for Low Risk Offenders. Available at http://pcs.la.psu.edu/publications-and-research/research-and-evaluation-reports/risk-assessment
Petersilia, J. (2003). When prisoners come home: Parole and prisoner reentry. New York: Oxford University Press.
Pew Center on the States. (2009). Arming the courts with research: 10 Evidence based sentencing initiatives to control crime and reduce costs. D.C.: Pew Center on the States.
Piquero, A., Brame, R., & Lynam, D. (2004). Studying criminal career length through early adulthood among serious offenders. Crime and Delinquency, 50, 412 – 435.
Piquero, A. R., Farrington, D. P., and Blumstein, A. (2003). The Criminal Career Paradigm. Crime and Justice, 30, 359–506.
Piquero, A. (2000). Frequency, specialization, and violence in offending careers. Journal ofResearch in Crime and Delinquency, 37, 391-418.
Roberts, Julian. (2008). Punishing Persisten Offenders: Community and Offenders Perspectives.
Sample, L.L., & Bray, T.M. (2003) Are Sex Offenders Dangerous? Criminology &. Public Policy, Vol. 3 (1): 59-82.
Sampson, Robert and Groves, B. (1989). Community structure and crime: Testing social disorganization theory. American Journal of Sociology 94: 774-802.
64
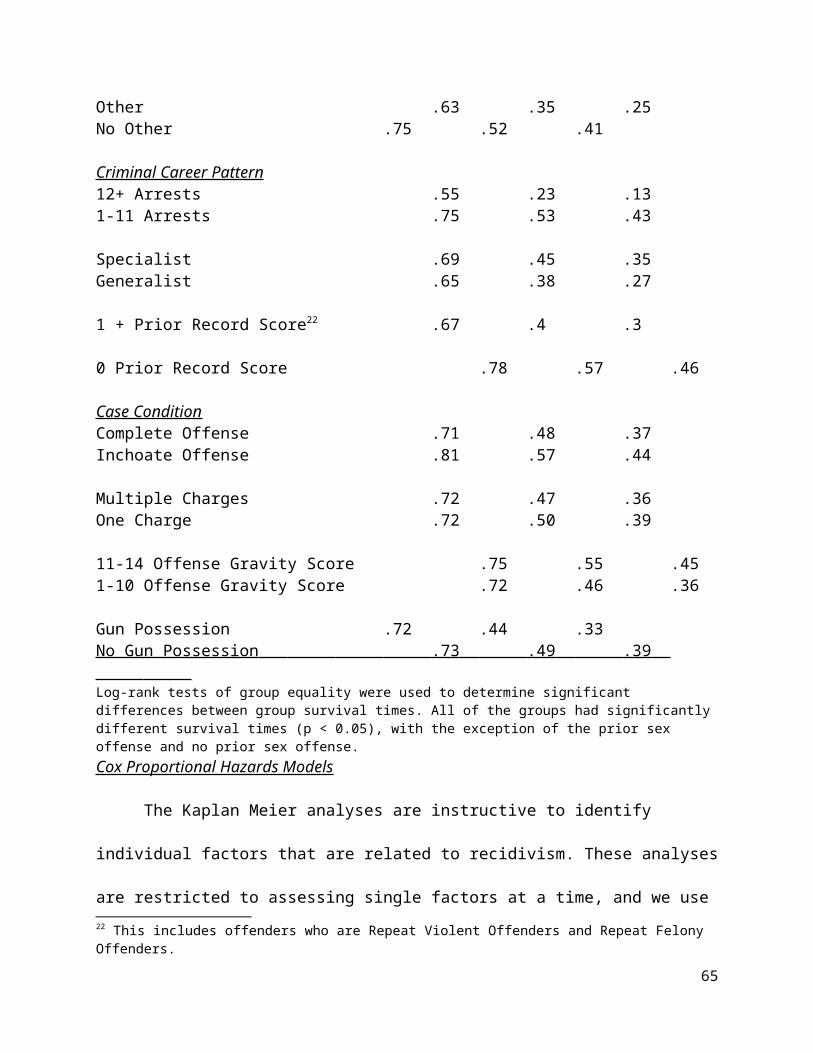
Sampson, R. and Laub, J. (1993). Crime in the making: Pathways and turning points through the life course. Cambridge, MA: Harvard University Press.
Savelsberg, J. (1992). Law does not fit society: Sentencing guidelines as a neoclassical reaction to the dilemmas of substantivized law. American Journal of Sociology, 97: 1346-1381.
Schwaner, S.L. (2000). Stick 'Em Up, Buddy": Robbery, Lifestyle, and Specialization Within a Cohort of Paroless. Journal of Criminal Justice, Vol 28, Issue 5. September-October, 371-384.
Shaw, C. and McKay, H. (1942). Juvenile delinquency and urban research. Chicago: University of Chicago Press
Sheman, W. L., (1998). Evidence-Based Policing. Washington, DC: Police Foundation. http://www.policefoundation.org/pdf/Sherman.pdf
Silver, E., and Chow-Martin, L. (2002). A multiple models approach to assessing recidivism risk: Implications for judicial decision making. Criminal Justice and Behavior, 29, 538-568.
Simon, L. (1997). Do criminal offenders specialize in crime types? Applied and Preventative Psychology, 6(1), 35–53.
Simons, R. L., and Burt, C.B., (2011). Learning to Be Bad: Adverse Social Conditions, Social Schemas, and Crime. Criminology, 49(2): 553-598.
Spohn, C. (2009). How Do Judges Decide? The Quest for Fairness and Justice in Punishment. 2nd Edition. Thousand Oaks, CA: Sage Publications.
Sobsey, Dick, Wade Randall, and Rauno K. Parrila. 1997. Gender differences in abused children with and without disabilities. Child Abuse and Neglect 21:707–20.
Spohn, C., & Holleran, D. (2002). The effect of imprisonment of recidivism rates of felony offenders: A focus on drug offenders. Criminology: 40(2), 329-358.
Stewart, Eric A., Christopher J. Schreck, and Ronald L. Simons. 2006. “I ain’t gonna let no one disrespect me”: Does the code of the street reduce occurrences of violent victimization among African American adolescents? Journal of Research in Crime and Delinquency 23:1–33.
Sutherland, E. (1937). The Professional Theif. Chicago: University Of Chicago Press.
Taxman, F.S. (2008). No Illusion, Offender and Organizational Change in Maryland's Proactive Community Supervision Model. Criminology and Public Policy 7(2): 275-302.
Tonry, M. (1987). Prediction and Classification: Legal and Ethical Issues. Crime and Justice 9, 367-413
Tonry, M. (1996). Sentencing matters. New York: Oxford University Press.
65
Tracy, P.E. and Kempf-Leonard, K. (1996). Continuity and Discontinuity in Criminal Careers. New York, NY: Plenum Press
Tripodi, S., Kim, J., and Bender, K. (2010). Is employment associated with reduced recidivism: The complex relationship between employment and crime. International Journal of Offender Therapy and Comparative Criminology, 54(5): 706-720.
Wacquant, L. (2002). From slavery to mass incarceration: Rethinking the ‘race question’ in the US. New Left Review, 13, 41−60.
Warr, M. (1996). Organization and Instigation in Delinquent Groups. Criminology, 34(1), 11–37.
Warren, R. (2007). Evidence-based practice to reduce recidivism: Implications for state judiciaries. Washington, DC: National Institute of Corrections.
Weisburd, D., Telep, C. W., Hinkle, J. C., and Eck, J. E. (2010). Is problem-oriented policing effective in reducing crime and disorder? Findings from a Campbell systematic review. Criminology and Public Policy, 9(1), 139–172.
Western, B., and Pettit, B. (2005). Black-White wage inequality, employment rates, andincarceration. American Journal of Sociology, 111, 553−578.
Wilson, J., Austin, J. and Naro, W. (2007). Innovations in probation: Assessing New York City’s Automated Reporting System. Washington, DC: JFA Associates
Wilson, W. J. (1987). The truly disadvantaged: The inner city, the underclass, and publicpolicy. Chicago: University of Chicago Press.
Wikstrom, P. (1987). Patterns of crime in a birth cohort age, sex, and social class differences (Project Metropolitan Research Rep. No. 24). Stockholm: Stockholm University.
Wolff, M. (1995). Missouri’s information-based discretionary sentencing system. Ohio State Journal of Criminal Law, 4:95-120.
Wolff, M. (2008). Lock ‘em up and throw away the key? Cutting recidivism by analyzing sentencing outcomes. Federal Sentencing Reporter, 20(5): 320-321
Virginia Criminal Sentencing Commission. (2001). Assessing Risk among Sex Offenders in Virginia. Richmond, VA: Crime Sentencing Commission.
Vigorita, M. (2003). Judicial risk assessment: The impact of risk, stakes, and jurisdiction. Criminal Justice Policy Review, 14(3): 361-376.
66

Appendices
67
Appendix ACurrent Offense Coding
Violent Offenses
Aggravated Assault - Cause S.B.I.
Aggravated Assault - Attempt S.B.I.
Aggravated Assault - Cause S.B.I. Police, etc.
Aggravated Assault - Attempt S.B.I. Police, etc.
Aggravated Assault - Cause or Attempt B.I. Police, etc.
Aggravated Assault - Cause or Att B.I. w/Deadly Weapon
Aggravated Assault - Fear S.B.I.
Neglect Care-dependent Person (Cause S.B.I.)
Arson - Endangering Persons; Person in Bldg. or B.I. results
Arson - Endangering Persons; Nobody in Bldg. and no B.I.
Assault by Prisoner
Burglary - Home: Person Present
Murder Inchoate - Conspiracy - no S.B.I.
Murder of The Third Degree
Murder Inchoate - Conspiracy with S.B.I.
68

Murder Inchoate - Attempt with S.B.I.
Murder Inchoate - Attempt - no S.B.I.
Murder Inchoate - Solicitation - no S.B.I.
Terroristic Threats
Robbery - Inflicts S.B.I.
Robbery - Threatens S.B.I.
Robbery - Commit/Threaten any F1 or F2
Robbery - Inflicts or Threatens B.I.
Unlawful Restraint-Victim <18 yrs old
Robbery of Motor Vehicle - with S.B.I.
Robbery of Motor Vehicle - without S.B.I.
Discharge of Firearm into an Occupied Structure
Voluntary Manslaughter
Endangering Welfare of Children - Course of conduct
Suicide, Causing or Aiding as Homicide - Murder 3
Intimidation of Witness/Victim-Listed Factors
Intimidation of Witness/Victim-Listed Factors/F-1 or Murder
Kidnapping
Murder of an Unborn Child - Murder 3
Simple Assault
Drug Offenses
Acquisition of C.S. by Fraud: Sch II Prescr. pills (Narcotic) (51 - 100 pills)
Acquisition of C.S. by Fraud: Sch II Prescr. pills (Narcotic) (> 100 pills)
Acquisition of C.S.by Fraud: Sch II Prescr.pills(Coc/Meth/PCP)(51-100 pills)
Acquisition of C.S. by Fraud: Sch II Prescr. pills (Any Other) (51 - 100 pills)
69

Acquisition of C.S. by Fraud: Sch II Prescr. pills (Any Other) (> 100 pills)
Acquisition of Controlled Substance by Fraud: Cocaine (100 - 1000 g)
Contraband - Provide controlled substance to inmate
Contraband - Possession of controlled substance by inmate (8/25/97)
Drug Delivery Resulting in Death
Possession With Intent to Deliver: Schedule IV
Possession With Intent to Deliver: Narcotic (10 - < 50 g)
Possession With Intent to Deliver: Narcotic (50 - < 100 g)
Possession With Intent to Deliver: Narcotic (100 - 1000 g)
Possession With Intent to Deliver: Narcotic (> 1000 g)
Possession With Intent to Deliver: Methamphetamine (2.5 - < 10 g)
Possession With Intent to Deliver: Methamphetamine (10 - < 50 g)
Possession With Intent to Deliver: Methamphetamine (50 - < 100 g)
Possession With Intent to Deliver: Methamphetamine (100 - 1000 g)
Possession With Intent to Deliver: Methamphetamine (> 1000 g)
Possession With Intent to Deliver: PCP (2.5 - < 10 g)
Possession With Intent to Deliver: PCP (10 - < 50 g)
Possession With Intent to Deliver: PCP (50 - < 100 g)
Possession With Intent to Deliver: PCP (100 - < 1000 g)
Possession With Intent to Deliver: Cocaine (< 2.5 g)
Possession With Intent to Deliver: Cocaine (2.5 - < 10 g)
Possession With Intent to Deliver: Cocaine (10 - < 50 g)
Possession With Intent to Deliver: Cocaine (50 - < 100 g)
Possession With Intent to Deliver: Cocaine (100 - 1000 g)
Possession With Intent to Deliver: Cocaine (> 1000 g)
Possession With Intent to Deliver: Drug Unknown
Acquisition of Controlled Substance by Fraud: Drug Unknown
70

Acquisition of Controlled Substance by Fraud: Heroin (50 - < 100 g)
Acquisition of Controlled Substance by Fraud: Heroin (100 - 1000 g)
Acquisition of Controlled Substance by Fraud: Narcotic (10 - < 50 g)
Acquisition of Controlled Substance by Fraud: PCP (100 - 1000 g)
Possession w/ Intent to Deliv.: Marijuana (10 - < 50lbs.)
Possession w/ Intent to Deliv.: Marijuana (21- <50 plants)
Possession With Intent to Deliver: Heroin (< 1 g)
Possession With Intent to Deliver: Heroin (1 - < 10 g)
Possession With Intent to Deliver: Heroin (10 - < 50 g)
Possession With Intent to Deliver: Heroin (50 - < 100 g)
Possession With Intent to Deliver: Heroin (100 - 1000 g)
Delivery by practitioner: Cocaine (50 - < 100 g)
Delivery by practitioner: Drug Unknown
Delivery by practitioner: Heroin (> 1000 g)
Delivery by practitioner: Narcotic (100 - 1000 g)
Delivery by practitioner: Narcotic (> 1000 g)
Sex Offenses
Statutory Sexual Assault
Involuntary Deviate Sexual Intercourse
IDSI with a Child < 13 yrs.
Incest
Rape
Rape of a Child <13 yrs.
Sexual Abuse of Children - Taking Photo
Sexual Assault
71

Aggravated Indecent Assault
Aggravated Indecent Assault of a Child
Property Offenses
Access Device Fraud - Att./obtain $500>
Burglary - Home: No One Present
Catastrophe - Intentionally Causing
Failure to Remit Sales Tax
Theft - Unlawful Taking; > $100,000
Theft - Unlawful Taking - During Disaster
Theft - Unlawful Taking; Firearm
Theft - Unlawful Taking; > $2,000 - $25,000/Auto-etc.
Tax Violations
Theft - Deception; Firearm
Firearms; Sale or Transfer - Subsequent Offense
Owning/Operating a Chop Shop
Undetermined Offenses
Homicide by Vehicle While DUI
Aggravated Assault by Vehicle While DUI
Criminal Attempt-Unspecified
Corrupt Organizations
Criminial Conspiracy-Unspecified
Firearms; Possessed by Former Convict (eff. 2/14/00)
Firearms-Loaded; Persons Not To Possess, Use, etc.
72

Firearms-Unloaded; Persons Not To Possess, Use, etc.
Solid Waste: Management of Hazardous Waste
Escape - Other Escapes; this Subsection
Failure to Register (lifetime)
Firearms; Altering I.D.
Failure to Verify (lifetime)
Failure to Verify
False Identification to Law Enforcement Authorities
Homicide by Vehicle (w/DUI Conviction)
Involuntary Manslaughter
Involuntary Manslaughter - victim < 12 yrs.
73

Appendix BPrior Offense Coding
Prior Violence Convictions
Murder and inchoate murder
Voluntary manslaughter
Kidnapping
Arson (F-1)
Robbery SBI
Robbery/motor vehicle/SBI
Aggravated assault (SBI)
Burglary (house and person)
Ethnic intimidation
Arson (F-1/no person)
Robbery
Robbery/motor vehicle/ no SBI
Prior aggravated assault (att. SBI)
Simple assault
Murder and inchoate murder
Voluntary manslaughter
Kidnapping
Arson (F-1)
Robbery SBI
Robbery/motor vehicle/SBI
Aggravated assault (SBI)
Burglary (house and person)
Intimidation of witness
Assault by life prisoner
74

Ethnic intimidation
Simple assault (<12 years of age)
Prior Drug Convictions
Drug delivery causing death
Felony drug (>50 g)
Other felony drug
Drug delivery causing death
Felony drug (>50 g)
Other felony drug
Prior Sex Convictions
Rape
Involuntary deviant sexual intercourse
Aggravated indecent assault
Sexual assault
Luring child into vehicle
Indecent assault
Indecent exposure
Corruption of minor
Rape
Involuntary deviant sexual intercourse
Aggravated indecent assault
Incest
75
Sexual assault
Luring child into vehicle
Indecent assault (<13 age)
Indecent exposure (<16)
Corruption of minor
Unlawful contact with minor
Prior Property Convictions
Burglary
Burglary
Prior Undetermined Convictions
Inchoate to 4 point F-1
Felony-1
Felony-2
Felony -3
Involuntary manslaughter
Homicide by vehicle
Possessing an instrument of crime
Prohibited offensive weapon
Possession of weapon on school property
Possession of weapon on court property
Endangering welfare of children
Dealing infant children
Violation of uniform firearms act
76

M-1 DUI
Weapons of mass destruction
Aggravated jury tampering
Other 4 point offenses
Inchoate to 4 point F-1
Other felony-1
Felony-2
Felony -3
Involuntary manslaughter
Accidents involving death
M-1 involving death
Possessing an instrument of crime
Prohibited offensive weapon
Electronic incapacitation
Possession of weapon on school property
Possession of weapons on court property
Violation of uniform firearms act
M-1 involving weapons
Endangering welfare of children
Dealing infant children
M-1 involving children
Unclassified DUI
M-2 DUI
M-1 DUI
77
Appendix CKaplan-Meier Survival Curves for Covariates
Male and Female
0.00
0.25
0.50
0.75
1.00
9135 4767 2893 1648 706 176gender = Male867 614 471 331 172 35gender = Female
Number at risk
0 2 4 6 8 10analysis time
gender = Female gender = Male
Kaplan-Meier survival estimates
Black and Other Race
0.00
0.25
0.50
0.75
1.00
4447 2124 1229 704 305 81black = Black5555 3257 2135 1275 573 130black = Other Race
Number at risk
0 2 4 6 8 10analysis time
black = Other Race black = Black
Kaplan-Meier survival estimates
Youth Arrest and No Youth Arrest
78

0.00
0.25
0.50
0.75
1.00
2332 893 447 195 78 15youtharrest = Youth Arrest
7670 4488 2917 1784 800 196youtharrest = Not Arrested
Number at risk
0 2 4 6 8 10analysis time
Youtharrest = None Youtharrest = Arrest
Kaplan-Meier survival estimates
Age at Sentencing 30+ and 30-
0.00
0.25
0.50
0.75
1.00
5853 2925 1740 985 405 96MeanAge = 14149 2456 1624 994 473 115MeanAge = 0
Number at risk
0 2 4 6 8 10analysis time
MeanAge = 30+ MeanAge = <30
Kaplan-Meier survival estimates
Current Offense
79

Prior Violent Offense and No Prior Violent Offense
80
0.000.250.500.751.00 155
7349
2513
4cu
rren
t = O
ther
1689
1082
740
433
168
36cu
rren
t = D
rug
213
7940
228
2cu
rren
t = P
rope
rty12
8460
638
022
492
26cu
rren
t = S
ex66
6135
4121
5512
7559
714
3cu
rren
t = V
iole
ntN
umbe
r at r
isk
02
46
810
anal
ysis
tim
e
curr
ent =
Vio
lent
curr
ent =
Sex
curr
ent =
Pro
perty
curr
ent =
Dru
gcu
rren
t = O
ther
Kap
lan-
Mei
er s
urvi
val e
stim
ates

0.00
0.25
0.50
0.75
1.00
855 361 183 102 37 4pviol = 19147 5020 3181 1877 841 207pviol = 0
Number at risk
0 2 4 6 8 10analysis time
pviol = 0 pviol = 1
Kaplan-Meier survival estimates
Prior Sex Offense and No Prior Sex Offense
0.00
0.25
0.50
0.75
1.00
120 54 30 16 8 3psex = 19882 5327 3334 1963 870 208psex = 0
Number at risk
0 2 4 6 8 10analysis time
psex = 0 psex = 1
Kaplan-Meier survival estimates
Prior Property Offense and No Prior Property Offense
81

0.00
0.25
0.50
0.75
1.00
747 304 152 72 28 7pprop = 19255 5077 3212 1907 850 204pprop = 0
Number at risk
0 2 4 6 8 10analysis time
pprop = 0 pprop = 1
Kaplan-Meier survival estimates
Prior Drug Offense and No Prior Drug Offense
0.00
0.25
0.50
0.75
1.00
2179 966 524 234 85 17pdrug = 17823 4415 2840 1745 793 194pdrug = 0
Number at risk
0 2 4 6 8 10analysis time
pdrug = 0 pdrug = 1
Kaplan-Meier survival estimates
Prior Other Offense and No Prior Other Offense
82

0.00
0.25
0.50
0.75
1.00
2054 825 425 212 83 15pother = 17948 4556 2939 1767 795 196pother = 0
Number at risk
0 2 4 6 8 10analysis time
pother = 0 pother = 1
Kaplan-Meier survival estimates
Arrest 12+ and Arrest 1-11
0.00
0.25
0.50
0.75
1.00
1456 459 177 76 27 4arrest12 = 18546 4922 3187 1903 851 207arrest12 = 0
Number at risk
0 2 4 6 8 10analysis time
arrest12 = 0 arrest12 = 1
Kaplan-Meier survival estimates
Specialist and Generalist
83

0.00
0.25
0.50
0.75
1.00
6083 3682 2447 1540 709 177special = first-timer3225 1363 714 347 140 29special = generalist694 336 203 92 29 5special = specialist
Number at risk
0 2 4 6 8 10analysis time
special = specialist special = generalistspecial = first-timer
Kaplan-Meier survival estimates
Prior Record Score=0 and Prior Record Score = 1+ (includes REVOC and REFEL)
0.00
0.25
0.50
0.75
1.00
4948 2225 1211 612 247 51prs0 = 15054 3156 2153 1367 631 160prs0 = 0
Number at risk
0 2 4 6 8 10analysis time
prs0 = 0 prs0 = 1
Kaplan-Meier survival estimates
Offense Gravity Score=0-11 and Offense Gravity Score=11-14
84
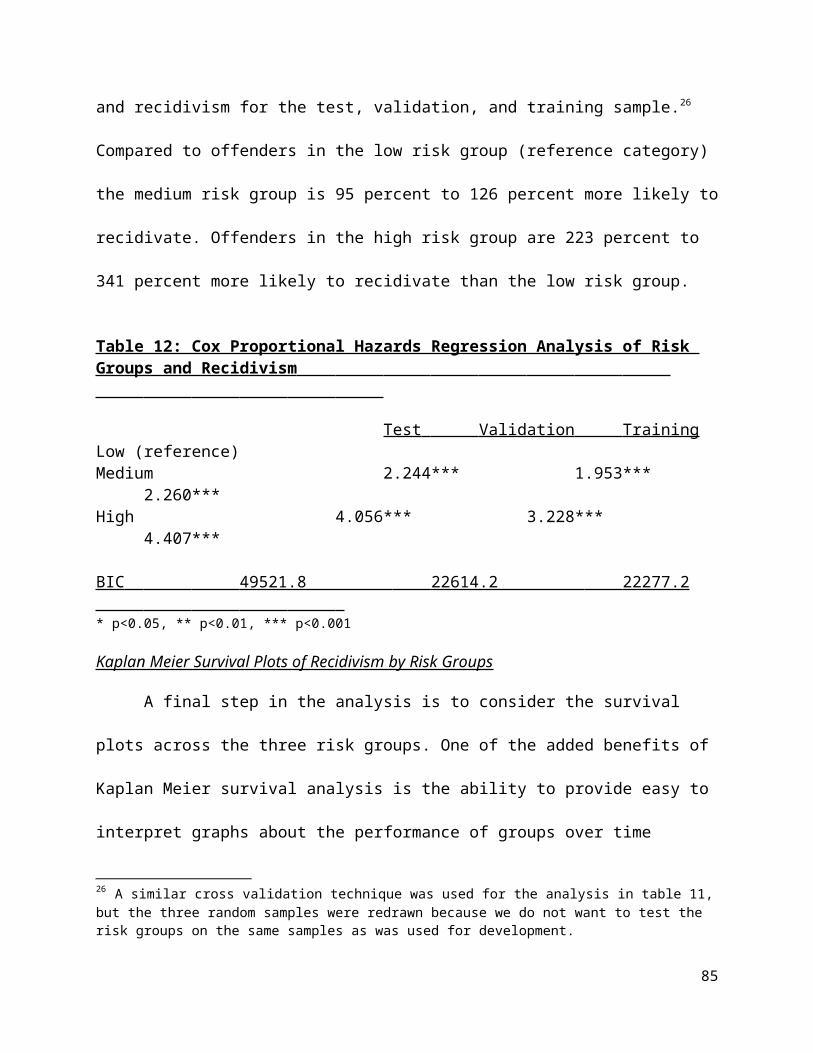
0.00
0.25
0.50
0.75
1.00
2785 1579 1004 552 241 60ogs11 = 17217 3802 2360 1427 637 151ogs11 = 0
Number at risk
0 2 4 6 8 10analysis time
ogs11 = <11 ogs11 = 11+
Kaplan-Meier survival estimates
Complete Offense and Inchoate Offense
0.00
0.25
0.50
0.75
1.00
9310 4946 3066 1805 796 193complete = complete692 435 298 174 82 18complete = incomplete
Number at risk
0 2 4 6 8 10analysis time
complete = 0 complete = 1
Kaplan-Meier survival estimates
Multiple Count and Single Count During Judicial Proceeding
85

0.00
0.25
0.50
0.75
1.00
3179 1621 938 496 196 48multi_count = 16823 3760 2426 1483 682 163multi_count = 0
Number at risk
0 2 4 6 8 10analysis time
multi_count = 0 multi_count = 1
Kaplan-Meier survival estimates
Gun Possession and No Gun Possession During Commission of Current Offence
0.00
0.25
0.50
0.75
1.00
1024 473 252 98 38 5gun = 18978 4908 3112 1881 840 206gun = 0
Number at risk
0 2 4 6 8 10analysis time
gun = 0 gun = 1
Kaplan-Meier survival estimates
86


