Download - Risky Project Presentation

RiskyProjectProject Risk Management Software
Intaver Institute Inc.303, 6707, Elbow Drive S.W, Calgary, AB, CanadaTel: +1 (403) 692-2252Fax: +1 (403) 459-4533www.intaver.com 1
2012
Inta
ver I
nstit
ute
04/0
8/23

What Is RiskyProject?
• Project Scheduling• Risk Register• Quantitative risk analysis using Monte Carlo simulations• Project performance measurement
RiskyProject is Windows-based project risk management software.
Risky Project gives you a simple answer to a common question: What will happen to your project if certain risks occur?
2
2012
Inta
ver I
nstit
ute
04/0
8/23

The Project Management Problem
2012
Inta
ver I
nstit
ute
04/0
8/23
3

The Project Management Problem
2012
Inta
ver I
nstit
ute
04/0
8/23
4

The Project Management Problem
2012
Inta
ver I
nstit
ute
04/0
8/23
5
The RiskyProject Solution
2012
Inta
ver I
nstit
ute
04/0
8/23
6

The RiskyProject Solution
2012
Inta
ver I
nstit
ute
04/0
8/23
7

RiskyProject Features• Full scheduling engine with costs and resources• Full risk register that links to project schedules• Quantitative and qualitative analysis• Risk+ replacement• Easy to use quantitative schedule risk analysis based on risk
events• Probabilistic cash flow analysis • Project tracking with risks and uncertainties• Integration with Microsoft Project, Primavera, or other project
management software• Optional decision tree analysis• Analysis of critical risk events which need to be mitigated first
2012
Inta
ver I
nstit
ute
04/0
8/23
8

RiskyProject Features (Continued)
• Product lifecycle management• Risk templates• Probabilistic and conditional branching• Managing mitigation plans• “What if “ analysis• Advanced reporting tools• Risk event correlations• Multiple statistical distributions and distribution fitting
2012
Inta
ver I
nstit
ute
04/0
8/23
9
RiskyProject Workflow
2012
Inta
ver I
nstit
ute
04/0
8/23
10

RiskyProject Workflow
2012
Inta
ver I
nstit
ute
04/0
8/23
11

Define Project Schedule
Enter complete WBS, as it is done in other project management
software
Enter resources, cost and income for each task
You may also import project schedules from other scheduling tools, such as Microsoft Project or Primavera.
2012
Inta
ver I
nstit
ute
04/0
8/23
12
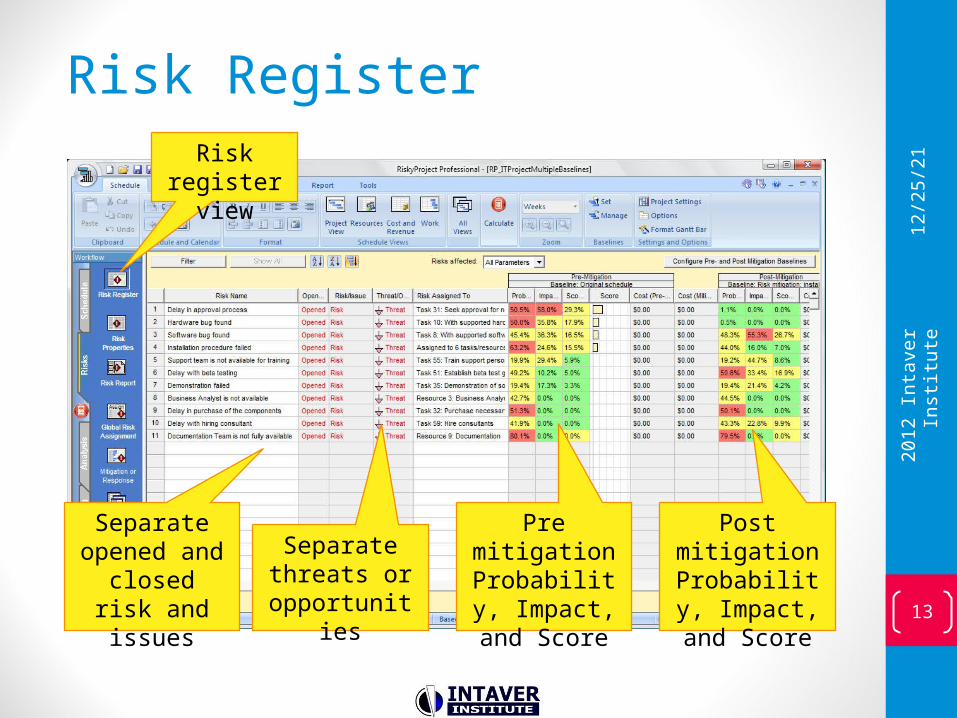
Risk Register
Pre mitigationProbability, Impact, and
Score
Post mitigationProbability, Impact, and
Score
Risk register view
Separate opened and
closed risk and issues
Separate threats or
opportunities
2012
Inta
ver I
nstit
ute
04/0
8/23
13

Risk Form
14
Risk description and status
Cost of Risk
Management Strategy
Review Timeline
Double-click on a risk to view or modify Risk Information
2012
Inta
ver I
nstit
ute
04/0
8/23

Qualitative Risk Analysis: Define Risk Probabilities and Impacts
15
If no schedule is attached, qualitative risk assessments can be performed
Outcome Types are now qualitative
Outcomes for risk categories are qualitative
and are based on risk matrix settings
2012
Inta
ver I
nstit
ute
04/0
8/23

Mitigation Plans
16
Add mitigation or risk response plans (cost, expected reduction in probability and impact, an descriptions. Plans can have sub-plans
2012
Inta
ver I
nstit
ute
04/0
8/23
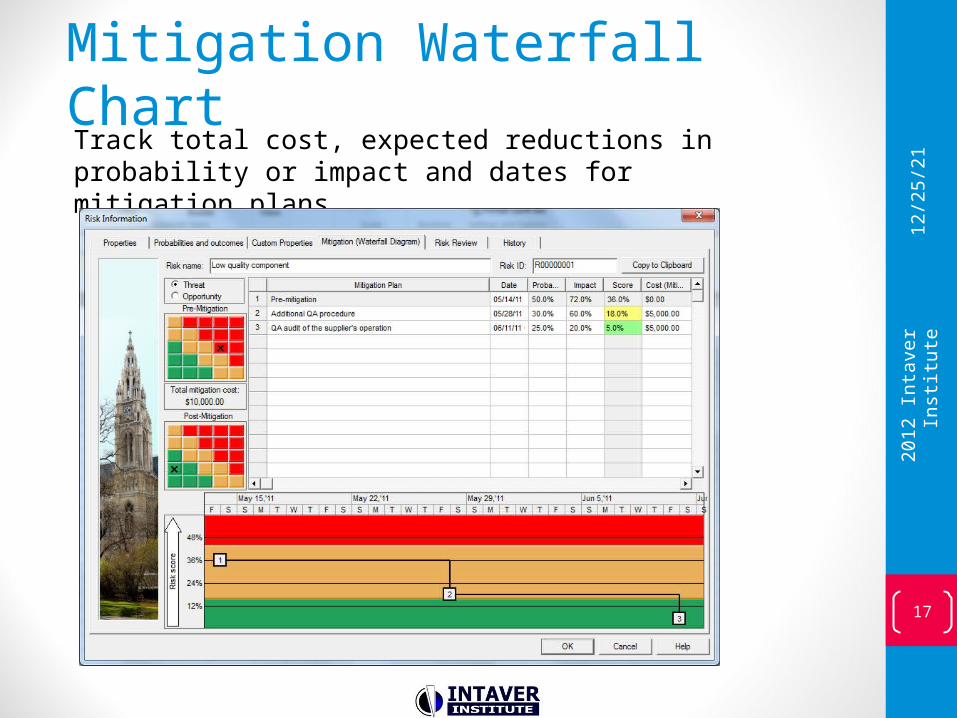
Mitigation Waterfall Chart
17
Track total cost, expected reductions in probability or impact and dates for mitigation plans
2012
Inta
ver I
nstit
ute
04/0
8/23

Risk Reviews and Risk History
18
All risk reviews with details can be saved and tracked in system
2012
Inta
ver I
nstit
ute
04/0
8/23

Assign Risks to Tasks and Resources
Define risk chance, outcome and result. Risks can have mutually exclusive outcomes, different
outcomes of the same risk
Risks can be global (for all tasks or resources) or local (for specific tasks or resources)
2012
Inta
ver I
nstit
ute
04/0
8/23
19
If schedule is attached, quantitative risk assessments is performed

Statistical Distributions
In addition to risk events you may define uncertainties as statistical distributions for:• task cost• task start time• task duration• income associated with task
If you enter only the low, base and high cost, duration, start
time and income, RiskyProject will generate statistical
distribution based on this data20
2012
Inta
ver I
nstit
ute
04/0
8/23

Monte Carlo Simulation
When your project schedule and risk breakdown structure is ready, click here to perform Monte Carlo simulations
21
2012
Inta
ver I
nstit
ute
04/0
8/23

Result Gantt Chart
White bars represent original project
schedule (no risks)
Blue bars represent project schedule with
risks
Compare original project schedule and result of analysis
22
2012
Inta
ver I
nstit
ute
04/0
8/23

Results of Risk AnalysisProject Summary:
project duration, cost, and finish time with
and without risks
Results of analysis for project cost, finish time, and
duration
Double click on any chart to view detailed information 23
2012
Inta
ver I
nstit
ute
04/0
8/23

Detailed Results of Analysis
Move the slider to determine the chance
that project will be within budget
Get detailed statistical data
Data can be exported as an image or text
Detailed results can be shown for each task or project for cost, duration, start time, finish time, and income.
24
2012
Inta
ver I
nstit
ute
04/0
8/23
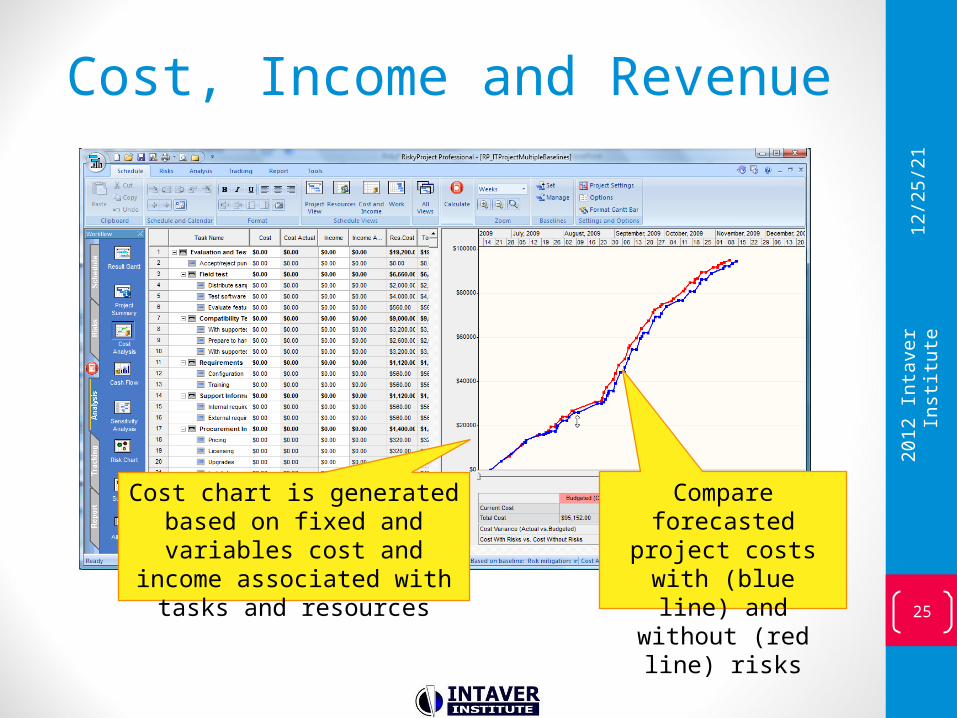
Cost, Income and Revenue
Compare forecasted project costs with (blue line) and without (red
line) risks
Cost chart is generated based on fixed and variables cost and
income associated with tasks and resources
25
2012
Inta
ver I
nstit
ute
04/0
8/23
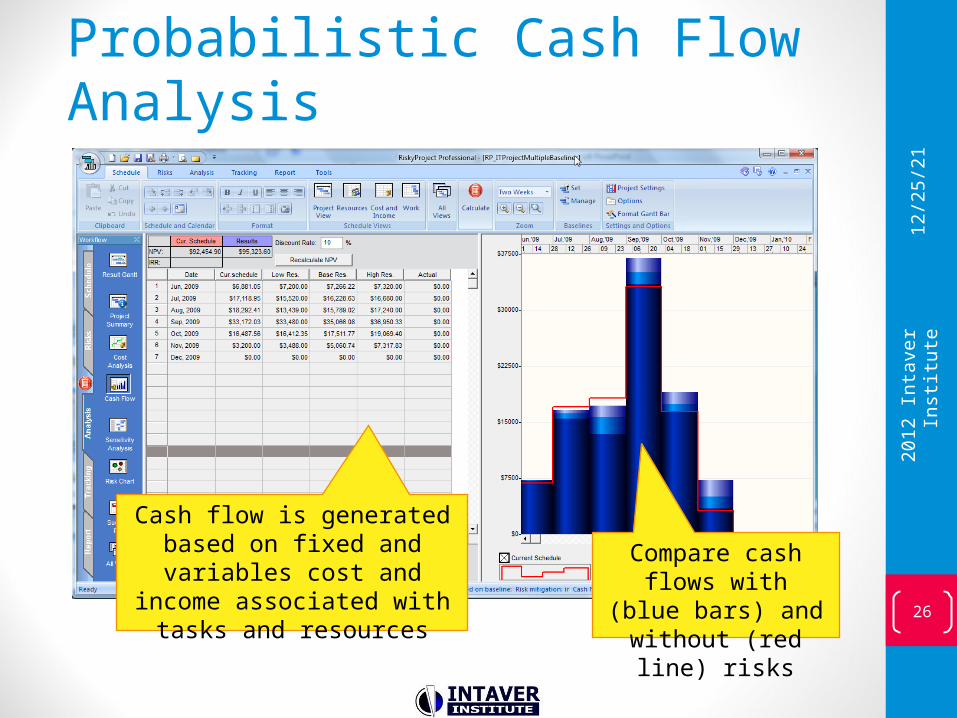
Probabilistic Cash Flow Analysis
Compare cash flows with (blue bars) and
without (red line) risks
Cash flow is generated based on fixed and variables cost and
income associated with tasks and resources 26
2012
Inta
ver I
nstit
ute
04/0
8/23

Sensitivity Analysis
Tornado chart shows risks or other parameters that have the most affect
on the project schedule
Prioritize critical risks
27
2012
Inta
ver I
nstit
ute
04/0
8/23
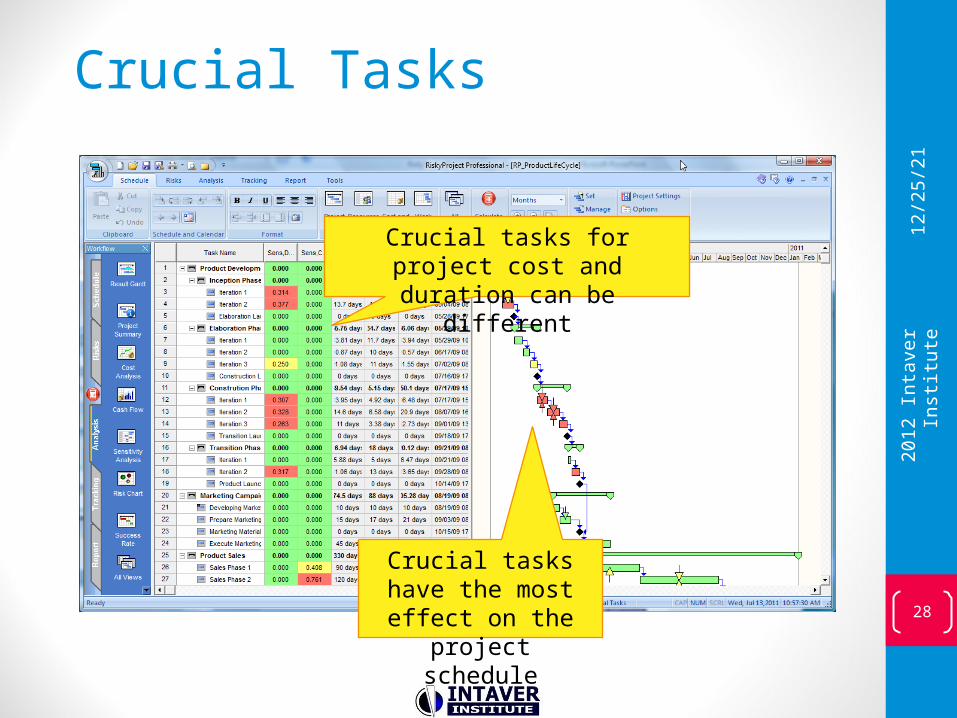
Crucial Tasks
Crucial tasks have the most effect on the project schedule
Crucial tasks for project cost and duration can be different
28
2012
Inta
ver I
nstit
ute
04/0
8/23
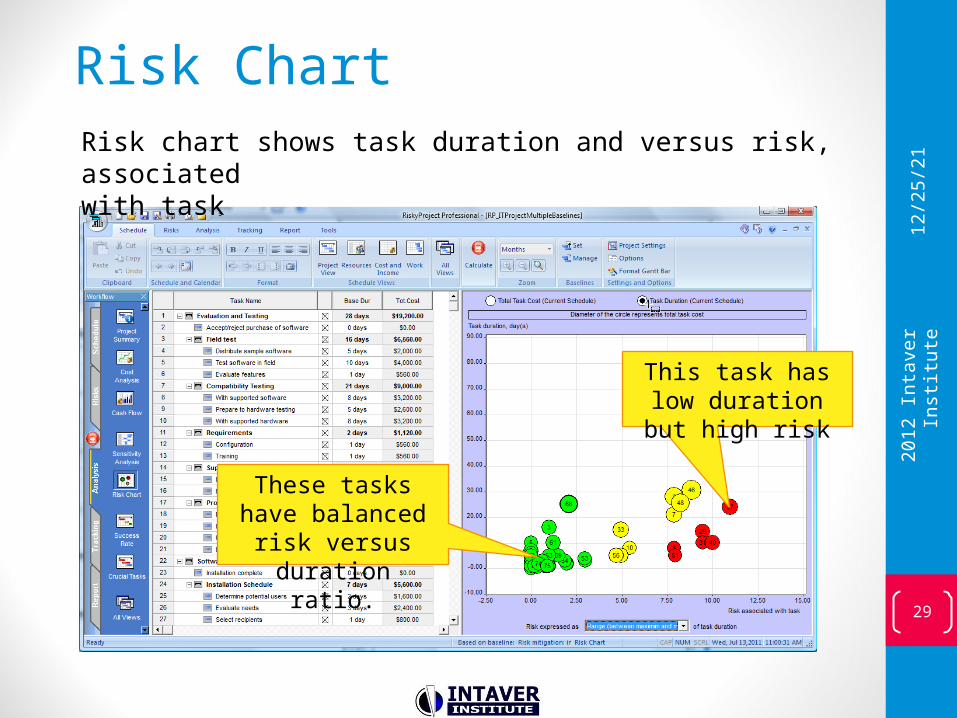
Risk ChartRisk chart shows task duration and versus risk, associated with task
This task has low duration but high risk
These tasks have balanced risk versus
duration ratio.
29
2012
Inta
ver I
nstit
ute
04/0
8/23

Risk Matrix
Risk Probability, Impact and Score for the current schedule 30
2012
Inta
ver I
nstit
ute
04/0
8/23

2012
Inta
ver I
nstit
ute
Project Dashboard 3x3
3 most important project parameters (cost, duration,
and finish time)
3 most crucial tasks
3 most critical risks
Project Dashboard 3x3 is a condensed view of
the most important results of analysis
31
04/0
8/23

Project Tracking
This task is 100% completed (green bar)
For each task at any moment you may enter how much work has been completed
This task is partially completed (yellow bar)
Risky project automatically adjusts the probability of risks for partially completed tasks
32
2012
Inta
ver I
nstit
ute
04/0
8/23
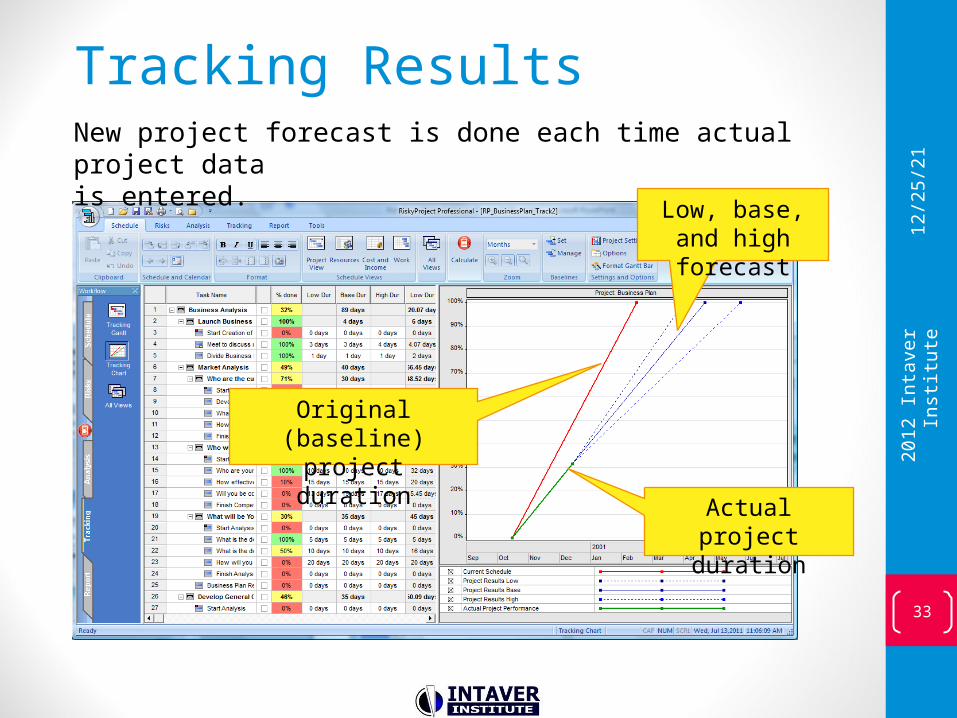
Tracking ResultsNew project forecast is done each time actual project data is entered.
Original (baseline) project duration
Actual project duration
Low, base, and high forecast
33
2012
Inta
ver I
nstit
ute
04/0
8/23
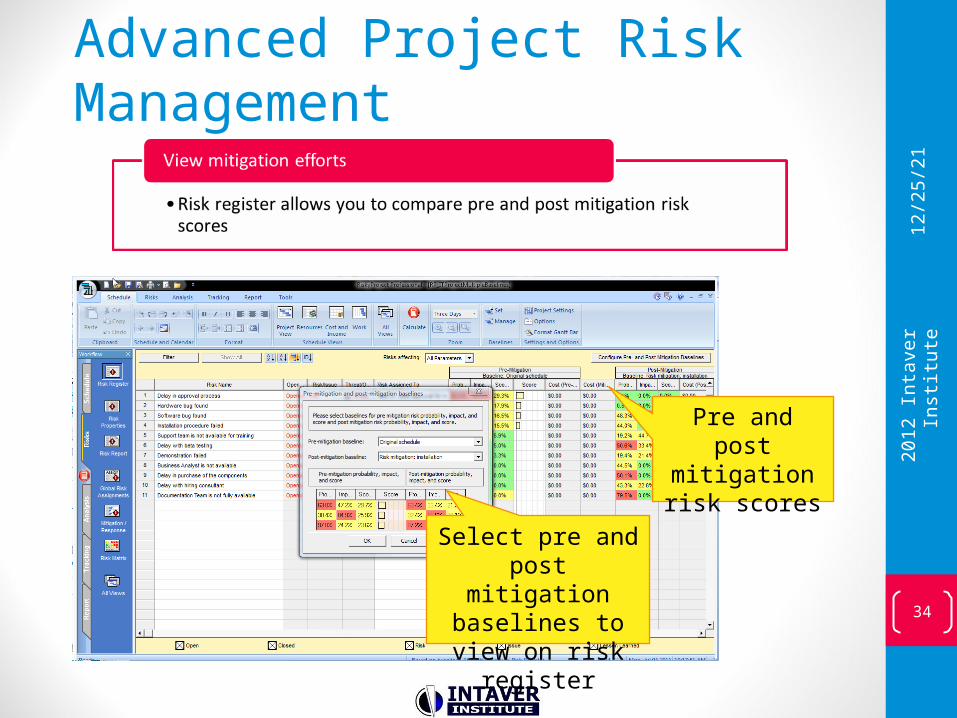
Advanced Project Risk Management
Select pre and post mitigation baselines
to view on risk register
Pre and post mitigation risk
scores
34
2012
Inta
ver I
nstit
ute
04/0
8/23
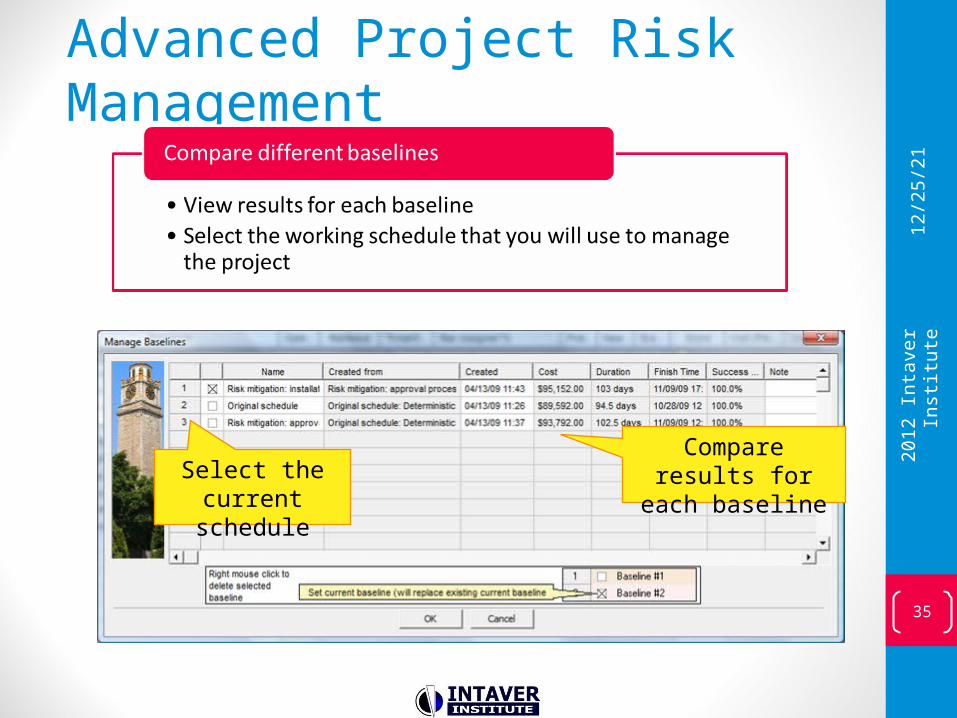
Advanced Project Risk Management
Select the current schedule
Compare results for each baseline
35
2012
Inta
ver I
nstit
ute
04/0
8/23

Advanced Project Risk Management
Run alternative project branches probabilistically
36
2012
Inta
ver I
nstit
ute
04/0
8/23

Integration with Microsoft Project and Other Project Management Software
37
Risk tab installed on Microsoft Project ribbon allows users move projects seamlessly into RiskyProject
2012
Inta
ver I
nstit
ute
04/0
8/23
RiskyProject can import schedules from Oracle Primavera and other project management software.
Intaver Institute’s ServicesIntaver Institute performs project risk management, risk analysis, and decision analysis training and consulting
Popular Intaver’s training courses include:• Project management: theory and best practices
• Introduction to project risk management: theory and case studies
• Project decision analysis
• Quantitative methods in project management
• Introduction to RiskyProject: basic RiskyProject workflow and features
• Advanced features of RiskyProject Professional38
2012
Inta
ver I
nstit
ute
04/0
8/23


