www.bitre.gov.aubitr
e
bitre
S T A T I S T I C A L R E P O R T
SafetyRoad trauma Australia2016 statistical summary
S T A T I S T I C A L R E P O R T
ISBN 978-1-922205-80-3
Road trauma involving heavy vehicles: crash statistics
ST
AT
IST
ICA
L R
EP
OR
T
© Commonwealth of Australia 2017
ISSN: 2205-4235
ISBN: 978-1-925531-57-2
Ownership of intellectual property rights in this publication
Unless otherwise noted, copyright (and any other intellectual property rights, if any) in this
publication is owned by the Commonwealth of Australia (referred to below as the
Commonwealth).
Disclaimer
The material contained in this publication is made available on the understanding that the
Commonwealth is not providing professional advice, and that users exercise their own skill
and care with respect to its use, and seek independent advice if necessary.
The Commonwealth makes no representations or warranties as to the contents or accuracy
of the information contained in this publication. To the extent permitted by law, the
Commonwealth disclaims liability to any person or organisation in respect of anything done,
or omitted to be done, in reliance upon information contained in this publication.
Creative Commons licence
With the exception of (a) the Coat of Arms; and (b) the Department of Infrastructure’s
photos and graphics, copyright in this publication is licensed under a Creative Commons
Attribution 3.0 Australia Licence.
Creative Commons Attribution 3.0 Australia Licence is a standard form licence agreement
that allows you to copy, communicate and adapt this publication provided that you attribute
the work to the Commonwealth and abide by the other licence terms. A summary of the
licence terms is available from http://creativecommons.org/licenses/by/3.0/au/deed.en. The
full licence terms are available from http://creativecommons.org/licenses/by/3.0/au/legalcode.
Use of the Coat of Arms
The Department of the Prime Minister and Cabinet sets the terms under which the Coat of
Arms is used. Please refer to the Department’s Commonwealth Coat of Arms and
Government branding web page http://www.dpmc.gov.au/guidelines/index.cfm#brand and, in
particular, the Guidelines on the use of the Commonwealth Coat of Arms publication.
An appropriate citation for this report is:
Bureau of Infrastructure, Transport and Regional Economics (BITRE), 2017, Road trauma
Australia 2016 statistical summary, BITRE, Canberra ACT.
Contact us
This publication is available in PDF format. All other rights are reserved, including in relation
to any Departmental logos or trade marks which may exist. For enquiries regarding the
licence and any use of this publication, please contact:
Bureau of Infrastructure, Transport and Regional Economics (BITRE)
Department of Infrastructure and Regional Development
GPO Box 501, Canberra ACT 2601, Australia
Telephone: (international) +61 2 6274 7210
Fax: (international) +61 2 6274 6855
Email: [email protected]
Website: www.bitre.gov.au
Bureau of Infrastructure, Transport and Regional Economics
Road trauma Australia
2016 statistical summary
Department of Infrastructure and Regional Development
Canberra, Australia
• iii •
At a glance
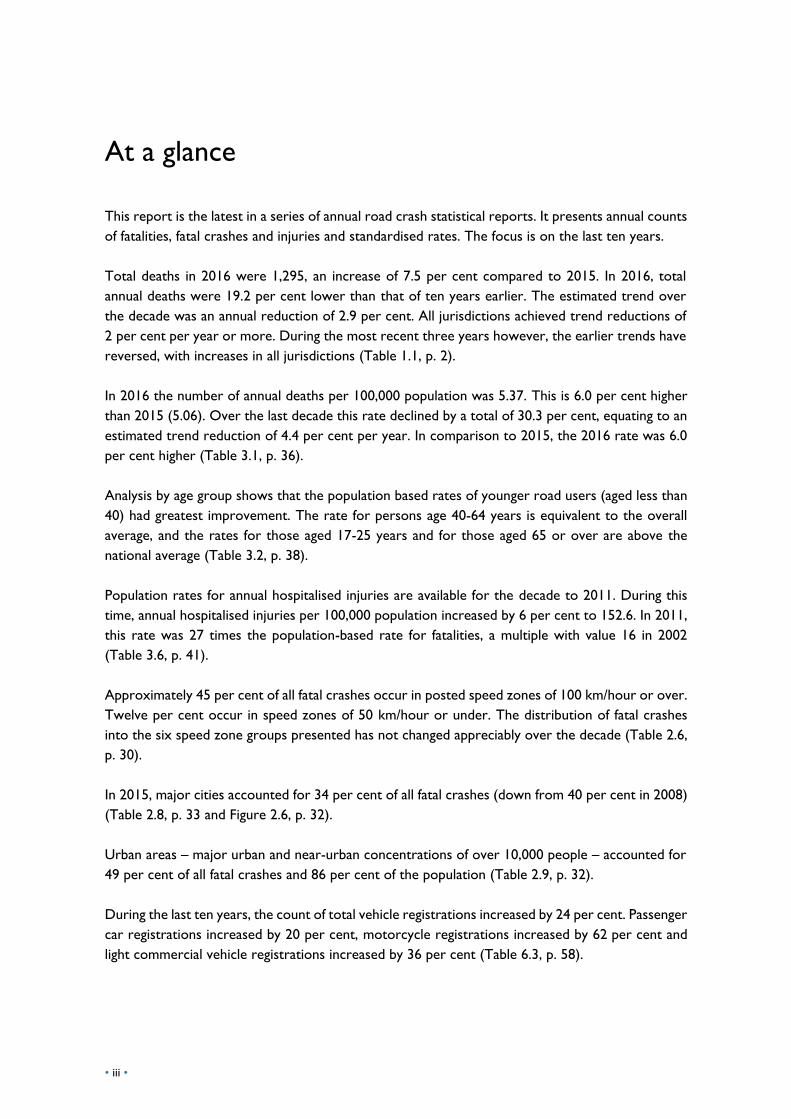
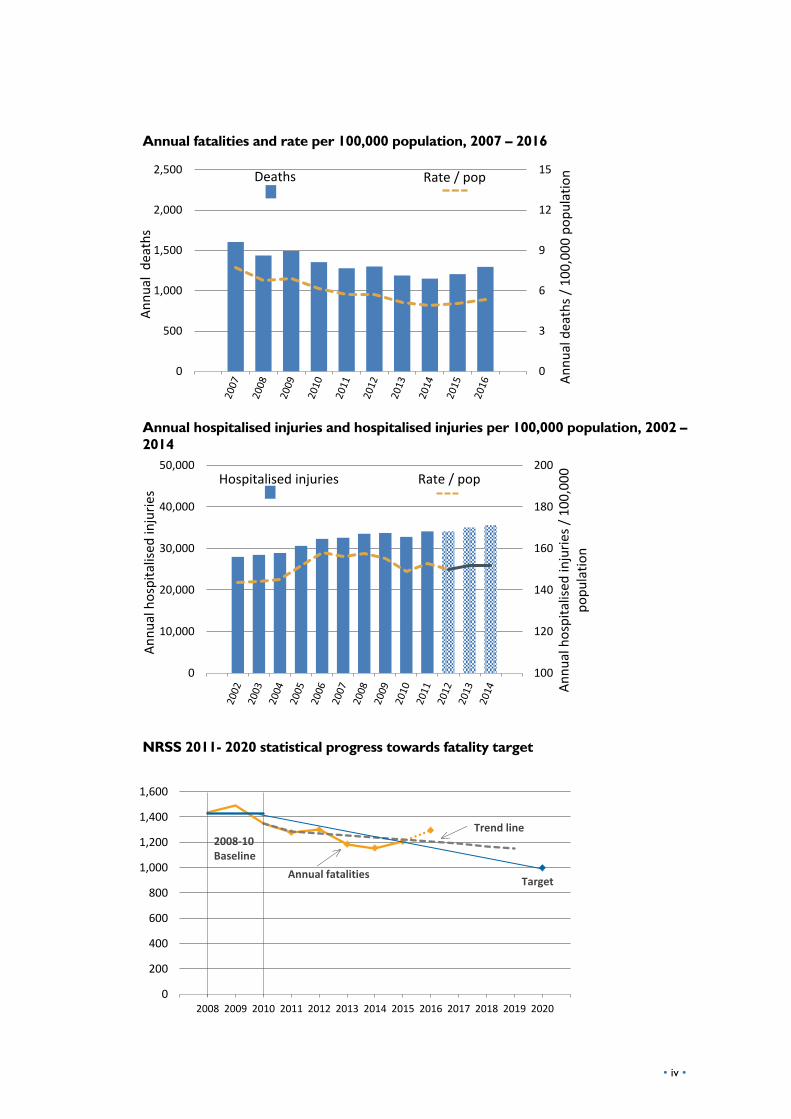
This report is the latest in a series of annual road crash statistical reports. It presents annual counts
of fatalities, fatal crashes and injuries and standardised rates. The focus is on the last ten years.
Total deaths in 2016 were 1,295, an increase of 7.5 per cent compared to 2015. In 2016, total
annual deaths were 19.2 per cent lower than that of ten years earlier. The estimated trend over
the decade was an annual reduction of 2.9 per cent. All jurisdictions achieved trend reductions of
2 per cent per year or more. During the most recent three years however, the earlier trends have
reversed, with increases in all jurisdictions (Table 1.1, p. 2).
In 2016 the number of annual deaths per 100,000 population was 5.37. This is 6.0 per cent higher
than 2015 (5.06). Over the last decade this rate declined by a total of 30.3 per cent, equating to an
estimated trend reduction of 4.4 per cent per year. In comparison to 2015, the 2016 rate was 6.0
per cent higher (Table 3.1, p. 36).
Analysis by age group shows that the population based rates of younger road users (aged less than
40) had greatest improvement. The rate for persons age 40-64 years is equivalent to the overall
average, and the rates for those aged 17-25 years and for those aged 65 or over are above the
national average (Table 3.2, p. 38).
Population rates for annual hospitalised injuries are available for the decade to 2011. During this
time, annual hospitalised injuries per 100,000 population increased by 6 per cent to 152.6. In 2011,
this rate was 27 times the population-based rate for fatalities, a multiple with value 16 in 2002
(Table 3.6, p. 41).
Approximately 45 per cent of all fatal crashes occur in posted speed zones of 100 km/hour or over.
Twelve per cent occur in speed zones of 50 km/hour or under. The distribution of fatal crashes
into the six speed zone groups presented has not changed appreciably over the decade (Table 2.6,
p. 30).
In 2015, major cities accounted for 34 per cent of all fatal crashes (down from 40 per cent in 2008)
(Table 2.8, p. 33 and Figure 2.6, p. 32).
Urban areas – major urban and near-urban concentrations of over 10,000 people – accounted for
49 per cent of all fatal crashes and 86 per cent of the population (Table 2.9, p. 32).
During the last ten years, the count of total vehicle registrations increased by 24 per cent. Passenger
car registrations increased by 20 per cent, motorcycle registrations increased by 62 per cent and
light commercial vehicle registrations increased by 36 per cent (Table 6.3, p. 58).
• iv •
Annual fatalities and rate per 100,000 population, 2007 – 2016
Annual hospitalised injuries and hospitalised injuries per 100,000 population, 2002 –
2014
NRSS 2011- 2020 statistical progress towards fatality target
0
3
6
9
12
15
0
500
1,000
1,500
2,000
2,500
An
nu
al d
eath
s
An
nu
al d
eath
s /
10
0,0
00
po
pu
lati
onDeaths Rate / pop
100
120
140
160
180
200
0
10,000
20,000
30,000
40,000
50,000
An
nu
al h
osp
ital
ised
inju
ries
Hospitalised injuries Rate / pop
An
nu
al h
osp
ital
ised
inju
ries
/ 1
00
,00
0
po
pu
lati
on
0
200
400
600
800
1,000
1,200
1,400
1,600
2008 2009 2010 2011 2012 2013 2014 2015 2016 2017 2018 2019 2020
2008-10Baseline
Annual fatalities
Trend line
Target
• v •
Data Sources
The tables on fatal road crashes presented in this report are based on two databases: the Australian
Road Deaths Database (ARDD) and the National Crash Database (NCD).
The Australian Road Deaths Database contains national road crash fatality data comprising basic
demographic and crash information. Fatal crashes since 1989 are included and it is updated each
month. The current data in spreadsheet format is available at <https://www.bitre.gov.au>. For this
report, the April 2017 data was used.
The scope of the National Crash Database is national fatal and injury crashes and at present it covers
the years 2008 to 2015. It is updated annually.
Due to the timing differences in data receipt and ongoing validation by data providers, there are
minor data differences between the two databases.
Non-fatal road traffic crash casualty data (referred to here as ‘hospitalised injury’) is collated from
published reports by the Australian Institute of Health and Welfare (AIHW) and by the National
Injury Surveillance Unit (NISU), as well as from unpublished National Hospital Morbidity Database
reports compiled by NISU. Refer to AIHW 2008 for information regarding inclusion criteria for traffic
crash hospitalised injuries.
Acknowledgements
Department of Infrastructure and Regional Development gratefully acknowledges the provision of
data from the following agencies:
Transport for New South Wales;
VicRoads;
Queensland Department of Transport and Main Roads;
Department of Planning, Transport and Infrastructure South Australia;
Western Australian Police;
Main Roads Western Australia;
Department of State Growth, Tasmania;
Department of Transport, Northern Territory;
Transport Canberra and City Services Directorate, Australian Capital Territory;
National Injury Surveillance Unit, Flinders University;
Australian Institute of Health and Welfare.
• vi •
Contents At a glance .................................................................................................................................................................... iii
Data sources ..................................................................................................................................................................... v
Acknowledgements ....................................................................................................................................................... v
SECTION 1 People ........................................................................................................................................... 1
SECTION 2 Crashes ...................................................................................................................................... 23
SECTION 3 Rates ............................................................................................................................................ 35
SECTION 4 National Road Safety Strategy (NRSS) – statistical progress ......................... 43
SECTION 5 Historical series ..................................................................................................................... 47
SECTION 6 Exposure series ...................................................................................................................... 55
Glossary ................................................................................................................................................................... 59
References ............................................................................................................................................................. 61
• vii •
Tables Table 1.1 Deaths by jurisdiction and road user....................................................................................... 2
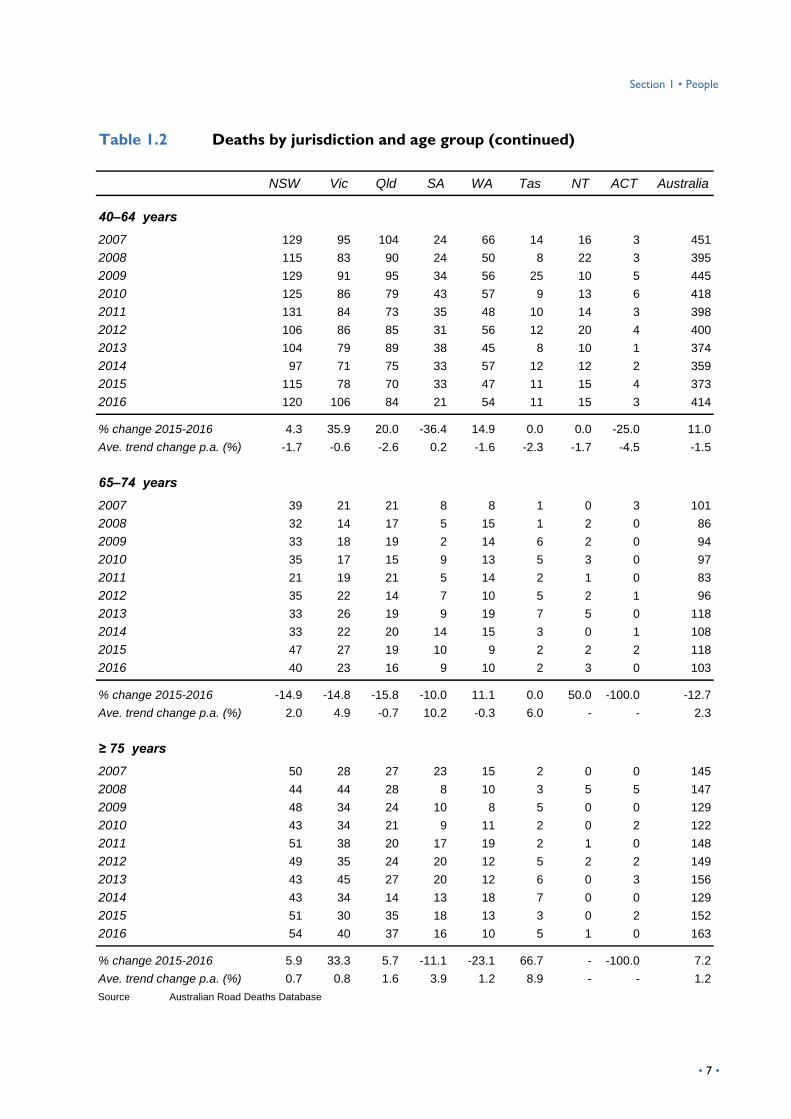
Table 1.2 Deaths by jurisdiction and age group ...................................................................................... 6
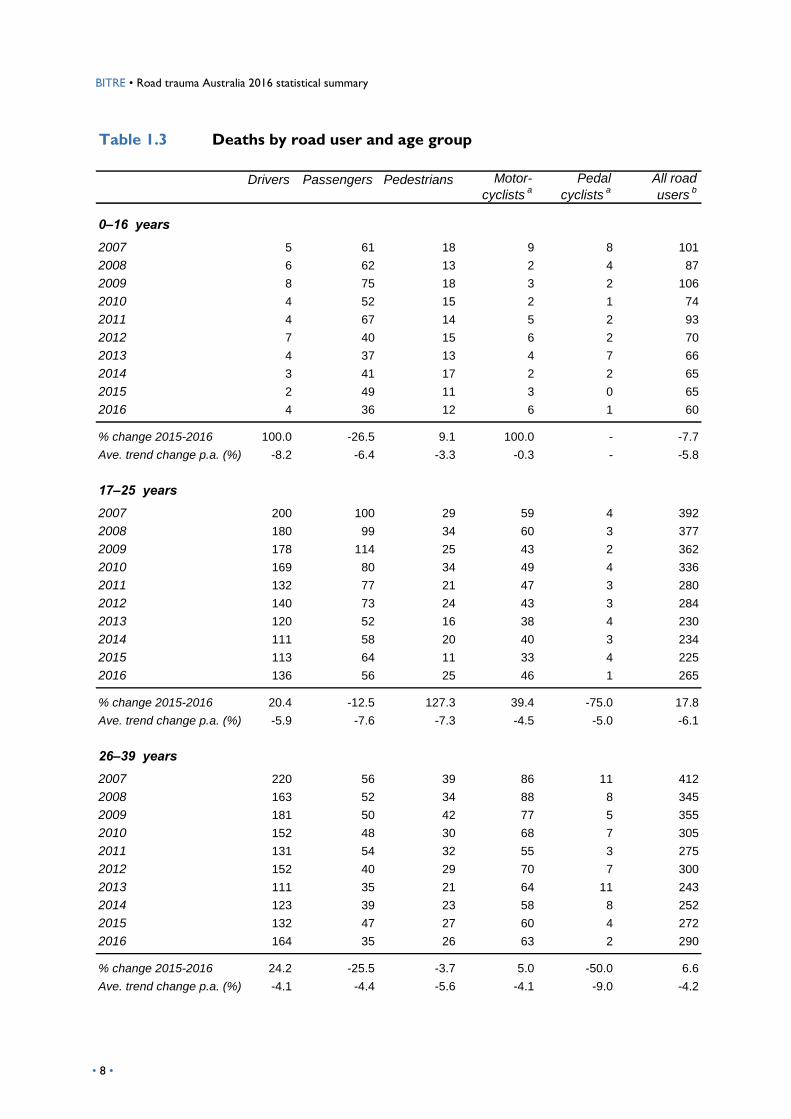
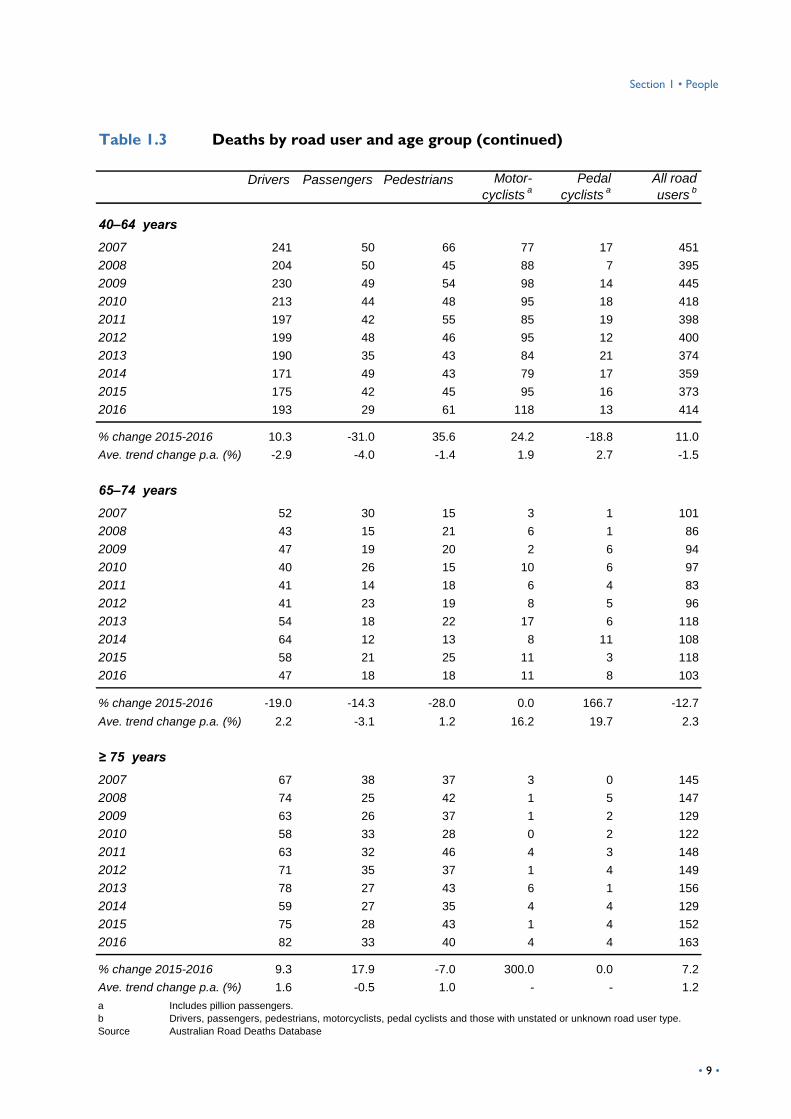
Table 1.3 Deaths by road user and age group ......................................................................................... 8
Table 1.4 Deaths by gender and road user ............................................................................................. 11
Table 1.5 Deaths by crash type ................................................................................................................... 12
Table 1.6 Deaths in crashes involving a heavy vehicle......................................................................... 13
Table 1.7 Deaths in crashes involving younger or older drivers/motorcycle riders ................. 14
Table 1.8 Deaths from common crash sub-types ................................................................................. 15
Table 1.9 Hospitalised injuries – by road user and age group .......................................................... 16
Table 1.10 Hospitalised injuries – by remoteness area of residence ................................................ 17
Table 1.11 Hospitalised injuries – by counterpart .................................................................................. 20
Table 1.12 Hospitalised injuries and high threat to life ......................................................................... 22
Table 1.13 Hospitalised injuries and high threat to life – by road user ............................................ 22
Table 2.1 Fatal crashes by jurisdiction and crash type ........................................................................ 24
Table 2.2 Fatal crashes by crash type and time of day ........................................................................ 26
Table 2.3 Fatal crashes by crash type and day of week ...................................................................... 27
Table 2.4 Fatal crashes by crash type and weekly time block .......................................................... 28
Table 2.5 Fatal crashes involving heavy vehicles and not involving heavy vehicles .................... 29
Table 2.6 Fatal crashes by speed zone and jurisdiction ...................................................................... 30
Table 2.7 Fatal crashes by road type ......................................................................................................... 32
Table 2.8 Fatal crashes by remoteness region ....................................................................................... 33
Table 2.9 Fatal crashes by Significant Urban Area (SUA) ................................................................... 33
Table 2.10 Fatal crashes by Urban Centre and Locality (UCL) .......................................................... 33
Table 2.11 Average number of persons killed per fatal crash ............................................................. 34
Table 3.1 Annual fatalities per 100,000 population by jurisdiction ................................................. 36
Table 3.2 Annual fatalities per 100,000 population by gender and age group ............................. 38
Table 3.3 Annual fatalities per 100 million vehicle kilometres travelled (VKT) .......................... 39
Table 3.4 Annual vehicle occupant fatalities per 10,000 registered motor vehicles by
jurisdiction ...................................................................................................................................... 40
Table 3.5 Annual fatalities of motorcyclists per 10,000 registered motorcycles by jurisdiction
............................................................................................................................................................ 40
Table 3.6 Annual hospitalised injuries per 100,000 population, 100 million VKT and 10,000
registered motor vehicles .......................................................................................................... 41
• viii •
Tables (continued)
Table 4.1 National Road Safety Strategy (NRSS) statistical progress – High level outcome
measures ........................................................................................................................................ 44
Table 4.2 National Road Safety Strategy (NRSS) statistical progress – Safety performance
indicators ......................................................................................................................................... 44
Table 5.1 Deaths by jurisdiction 1987–2016 .......................................................................................... 48
Table 5.2 Deaths by road user 1987–2016 ............................................................................................. 49
Table 5.3 Deaths by age group 1987–2016............................................................................................. 50
Table 5.4 Fatal crashes by jurisdiction 1987–2016 ............................................................................... 51
Table 5.5 Fatal crashes by crash type 1989–2016................................................................................. 52
Table 5.6 Hospitalised injuries 2001–2014 ............................................................................................. 53
Table 5.7 Annual fatalities per 100,000 population by jurisdiction 1987–2016 .......................... 54
Table 6.1 Population (000s) by jurisdiction 1987–2016 (June) ......................................................... 56
Table 6.2 Population (000s) by age group 1987–2016 (June) ........................................................... 57
Table 6.3 Motor vehicles on register by vehicle type 1987–2016 .................................................. 58
• ix •00
Figures
Figure 1.1 Deaths by jurisdiction ................................................................................................................... 4
Figure 1.2 Deaths by road user group ......................................................................................................... 5
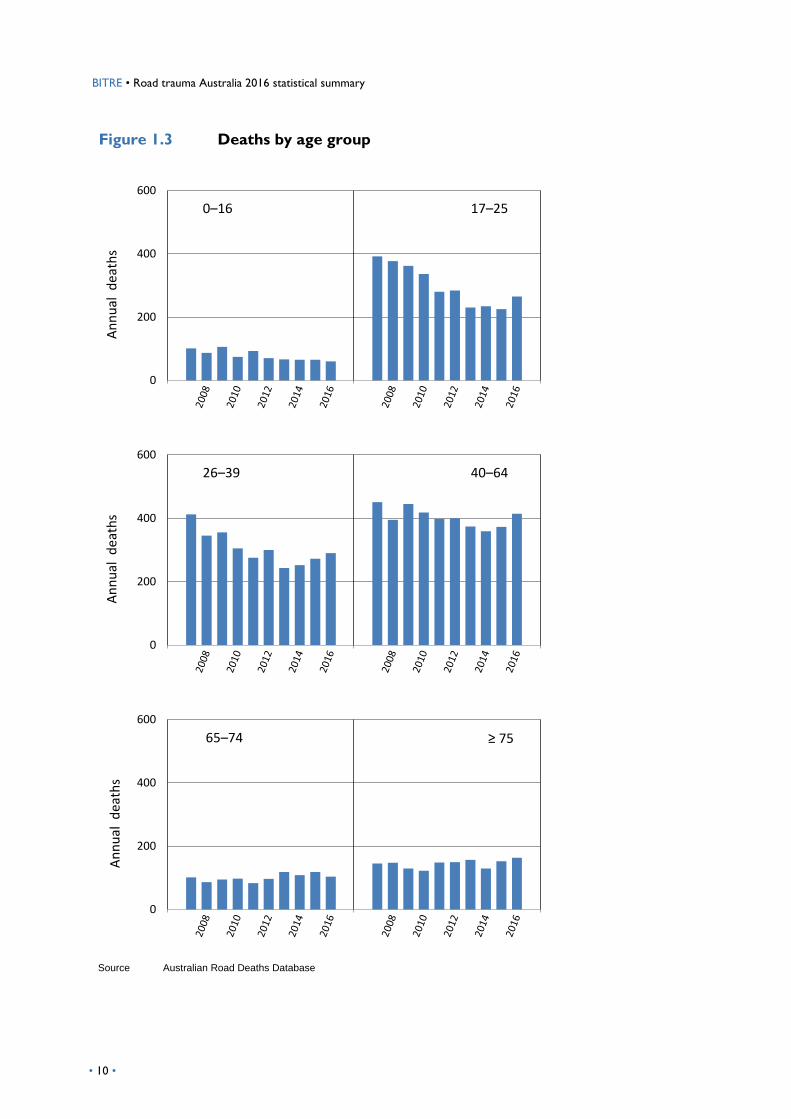
Figure 1.3 Deaths by age group .................................................................................................................. 10
Figure 1.4 Deaths by gender ......................................................................................................................... 11
Figure 1.5 Deaths by crash type ................................................................................................................... 12
Figure 1.6 Deaths in crashes involving heavy vehicles .......................................................................... 13
Figure 1.7 Deaths in crashes not involving heavy vehicles .................................................................. 13
Figure 1.8 Deaths in crashes involving younger or older drivers/motorcycle riders ................. 14
Figure 1.9 Deaths from common crash sub-types ................................................................................. 15
Figure 1.10 Hospitalised injuries – by road user and age group .......................................................... 18
Figure 2.1 Counts of fatal crashes by crash type .................................................................................... 25
Figure 2.2 Proportion of fatal crashes occurring during night-time ................................................. 26
Figure 2.3 Proportion of fatal crashes occurring during weekend ................................................... 27
Figure 2.4 Proportion of all fatal crashes by weekly time block ....................................................... 28
Figure 2.6 ASGS remoteness areas 2011 and selected cities and towns ....................................... 32
Figure 2.7 Average number of persons killed per fatal crash by speed zone ............................... 34
Figure 3.1 Annual fatalities and fatalities per 100,000 population ..................................................... 36
Figure 3.2 Annual fatalities per 100,000 population by jurisdiction ................................................. 37
Figure 3.3 Annual fatalities and fatalities per 100 million VKT ......................................................... 39
Figure 3.4 Annual hospitalised injuries and hospitalised injuries per 100,000 population ........ 41
Figure 4.1 National Road Safety Strategy (NRSS) 2011–2020 statistical progress towards
fatality target .................................................................................................................................. 43
• 1 •
Section 1 People
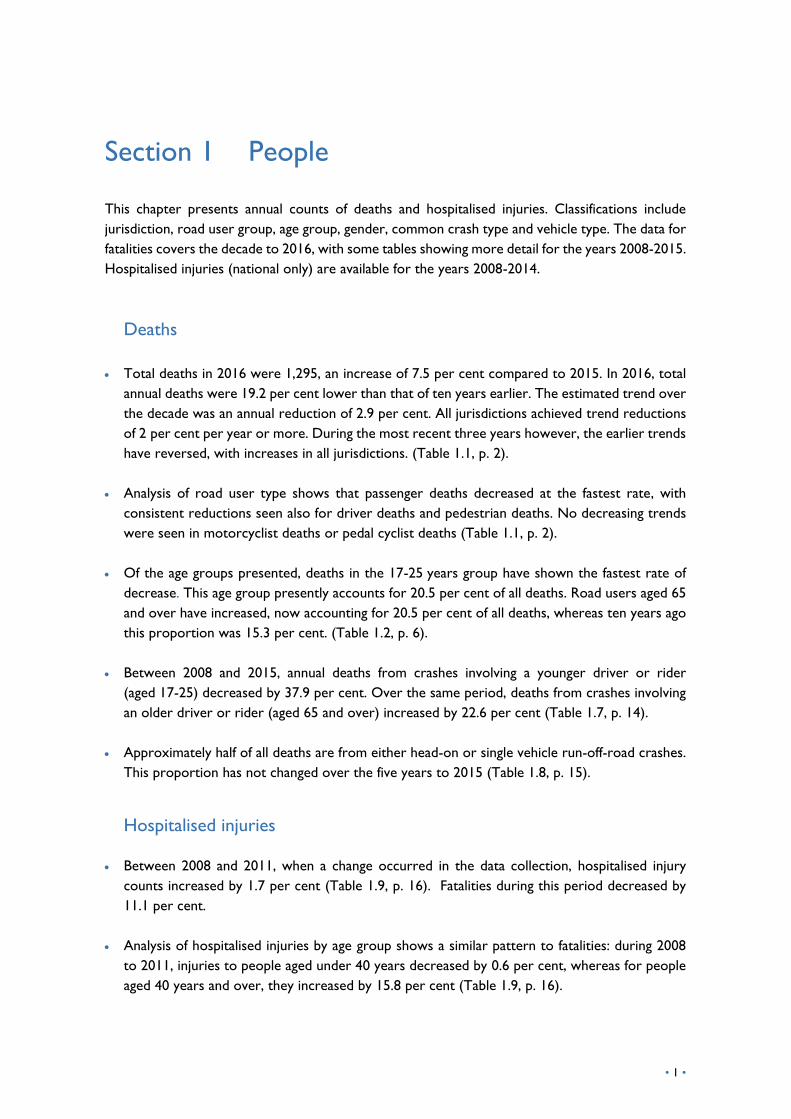
This chapter presents annual counts of deaths and hospitalised injuries. Classifications include
jurisdiction, road user group, age group, gender, common crash type and vehicle type. The data for
fatalities covers the decade to 2016, with some tables showing more detail for the years 2008-2015.
Hospitalised injuries (national only) are available for the years 2008-2014.
Deaths
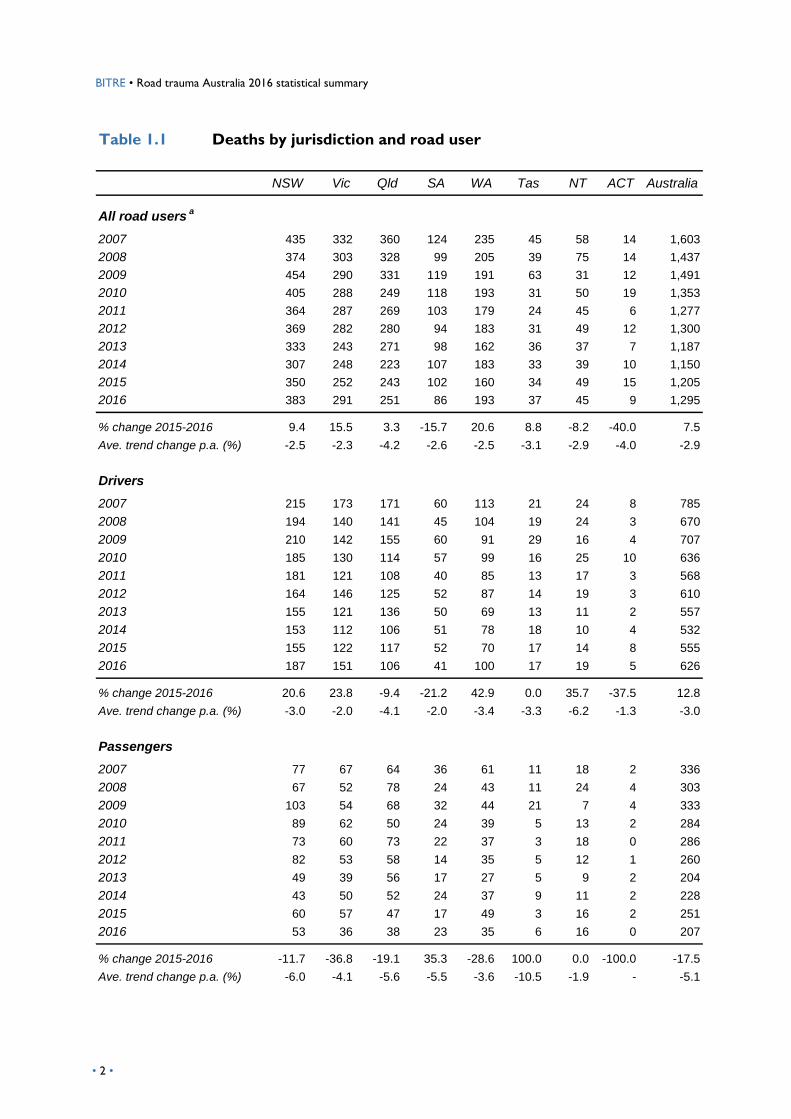
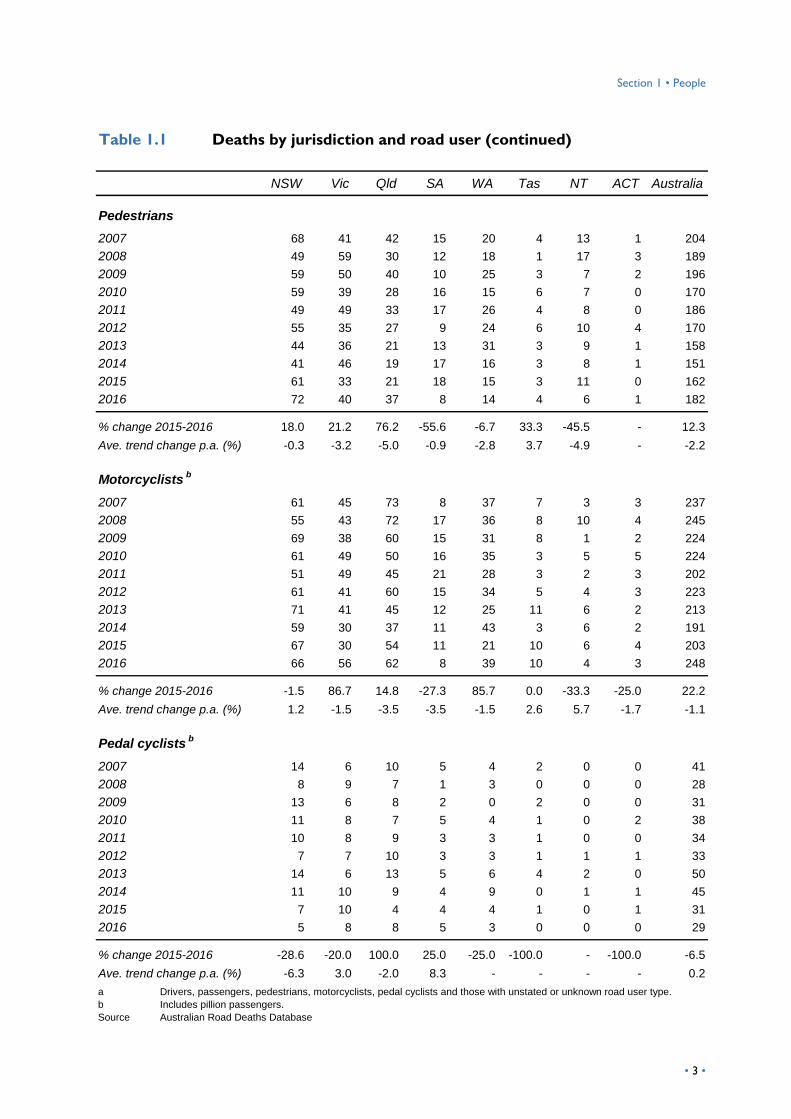
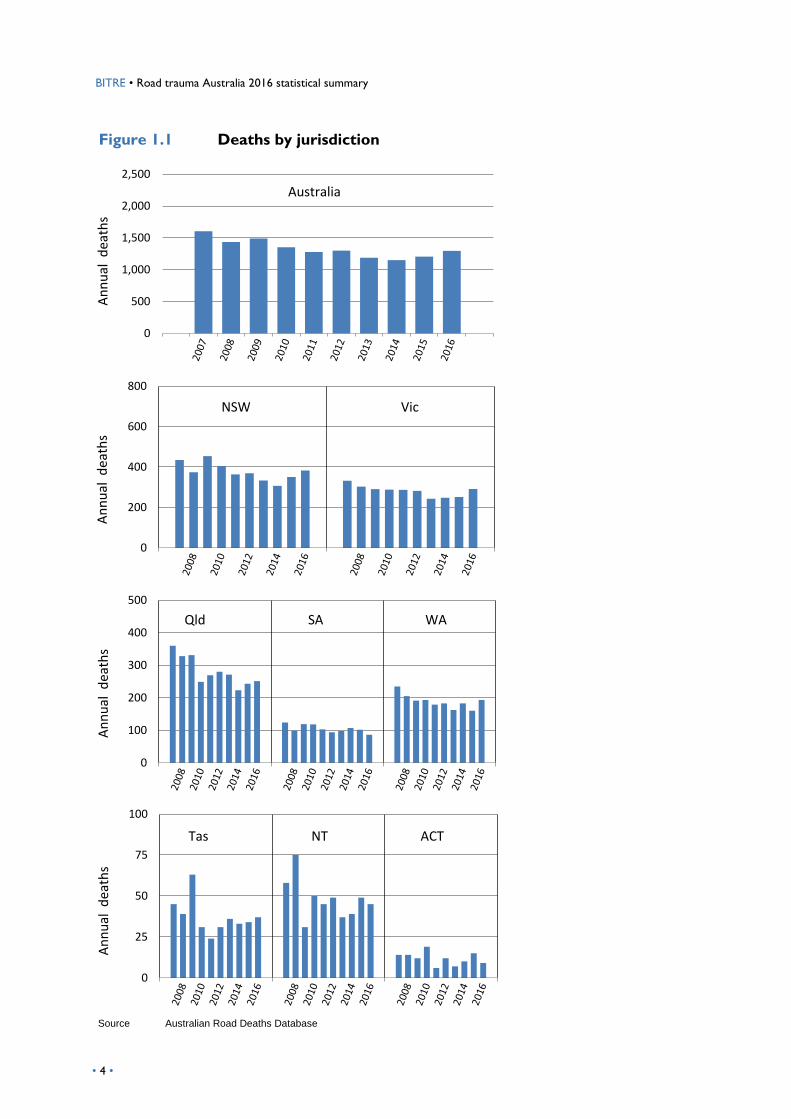
Total deaths in 2016 were 1,295, an increase of 7.5 per cent compared to 2015. In 2016, total
annual deaths were 19.2 per cent lower than that of ten years earlier. The estimated trend over
the decade was an annual reduction of 2.9 per cent. All jurisdictions achieved trend reductions
of 2 per cent per year or more. During the most recent three years however, the earlier trends
have reversed, with increases in all jurisdictions. (Table 1.1, p. 2).
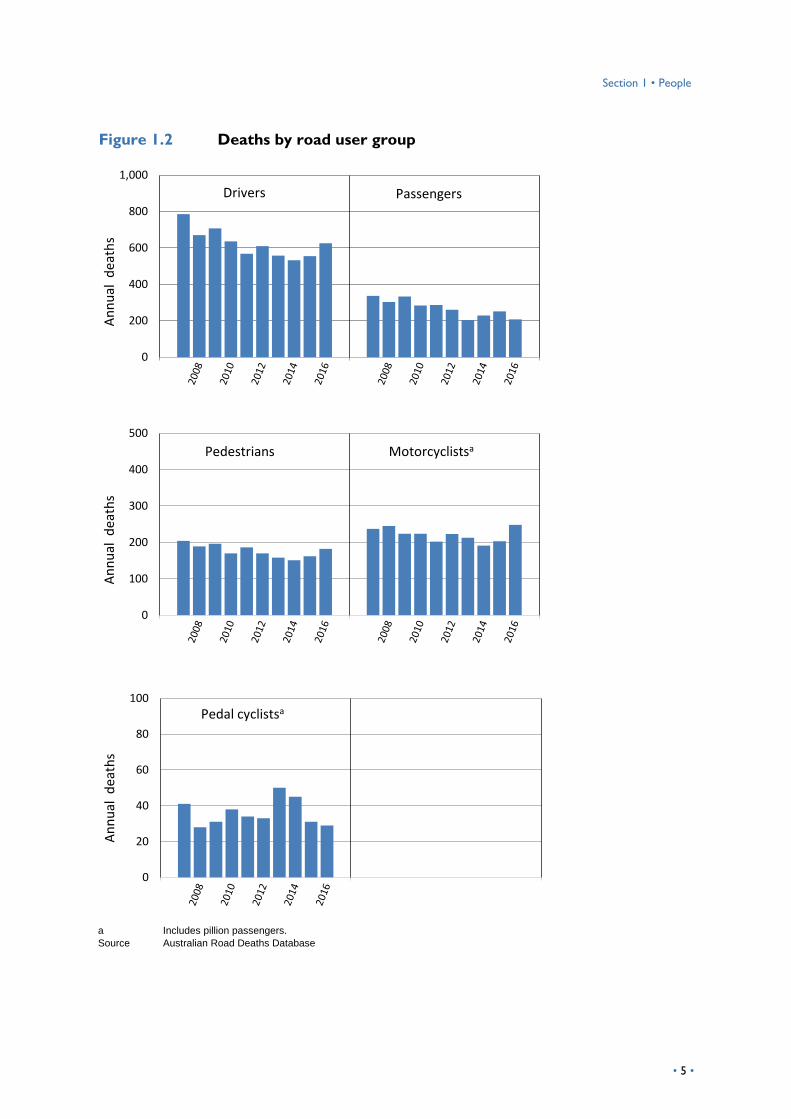
Analysis of road user type shows that passenger deaths decreased at the fastest rate, with
consistent reductions seen also for driver deaths and pedestrian deaths. No decreasing trends
were seen in motorcyclist deaths or pedal cyclist deaths (Table 1.1, p. 2).
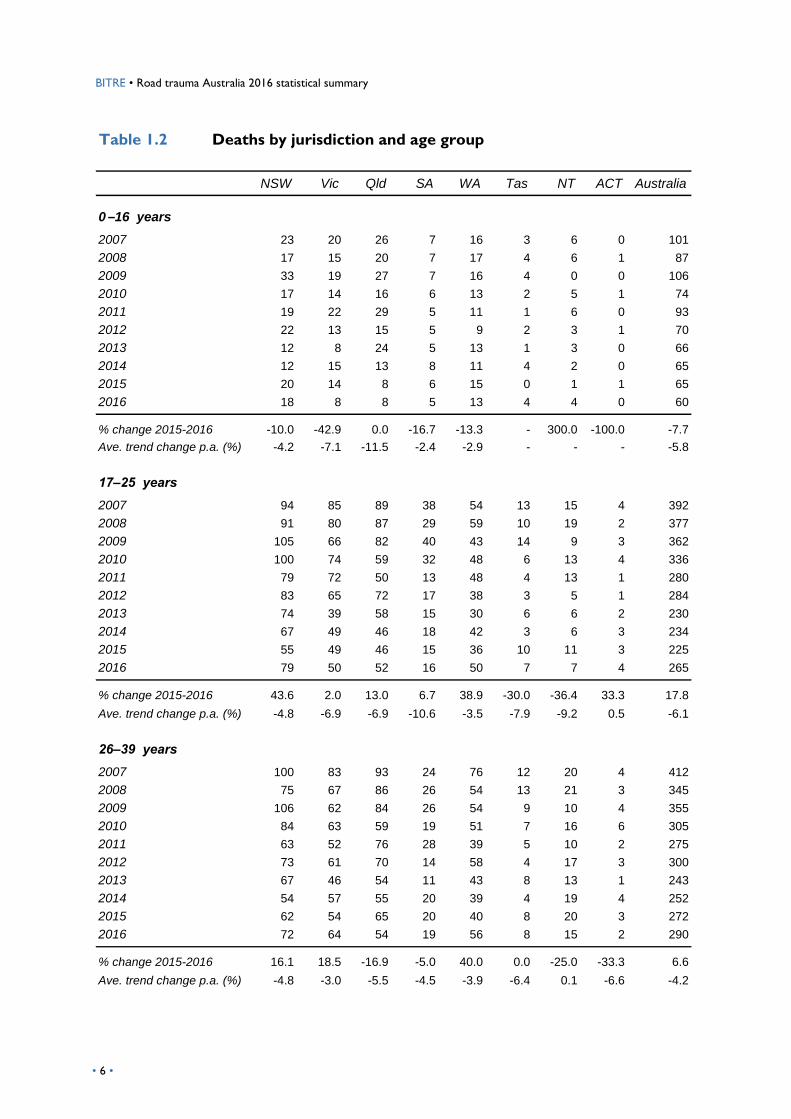
Of the age groups presented, deaths in the 17-25 years group have shown the fastest rate of
decrease. This age group presently accounts for 20.5 per cent of all deaths. Road users aged 65
and over have increased, now accounting for 20.5 per cent of all deaths, whereas ten years ago
this proportion was 15.3 per cent. (Table 1.2, p. 6).
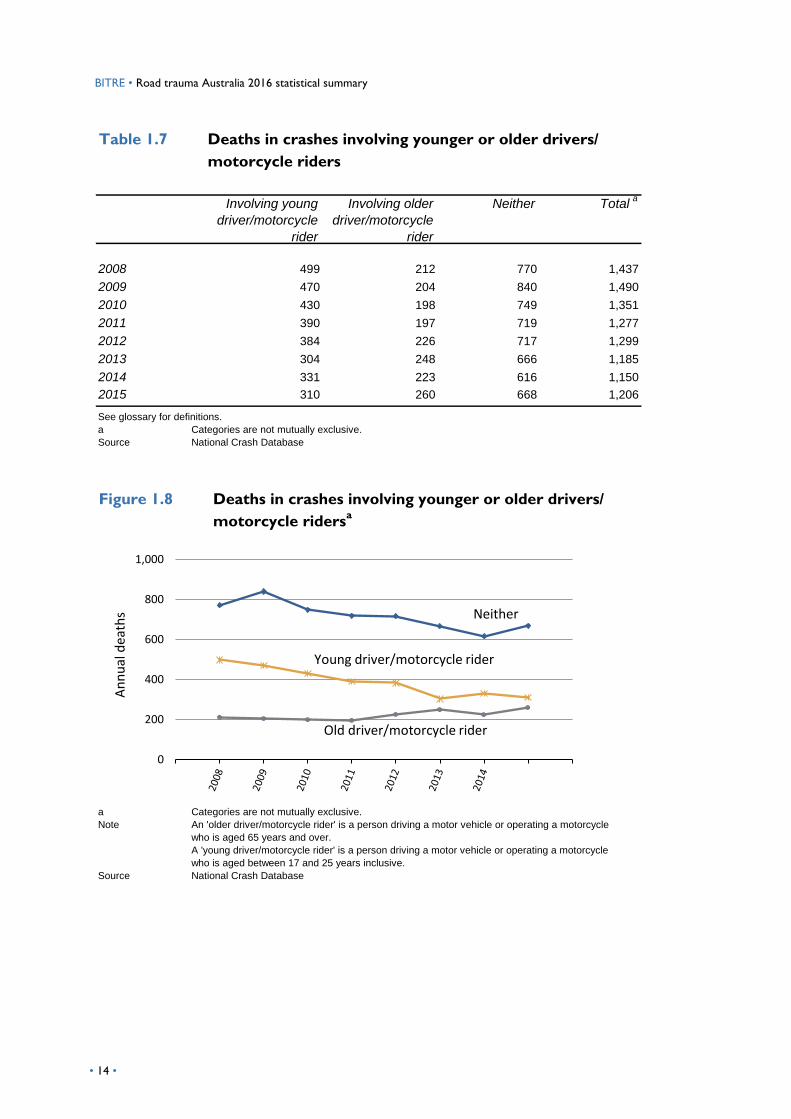
Between 2008 and 2015, annual deaths from crashes involving a younger driver or rider
(aged 17-25) decreased by 37.9 per cent. Over the same period, deaths from crashes involving
an older driver or rider (aged 65 and over) increased by 22.6 per cent (Table 1.7, p. 14).
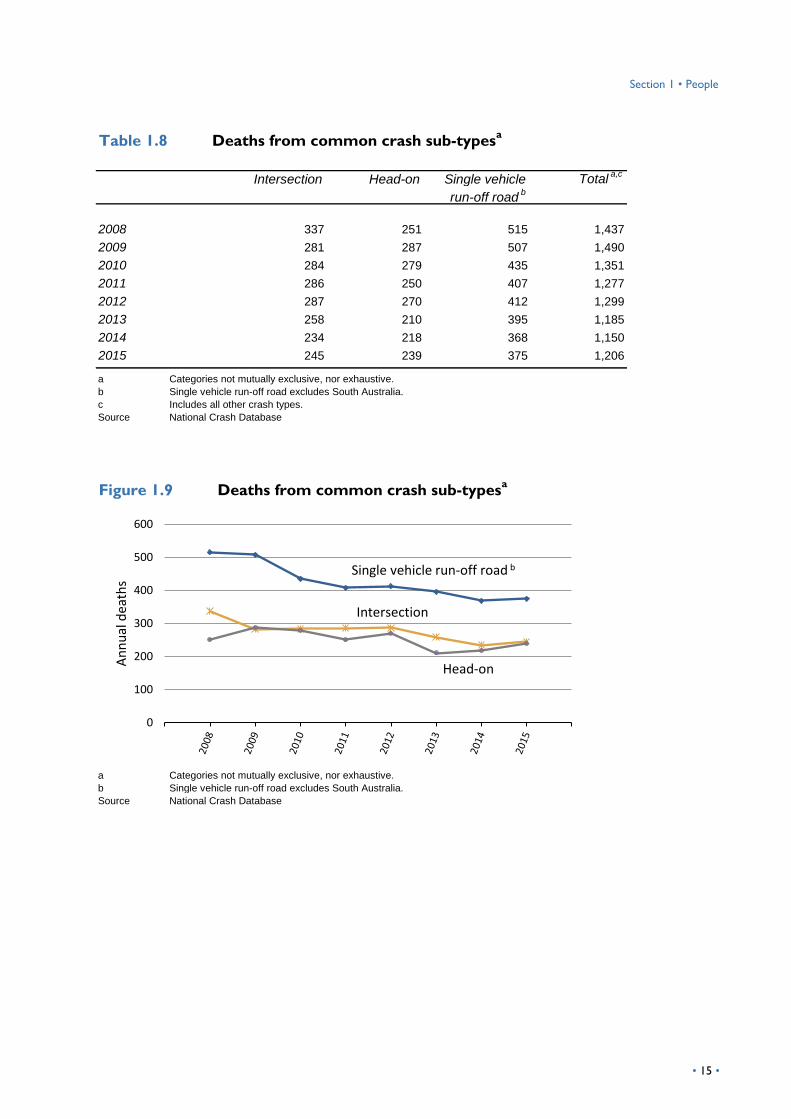
Approximately half of all deaths are from either head-on or single vehicle run-off-road crashes.
This proportion has not changed over the five years to 2015 (Table 1.8, p. 15).
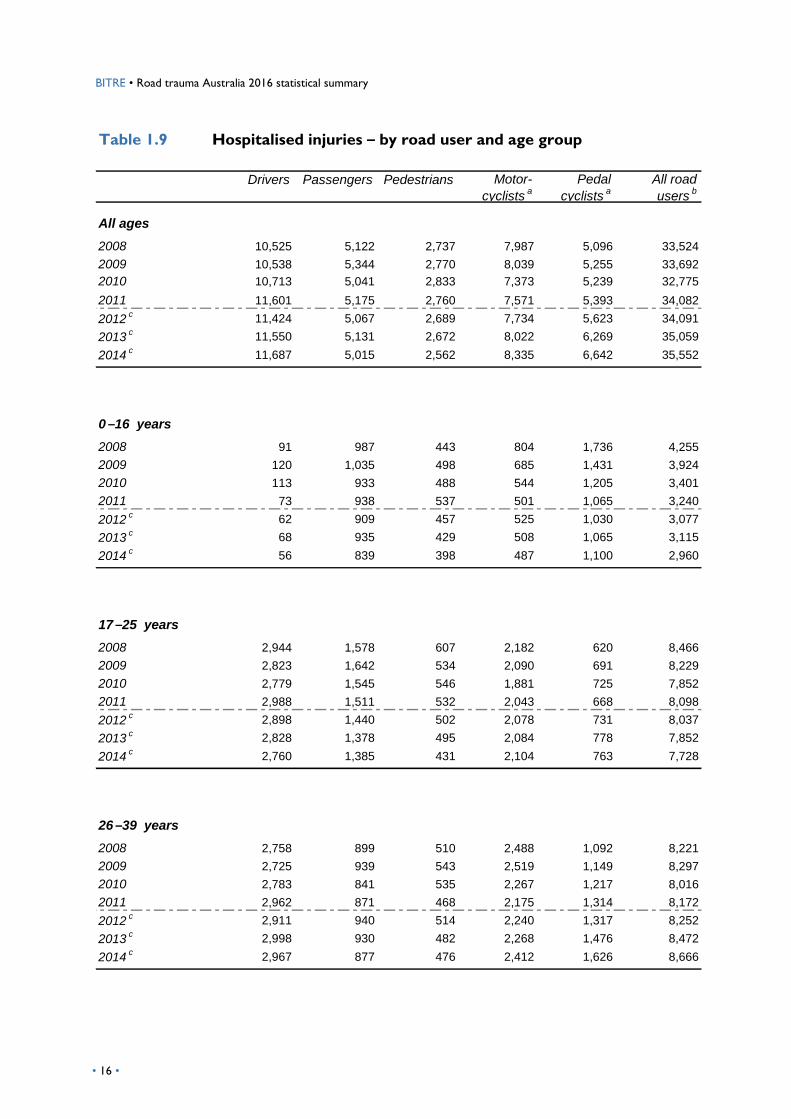
Hospitalised injuries
Between 2008 and 2011, when a change occurred in the data collection, hospitalised injury
counts increased by 1.7 per cent (Table 1.9, p. 16). Fatalities during this period decreased by
11.1 per cent.
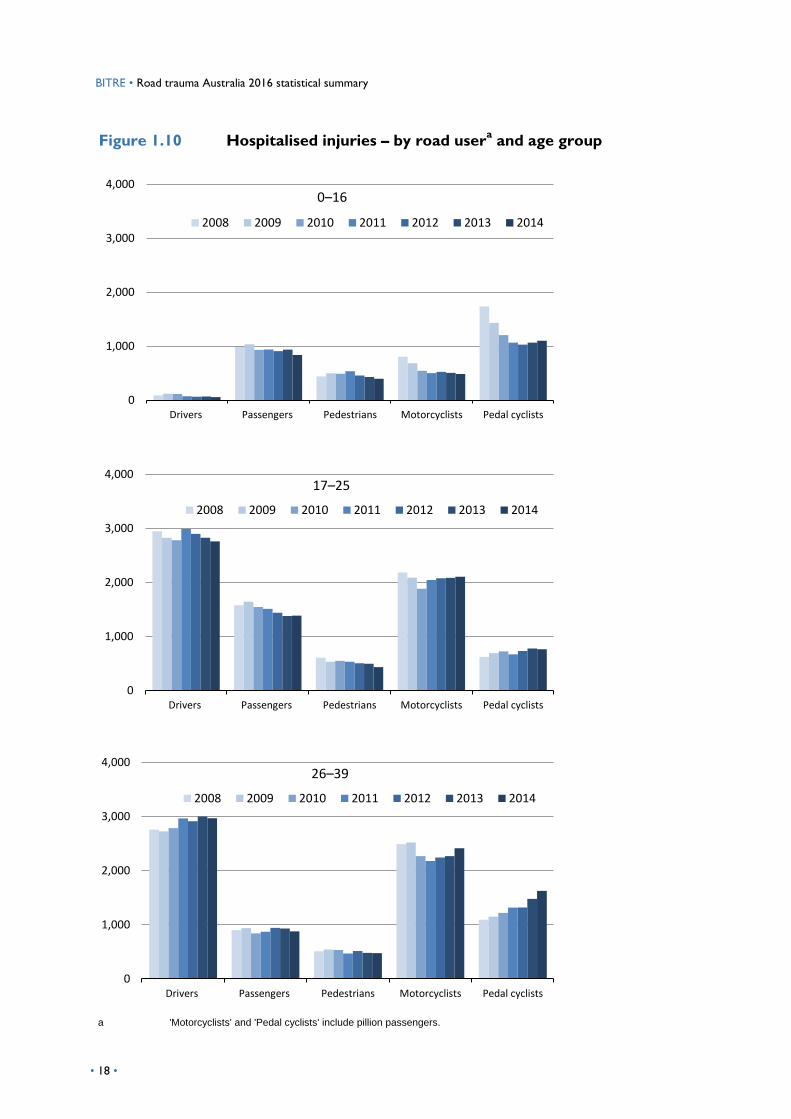
Analysis of hospitalised injuries by age group shows a similar pattern to fatalities: during 2008
to 2011, injuries to people aged under 40 years decreased by 0.6 per cent, whereas for people
aged 40 years and over, they increased by 15.8 per cent (Table 1.9, p. 16).
BITRE • Road trauma Australia 2016 statistical summary
Table 1.1 Deaths by jurisdiction and road user
NSW Vic Qld SA WA Tas NT ACT Australia
All road usersa
2007 435 332 360 124 235 45 58 14 1,603
2008 374 303 328 99 205 39 75 14 1,437
2009 454 290 331 119 191 63 31 12 1,491
2010 405 288 249 118 193 31 50 19 1,353
2011 364 287 269 103 179 24 45 6 1,277
2012 369 282 280 94 183 31 49 12 1,300
2013 333 243 271 98 162 36 37 7 1,187
2014 307 248 223 107 183 33 39 10 1,150
2015 350 252 243 102 160 34 49 15 1,205
2016 383 291 251 86 193 37 45 9 1,295
% change 2015-2016 9.4 15.5 3.3 -15.7 20.6 8.8 -8.2 -40.0 7.5
Ave. trend change p.a. (%) -2.5 -2.3 -4.2 -2.6 -2.5 -3.1 -2.9 -4.0 -2.9
Drivers
2007 215 173 171 60 113 21 24 8 785
2008 194 140 141 45 104 19 24 3 670
2009 210 142 155 60 91 29 16 4 707
2010 185 130 114 57 99 16 25 10 636
2011 181 121 108 40 85 13 17 3 568
2012 164 146 125 52 87 14 19 3 610
2013 155 121 136 50 69 13 11 2 557
2014 153 112 106 51 78 18 10 4 532
2015 155 122 117 52 70 17 14 8 555
2016 187 151 106 41 100 17 19 5 626
% change 2015-2016 20.6 23.8 -9.4 -21.2 42.9 0.0 35.7 -37.5 12.8
Ave. trend change p.a. (%) -3.0 -2.0 -4.1 -2.0 -3.4 -3.3 -6.2 -1.3 -3.0
Passengers
2007 77 67 64 36 61 11 18 2 336
2008 67 52 78 24 43 11 24 4 303
2009 103 54 68 32 44 21 7 4 333
2010 89 62 50 24 39 5 13 2 284
2011 73 60 73 22 37 3 18 0 286
2012 82 53 58 14 35 5 12 1 260
2013 49 39 56 17 27 5 9 2 204
2014 43 50 52 24 37 9 11 2 228
2015 60 57 47 17 49 3 16 2 251
2016 53 36 38 23 35 6 16 0 207
% change 2015-2016 -11.7 -36.8 -19.1 35.3 -28.6 100.0 0.0 -100.0 -17.5
Ave. trend change p.a. (%) -6.0 -4.1 -5.6 -5.5 -3.6 -10.5 -1.9 - -5.1
• 2 •
Section 1 • Peoplesss
Table 1.1 Deaths by jurisdiction and road user (continued)
NSW Vic Qld SA WA Tas NT ACT Australia
Pedestrians
2007 68 41 42 15 20 4 13 1 204
2008 49 59 30 12 18 1 17 3 189
2009 59 50 40 10 25 3 7 2 196
2010 59 39 28 16 15 6 7 0 170
2011 49 49 33 17 26 4 8 0 186
2012 55 35 27 9 24 6 10 4 170
2013 44 36 21 13 31 3 9 1 158
2014 41 46 19 17 16 3 8 1 151
2015 61 33 21 18 15 3 11 0 162
2016 72 40 37 8 14 4 6 1 182
% change 2015-2016 18.0 21.2 76.2 -55.6 -6.7 33.3 -45.5 - 12.3
Ave. trend change p.a. (%) -0.3 -3.2 -5.0 -0.9 -2.8 3.7 -4.9 - -2.2
Motorcyclistsb
2007 61 45 73 8 37 7 3 3 237
2008 55 43 72 17 36 8 10 4 245
2009 69 38 60 15 31 8 1 2 224
2010 61 49 50 16 35 3 5 5 224
2011 51 49 45 21 28 3 2 3 202
2012 61 41 60 15 34 5 4 3 223
2013 71 41 45 12 25 11 6 2 213
2014 59 30 37 11 43 3 6 2 191
2015 67 30 54 11 21 10 6 4 203
2016 66 56 62 8 39 10 4 3 248
% change 2015-2016 -1.5 86.7 14.8 -27.3 85.7 0.0 -33.3 -25.0 22.2
Ave. trend change p.a. (%) 1.2 -1.5 -3.5 -3.5 -1.5 2.6 5.7 -1.7 -1.1
Pedal cyclistsb
2007 14 6 10 5 4 2 0 0 41
2008 8 9 7 1 3 0 0 0 28
2009 13 6 8 2 0 2 0 0 31
2010 11 8 7 5 4 1 0 2 38
2011 10 8 9 3 3 1 0 0 34
2012 7 7 10 3 3 1 1 1 33
2013 14 6 13 5 6 4 2 0 50
2014 11 10 9 4 9 0 1 1 45
2015 7 10 4 4 4 1 0 1 31
2016 5 8 8 5 3 0 0 0 29
% change 2015-2016 -28.6 -20.0 100.0 25.0 -25.0 -100.0 - -100.0 -6.5
Ave. trend change p.a. (%) -6.3 3.0 -2.0 8.3 - - - - 0.2
a Drivers, passengers, pedestrians, motorcyclists, pedal cyclists and those with unstated or unknown road user type.
b Includes pillion passengers.
Source Australian Road Deaths Database
• 3 •sss
BITRE • Road trauma Australia 2016 statistical summary
Figure 1.1 Deaths by jurisdiction
Source Australian Road Deaths Database
0
200
400
600
800
NSW Vic
An
nu
al d
eath
s
0
500
1,000
1,500
2,000
2,500
Australia
An
nu
al d
eath
s
0
100
200
300
400
500
Qld WA
An
nu
al d
eath
s
SA
0
25
50
75
100
Tas NT
An
nu
al d
eath
s
ACT
• 4 •
Section 1 • Peopleghhgh
gjg
Figure 1.2 Deaths by road user group
a Includes pillion passengers.
Source Australian Road Deaths Database
0
200
400
600
800
1,000
Drivers Passengers
An
nu
al d
eath
s
0
100
200
300
400
500
Pedestrians Motorcyclistsa
An
nu
al d
eath
s
0
20
40
60
80
100
Pedal cyclistsa
An
nu
al d
eath
s
• 5 •jjjjjjjjg
BITRE • Road trauma Australia 2016 statistical summary
Table 1.2 Deaths by jurisdiction and age group
NSW Vic Qld SA WA Tas NT ACT Australia
0 –16 years
2007 23 20 26 7 16 3 6 0 101
2008 17 15 20 7 17 4 6 1 87
2009 33 19 27 7 16 4 0 0 106
2010 17 14 16 6 13 2 5 1 74
2011 19 22 29 5 11 1 6 0 93
2012 22 13 15 5 9 2 3 1 70
2013 12 8 24 5 13 1 3 0 66
2014 12 15 13 8 11 4 2 0 65
2015 20 14 8 6 15 0 1 1 65
2016 18 8 8 5 13 4 4 0 60
% change 2015-2016 -10.0 -42.9 0.0 -16.7 -13.3 - 300.0 -100.0 -7.7
Ave. trend change p.a. (%) -4.2 -7.1 -11.5 -2.4 -2.9 - - - -5.8
17–25 years
2007 94 85 89 38 54 13 15 4 392
2008 91 80 87 29 59 10 19 2 377
2009 105 66 82 40 43 14 9 3 362
2010 100 74 59 32 48 6 13 4 336
2011 79 72 50 13 48 4 13 1 280
2012 83 65 72 17 38 3 5 1 284
2013 74 39 58 15 30 6 6 2 230
2014 67 49 46 18 42 3 6 3 234
2015 55 49 46 15 36 10 11 3 225
2016 79 50 52 16 50 7 7 4 265
% change 2015-2016 43.6 2.0 13.0 6.7 38.9 -30.0 -36.4 33.3 17.8
Ave. trend change p.a. (%) -4.8 -6.9 -6.9 -10.6 -3.5 -7.9 -9.2 0.5 -6.1
26–39 years
2007 100 83 93 24 76 12 20 4 412
2008 75 67 86 26 54 13 21 3 345
2009 106 62 84 26 54 9 10 4 355
2010 84 63 59 19 51 7 16 6 305
2011 63 52 76 28 39 5 10 2 275
2012 73 61 70 14 58 4 17 3 300
2013 67 46 54 11 43 8 13 1 243
2014 54 57 55 20 39 4 19 4 252
2015 62 54 65 20 40 8 20 3 272
2016 72 64 54 19 56 8 15 2 290
% change 2015-2016 16.1 18.5 -16.9 -5.0 40.0 0.0 -25.0 -33.3 6.6
Ave. trend change p.a. (%) -4.8 -3.0 -5.5 -4.5 -3.9 -6.4 0.1 -6.6 -4.2
• 6 •
Section 1 • People
Table 1.2 Deaths by jurisdiction and age group (continued)
NSW Vic Qld SA WA Tas NT ACT Australia
40–64 years
2007 129 95 104 24 66 14 16 3 451
2008 115 83 90 24 50 8 22 3 395
2009 129 91 95 34 56 25 10 5 445
2010 125 86 79 43 57 9 13 6 418
2011 131 84 73 35 48 10 14 3 398
2012 106 86 85 31 56 12 20 4 400
2013 104 79 89 38 45 8 10 1 374
2014 97 71 75 33 57 12 12 2 359
2015 115 78 70 33 47 11 15 4 373
2016 120 106 84 21 54 11 15 3 414
% change 2015-2016 4.3 35.9 20.0 -36.4 14.9 0.0 0.0 -25.0 11.0
Ave. trend change p.a. (%) -1.7 -0.6 -2.6 0.2 -1.6 -2.3 -1.7 -4.5 -1.5
65–74 years
2007 39 21 21 8 8 1 0 3 101
2008 32 14 17 5 15 1 2 0 86
2009 33 18 19 2 14 6 2 0 94
2010 35 17 15 9 13 5 3 0 97
2011 21 19 21 5 14 2 1 0 83
2012 35 22 14 7 10 5 2 1 96
2013 33 26 19 9 19 7 5 0 118
2014 33 22 20 14 15 3 0 1 108
2015 47 27 19 10 9 2 2 2 118
2016 40 23 16 9 10 2 3 0 103
% change 2015-2016 -14.9 -14.8 -15.8 -10.0 11.1 0.0 50.0 -100.0 -12.7
Ave. trend change p.a. (%) 2.0 4.9 -0.7 10.2 -0.3 6.0 - - 2.3
≥ 75 years
2007 50 28 27 23 15 2 0 0 145
2008 44 44 28 8 10 3 5 5 147
2009 48 34 24 10 8 5 0 0 129
2010 43 34 21 9 11 2 0 2 122
2011 51 38 20 17 19 2 1 0 148
2012 49 35 24 20 12 5 2 2 149
2013 43 45 27 20 12 6 0 3 156
2014 43 34 14 13 18 7 0 0 129
2015 51 30 35 18 13 3 0 2 152
2016 54 40 37 16 10 5 1 0 163
% change 2015-2016 5.9 33.3 5.7 -11.1 -23.1 66.7 - -100.0 7.2
Ave. trend change p.a. (%) 0.7 0.8 1.6 3.9 1.2 8.9 - - 1.2
Source Australian Road Deaths Database
• 7 •
BITRE • Road trauma Australia 2016 statistical summary
Table 1.3 Deaths by road user and age group
Motor- Pedal All road
cyclistsa
cyclistsa
usersb
0–16 years
2007 5 61 18 9 8 101
2008 6 62 13 2 4 87
2009 8 75 18 3 2 106
2010 4 52 15 2 1 74
2011 4 67 14 5 2 93
2012 7 40 15 6 2 70
2013 4 37 13 4 7 66
2014 3 41 17 2 2 65
2015 2 49 11 3 0 65
2016 4 36 12 6 1 60
% change 2015-2016 100.0 -26.5 9.1 100.0 - -7.7
Ave. trend change p.a. (%) -8.2 -6.4 -3.3 -0.3 - -5.8
17–25 years
2007 200 100 29 59 4 392
2008 180 99 34 60 3 377
2009 178 114 25 43 2 362
2010 169 80 34 49 4 336
2011 132 77 21 47 3 280
2012 140 73 24 43 3 284
2013 120 52 16 38 4 230
2014 111 58 20 40 3 234
2015 113 64 11 33 4 225
2016 136 56 25 46 1 265
% change 2015-2016 20.4 -12.5 127.3 39.4 -75.0 17.8
Ave. trend change p.a. (%) -5.9 -7.6 -7.3 -4.5 -5.0 -6.1
26–39 years
2007 220 56 39 86 11 412
2008 163 52 34 88 8 345
2009 181 50 42 77 5 355
2010 152 48 30 68 7 305
2011 131 54 32 55 3 275
2012 152 40 29 70 7 300
2013 111 35 21 64 11 243
2014 123 39 23 58 8 252
2015 132 47 27 60 4 272
2016 164 35 26 63 2 290
% change 2015-2016 24.2 -25.5 -3.7 5.0 -50.0 6.6
Ave. trend change p.a. (%) -4.1 -4.4 -5.6 -4.1 -9.0 -4.2
Drivers Passengers Pedestrians
• 8 •
Section 1 • People
Table 1.3 Deaths by road user and age group (continued)
Motor- Pedal All road
cyclistsa
cyclistsa
usersb
40–64 years
2007 241 50 66 77 17 451
2008 204 50 45 88 7 395
2009 230 49 54 98 14 445
2010 213 44 48 95 18 418
2011 197 42 55 85 19 398
2012 199 48 46 95 12 400
2013 190 35 43 84 21 374
2014 171 49 43 79 17 359
2015 175 42 45 95 16 373
2016 193 29 61 118 13 414
% change 2015-2016 10.3 -31.0 35.6 24.2 -18.8 11.0
Ave. trend change p.a. (%) -2.9 -4.0 -1.4 1.9 2.7 -1.5
65–74 years
2007 52 30 15 3 1 101
2008 43 15 21 6 1 86
2009 47 19 20 2 6 94
2010 40 26 15 10 6 97
2011 41 14 18 6 4 83
2012 41 23 19 8 5 96
2013 54 18 22 17 6 118
2014 64 12 13 8 11 108
2015 58 21 25 11 3 118
2016 47 18 18 11 8 103
% change 2015-2016 -19.0 -14.3 -28.0 0.0 166.7 -12.7
Ave. trend change p.a. (%) 2.2 -3.1 1.2 16.2 19.7 2.3
≥ 75 years
2007 67 38 37 3 0 145
2008 74 25 42 1 5 147
2009 63 26 37 1 2 129
2010 58 33 28 0 2 122
2011 63 32 46 4 3 148
2012 71 35 37 1 4 149
2013 78 27 43 6 1 156
2014 59 27 35 4 4 129
2015 75 28 43 1 4 152
2016 82 33 40 4 4 163
% change 2015-2016 9.3 17.9 -7.0 300.0 0.0 7.2
Ave. trend change p.a. (%) 1.6 -0.5 1.0 - - 1.2
a Includes pillion passengers.
b Drivers, passengers, pedestrians, motorcyclists, pedal cyclists and those with unstated or unknown road user type.
Source Australian Road Deaths Database
Drivers Passengers Pedestrians
• 9 •
BITRE • Road trauma Australia 2016 statistical summary
Figure 1.3 Deaths by age group
Source Australian Road Deaths Database
0
200
400
600
26–39
An
nu
al d
eath
s
40–64
0
200
400
600
65–74
An
nu
al d
eath
s
≥ 75
0
200
400
600
0–16
An
nu
al d
eath
s
17–25
• 10 •
Section 1 • Peopless
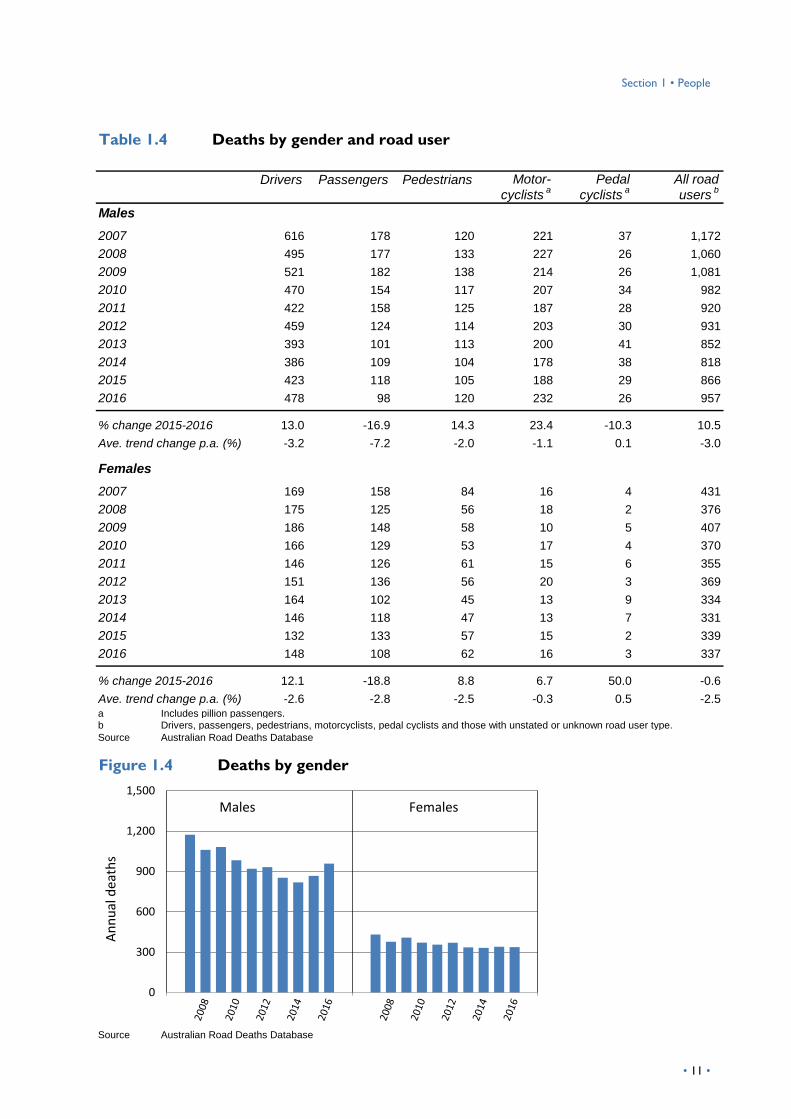
Table 1.4 Deaths by gender and road user
Motor- Pedal All road
cyclistsa
cyclistsa
usersb
Males
2007 616 178 120 221 37 1,172
2008 495 177 133 227 26 1,060
2009 521 182 138 214 26 1,081
2010 470 154 117 207 34 982
2011 422 158 125 187 28 920
2012 459 124 114 203 30 931
2013 393 101 113 200 41 852
2014 386 109 104 178 38 818
2015 423 118 105 188 29 866
2016 478 98 120 232 26 957
% change 2015-2016 13.0 -16.9 14.3 23.4 -10.3 10.5
Ave. trend change p.a. (%) -3.2 -7.2 -2.0 -1.1 0.1 -3.0
Females
2007 169 158 84 16 4 431
2008 175 125 56 18 2 376
2009 186 148 58 10 5 407
2010 166 129 53 17 4 370
2011 146 126 61 15 6 355
2012 151 136 56 20 3 369
2013 164 102 45 13 9 334
2014 146 118 47 13 7 331
2015 132 133 57 15 2 339
2016 148 108 62 16 3 337
% change 2015-2016 12.1 -18.8 8.8 6.7 50.0 -0.6
Ave. trend change p.a. (%) -2.6 -2.8 -2.5 -0.3 0.5 -2.5a Includes pillion passengers.
b Drivers, passengers, pedestrians, motorcyclists, pedal cyclists and those with unstated or unknown road user type.
Source Australian Road Deaths Database
Figure 1.4 Deaths by gender
0
300
600
900
1,200
1,500
Males
An
nu
al d
eath
s
Females
Source Australian Road Deaths Database
Drivers Passengers Pedestrians
• 11 •ss
BITRE • Road trauma Australia 2016 statistical summary
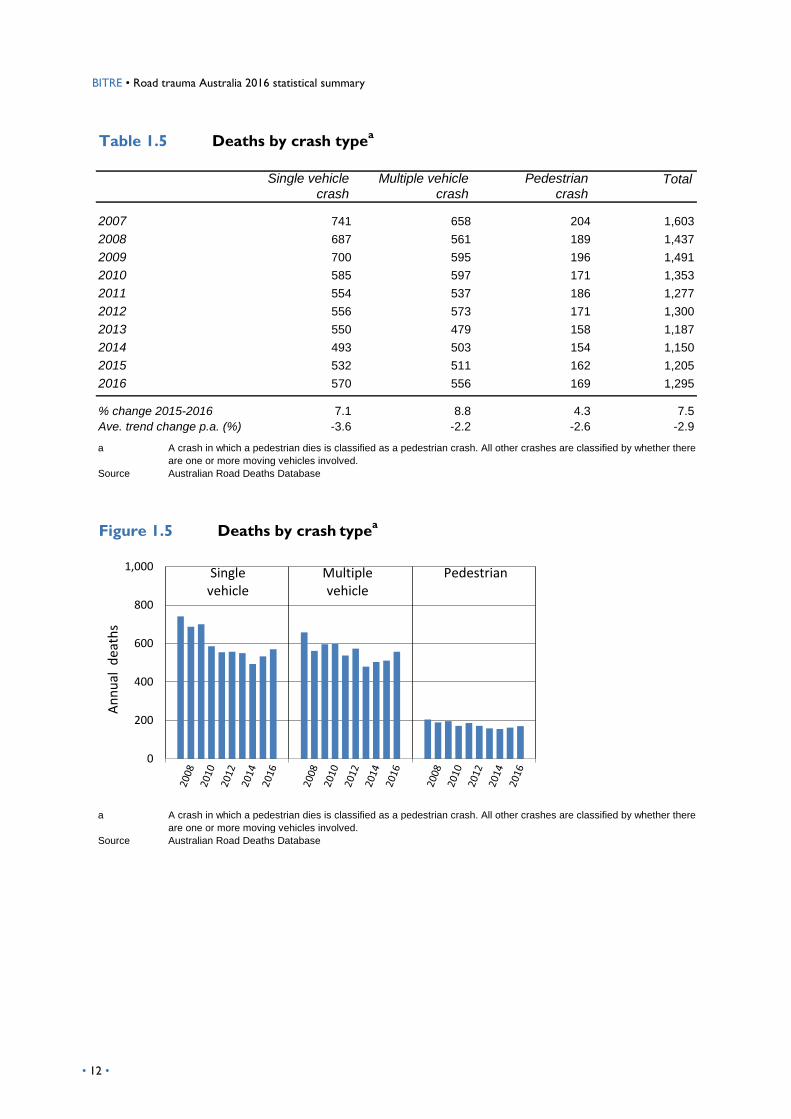
Table 1.5 Deaths by crash typea
Single vehicle Multiple vehicle Pedestrian Totalcrash crash crash
2007 741 658 204 1,603
2008 687 561 189 1,437
2009 700 595 196 1,491
2010 585 597 171 1,353
2011 554 537 186 1,277
2012 556 573 171 1,300
2013 550 479 158 1,187
2014 493 503 154 1,150
2015 532 511 162 1,205
2016 570 556 169 1,295
% change 2015-2016 7.1 8.8 4.3 7.5
Ave. trend change p.a. (%) -3.6 -2.2 -2.6 -2.9
a A crash in which a pedestrian dies is classified as a pedestrian crash. All other crashes are classified by whether there
are one or more moving vehicles involved.
Source Australian Road Deaths Database
Figure 1.5 Deaths by crash type
a
a A crash in which a pedestrian dies is classified as a pedestrian crash. All other crashes are classified by whether there
are one or more moving vehicles involved.
Source Australian Road Deaths Database
0
200
400
600
800
1,000 Singlevehicle
An
nu
al d
eath
s
Multiplevehicle
Pedestrianvehicle
• 12 •
Section 1 • People
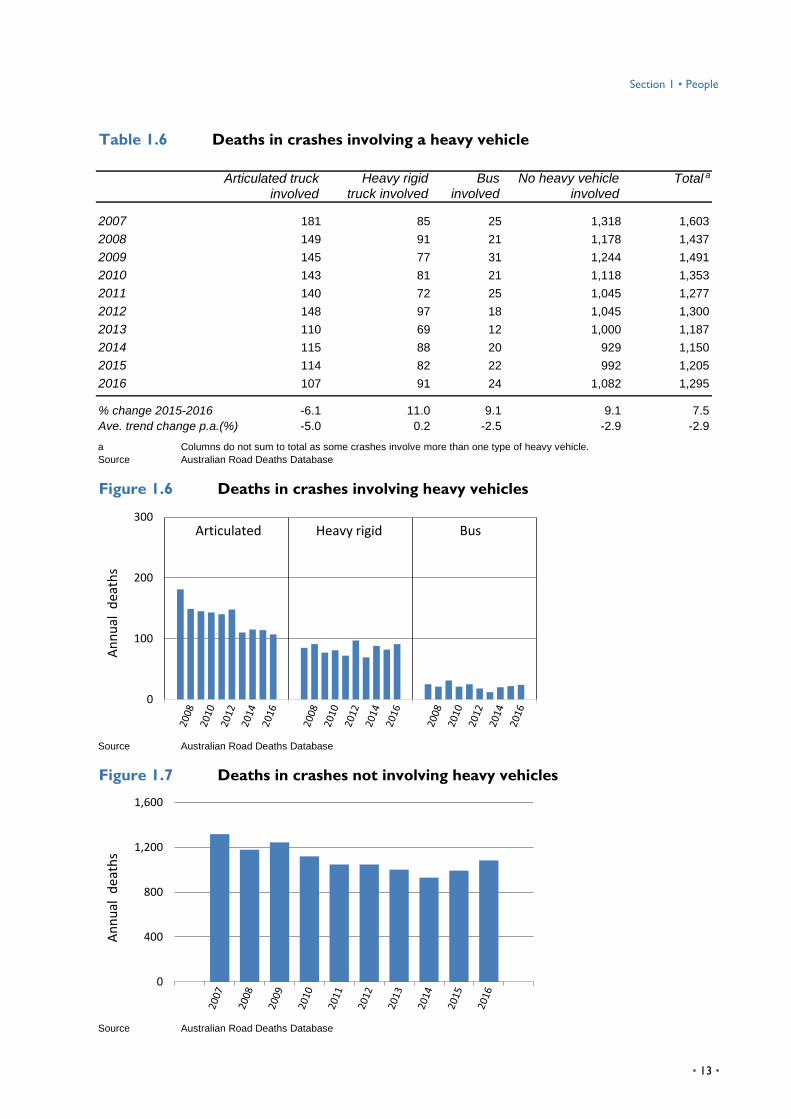
Table 1.6 Deaths in crashes involving a heavy vehicle
Heavy rigid Bus No heavy vehicle Total involved truck involved involved involved
2007 181 85 25 1,318 1,603
2008 149 91 21 1,178 1,437
2009 145 77 31 1,244 1,491
2010 143 81 21 1,118 1,353
2011 140 72 25 1,045 1,277
2012 148 97 18 1,045 1,300
2013 110 69 12 1,000 1,187
2014 115 88 20 929 1,150
2015 114 82 22 992 1,205
2016 107 91 24 1,082 1,295
% change 2015-2016 -6.1 11.0 9.1 9.1 7.5
Ave. trend change p.a.(%) -5.0 0.2 -2.5 -2.9 -2.9
a Columns do not sum to total as some crashes involve more than one type of heavy vehicle.
Source Australian Road Deaths Database
Figure 1.6 Deaths in crashes involving heavy vehicles
Source Australian Road Deaths Database
Figure 1.7 Deaths in crashes not involving heavy vehicles
0
400
800
1,200
1,600
An
nu
al d
eath
s
Source Australian Road Deaths Database
Articulated truck
0
100
200
300Articulated
An
nu
al d
eath
s
BusHeavy rigid
a
• 13 •
BITRE • Road trauma Australia 2016 statistical summary
Table 1.7 Deaths in crashes involving younger or older drivers/
Table 1.7 motorcycle riders
Involving young
driver/motorcycle
rider
Involving older
driver/motorcycle
rider
Neither Total l
2008 499 212 770 1,437
2009 470 204 840 1,490
2010 430 198 749 1,351
2011 390 197 719 1,277
2012 384 226 717 1,299
2013 304 248 666 1,185
2014 331 223 616 1,150
2015 310 260 668 1,206
See glossary for definitions.
a Categories are not mutually exclusive.
Source National Crash Database
Figure 1.8 Deaths in crashes involving younger or older drivers/
Figure 1.8 motorcycle ridersa
a Categories are not mutually exclusive.
Note An 'older driver/motorcycle rider' is a person driving a motor vehicle or operating a motorcycle
who is aged 65 years and over.
A 'young driver/motorcycle rider' is a person driving a motor vehicle or operating a motorcycle
who is aged between 17 and 25 years inclusive.
Source National Crash Database
0
200
400
600
800
1,000
An
nu
al d
eath
s Neither
Young driver/motorcycle rider
Old driver/motorcycle rider
a
• 14 •
Section 1 • People
Table 1.8 Deaths from common crash sub-typesa
Table 1.7 Intersection Head-on Single vehicle Total
a,c
run-off roadb
2008 337 251 515 1,437
2009 281 287 507 1,490
2010 284 279 435 1,351
2011 286 250 407 1,277
2012 287 270 412 1,299
2013 258 210 395 1,185
2014 234 218 368 1,150
2015 245 239 375 1,206
a Categories not mutually exclusive, nor exhaustive.
b Single vehicle run-off road excludes South Australia.
c Includes all other crash types.
Source National Crash Database
Figure 1.9 Deaths from common crash sub-typesa
Figure 1.7
a Categories not mutually exclusive, nor exhaustive.
b Single vehicle run-off road excludes South Australia.
Source National Crash Database
0
100
200
300
400
500
600
An
nu
al d
eath
s
Single vehicle run-off road b
Intersection
Head-on
• 15 •
BITRE • Road trauma Australia 2016 statistical summary
Table 1.9 Hospitalised injuries – by road user and age group
Motor- Pedal All road
cyclistsa
cyclistsa
usersb
All ages
2008 1 10,525 5,122 2,737 7,987 5,096 33,524
2009 2 10,538 5,344 2,770 8,039 5,255 33,692
2010 3 10,713 5,041 2,833 7,373 5,239 32,775
2011 4 11,601 5,175 2,760 7,571 5,393 34,082
2012c 5 11,424 5,067 2,689 7,734 5,623 34,091
2013c 6 11,550 5,131 2,672 8,022 6,269 35,059
2014c
11,687 5,015 2,562 8,335 6,642 35,552
0 –16 years
2008 91 987 443 804 1,736 4,255
2009 120 1,035 498 685 1,431 3,924
2010 113 933 488 544 1,205 3,401
2011 73 938 537 501 1,065 3,240
2012c 62 909 457 525 1,030 3,077
2013c 68 935 429 508 1,065 3,115
2014c
56 839 398 487 1,100 2,960
17 –25 years
2008 2,944 1,578 607 2,182 620 8,466
2009 2,823 1,642 534 2,090 691 8,229
2010 2,779 1,545 546 1,881 725 7,852
2011 2,988 1,511 532 2,043 668 8,098
2012c 2,898 1,440 502 2,078 731 8,037
2013c 2,828 1,378 495 2,084 778 7,852
2014c
2,760 1,385 431 2,104 763 7,728
26 –39 years
2008 2,758 899 510 2,488 1,092 8,221
2009 2,725 939 543 2,519 1,149 8,297
2010 2,783 841 535 2,267 1,217 8,016
2011 2,962 871 468 2,175 1,314 8,172
2012c 2,911 940 514 2,240 1,317 8,252
2013c 2,998 930 482 2,268 1,476 8,472
2014c
2,967 877 476 2,412 1,626 8,666
Drivers Passengers Pedestrians
• 16 •
Section 1 • People
• 17 •
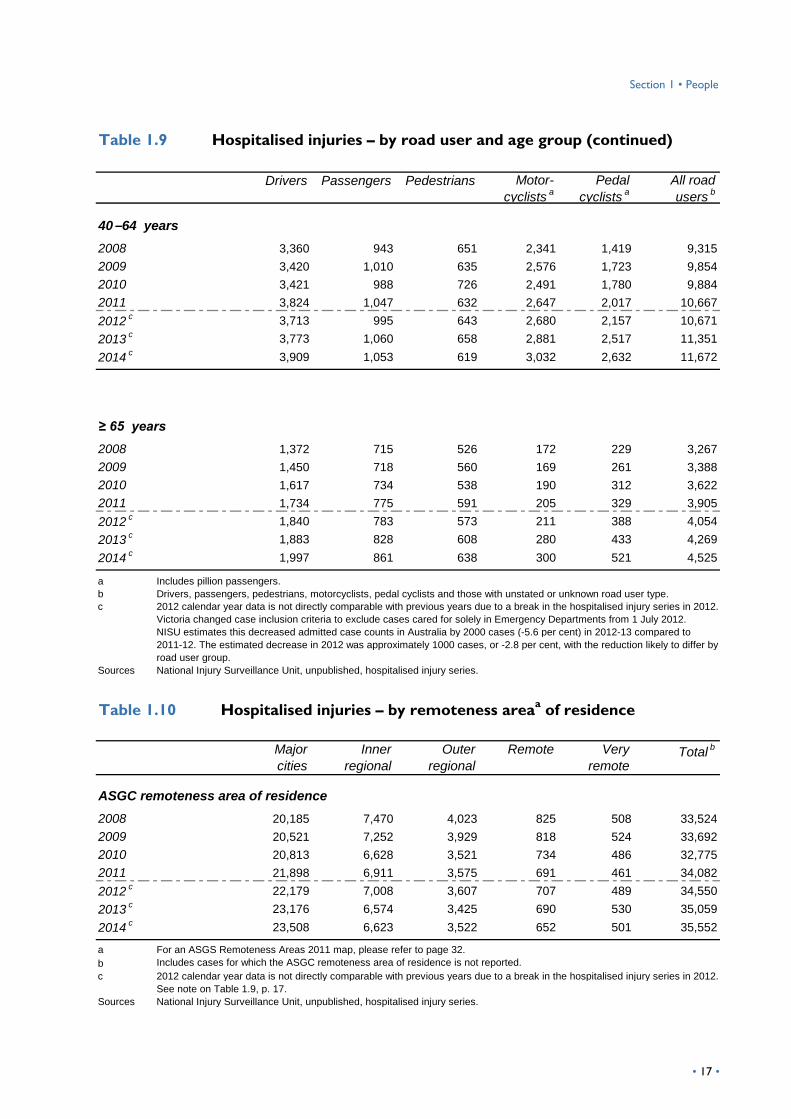
Table 1.9 Hospitalised injuries – by road user and age group (continued)
Motor- Pedal All roadcyclists a cyclists a users b
40 –64 years2008 1 3,360 943 651 2,341 1,419 9,315
2009 2 3,420 1,010 635 2,576 1,723 9,854
2010 3 3,421 988 726 2,491 1,780 9,884
2011 4 3,824 1,047 632 2,647 2,017 10,667
2012 c 5 3,713 995 643 2,680 2,157 10,671
2013 c 6 3,773 1,060 658 2,881 2,517 11,351
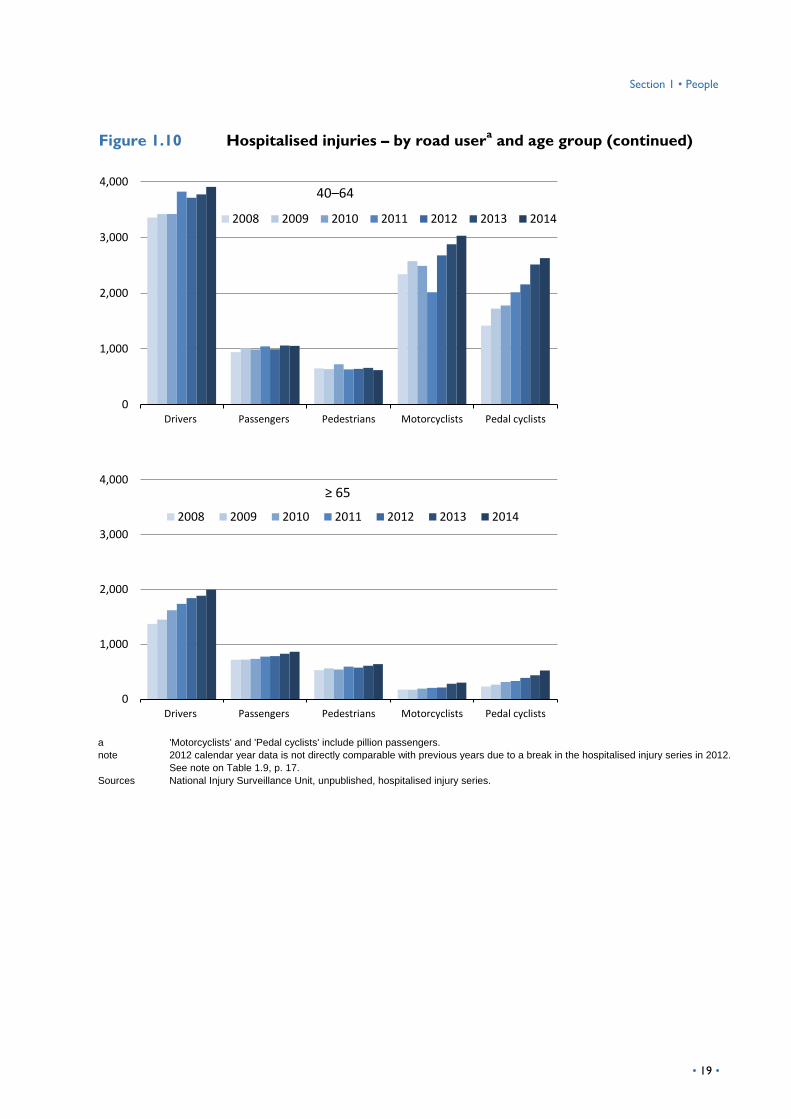
2014 c3,909 1,053 619 3,032 2,632 11,672
≥ 65 years2008 1,372 715 526 172 229 3,267
2009 1,450 718 560 169 261 3,388
2010 1,617 734 538 190 312 3,622
2011 1,734 775 591 205 329 3,905
2012 c 1,840 783 573 211 388 4,054
2013 c 1,883 828 608 280 433 4,269
2014 c1,997 861 638 300 521 4,525
a Includes pillion passengers.
b Drivers, passengers, pedestrians, motorcyclists, pedal cyclists and those with unstated or unknown road user type.
c 2012 calendar year data is not directly comparable with previous years due to a break in the hospitalised injury series in 2012.
Victoria changed case inclusion criteria to exclude cases cared for solely in Emergency Departments from 1 July 2012.
NISU estimates this decreased admitted case counts in Australia by 2000 cases (-5.6 per cent) in 2012-13 compared to
2011-12. The estimated decrease in 2012 was approximately 1000 cases, or -2.8 per cent, with the reduction likely to differ by
road user group.
Sources National Injury Surveillance Unit, unpublished, hospitalised injury series.
Table 1.10 Hospitalised injuries – by remoteness areaa of residence
Major cities
Inner regional
Outer regional
Remote Very remote
Total b
ASGC remoteness area of residence2008 20,185 7,470 4,023 825 508 33,524
2009 20,521 7,252 3,929 818 524 33,692
2010 20,813 6,628 3,521 734 486 32,775
2011 21,898 6,911 3,575 691 461 34,082
2012 c 22,179 7,008 3,607 707 489 34,550
2013 c 23,176 6,574 3,425 690 530 35,059
2014 c23,508 6,623 3,522 652 501 35,552
a For an ASGS Remoteness Areas 2011 map, please refer to page 32.
b Includes cases for which the ASGC remoteness area of residence is not reported.
c 2012 calendar year data is not directly comparable with previous years due to a break in the hospitalised injury series in 2012.
See note on Table 1.9, p. 17.
Sources National Injury Surveillance Unit, unpublished, hospitalised injury series.
Drivers Passengers Pedestrians
BITRE • Road trauma Australia 2016 statistical summary
Figure 1.10 Hospitalised injuries – by road usera and age group
Figure 1.10
0
1,000
2,000
3,000
4,000
Drivers Passengers Pedestrians Motorcyclists Pedal cyclists
0–16
2008 2009 2010 2011 2012 2013 2014
0
1,000
2,000
3,000
4,000
Drivers Passengers Pedestrians Motorcyclists Pedal cyclists
17–25
2008 2009 2010 2011 2012 2013 2014
0
1,000
2,000
3,000
4,000
Drivers Passengers Pedestrians Motorcyclists Pedal cyclists
26–39
2008 2009 2010 2011 2012 2013 2014
0-16
Drivers
Passengers
Pedestrians
17 – 25 years
Drivers
Passengers
a 'Motorcyclists' and 'Pedal cyclists' include pillion passengers.
hhh• 18 •
Section 1 • People
Figure 1.10 Hospitalised injuries – by road usera and age group (continued)
Figure 1.10
2012
0-16
Drivers
Passengers
Pedestrians
17 – 25 years
a 'Motorcyclists' and 'Pedal cyclists' include pillion passengers.
note 2012 calendar year data is not directly comparable with previous years due to a break in the hospitalised injury series in 2012.
See note on Table 1.9, p. 17.
Sources National Injury Surveillance Unit, unpublished, hospitalised injury series.
2014
65 years plus
0
1,000
2,000
3,000
4,000
Drivers Passengers Pedestrians Motorcyclists Pedal cyclists
40–64
2008 2009 2010 2011 2012 2013 2014
0
1,000
2,000
3,000
4,000
Drivers Passengers Pedestrians Motorcyclists Pedal cyclists
≥ 65
2008 2009 2010 2011 2012 2013 2014
• 19 •
BITRE • Road trauma Australia 2016 statistical summary
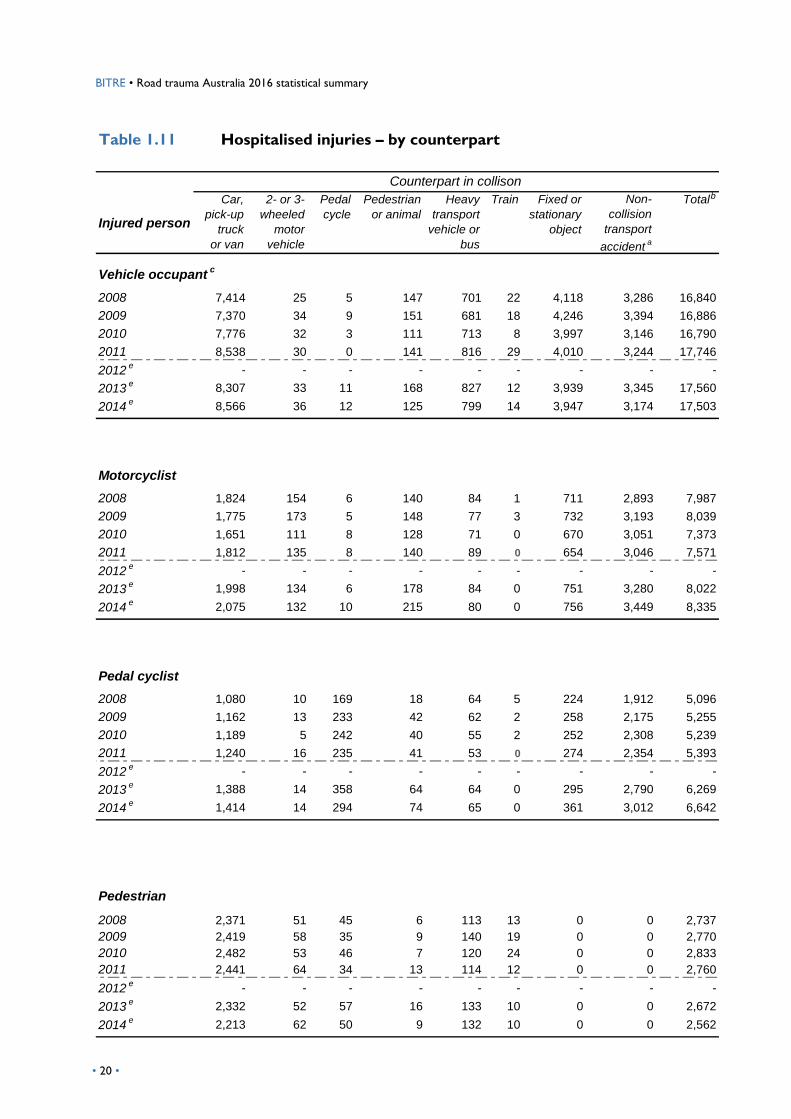
Table 1.11 Hospitalised injuries – by counterpart
Injured person
Car,
pick-up
truck
or van
2- or 3-
wheeled
motor
vehicle
Pedal
cycle
Pedestrian
or animal
Heavy
transport
vehicle or
bus
Train Fixed or
stationary
object
Non-
collision
transport
accidenta
Total l
Vehicle occupantc
2008 7,414 25 5 147 701 22 4,118 3,286 16,840
2009 7,370 34 9 151 681 18 4,246 3,394 16,886
2010 7,776 32 3 111 713 8 3,997 3,146 16,790
2011 8,538 30 0 141 816 29 4,010 3,244 17,746
2012e - - - - - - - - -
2013e 8,307 33 11 168 827 12 3,939 3,345 17,560
2014e
8,566 36 12 125 799 14 3,947 3,174 17,503
Motorcyclist
2008 1,824 154 6 140 84 1 711 2,893 7,987
2009 1,775 173 5 148 77 3 732 3,193 8,039
2010 1,651 111 8 128 71 0 670 3,051 7,373
2011 1,812 135 8 140 89 0 654 3,046 7,571
2012e - - - - - - - - -
2013e 1,998 134 6 178 84 0 751 3,280 8,022
2014e
2,075 132 10 215 80 0 756 3,449 8,335
Pedal cyclist
2008 1,080 10 169 18 64 5 224 1,912 5,096
2009 1,162 13 233 42 62 2 258 2,175 5,255
2010 1,189 5 242 40 55 2 252 2,308 5,239
2011 1,240 16 235 41 53 0 274 2,354 5,393
2012e - - - - - - - - -
2013e 1,388 14 358 64 64 0 295 2,790 6,269
2014e
1,414 14 294 74 65 0 361 3,012 6,642
Pedestrian
2008 2,371 51 45 6 113 13 0 0 2,737
2009 2,419 58 35 9 140 19 0 0 2,770
2010 2,482 53 46 7 120 24 0 0 2,833
2011 2,441 64 34 13 114 12 0 0 2,760
2012e
- - - - - - - - -
2013e
2,332 52 57 16 133 10 0 0 2,672
2014e
2,213 62 50 9 132 10 0 0 2,562
Counterpart in collisonb
• 20 •
Section 1 • People
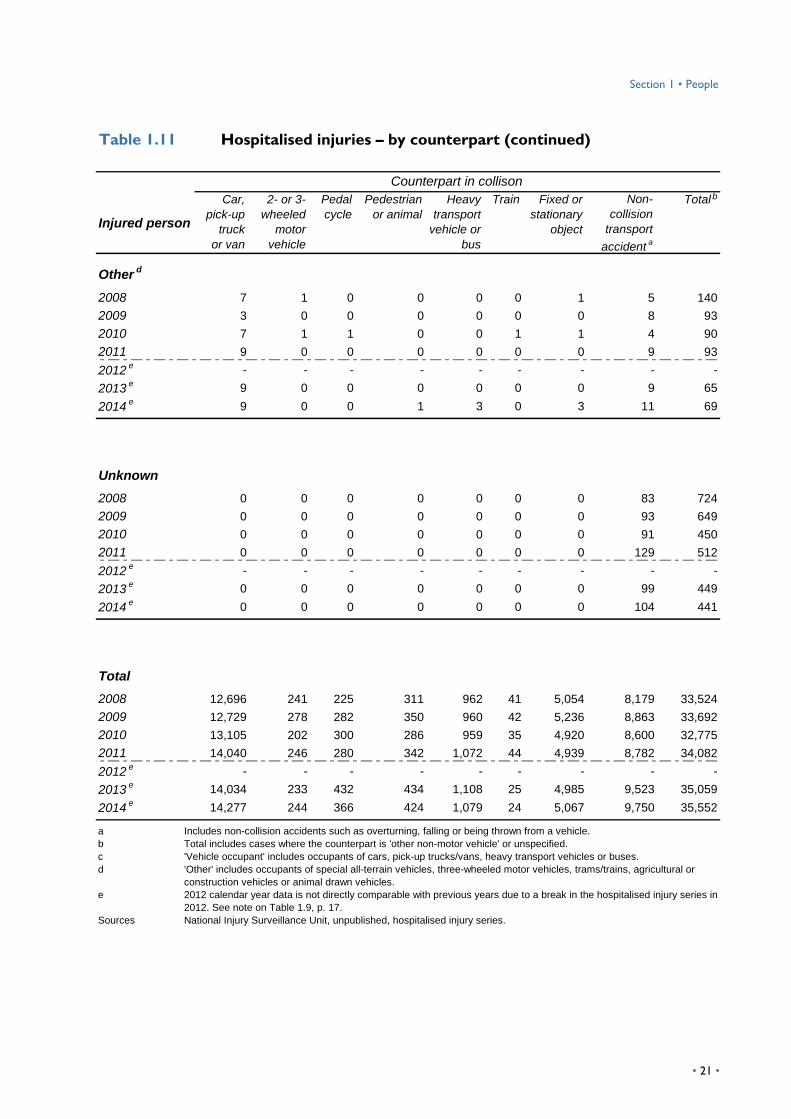
Table 1.11 Hospitalised injuries – by counterpart (continued)
Injured person
Car,
pick-up
truck
or van
2- or 3-
wheeled
motor
vehicle
Pedal
cycle
Pedestrian
or animal
Heavy
transport
vehicle or
bus
Train Fixed or
stationary
object
Non-
collision
transport
accidenta
Total l
Otherd
2008 7 1 0 0 0 0 1 5 140
2009 3 0 0 0 0 0 0 8 93
2010 7 1 1 0 0 1 1 4 90
2011 9 0 0 0 0 0 0 9 93
2012e - - - - - - - - -
2013e 9 0 0 0 0 0 0 9 65
2014e
9 0 0 1 3 0 3 11 69
Unknown
2008 0 0 0 0 0 0 0 83 724
2009 0 0 0 0 0 0 0 93 649
2010 0 0 0 0 0 0 0 91 450
2011 0 0 0 0 0 0 0 129 512
2012e - - - - - - - - -
2013e 0 0 0 0 0 0 0 99 449
2014e
0 0 0 0 0 0 0 104 441
Total
2008 12,696 241 225 311 962 41 5,054 8,179 33,524
2009 12,729 278 282 350 960 42 5,236 8,863 33,692
2010 13,105 202 300 286 959 35 4,920 8,600 32,775
2011 14,040 246 280 342 1,072 44 4,939 8,782 34,082
2012e - - - - - - - - -
2013e 14,034 233 432 434 1,108 25 4,985 9,523 35,059
2014e
14,277 244 366 424 1,079 24 5,067 9,750 35,552
a Includes non-collision accidents such as overturning, falling or being thrown from a vehicle.
b Total includes cases where the counterpart is 'other non-motor vehicle' or unspecified.
c 'Vehicle occupant' includes occupants of cars, pick-up trucks/vans, heavy transport vehicles or buses.
d 'Other' includes occupants of special all-terrain vehicles, three-wheeled motor vehicles, trams/trains, agricultural or
construction vehicles or animal drawn vehicles.
e 2012 calendar year data is not directly comparable with previous years due to a break in the hospitalised injury series in
2012. See note on Table 1.9, p. 17.
Sources National Injury Surveillance Unit, unpublished, hospitalised injury series.
Counterpart in collisonb
• 21 •
BITRE • Road trauma Australia 2016 statistical summary
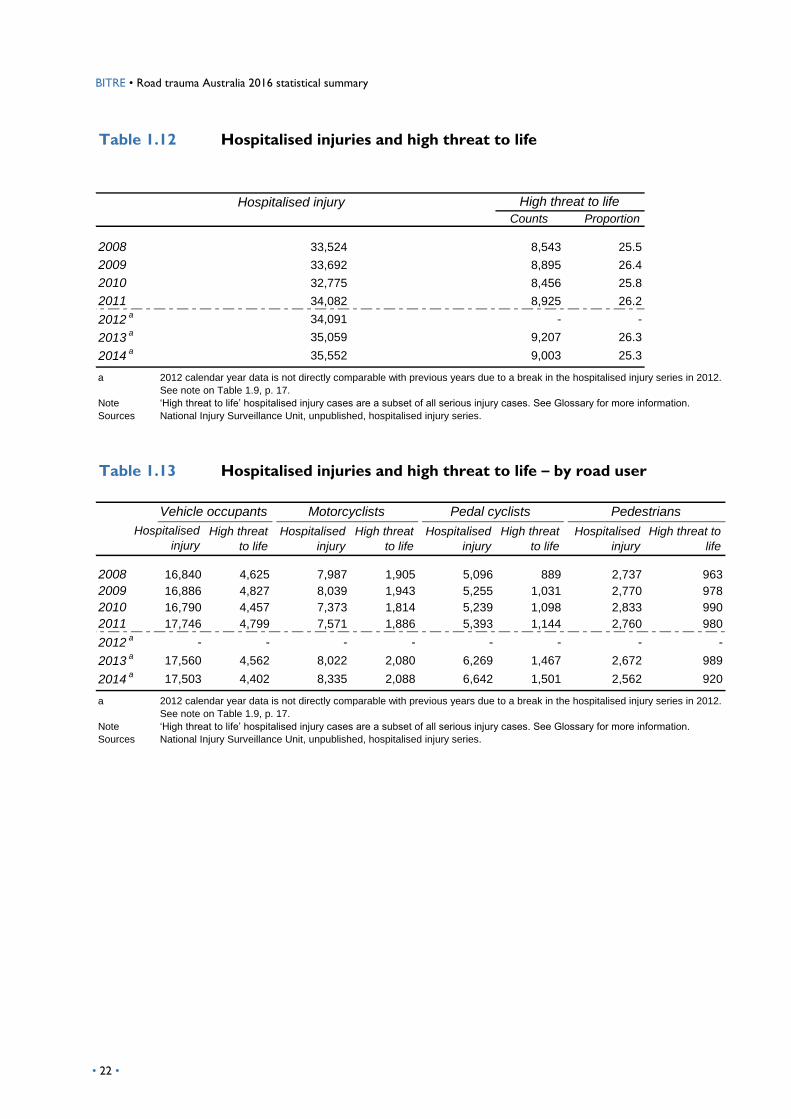
Table 1.12 Hospitalised injuries and high threat to life
Hospitalised injury
Counts Proportion
2008 33,524 8,543 25.5
2009 33,692 8,895 26.4
2010 32,775 8,456 25.8
2011 34,082 8,925 26.2
2012a 34,091 - -
2013a 35,059 9,207 26.3
2014a
35,552 9,003 25.30.0
a 2012 calendar year data is not directly comparable with previous years due to a break in the hospitalised injury series in 2012.
See note on Table 1.9, p. 17.
Note ‘High threat to life’ hospitalised injury cases are a subset of all serious injury cases. See Glossary for more information.
Sources National Injury Surveillance Unit, unpublished, hospitalised injury series.
Table 1.13 Hospitalised injuries and high threat to life – by road user
High threat
to life
Hospitalised
injury
High threat
to life
Hospitalised
injury
High threat
to life
Hospitalised
injury
High threat to
life
2008 16,840 4,625 7,987 1,905 5,096 889 2,737 963
2009 16,886 4,827 8,039 1,943 5,255 1,031 2,770 978
2010 16,790 4,457 7,373 1,814 5,239 1,098 2,833 990
2011 17,746 4,799 7,571 1,886 5,393 1,144 2,760 980
2012a
- - - - - - - -
2013a
17,560 4,562 8,022 2,080 6,269 1,467 2,672 989
2014a
17,503 4,402 8,335 2,088 6,642 1,501 2,562 920
a 2012 calendar year data is not directly comparable with previous years due to a break in the hospitalised injury series in 2012.
See note on Table 1.9, p. 17.
Note ‘High threat to life’ hospitalised injury cases are a subset of all serious injury cases. See Glossary for more information.
Sources National Injury Surveillance Unit, unpublished, hospitalised injury series.
High threat to life
Hospitalised
injury
Vehicle occupants Motorcyclists Pedal cyclists Pedestrians
• 22 •
• 23 •
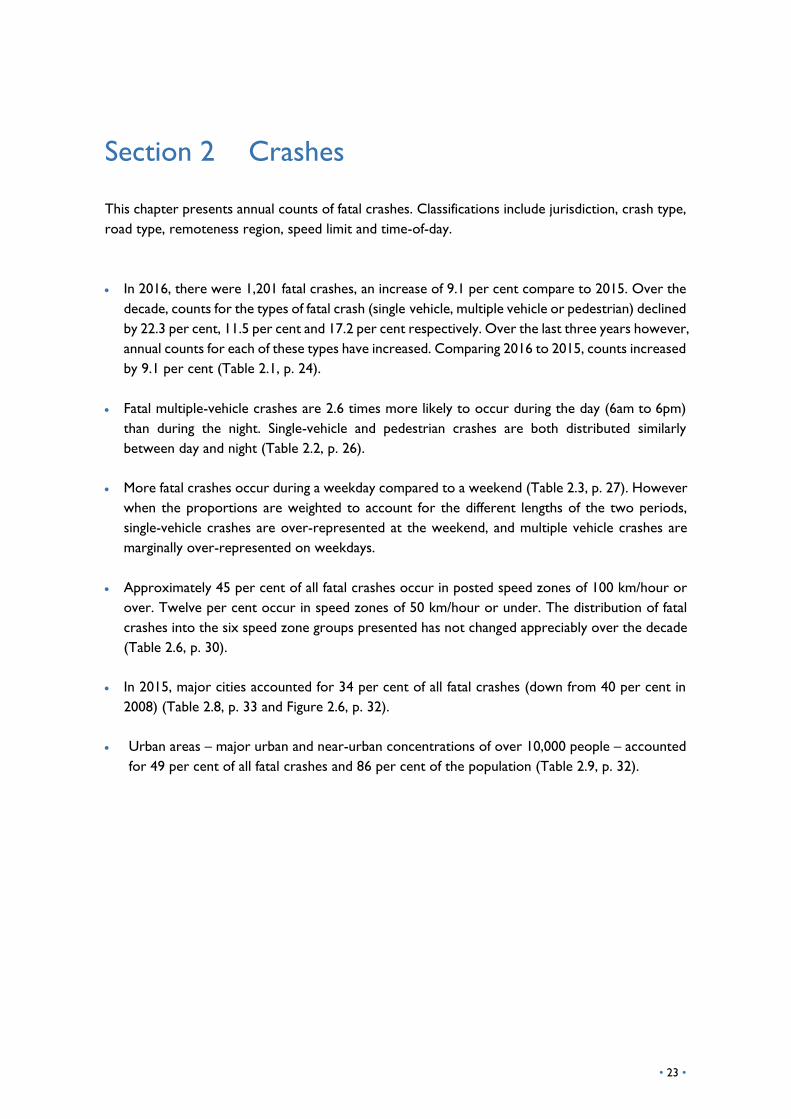
Section 2 Crashes
This chapter presents annual counts of fatal crashes. Classifications include jurisdiction, crash type,
road type, remoteness region, speed limit and time-of-day.
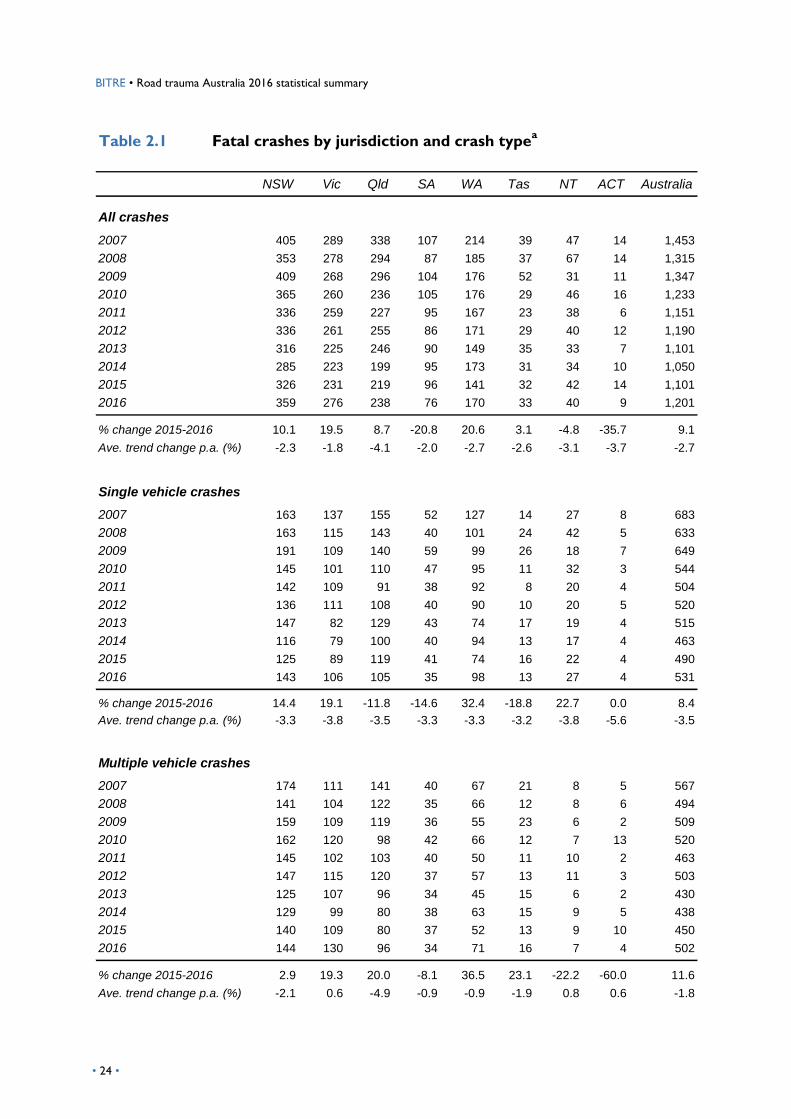
In 2016, there were 1,201 fatal crashes, an increase of 9.1 per cent compare to 2015. Over the
decade, counts for the types of fatal crash (single vehicle, multiple vehicle or pedestrian) declined
by 22.3 per cent, 11.5 per cent and 17.2 per cent respectively. Over the last three years however,
annual counts for each of these types have increased. Comparing 2016 to 2015, counts increased
by 9.1 per cent (Table 2.1, p. 24).
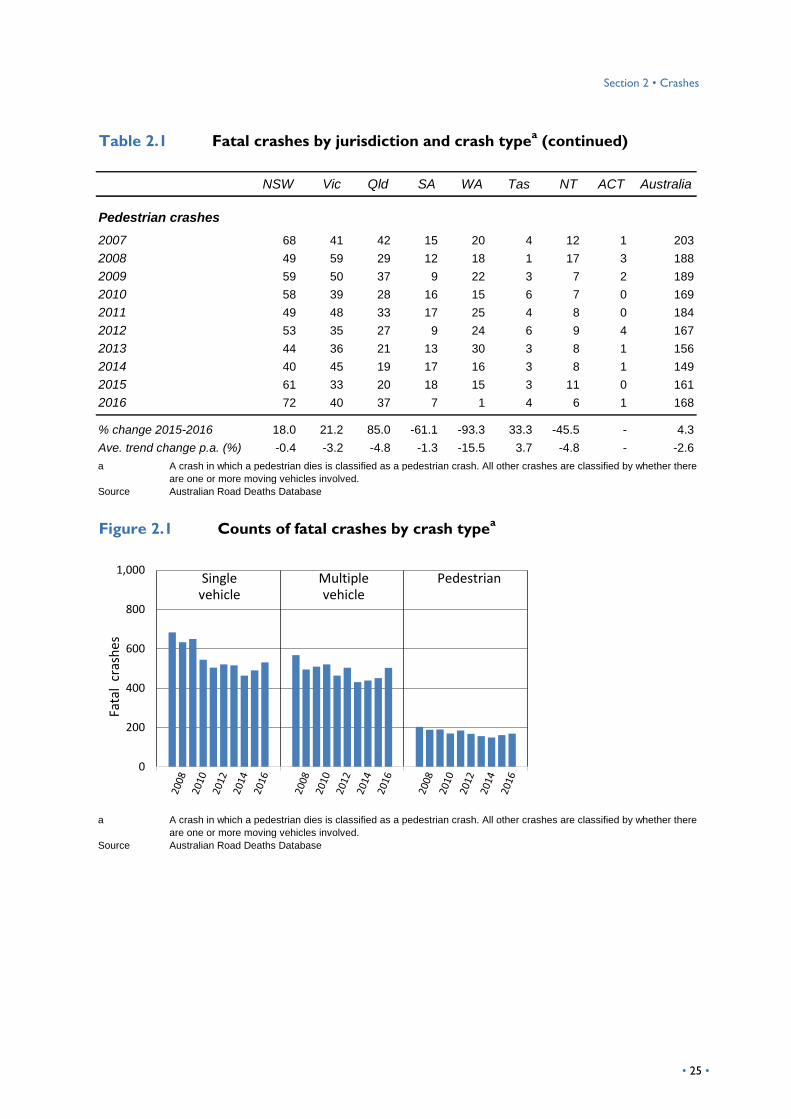
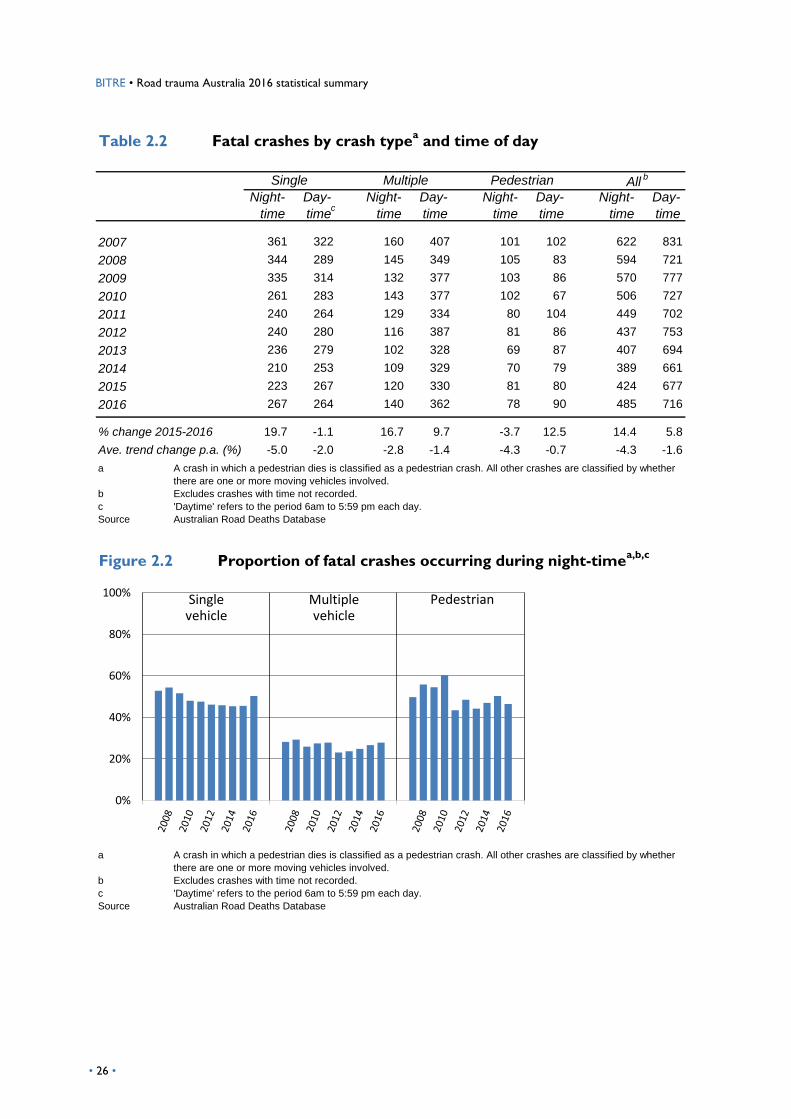
Fatal multiple-vehicle crashes are 2.6 times more likely to occur during the day (6am to 6pm)
than during the night. Single-vehicle and pedestrian crashes are both distributed similarly
between day and night (Table 2.2, p. 26).
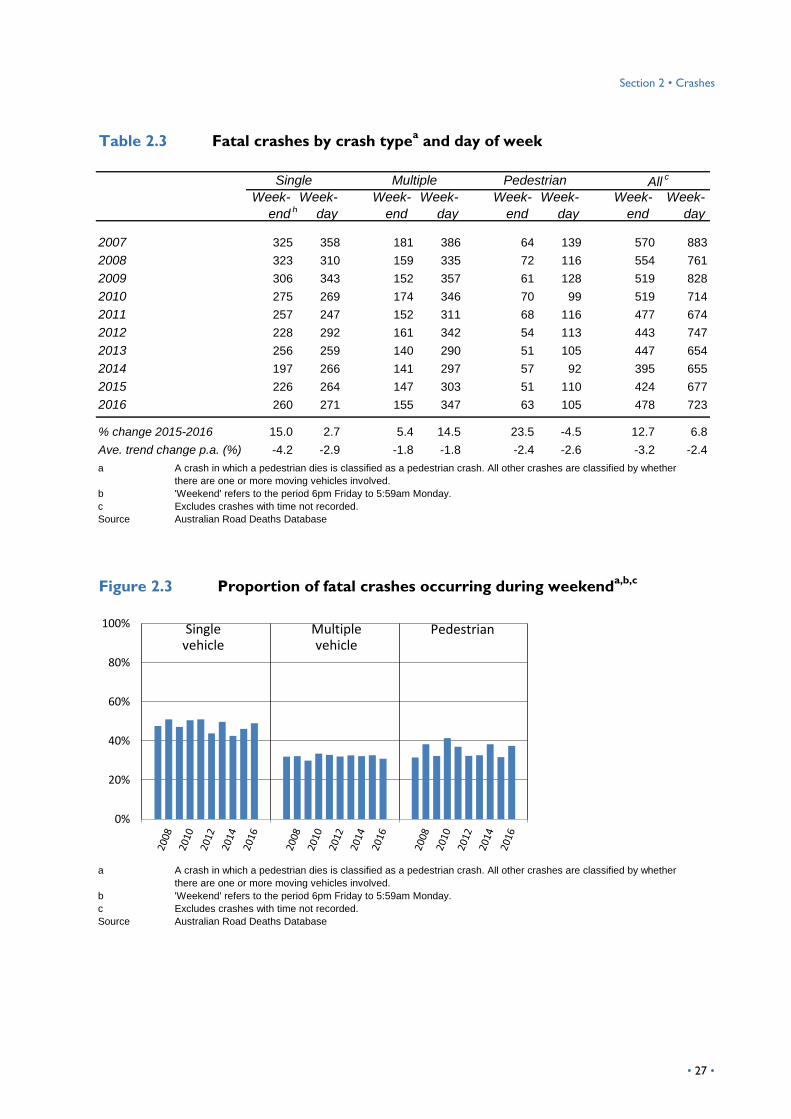
More fatal crashes occur during a weekday compared to a weekend (Table 2.3, p. 27). However
when the proportions are weighted to account for the different lengths of the two periods,
single-vehicle crashes are over-represented at the weekend, and multiple vehicle crashes are
marginally over-represented on weekdays.
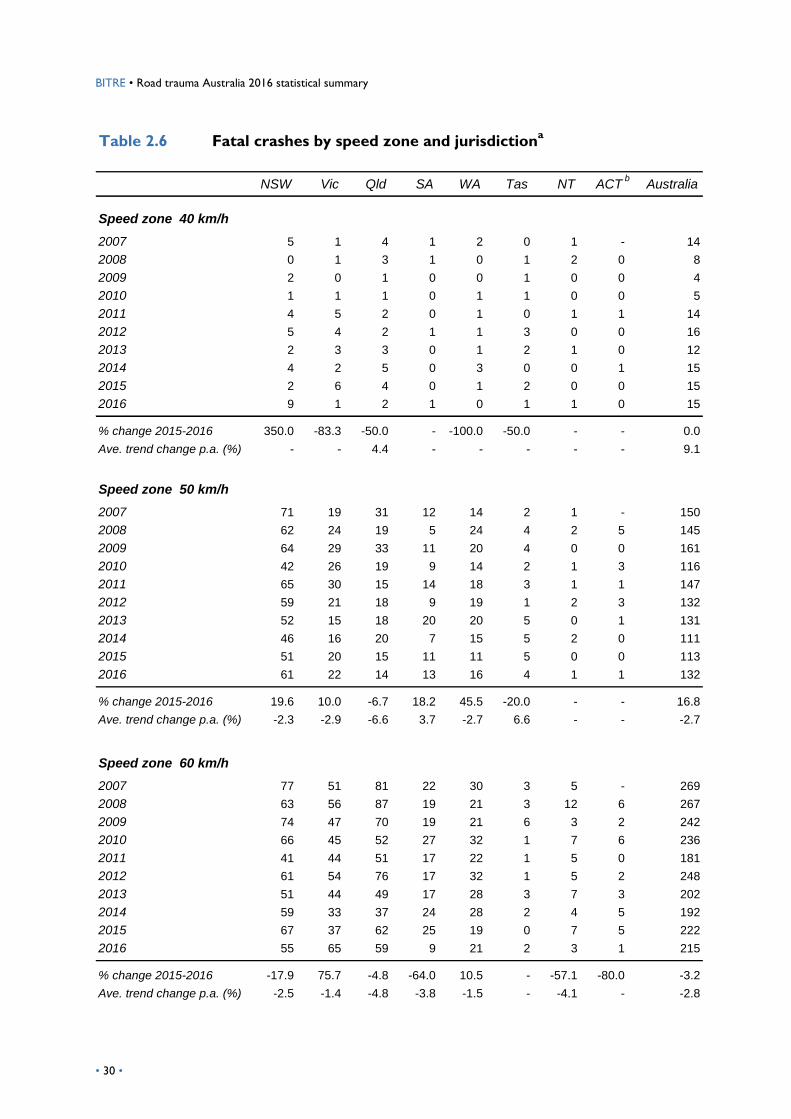
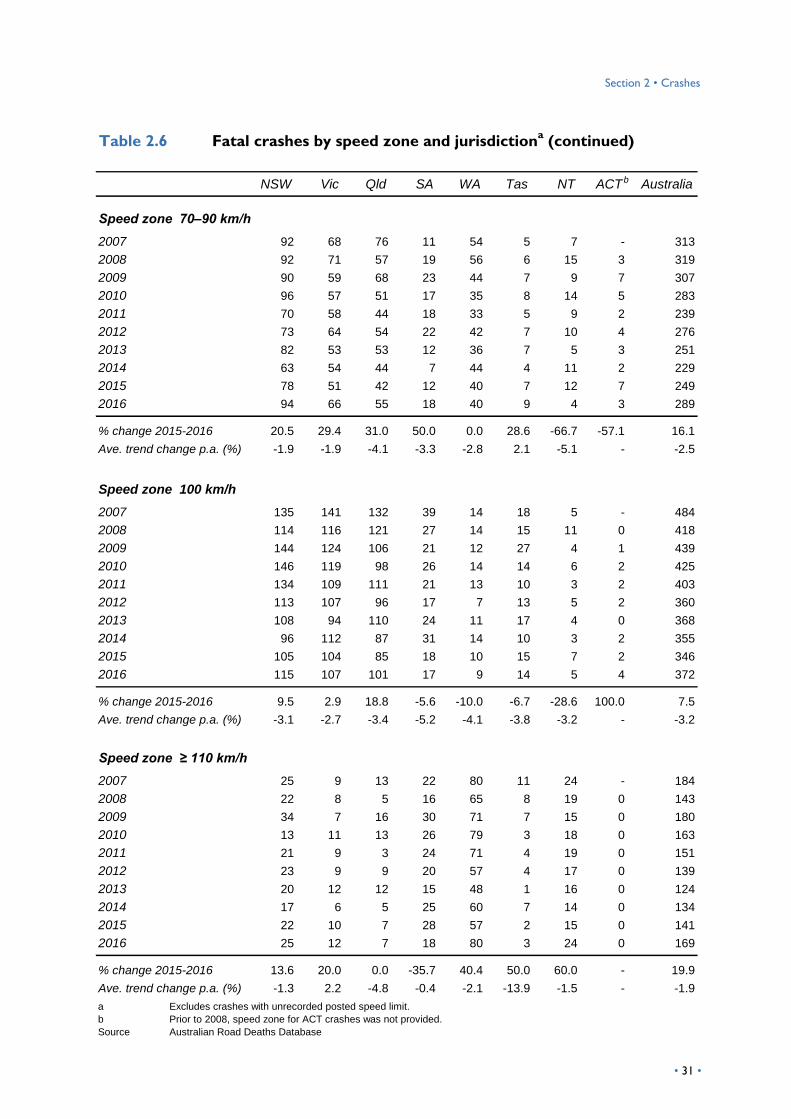
Approximately 45 per cent of all fatal crashes occur in posted speed zones of 100 km/hour or
over. Twelve per cent occur in speed zones of 50 km/hour or under. The distribution of fatal
crashes into the six speed zone groups presented has not changed appreciably over the decade
(Table 2.6, p. 30).
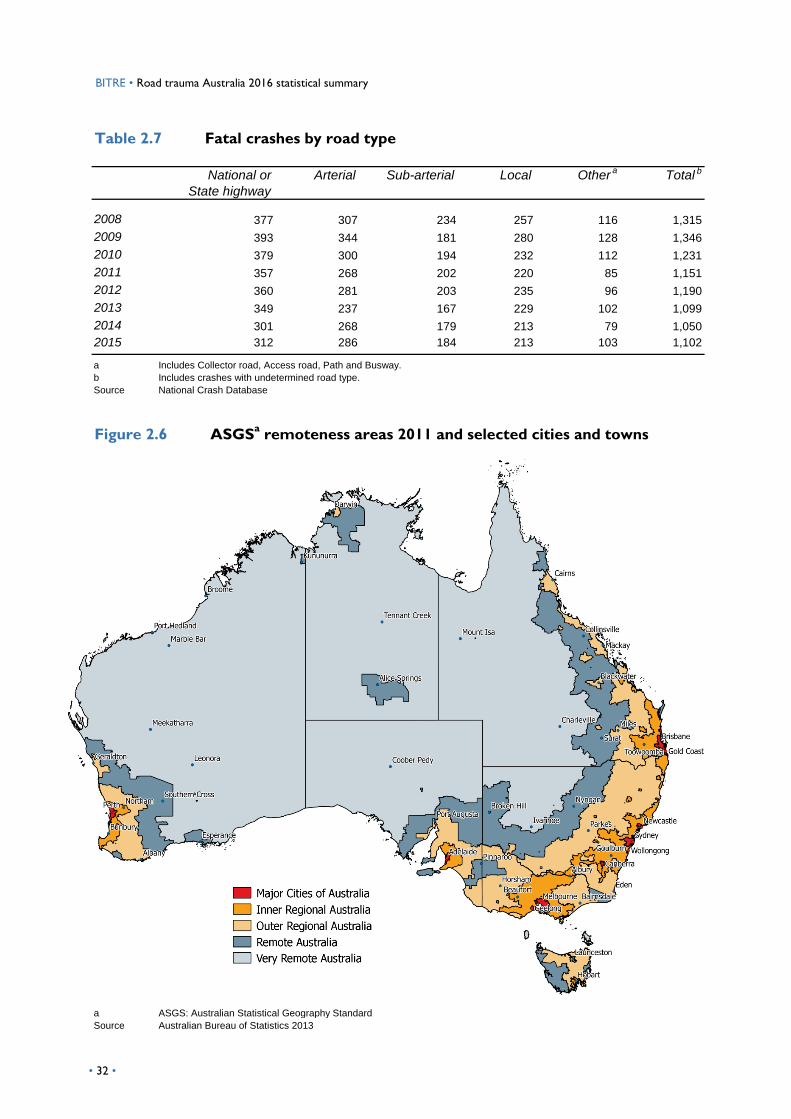
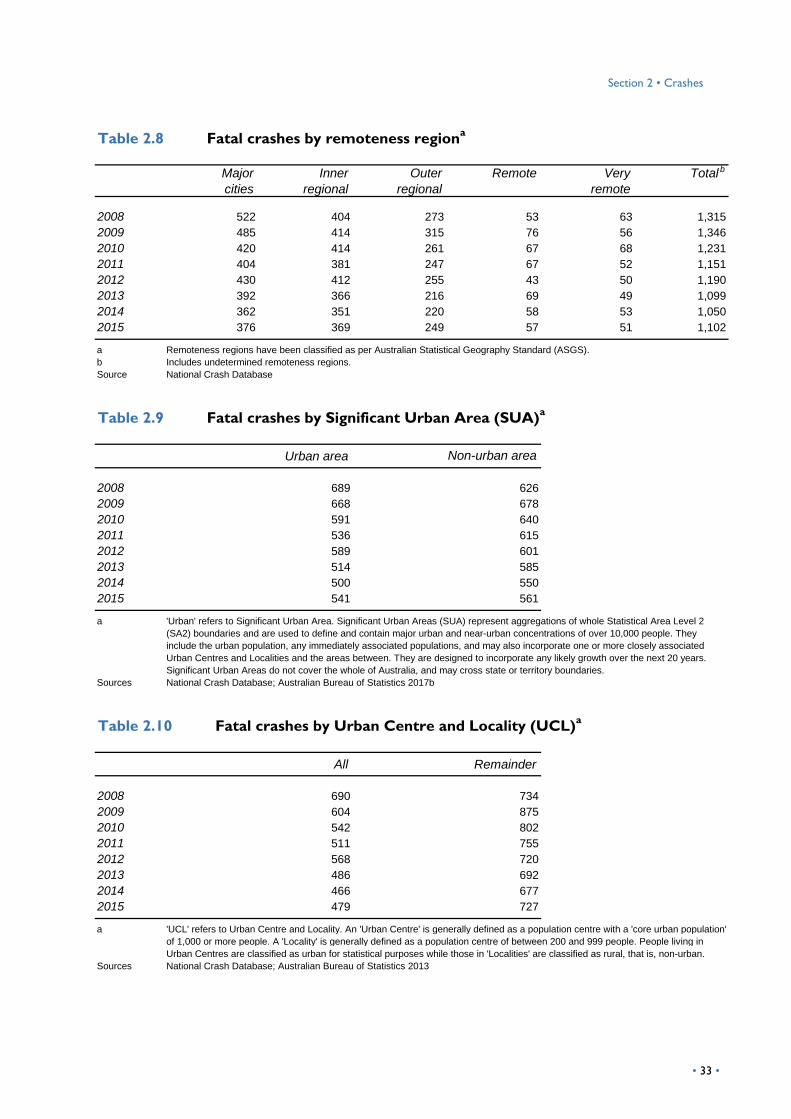
In 2015, major cities accounted for 34 per cent of all fatal crashes (down from 40 per cent in
2008) (Table 2.8, p. 33 and Figure 2.6, p. 32).
Urban areas – major urban and near-urban concentrations of over 10,000 people – accounted
for 49 per cent of all fatal crashes and 86 per cent of the population (Table 2.9, p. 32).
BITRE • Road trauma Australia 2016 statistical summary
Table 2.1 Fatal crashes by jurisdiction and crash typea
NSW Vic Qld SA WA Tas NT ACT Australia
All crashes
2007 405 289 338 107 214 39 47 14 1,453
2008 353 278 294 87 185 37 67 14 1,315
2009 409 268 296 104 176 52 31 11 1,347
2010 365 260 236 105 176 29 46 16 1,233
2011 336 259 227 95 167 23 38 6 1,151
2012 336 261 255 86 171 29 40 12 1,190
2013 316 225 246 90 149 35 33 7 1,101
2014 285 223 199 95 173 31 34 10 1,050
2015 326 231 219 96 141 32 42 14 1,101
2016 359 276 238 76 170 33 40 9 1,201
% change 2015-2016 10.1 19.5 8.7 -20.8 20.6 3.1 -4.8 -35.7 9.1
Ave. trend change p.a. (%) -2.3 -1.8 -4.1 -2.0 -2.7 -2.6 -3.1 -3.7 -2.7
Single vehicle crashes
2007 163 137 155 52 127 14 27 8 683
2008 163 115 143 40 101 24 42 5 633
2009 191 109 140 59 99 26 18 7 649
2010 145 101 110 47 95 11 32 3 544
2011 142 109 91 38 92 8 20 4 504
2012 136 111 108 40 90 10 20 5 520
2013 147 82 129 43 74 17 19 4 515
2014 116 79 100 40 94 13 17 4 463
2015 125 89 119 41 74 16 22 4 490
2016 143 106 105 35 98 13 27 4 531
% change 2015-2016 14.4 19.1 -11.8 -14.6 32.4 -18.8 22.7 0.0 8.4
Ave. trend change p.a. (%) -3.3 -3.8 -3.5 -3.3 -3.3 -3.2 -3.8 -5.6 -3.5
Multiple vehicle crashes
2007 174 111 141 40 67 21 8 5 567
2008 141 104 122 35 66 12 8 6 494
2009 159 109 119 36 55 23 6 2 509
2010 162 120 98 42 66 12 7 13 520
2011 145 102 103 40 50 11 10 2 463
2012 147 115 120 37 57 13 11 3 503
2013 125 107 96 34 45 15 6 2 430
2014 129 99 80 38 63 15 9 5 438
2015 140 109 80 37 52 13 9 10 450
2016 144 130 96 34 71 16 7 4 502
% change 2015-2016 2.9 19.3 20.0 -8.1 36.5 23.1 -22.2 -60.0 11.6
Ave. trend change p.a. (%) -2.1 0.6 -4.9 -0.9 -0.9 -1.9 0.8 0.6 -1.8
• 24 •
Section 2 • Crashesgggg
Table 2.1 Fatal crashes by jurisdiction and crash typea (continued)
NSW Vic Qld SA WA Tas NT ACT Australia
Pedestrian crashes
2007 68 41 42 15 20 4 12 1 203
2008 49 59 29 12 18 1 17 3 188
2009 59 50 37 9 22 3 7 2 189
2010 58 39 28 16 15 6 7 0 169
2011 49 48 33 17 25 4 8 0 184
2012 53 35 27 9 24 6 9 4 167
2013 44 36 21 13 30 3 8 1 156
2014 40 45 19 17 16 3 8 1 149
2015 61 33 20 18 15 3 11 0 161
2016 72 40 37 7 1 4 6 1 168
% change 2015-2016 18.0 21.2 85.0 -61.1 -93.3 33.3 -45.5 - 4.3
Ave. trend change p.a. (%) -0.4 -3.2 -4.8 -1.3 -15.5 3.7 -4.8 - -2.6
a A crash in which a pedestrian dies is classified as a pedestrian crash. All other crashes are classified by whether there
are one or more moving vehicles involved.
Source Australian Road Deaths Database
Figure 2.1 Counts of fatal crashes by crash typea
a A crash in which a pedestrian dies is classified as a pedestrian crash. All other crashes are classified by whether there
are one or more moving vehicles involved.
Source Australian Road Deaths Database
0
200
400
600
800
1,000
Fata
l cr
ash
es
Single vehicle
Multiple vehicle
Pedestrian vehicle
• 25 •gg
BITRE • Road trauma Australia 2016 statistical summary
Table 2.2 Fatal crashes by crash typea and time of day
Night- Day- Night- Day- Night- Day- Night- Day-
time time time time time time time time
2007 361 322 160 407 101 102 622 831
2008 344 289 145 349 105 83 594 721
2009 335 314 132 377 103 86 570 777
2010 261 283 143 377 102 67 506 727
2011 240 264 129 334 80 104 449 702
2012 240 280 116 387 81 86 437 753
2013 236 279 102 328 69 87 407 694
2014 210 253 109 329 70 79 389 661
2015 223 267 120 330 81 80 424 677
2016 267 264 140 362 78 90 485 716
% change 2015-2016 19.7 -1.1 16.7 9.7 -3.7 12.5 14.4 5.8
Ave. trend change p.a. (%) -5.0 -2.0 -2.8 -1.4 -4.3 -0.7 -4.3 -1.6
a A crash in which a pedestrian dies is classified as a pedestrian crash. All other crashes are classified by whether
there are one or more moving vehicles involved.
b Excludes crashes with time not recorded.
c 'Daytime' refers to the period 6am to 5:59 pm each day.
Source Australian Road Deaths Database
Figure 2.2 Proportion of fatal crashes occurring during night-timea,b,c
a A crash in which a pedestrian dies is classified as a pedestrian crash. All other crashes are classified by whether
there are one or more moving vehicles involved.
b Excludes crashes with time not recorded.
c 'Daytime' refers to the period 6am to 5:59 pm each day.
Source Australian Road Deaths Database
Single Multiple Pedestrian Allb
0%
20%
40%
60%
80%
100%Single
vehicleMultiplevehicle
Pedestrian
c
• 26 •
Section 2 • Crashess
Table 2.3 Fatal crashes by crash typea and day of week
Week- Week- Week- Week- Week- Week- Week- Week-
end day end day end day end day
2007 325 358 181 386 64 139 570 883
2008 323 310 159 335 72 116 554 761
2009 306 343 152 357 61 128 519 828
2010 275 269 174 346 70 99 519 714
2011 257 247 152 311 68 116 477 674
2012 228 292 161 342 54 113 443 747
2013 256 259 140 290 51 105 447 654
2014 197 266 141 297 57 92 395 655
2015 226 264 147 303 51 110 424 677
2016 260 271 155 347 63 105 478 723
% change 2015-2016 15.0 2.7 5.4 14.5 23.5 -4.5 12.7 6.8
Ave. trend change p.a. (%) -4.2 -2.9 -1.8 -1.8 -2.4 -2.6 -3.2 -2.4
a A crash in which a pedestrian dies is classified as a pedestrian crash. All other crashes are classified by whether
there are one or more moving vehicles involved.
b 'Weekend' refers to the period 6pm Friday to 5:59am Monday.
c Excludes crashes with time not recorded.
Source Australian Road Deaths Database
Figure 2.3 Proportion of fatal crashes occurring during weekenda,b,c
a A crash in which a pedestrian dies is classified as a pedestrian crash. All other crashes are classified by whether
there are one or more moving vehicles involved.
b 'Weekend' refers to the period 6pm Friday to 5:59am Monday.
c Excludes crashes with time not recorded.
Source Australian Road Deaths Database
PedestrianSingle Multiple Allc
0%
20%
40%
60%
80%
100% Single vehicle
Multiplevehicle
Pedestrian
b
• 27 •g
BITRE • Road trauma Australia 2016 statistical summary
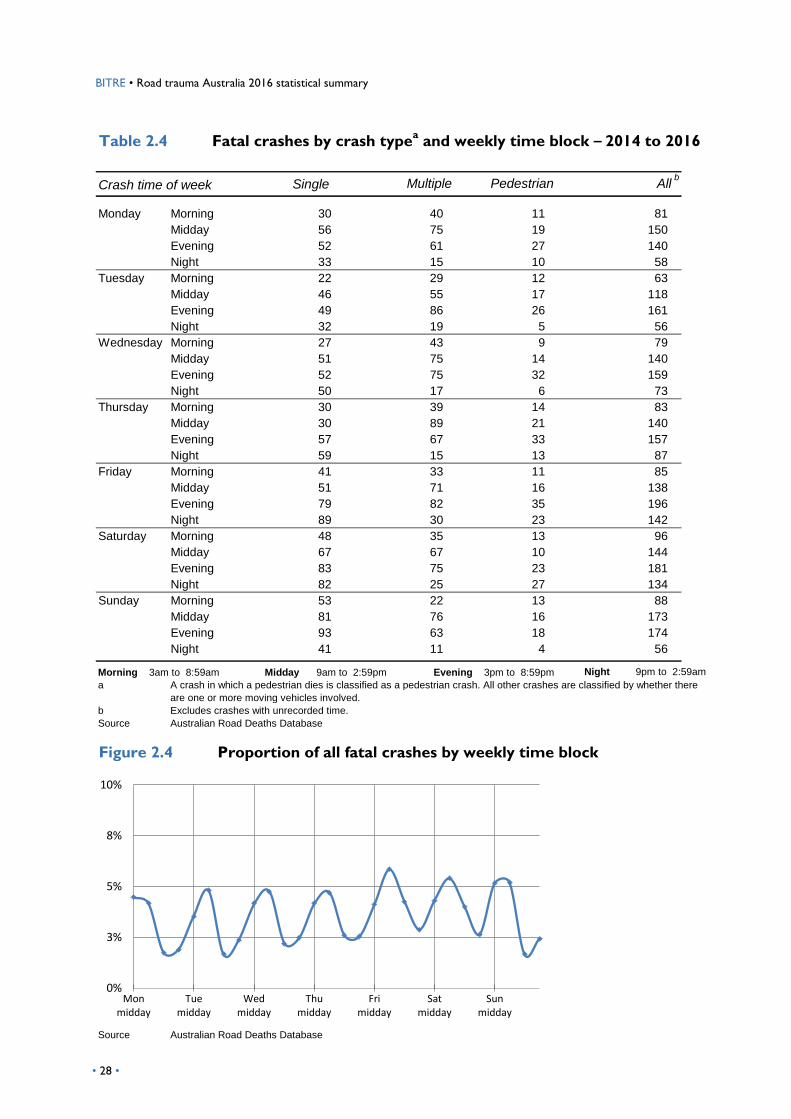
Table 2.4 Fatal crashes by crash typea and weekly time block – 2014 to 2016
Single
Monday Morning 30
Midday 56
Evening 52
Night 33
Tuesday Morning 22
Midday 46
Evening 49
Night 32
Wednesday Morning 27
Midday 51
Evening 52
Night 50
Thursday Morning 30
Midday 30
Evening 57
Night 59
Friday Morning 41
Midday 51
Evening 79
Night 89
Saturday Morning 48
Midday 67
Evening 83
Night 82
Sunday Morning 53
Midday 81
Evening 93
Night 41
Morning 3am to 8:59am Midday 9am to 2:59pm Evening 3pm to 8:59pm
a A crash in which a pedestrian dies is classified as a pedestrian crash. All other crashes are classified by whether there
are one or more moving vehicles involved.
b Excludes crashes with unrecorded time.
Source Australian Road Deaths Database
Figure 2.4 Proportion of all fatal crashes by weekly time block
0%
3%
5%
8%
10%
Monmidday
Tuemidday
Wedmidday
Thumidday
Frimidday
Satmidday
Sunmidday
Source Australian Road Deaths Database
Night 9pm to 2:59am
25
22
76
63
11
27
13
16
18
4
134
88
173
174
56
82
30
35
67
75
89
67
15
33
71
43
75
75
17
39
15
29
55
86
19
35
23
13
10
23
21
33
13
11
16
9
14
32
6
14
10
12
17
26
5
196
142
96
144
181
140
157
87
85
138
79
140
159
73
83
58
63
118
161
56
Crash time of weekb All l
81
150
140
Pedestrian
11
19
27
Multiple
40
75
61
b
• 28 •
Section 2 • Crashes
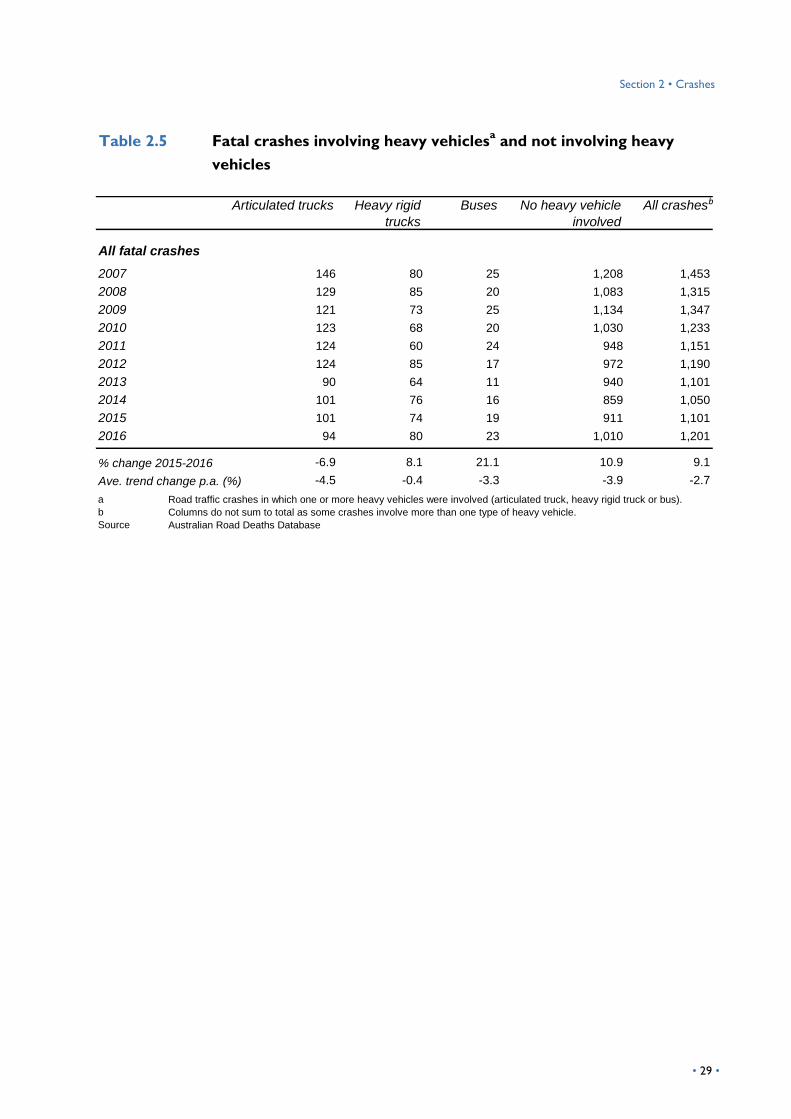
Table 2.5 Fatal crashes involving heavy vehiclesa and not involving heavy
Table 2.5 vehicles
Heavy rigid
trucks
Buses No heavy vehicle
involved
All crashes
All fatal crashes
2007 146 80 25 1,208 1,453
2008 129 85 20 1,083 1,315
2009 121 73 25 1,134 1,347
2010 123 68 20 1,030 1,233
2011 124 60 24 948 1,151
2012 124 85 17 972 1,190
2013 90 64 11 940 1,101
2014 101 76 16 859 1,050
2015 101 74 19 911 1,101
2016 94 80 23 1,010 1,201
% change 2015-2016 -6.9 8.1 21.1 10.9 9.1
Ave. trend change p.a. (%) -4.5 -0.4 -3.3 -3.9 -2.7
a Road traffic crashes in which one or more heavy vehicles were involved (articulated truck, heavy rigid truck or bus).
b Columns do not sum to total as some crashes involve more than one type of heavy vehicle.
Source Australian Road Deaths Database
Articulated trucks b
• 29 •
BITRE • Road trauma Australia 2016 statistical summary
Table 2.6 Fatal crashes by speed zone and jurisdictiona
NSW Vic Qld SA WA Tas NT ACT Australia
Speed zone 40 km/h
2007 5 1 4 1 2 0 1 - 14
2008 0 1 3 1 0 1 2 0 8
2009 2 0 1 0 0 1 0 0 4
2010 1 1 1 0 1 1 0 0 5
2011 4 5 2 0 1 0 1 1 14
2012 5 4 2 1 1 3 0 0 16
2013 2 3 3 0 1 2 1 0 12
2014 4 2 5 0 3 0 0 1 15
2015 2 6 4 0 1 2 0 0 15
2016 9 1 2 1 0 1 1 0 15
% change 2015-2016 350.0 -83.3 -50.0 - -100.0 -50.0 - - 0.0
Ave. trend change p.a. (%) - - 4.4 - - - - - 9.1
Speed zone 50 km/h
2007 71 19 31 12 14 2 1 - 150
2008 62 24 19 5 24 4 2 5 145
2009 64 29 33 11 20 4 0 0 161
2010 42 26 19 9 14 2 1 3 116
2011 65 30 15 14 18 3 1 1 147
2012 59 21 18 9 19 1 2 3 132
2013 52 15 18 20 20 5 0 1 131
2014 46 16 20 7 15 5 2 0 111
2015 51 20 15 11 11 5 0 0 113
2016 61 22 14 13 16 4 1 1 132-
% change 2015-2016 19.6 10.0 -6.7 18.2 45.5 -20.0 - - 16.8
Ave. trend change p.a. (%) -2.3 -2.9 -6.6 3.7 -2.7 6.6 - - -2.7
Speed zone 60 km/h
2007 77 51 81 22 30 3 5 - 269
2008 63 56 87 19 21 3 12 6 267
2009 74 47 70 19 21 6 3 2 242
2010 66 45 52 27 32 1 7 6 236
2011 41 44 51 17 22 1 5 0 181
2012 61 54 76 17 32 1 5 2 248
2013 51 44 49 17 28 3 7 3 202
2014 59 33 37 24 28 2 4 5 192
2015 67 37 62 25 19 0 7 5 222
2016 55 65 59 9 21 2 3 1 215
% change 2015-2016 -17.9 75.7 -4.8 -64.0 10.5 - -57.1 -80.0 -3.2
Ave. trend change p.a. (%) -2.5 -1.4 -4.8 -3.8 -1.5 - -4.1 - -2.8
b
• 30 •
Section 2 • Crashesfggff
Table 2.6 Fatal crashes by speed zone and jurisdictiona (continued)
NSW Vic Qld SA WA Tas NT ACT Australia
Speed zone 70–90 km/h
2007 92 68 76 11 54 5 7 - 313
2008 92 71 57 19 56 6 15 3 319
2009 90 59 68 23 44 7 9 7 307
2010 96 57 51 17 35 8 14 5 283
2011 70 58 44 18 33 5 9 2 239
2012 73 64 54 22 42 7 10 4 276
2013 82 53 53 12 36 7 5 3 251
2014 63 54 44 7 44 4 11 2 229
2015 78 51 42 12 40 7 12 7 249
2016 94 66 55 18 40 9 4 3 289
% change 2015-2016 20.5 29.4 31.0 50.0 0.0 28.6 -66.7 -57.1 16.1
Ave. trend change p.a. (%) -1.9 -1.9 -4.1 -3.3 -2.8 2.1 -5.1 - -2.5
Speed zone 100 km/h
2007 135 141 132 39 14 18 5 - 484
2008 114 116 121 27 14 15 11 0 418
2009 144 124 106 21 12 27 4 1 439
2010 146 119 98 26 14 14 6 2 425
2011 134 109 111 21 13 10 3 2 403
2012 113 107 96 17 7 13 5 2 360
2013 108 94 110 24 11 17 4 0 368
2014 96 112 87 31 14 10 3 2 355
2015 105 104 85 18 10 15 7 2 346
2016 115 107 101 17 9 14 5 4 372-
% change 2015-2016 9.5 2.9 18.8 -5.6 -10.0 -6.7 -28.6 100.0 7.5
Ave. trend change p.a. (%) -3.1 -2.7 -3.4 -5.2 -4.1 -3.8 -3.2 - -3.2
Speed zone ≥ 110 km/h
2007 25 9 13 22 80 11 24 - 184
2008 22 8 5 16 65 8 19 0 143
2009 34 7 16 30 71 7 15 0 180
2010 13 11 13 26 79 3 18 0 163
2011 21 9 3 24 71 4 19 0 151
2012 23 9 9 20 57 4 17 0 139
2013 20 12 12 15 48 1 16 0 124
2014 17 6 5 25 60 7 14 0 134
2015 22 10 7 28 57 2 15 0 141
2016 25 12 7 18 80 3 24 0 169
% change 2015-2016 13.6 20.0 0.0 -35.7 40.4 50.0 60.0 - 19.9
Ave. trend change p.a. (%) -1.3 2.2 -4.8 -0.4 -2.1 -13.9 -1.5 - -1.9
a Excludes crashes with unrecorded posted speed limit.
b Prior to 2008, speed zone for ACT crashes was not provided.
Source Australian Road Deaths Database
b
• 31 •hhh
BITRE • Road trauma Australia 2016 statistical summary
Table 2.7 Fatal crashes by road type
National or Arterial Sub-arterial Local Other i Total i
State highway
2008 377 307 234 257 116 1,315
2009 393 344 181 280 128 1,346
2010 379 300 194 232 112 1,231
2011 357 268 202 220 85 1,151
2012 360 281 203 235 96 1,190
2013 349 237 167 229 102 1,099
2014 301 268 179 213 79 1,050
2015 312 286 184 213 103 1,102
a Includes Collector road, Access road, Path and Busway.
b Includes crashes with undetermined road type.
Source National Crash Database
Figure 2.6 ASGSa remoteness areas 2011 and selected cities and towns
a ASGS: Australian Statistical Geography Standard
Source Australian Bureau of Statistics 2013
a b
• 32 •
Section 2 • Crashesfggf
Table 2.8 Fatal crashes by remoteness regiona
Major
cities
Inner
regional
Outer
regional
Remote Very
remote
Total i
2008 522 404 273 53 63 1,315
2009 485 414 315 76 56 1,346
2010 420 414 261 67 68 1,231
2011 404 381 247 67 52 1,151
2012 430 412 255 43 50 1,190
2013 392 366 216 69 49 1,099
2014 362 351 220 58 53 1,050
2015 376 369 249 57 51 1,102
a Remoteness regions have been classified as per Australian Statistical Geography Standard (ASGS).
b Includes undetermined remoteness regions.
Source National Crash Database
Table 2.9 Fatal crashes by Significant Urban Area (SUA)a
Urban area
2008 689 626
2009 668 678
2010 591 640
2011 536 615
2012 589 601
2013 514 585
2014 500 550
2015 541 561
a 'Urban' refers to Significant Urban Area. Significant Urban Areas (SUA) represent aggregations of whole Statistical Area Level 2
(SA2) boundaries and are used to define and contain major urban and near-urban concentrations of over 10,000 people. They
include the urban population, any immediately associated populations, and may also incorporate one or more closely associated
Urban Centres and Localities and the areas between. They are designed to incorporate any likely growth over the next 20 years.
Significant Urban Areas do not cover the whole of Australia, and may cross state or territory boundaries.
Sources National Crash Database; Australian Bureau of Statistics 2017b
Table 2.10 Fatal crashes by Urban Centre and Locality (UCL)a
All Remainder
2008 690 734
2009 604 875
2010 542 802
2011 511 755
2012 568 720
2013 486 692
2014 466 677
2015 479 727
a 'UCL' refers to Urban Centre and Locality. An 'Urban Centre' is generally defined as a population centre with a 'core urban population'
of 1,000 or more people. A 'Locality' is generally defined as a population centre of between 200 and 999 people. People living in
Urban Centres are classified as urban for statistical purposes while those in 'Localities' are classified as rural, that is, non-urban.
Sources National Crash Database; Australian Bureau of Statistics 2013
Non-urban area
b
• 33 •
BITRE • Road trauma Australia 2016 statistical summary
Table 2.11 Average number of persons killed per fatal crash
Table 2.11 – 2007 to 2011 and 2012 to 2016
Single vehicle Multiple vehicle Pedestrian crash crash crash
All fatal crashes
2007 - 2011 1.08 1.15 1.01
2012 - 2016 1.07 1.13 1.02
Speed zone 40 km/h
2007 - 2011 1.06 1.08 1.00
2012 - 2016 1.00 1.15 1.00
Speed zone 50 km/h
2007 - 2011 1.05 1.04 1.00
2012 - 2016 1.06 1.03 1.00
Speed zone 60 km/h
2007 - 2011 1.08 1.06 1.01
2012 - 2016 1.06 1.04 1.01
Speed zone 70 –90 km/h
2007 - 2011 1.08 1.12 1.02
2012 - 2016 1.08 1.10 1.02
Speed zone 100 km/h
2007 - 2011 1.09 1.23 1.02
2012 - 2016 1.06 1.18 1.04
Speed zone ≥ 110 km/h
2007 - 2011 1.11 1.26 1.04
2012 - 2016 1.12 1.27 1.07
Source Australian Road Deaths Database
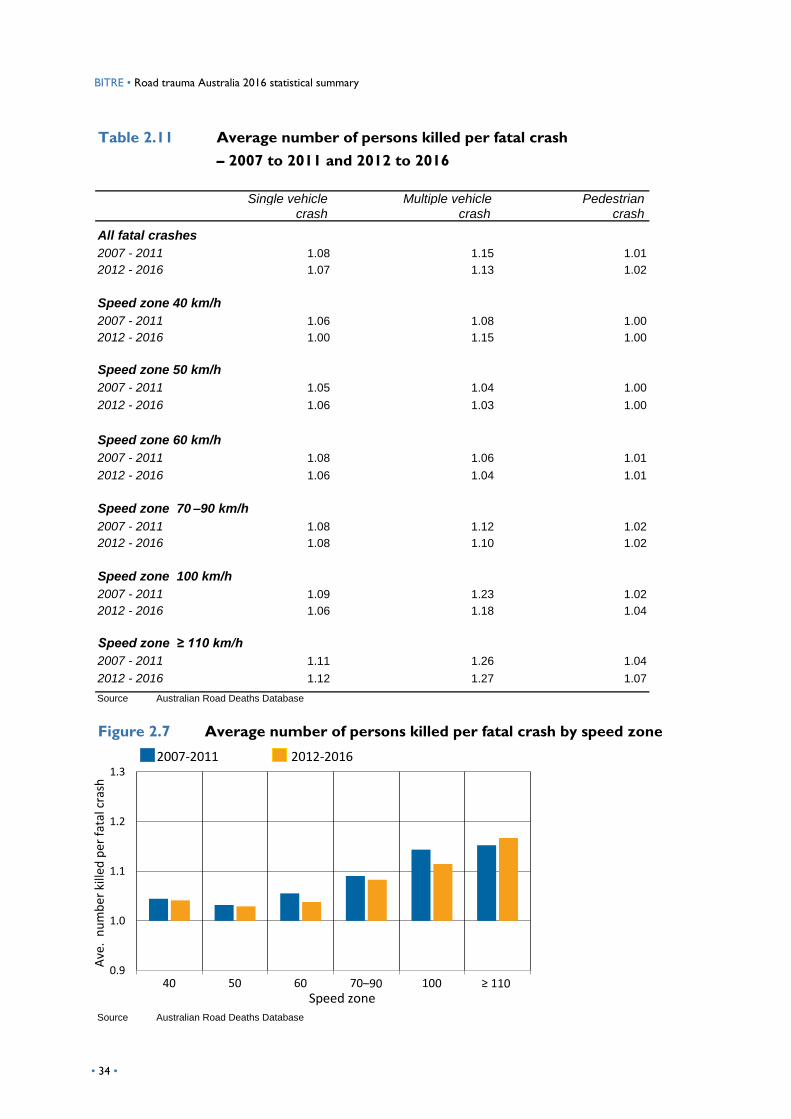
Figure 2.7 Average number of persons killed per fatal crash by speed zone
2007-2011 2012-2016
0.9
1.0
1.1
1.2
1.3
Ave
. n
um
ber
kill
ed p
er f
atal
cras
h
Speed zone
Source Australian Road Deaths Database
• 34 •
• 35 •
SECTION 3 Rates
This section presents rates for fatalities and hospitalised injuries standardised by population, vehicle
kilometres travelled (VKT) and vehicle registrations. Included are comparisons for jurisdictions,
age groups and gender. In general, rates are composed of fatalities during the calendar year divided
by the exposure measure at the mid-point.
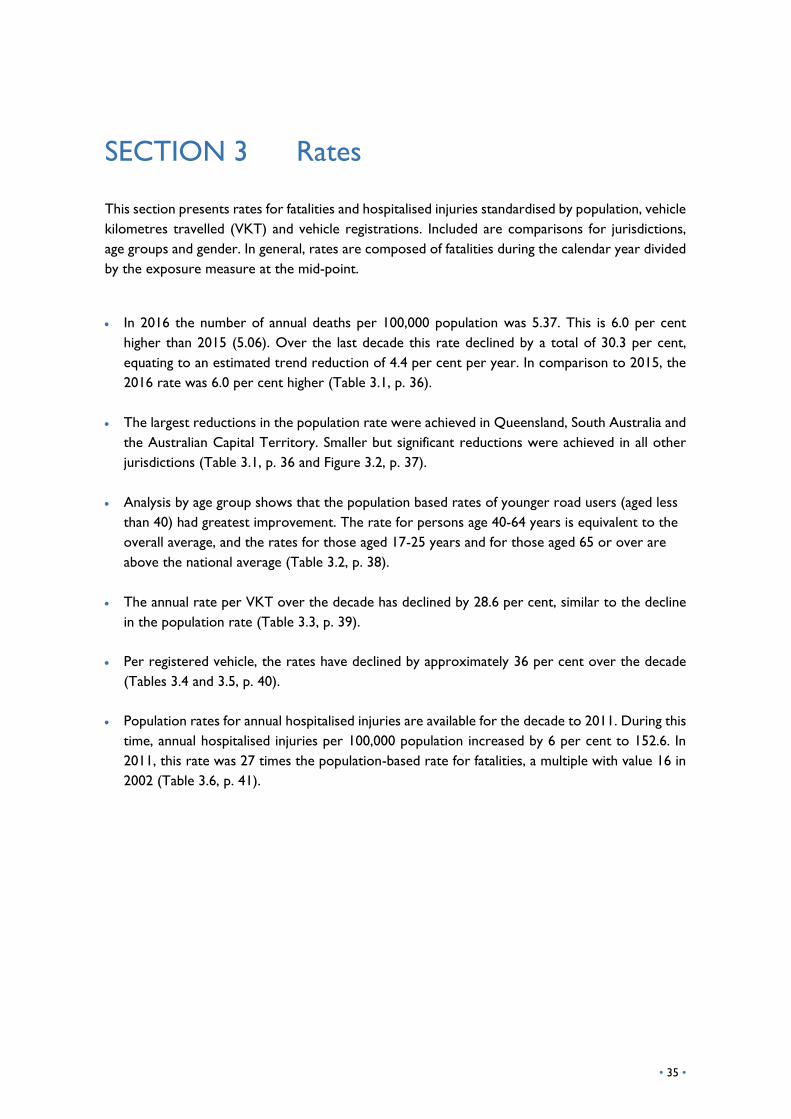
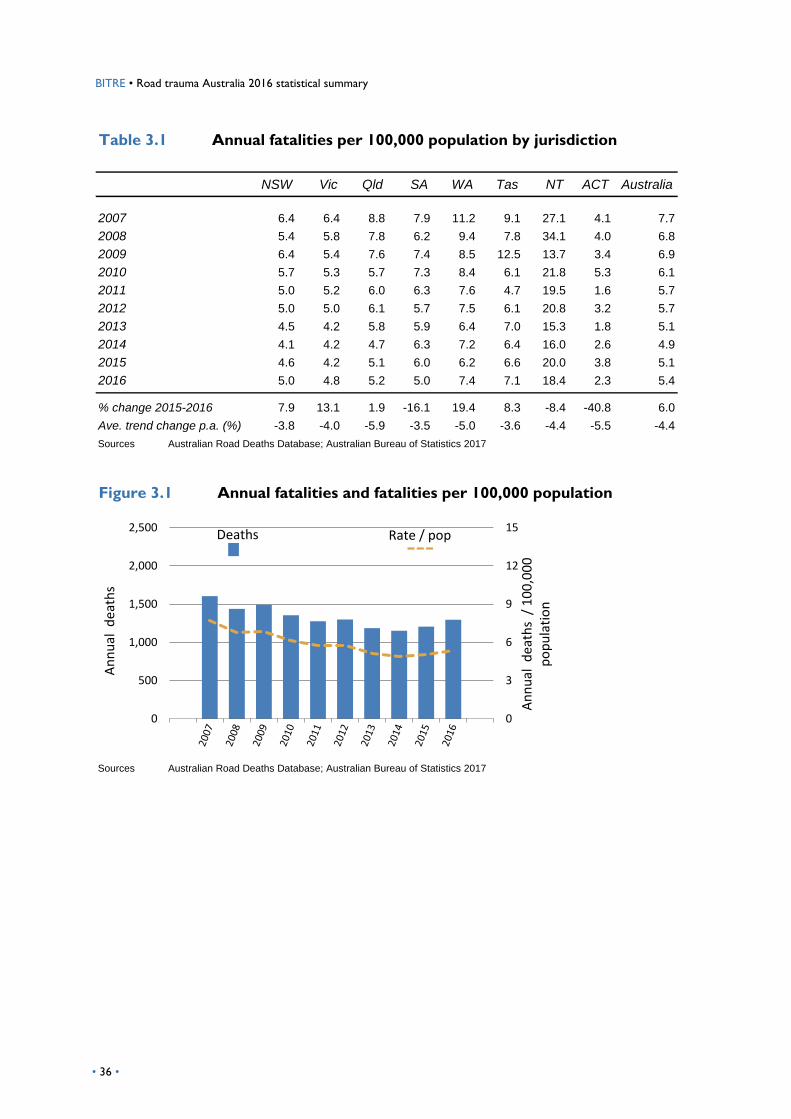
In 2016 the number of annual deaths per 100,000 population was 5.37. This is 6.0 per cent
higher than 2015 (5.06). Over the last decade this rate declined by a total of 30.3 per cent,
equating to an estimated trend reduction of 4.4 per cent per year. In comparison to 2015, the
2016 rate was 6.0 per cent higher (Table 3.1, p. 36).
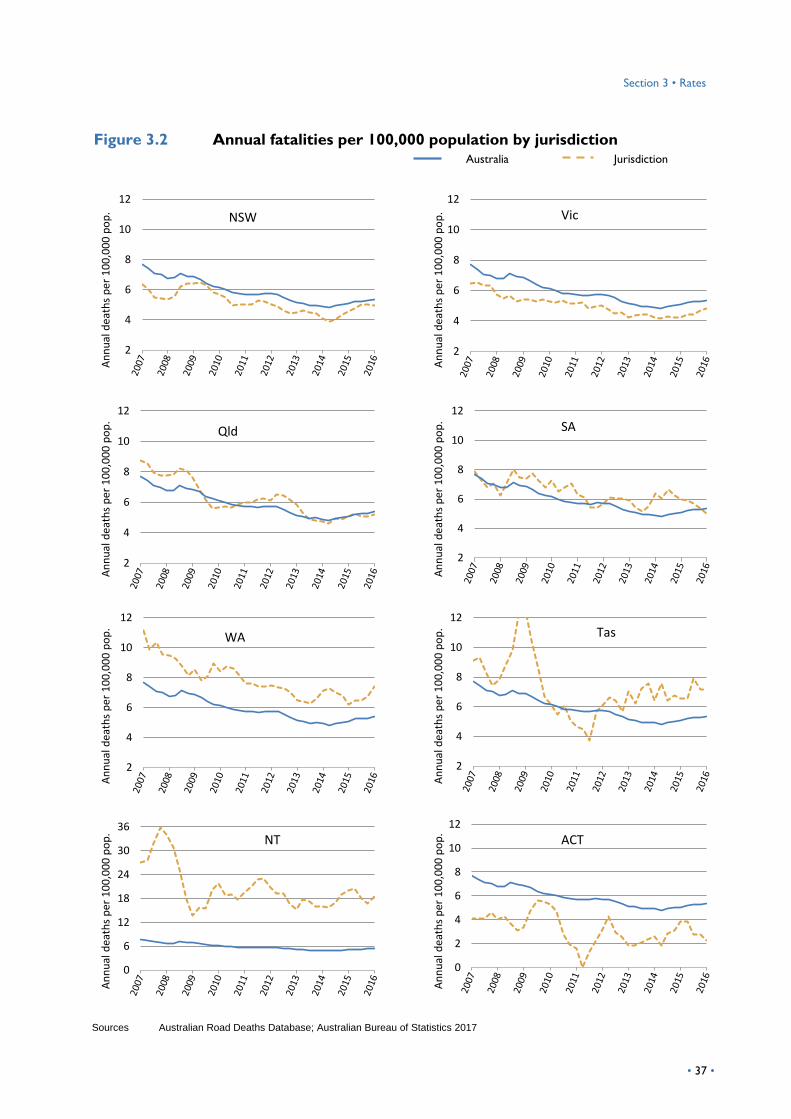
The largest reductions in the population rate were achieved in Queensland, South Australia and
the Australian Capital Territory. Smaller but significant reductions were achieved in all other
jurisdictions (Table 3.1, p. 36 and Figure 3.2, p. 37).
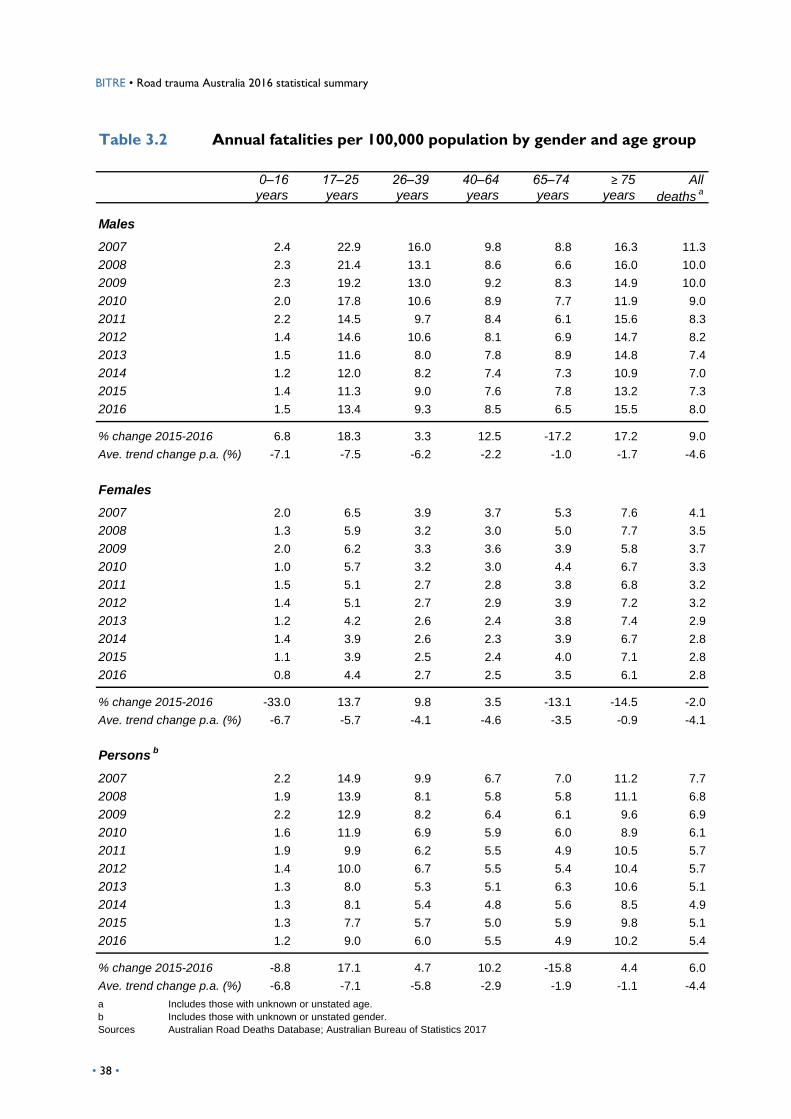
Analysis by age group shows that the population based rates of younger road users (aged less
than 40) had greatest improvement. The rate for persons age 40-64 years is equivalent to the
overall average, and the rates for those aged 17-25 years and for those aged 65 or over are
above the national average (Table 3.2, p. 38).
The annual rate per VKT over the decade has declined by 28.6 per cent, similar to the decline
in the population rate (Table 3.3, p. 39).
Per registered vehicle, the rates have declined by approximately 36 per cent over the decade
(Tables 3.4 and 3.5, p. 40).
Population rates for annual hospitalised injuries are available for the decade to 2011. During this
time, annual hospitalised injuries per 100,000 population increased by 6 per cent to 152.6. In
2011, this rate was 27 times the population-based rate for fatalities, a multiple with value 16 in
2002 (Table 3.6, p. 41).
BITRE • Road trauma Australia 2016 statistical summary
Table 3.1 Annual fatalities per 100,000 population by jurisdiction
NSW Vic Qld SA WA Tas NT ACT Australia
2007 6.4 6.4 8.8 7.9 11.2 9.1 27.1 4.1 7.7
2008 5.4 5.8 7.8 6.2 9.4 7.8 34.1 4.0 6.8
2009 6.4 5.4 7.6 7.4 8.5 12.5 13.7 3.4 6.9
2010 5.7 5.3 5.7 7.3 8.4 6.1 21.8 5.3 6.1
2011 5.0 5.2 6.0 6.3 7.6 4.7 19.5 1.6 5.7
2012 5.0 5.0 6.1 5.7 7.5 6.1 20.8 3.2 5.7
2013 4.5 4.2 5.8 5.9 6.4 7.0 15.3 1.8 5.1
2014 4.1 4.2 4.7 6.3 7.2 6.4 16.0 2.6 4.9
2015 4.6 4.2 5.1 6.0 6.2 6.6 20.0 3.8 5.1
2016 5.0 4.8 5.2 5.0 7.4 7.1 18.4 2.3 5.4
% change 2015-2016 7.9 13.1 1.9 -16.1 19.4 8.3 -8.4 -40.8 6.0
Ave. trend change p.a. (%) -3.8 -4.0 -5.9 -3.5 -5.0 -3.6 -4.4 -5.5 -4.4
Sources Australian Road Deaths Database; Australian Bureau of Statistics 2017
Figure 3.1 Annual fatalities and fatalities per 100,000 population
Sources Australian Road Deaths Database; Australian Bureau of Statistics 2017
0
3
6
9
12
15
0
500
1,000
1,500
2,000
2,500
An
nu
al d
eath
s
An
nu
al d
eath
s /
10
0,0
00
p
op
ula
tio
nDeaths Rate / pop
• 36 •
Section 3 • Rates gg
Figure 3.2 Annual fatalities per 100,000 population by jurisdictionAustralia Jurisdiction
2
4
6
8
10
12
NSW
An
nu
ald
eath
s p
er 1
00
,00
0 p
op
.
2
4
6
8
10
12
Vic
An
nu
ald
eath
s p
er 1
00
,00
0 p
op
.
2
4
6
8
10
12
Qld
An
nu
ald
eath
s p
er 1
00
,00
0 p
op
.
2
4
6
8
10
12
SAA
nn
ual
dea
ths
per
10
0,0
00
po
p.
2
4
6
8
10
12
WA
An
nu
ald
eath
s p
er 1
00
,00
0 p
op
.
2
4
6
8
10
12
Tas
An
nu
ald
eath
s p
er 1
00
,00
0 p
op
.
0
6
12
18
24
30
36NT
An
nu
ald
eath
s p
er 1
00
,00
0 p
op
.
0
2
4
6
8
10
12
ACT
An
nu
ald
eath
s p
er 1
00
,00
0 p
op
.
Australian Road Deaths Database; Australian Bureau of Statistics 2017 Sources
• 37 •g
BITRE • Road trauma Australia 2016 statistical summary
Table 3.2 Annual fatalities per 100,000 population by gender and age group
0–16 17–25 26–39 40–64 65–74 ≥ 75 Allyears years years years years years deaths
a
Males
2007 2.4 22.9 16.0 9.8 8.8 16.3 11.3
2008 2.3 21.4 13.1 8.6 6.6 16.0 10.0
2009 2.3 19.2 13.0 9.2 8.3 14.9 10.0
2010 2.0 17.8 10.6 8.9 7.7 11.9 9.0
2011 2.2 14.5 9.7 8.4 6.1 15.6 8.3
2012 1.4 14.6 10.6 8.1 6.9 14.7 8.2
2013 1.5 11.6 8.0 7.8 8.9 14.8 7.4
2014 1.2 12.0 8.2 7.4 7.3 10.9 7.0
2015 1.4 11.3 9.0 7.6 7.8 13.2 7.3
2016 1.5 13.4 9.3 8.5 6.5 15.5 8.0
% change 2015-2016 6.8 18.3 3.3 12.5 -17.2 17.2 9.0
Ave. trend change p.a. (%) -7.1 -7.5 -6.2 -2.2 -1.0 -1.7 -4.6
Females
2007 2.0 6.5 3.9 3.7 5.3 7.6 4.1
2008 1.3 5.9 3.2 3.0 5.0 7.7 3.5
2009 2.0 6.2 3.3 3.6 3.9 5.8 3.7
2010 1.0 5.7 3.2 3.0 4.4 6.7 3.3
2011 1.5 5.1 2.7 2.8 3.8 6.8 3.2
2012 1.4 5.1 2.7 2.9 3.9 7.2 3.2
2013 1.2 4.2 2.6 2.4 3.8 7.4 2.9
2014 1.4 3.9 2.6 2.3 3.9 6.7 2.8
2015 1.1 3.9 2.5 2.4 4.0 7.1 2.8
2016 0.8 4.4 2.7 2.5 3.5 6.1 2.8
% change 2015-2016 -33.0 13.7 9.8 3.5 -13.1 -14.5 -2.0
Ave. trend change p.a. (%) -6.7 -5.7 -4.1 -4.6 -3.5 -0.9 -4.1
Personsb
2007 2.2 14.9 9.9 6.7 7.0 11.2 7.7
2008 1.9 13.9 8.1 5.8 5.8 11.1 6.8
2009 2.2 12.9 8.2 6.4 6.1 9.6 6.9
2010 1.6 11.9 6.9 5.9 6.0 8.9 6.1
2011 1.9 9.9 6.2 5.5 4.9 10.5 5.7
2012 1.4 10.0 6.7 5.5 5.4 10.4 5.7
2013 1.3 8.0 5.3 5.1 6.3 10.6 5.1
2014 1.3 8.1 5.4 4.8 5.6 8.5 4.9
2015 1.3 7.7 5.7 5.0 5.9 9.8 5.1
2016 1.2 9.0 6.0 5.5 4.9 10.2 5.4
% change 2015-2016 -8.8 17.1 4.7 10.2 -15.8 4.4 6.0
Ave. trend change p.a. (%) -6.8 -7.1 -5.8 -2.9 -1.9 -1.1 -4.4
a Includes those with unknown or unstated age.
b Includes those with unknown or unstated gender.
Sources Australian Road Deaths Database; Australian Bureau of Statistics 2017
• 38 •
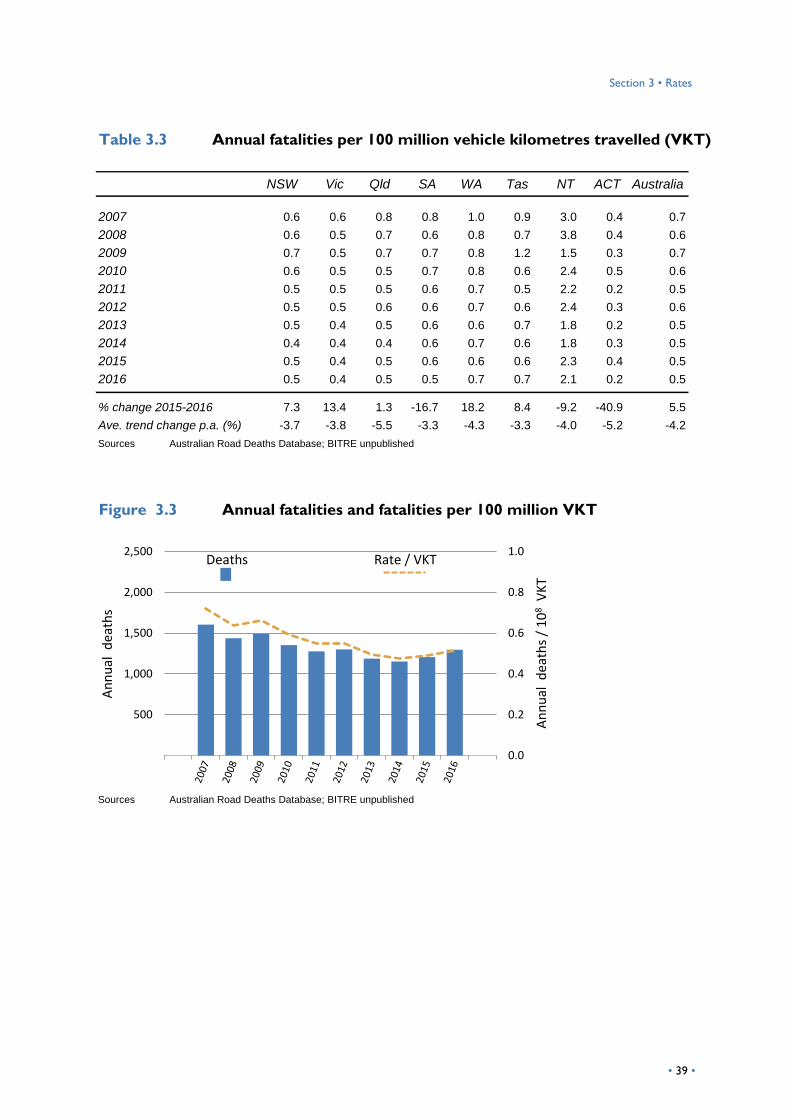
Section 3 • Rates hhhh
Table 3.3 Annual fatalities per 100 million vehicle kilometres travelled (VKT)
NSW Vic Qld SA WA Tas NT ACT Australia
2007 0.6 0.6 0.8 0.8 1.0 0.9 3.0 0.4 0.7
2008 0.6 0.5 0.7 0.6 0.8 0.7 3.8 0.4 0.6
2009 0.7 0.5 0.7 0.7 0.8 1.2 1.5 0.3 0.7
2010 0.6 0.5 0.5 0.7 0.8 0.6 2.4 0.5 0.6
2011 0.5 0.5 0.5 0.6 0.7 0.5 2.2 0.2 0.5
2012 0.5 0.5 0.6 0.6 0.7 0.6 2.4 0.3 0.6
2013 0.5 0.4 0.5 0.6 0.6 0.7 1.8 0.2 0.5
2014 0.4 0.4 0.4 0.6 0.7 0.6 1.8 0.3 0.5
2015 0.5 0.4 0.5 0.6 0.6 0.6 2.3 0.4 0.5
2016 0.5 0.4 0.5 0.5 0.7 0.7 2.1 0.2 0.5
% change 2015-2016 7.3 13.4 1.3 -16.7 18.2 8.4 -9.2 -40.9 5.5
Ave. trend change p.a. (%) -3.7 -3.8 -5.5 -3.3 -4.3 -3.3 -4.0 -5.2 -4.2
Sources Australian Road Deaths Database; BITRE unpublished
Figure 3.3 Annual fatalities and fatalities per 100 million VKT
Sources Australian Road Deaths Database; BITRE unpublished
0.0
0.2
0.4
0.6
0.8
1.0
500
1,000
1,500
2,000
2,500
An
nu
al d
eath
s
An
nu
al d
eath
s /
10
8V
KT
Rate / VKTDeaths
• 39 •hhhh
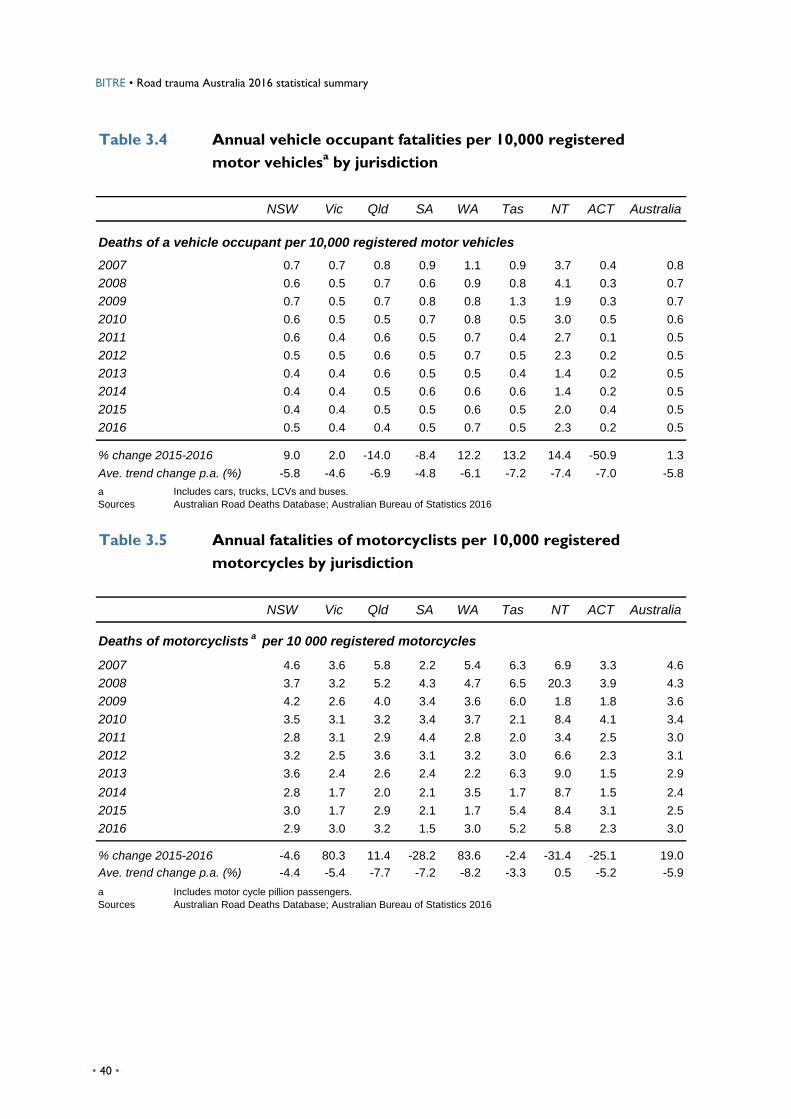
BITRE • Road trauma Australia 2016 statistical summary
Table 3.4 Annual vehicle occupant fatalities per 10,000 registered
Table 3.4 motor vehiclesa by jurisdiction
NSW Vic Qld SA WA Tas NT ACT Australia
Deaths of a vehicle occupant per 10,000 registered motor vehicles
2007 0.7 0.7 0.8 0.9 1.1 0.9 3.7 0.4 0.8
2008 0.6 0.5 0.7 0.6 0.9 0.8 4.1 0.3 0.7
2009 0.7 0.5 0.7 0.8 0.8 1.3 1.9 0.3 0.7
2010 0.6 0.5 0.5 0.7 0.8 0.5 3.0 0.5 0.6
2011 0.6 0.4 0.6 0.5 0.7 0.4 2.7 0.1 0.5
2012 0.5 0.5 0.6 0.5 0.7 0.5 2.3 0.2 0.5
2013 0.4 0.4 0.6 0.5 0.5 0.4 1.4 0.2 0.5
2014 0.4 0.4 0.5 0.6 0.6 0.6 1.4 0.2 0.5
2015 0.4 0.4 0.5 0.5 0.6 0.5 2.0 0.4 0.5
2016 0.5 0.4 0.4 0.5 0.7 0.5 2.3 0.2 0.5
% change 2015-2016 9.0 2.0 -14.0 -8.4 12.2 13.2 14.4 -50.9 1.3
Ave. trend change p.a. (%) -5.8 -4.6 -6.9 -4.8 -6.1 -7.2 -7.4 -7.0 -5.8
a Includes cars, trucks, LCVs and buses.
Sources Australian Road Deaths Database; Australian Bureau of Statistics 2016
Table 3.5 Annual fatalities of motorcyclists per 10,000 registered
Table 3.5 motorcycles by jurisdiction
NSW Vic Qld SA WA Tas NT ACT Australia
Deaths of motorcyclistsa per 10 000 registered motorcycles
2007 4.6 3.6 5.8 2.2 5.4 6.3 6.9 3.3 4.6
2008 3.7 3.2 5.2 4.3 4.7 6.5 20.3 3.9 4.3
2009 4.2 2.6 4.0 3.4 3.6 6.0 1.8 1.8 3.6
2010 3.5 3.1 3.2 3.4 3.7 2.1 8.4 4.1 3.4
2011 2.8 3.1 2.9 4.4 2.8 2.0 3.4 2.5 3.0
2012 3.2 2.5 3.6 3.1 3.2 3.0 6.6 2.3 3.1
2013 3.6 2.4 2.6 2.4 2.2 6.3 9.0 1.5 2.9
2014 2.8 1.7 2.0 2.1 3.5 1.7 8.7 1.5 2.4
2015 3.0 1.7 2.9 2.1 1.7 5.4 8.4 3.1 2.5
2016 2.9 3.0 3.2 1.5 3.0 5.2 5.8 2.3 3.0
% change 2015-2016 -4.6 80.3 11.4 -28.2 83.6 -2.4 -31.4 -25.1 19.0
Ave. trend change p.a. (%) -4.4 -5.4 -7.7 -7.2 -8.2 -3.3 0.5 -5.2 -5.9
a Includes motor cycle pillion passengers.
Sources Australian Road Deaths Database; Australian Bureau of Statistics 2016
• 40 •
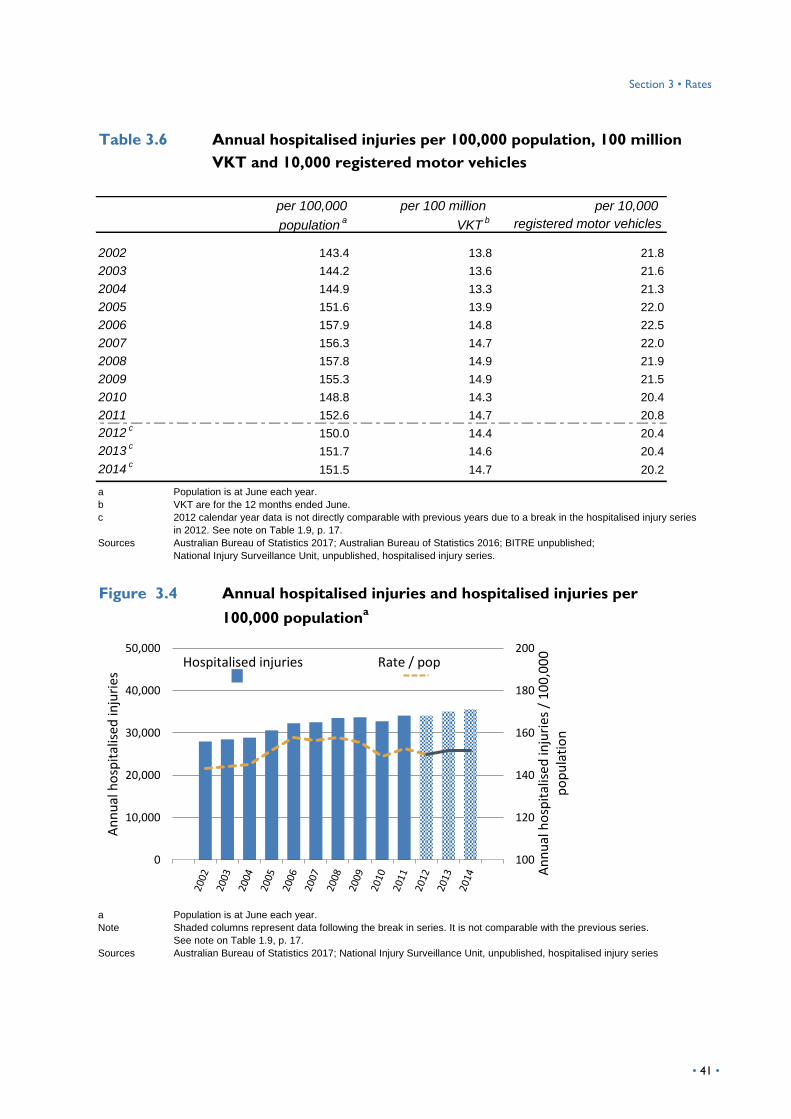
Section 3 • Rates
Table 3.6 Annual hospitalised injuries per 100,000 population, 100 million
Table 3.6 VKT and 10,000 registered motor vehicles
per 100,000 per 100 million per 10,000
populationa
VKTb registered motor vehicles
2002 1 143.4 13.8 21.8
2003 2 144.2 13.6 21.6
2004 3 144.9 13.3 21.3
2005 4 151.6 13.9 22.0
2006 5 157.9 14.8 22.5
2007 6 156.3 14.7 22.0
2008 7 157.8 14.9 21.9
2009 8 155.3 14.9 21.5
2010 9 148.8 14.3 20.4
2011 10 152.6 14.7 20.8
2012c
11 150.0 14.4 20.4
2013c
12 151.7 14.6 20.4
2014c
151.5 14.7 20.2
a Population is at June each year.
b VKT are for the 12 months ended June.
c 2012 calendar year data is not directly comparable with previous years due to a break in the hospitalised injury series
in 2012. See note on Table 1.9, p. 17.
Sources Australian Bureau of Statistics 2017; Australian Bureau of Statistics 2016; BITRE unpublished;
National Injury Surveillance Unit, unpublished, hospitalised injury series.
Figure 3.4 Annual hospitalised injuries and hospitalised injuries per
Figure 3.4 100,000 populationa
a Population is at June each year.
Note Shaded columns represent data following the break in series. It is not comparable with the previous series.
See note on Table 1.9, p. 17.
Sources Australian Bureau of Statistics 2017; National Injury Surveillance Unit, unpublished, hospitalised injury series
100
120
140
160
180
200
0
10,000
20,000
30,000
40,000
50,000
An
nu
al h
osp
ital
ised
inju
ries
Hospitalised injuries Rate / pop
An
nu
al h
osp
ital
ised
inju
ries
/ 1
00
,00
0
po
pu
lati
on
• 41 •

BITRE • Road trauma Australia 2016 statistical summary
This page is intentionally left blank.
• 42 •
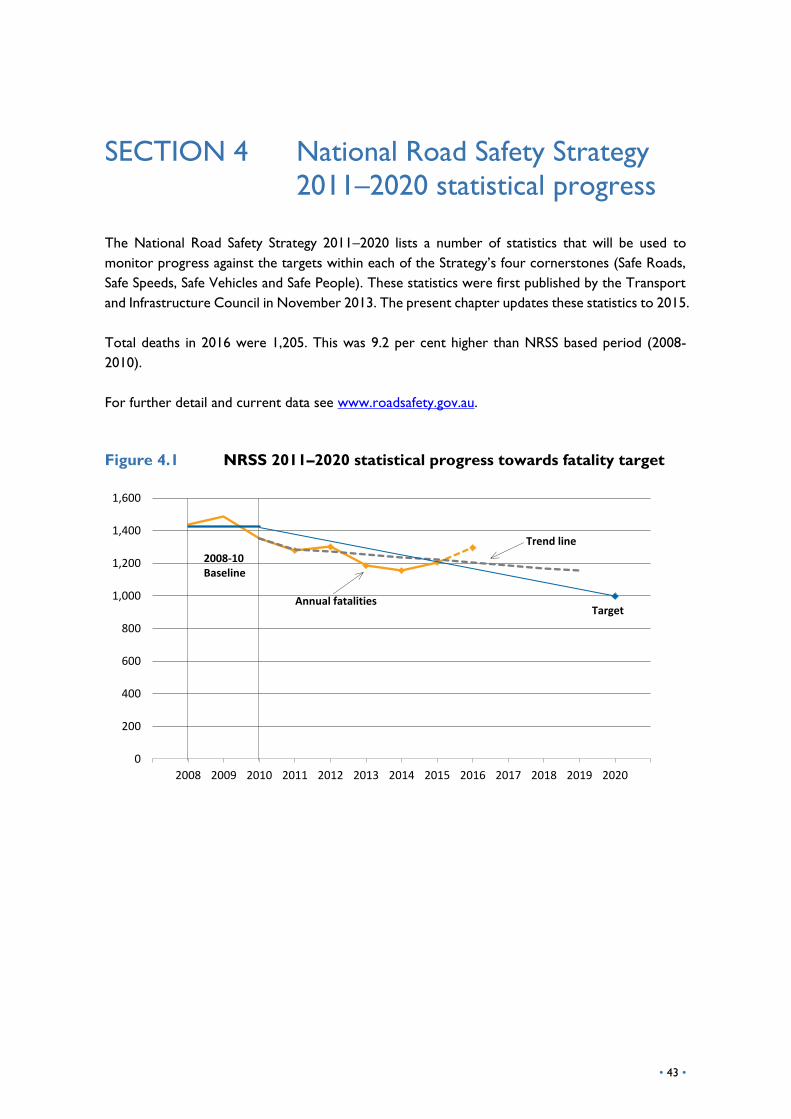
• 43 •
SECTION 4 National Road Safety Strategy
2011–2020 statistical progress The National Road Safety Strategy 2011–2020 lists a number of statistics that will be used to
monitor progress against the targets within each of the Strategy’s four cornerstones (Safe Roads,
Safe Speeds, Safe Vehicles and Safe People). These statistics were first published by the Transport
and Infrastructure Council in November 2013. The present chapter updates these statistics to 2015.
Total deaths in 2016 were 1,205. This was 9.2 per cent higher than NRSS based period (2008-
2010).
For further detail and current data see www.roadsafety.gov.au.
Figure 4.1 NRSS 2011–2020 statistical progress towards fatality target
0
200
400
600
800
1,000
1,200
1,400
1,600
2008 2009 2010 2011 2012 2013 2014 2015 2016 2017 2018 2019 2020
2008-10Baseline
Annual fatalities
Trend line
Target
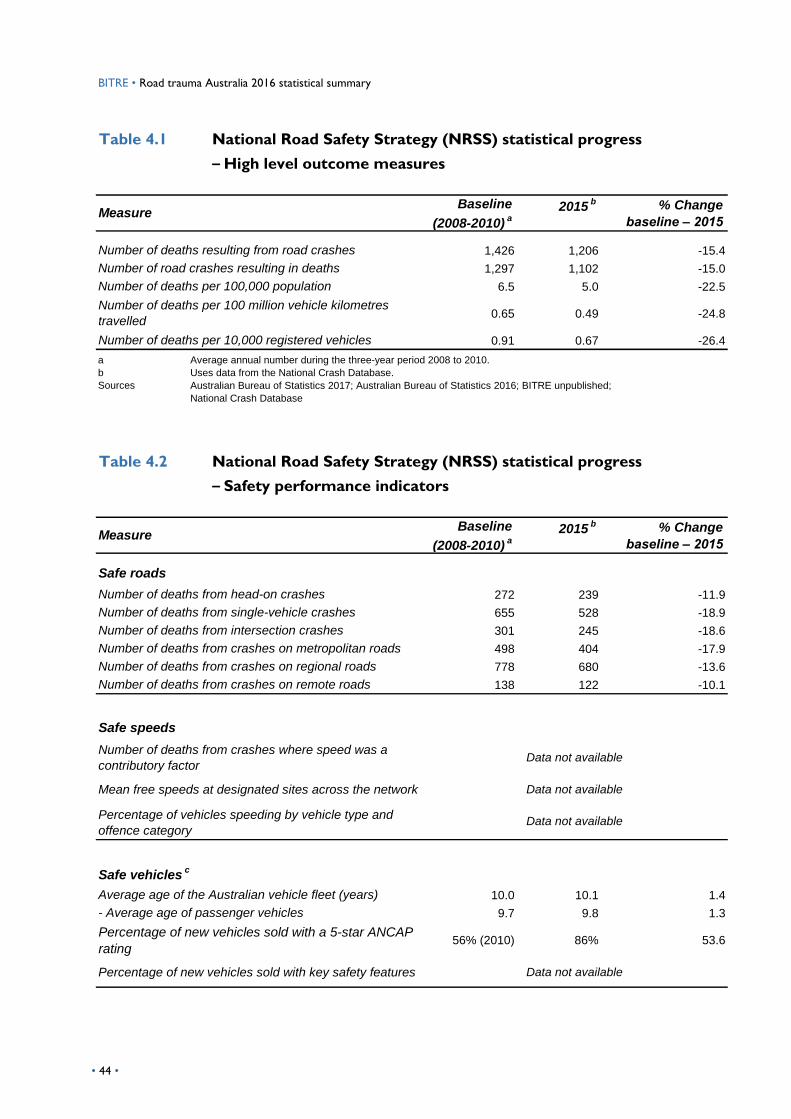
BITRE • Road trauma Australia 2016 statistical summary
Table 4.1 National Road Safety Strategy (NRSS) statistical progress
Table 4.1 – High level outcome measures
Baseline
(2008-2010)a
2015b % Change
baseline – 2015
1,426 1,206 -15.4
1,297 1,102 -15.0
6.5 5.0 -22.5
0.65 0.49 -24.8
0.91 0.67 -26.4
a Average annual number during the three-year period 2008 to 2010.
b Uses data from the National Crash Database.
Sources Australian Bureau of Statistics 2017; Australian Bureau of Statistics 2016; BITRE unpublished;
National Crash Database
Table 4.2 National Road Safety Strategy (NRSS) statistical progress
Table 4.2 – Safety performance indicators
Baseline
(2008-2010)a
2015b % Change
baseline – 2015
Safe roads
272 239 -11.9
655 528 -18.9
301 245 -18.6
498 404 -17.9
778 680 -13.6
138 122 -10.1
Safe speeds
Safe vehiclesc
10.0 10.1 1.4
9.7 9.8 1.3
56% (2010) 86% 53.6
Data not available
Data not available
Data not available
Data not availablePercentage of new vehicles sold with key safety features
Percentage of vehicles speeding by vehicle type and
offence category
Average age of the Australian vehicle fleet (years)
Percentage of new vehicles sold with a 5-star ANCAP
rating
- Average age of passenger vehicles
Number of deaths per 100 million vehicle kilometres
travelled
Measure
Number of deaths resulting from road crashes
Number of road crashes resulting in deaths
Number of deaths per 100,000 population
Number of deaths per 10,000 registered vehicles
Measure
Number of deaths from head-on crashes
Number of deaths from single-vehicle crashes
Number of deaths from intersection crashes
Number of deaths from crashes on metropolitan roads
Number of deaths from crashes on regional roads
Number of deaths from crashes on remote roads
Number of deaths from crashes where speed was a
contributory factor
Mean free speeds at designated sites across the network
• 44 •
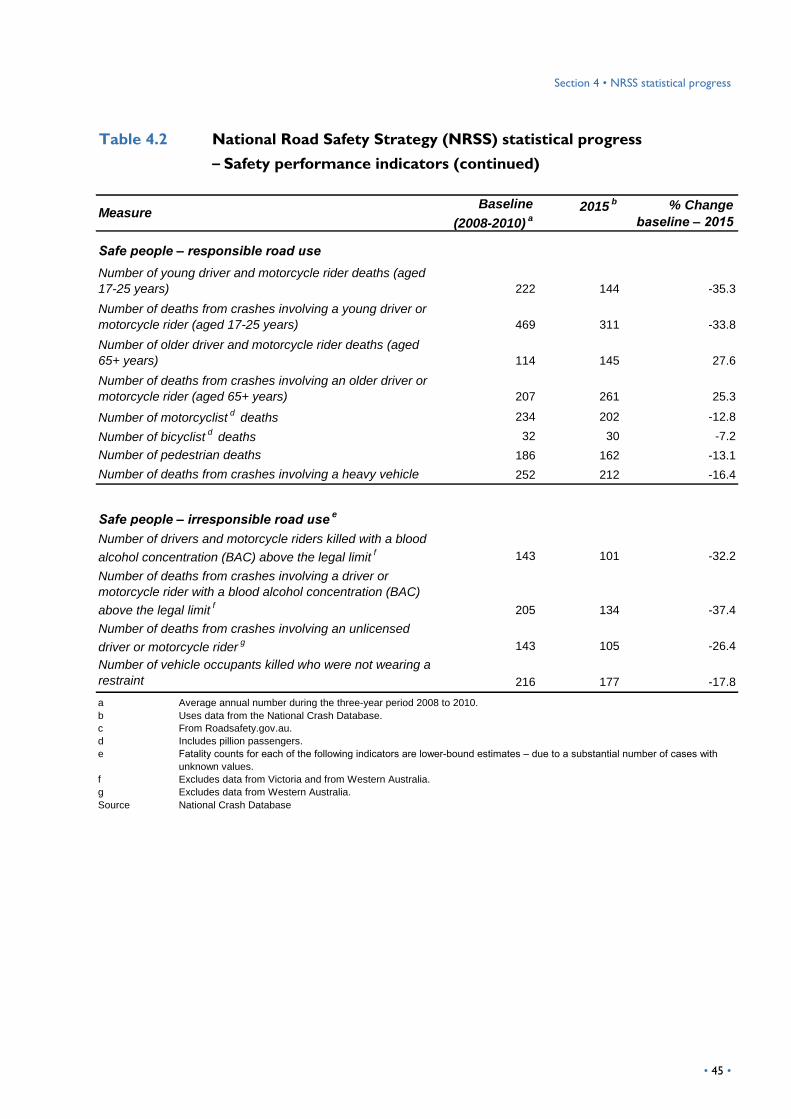
Section 4 • NRSS statistical progresshhhhh
Table 4.2 National Road Safety Strategy (NRSS) statistical progress
Table 4.2 – Safety performance indicators (continued)
Baseline
(2008-2010)a
2015b % Change
baseline – 2015
Safe people – responsible road use
222 144 -35.3
469 311 -33.8
114 145 27.6
207 261 25.3
234 202 -12.8
32 30 -7.2
186 162 -13.1
252 212 -16.4
Safe people – irresponsible road usee
143 101 -32.2
205 134 -37.4
143 105 -26.4
216 177 -17.8
a Average annual number during the three-year period 2008 to 2010.
b Uses data from the National Crash Database.
c From Roadsafety.gov.au.
d Includes pillion passengers.
e Fatality counts for each of the following indicators are lower-bound estimates – due to a substantial number of cases with
unknown values.
f Excludes data from Victoria and from Western Australia.
g Excludes data from Western Australia.
Source National Crash Database
Number of young driver and motorcycle rider deaths (aged
17-25 years)
Number of drivers and motorcycle riders killed with a blood
alcohol concentration (BAC) above the legal limitf
Measure
Number of deaths from crashes involving a heavy vehicle
Number of deaths from crashes involving a driver or
motorcycle rider with a blood alcohol concentration (BAC)
above the legal limitf
Number of deaths from crashes involving an unlicensed
driver or motorcycle riderg
Number of vehicle occupants killed who were not wearing a
restraint
Number of deaths from crashes involving a young driver or
motorcycle rider (aged 17-25 years)
Number of older driver and motorcycle rider deaths (aged
65+ years)
Number of deaths from crashes involving an older driver or
motorcycle rider (aged 65+ years)
Number of motorcyclistd deaths
Number of bicyclistd deaths
Number of pedestrian deaths
• 45 •hhhhh

BITRE • Road trauma Australia 2016 statistical summary
This page is intentionally left blank.
• 46 •
• 47 •
SECTION 5 Historical series This section presents longer time series of annual fatalities, crashes and rates.
Over the last 30 years, annual fatalities decreased by 53.3 per cent. By jurisdiction, the
reductions range from 9.4 per cent for Western Australia to 60.1 per cent for New South
Wales and 75.0 per cent for the Australian Capital Territory (Table 5.1, p. 48).
Comparing the trends by road user group, the strongest reductions are for passengers (72 per
cent over 30 years), pedestrians (63 per cent) and pedal cyclists (63 per cent) (Table 5.2, p. 49).
As for the most recent decade, the longer term reductions are strongest for younger age groups.
Deaths of road users aged under 40 declined by 53.9 per cent over 25 years, and for 40 years
and over, the decline was 12.4 per cent (Table 5.3, p. 50).
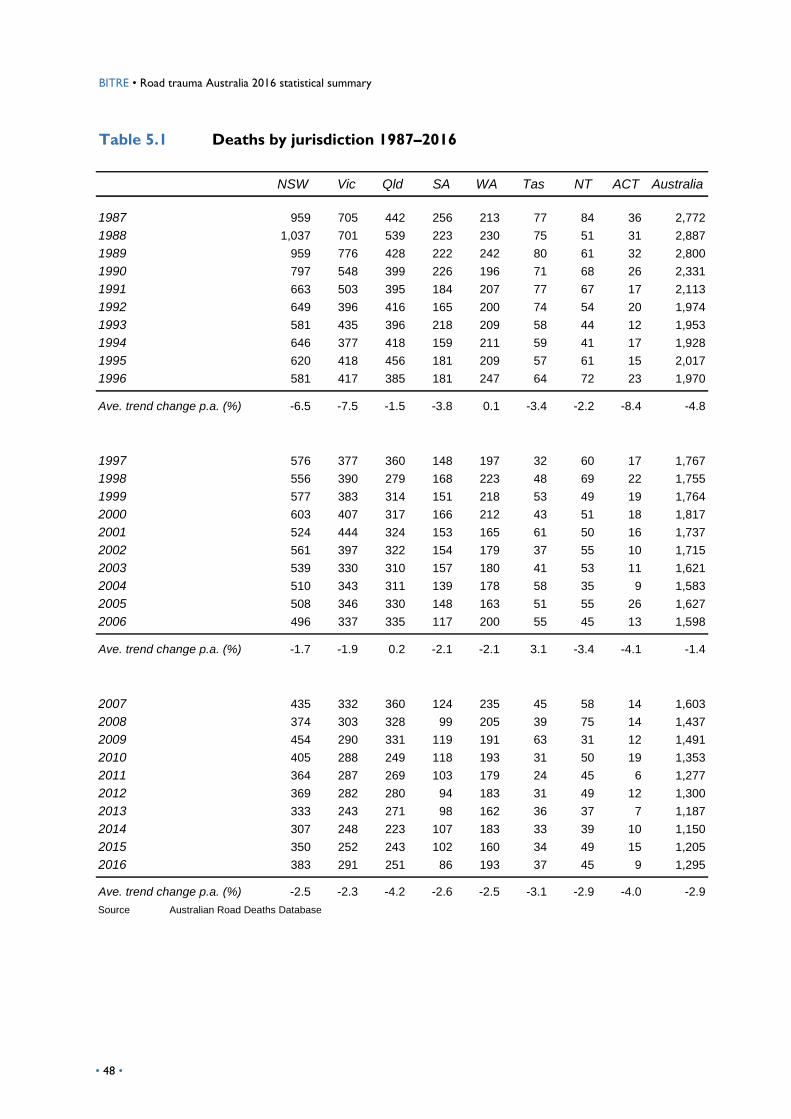
BITRE • Road trauma Australia 2016 statistical summary
Table 5.1 Deaths by jurisdiction 1987–2016
NSW Vic Qld SA WA Tas NT ACT Australia
1987 959 705 442 256 213 77 84 36 2,772
1988 1,037 701 539 223 230 75 51 31 2,887
1989 959 776 428 222 242 80 61 32 2,800
1990 797 548 399 226 196 71 68 26 2,331
1991 663 503 395 184 207 77 67 17 2,113
1992 649 396 416 165 200 74 54 20 1,974
1993 581 435 396 218 209 58 44 12 1,953
1994 646 377 418 159 211 59 41 17 1,928
1995 620 418 456 181 209 57 61 15 2,017
1996 581 417 385 181 247 64 72 23 1,970
Ave. trend change p.a. (%) -6.5 -7.5 -1.5 -3.8 0.1 -3.4 -2.2 -8.4 -4.8
1997 576 377 360 148 197 32 60 17 1,767
1998 556 390 279 168 223 48 69 22 1,755
1999 577 383 314 151 218 53 49 19 1,764
2000 603 407 317 166 212 43 51 18 1,817
2001 524 444 324 153 165 61 50 16 1,737
2002 561 397 322 154 179 37 55 10 1,715
2003 539 330 310 157 180 41 53 11 1,621
2004 510 343 311 139 178 58 35 9 1,583
2005 508 346 330 148 163 51 55 26 1,627
2006 496 337 335 117 200 55 45 13 1,598
Ave. trend change p.a. (%) -1.7 -1.9 0.2 -2.1 -2.1 3.1 -3.4 -4.1 -1.4
2007 435 332 360 124 235 45 58 14 1,603
2008 374 303 328 99 205 39 75 14 1,437
2009 454 290 331 119 191 63 31 12 1,491
2010 405 288 249 118 193 31 50 19 1,353
2011 364 287 269 103 179 24 45 6 1,277
2012 369 282 280 94 183 31 49 12 1,300
2013 333 243 271 98 162 36 37 7 1,187
2014 307 248 223 107 183 33 39 10 1,150
2015 350 252 243 102 160 34 49 15 1,205
2016 383 291 251 86 193 37 45 9 1,295
Ave. trend change p.a. (%) -2.5 -2.3 -4.2 -2.6 -2.5 -3.1 -2.9 -4.0 -2.9
Source Australian Road Deaths Database
• 48 •
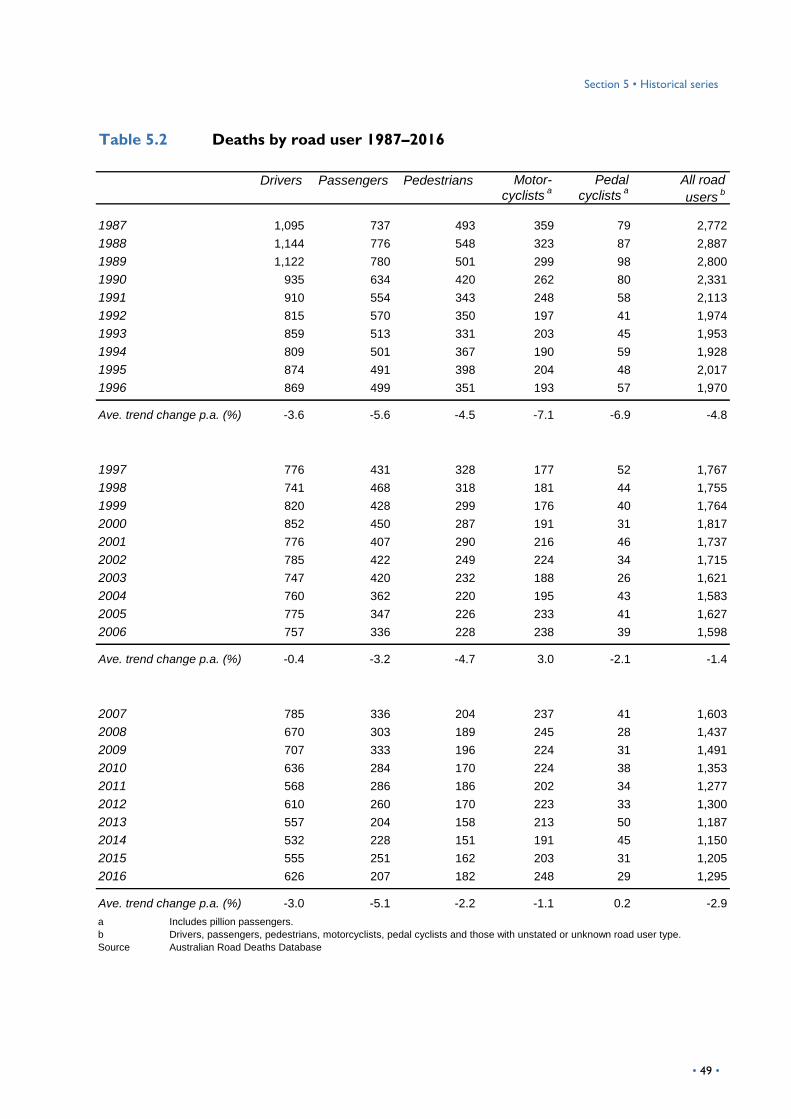
Section 5 • Historical series
Table 5.2 Deaths by road user 1987–2016
Motor- Pedal All road
cyclistsa
cyclistsa
usersb
1987 1,095 737 493 359 79 2,772
1988 1,144 776 548 323 87 2,887
1989 1,122 780 501 299 98 2,800
1990 935 634 420 262 80 2,331
1991 910 554 343 248 58 2,113
1992 815 570 350 197 41 1,974
1993 859 513 331 203 45 1,953
1994 809 501 367 190 59 1,928
1995 874 491 398 204 48 2,017
1996 869 499 351 193 57 1,970
Ave. trend change p.a. (%) -3.6 -5.6 -4.5 -7.1 -6.9 -4.8
1997 776 431 328 177 52 1,767
1998 741 468 318 181 44 1,755
1999 820 428 299 176 40 1,764
2000 852 450 287 191 31 1,817
2001 776 407 290 216 46 1,737
2002 785 422 249 224 34 1,715
2003 747 420 232 188 26 1,621
2004 760 362 220 195 43 1,583
2005 775 347 226 233 41 1,627
2006 757 336 228 238 39 1,598
Ave. trend change p.a. (%) -0.4 -3.2 -4.7 3.0 -2.1 -1.4
2007 785 336 204 237 41 1,603
2008 670 303 189 245 28 1,437
2009 707 333 196 224 31 1,491
2010 636 284 170 224 38 1,353
2011 568 286 186 202 34 1,277
2012 610 260 170 223 33 1,300
2013 557 204 158 213 50 1,187
2014 532 228 151 191 45 1,150
2015 555 251 162 203 31 1,205
2016 626 207 182 248 29 1,295
Ave. trend change p.a. (%) -3.0 -5.1 -2.2 -1.1 0.2 -2.9
a Includes pillion passengers.
b Drivers, passengers, pedestrians, motorcyclists, pedal cyclists and those with unstated or unknown road user type.
Source Australian Road Deaths Database
Drivers Passengers Pedestrians
• 49 •
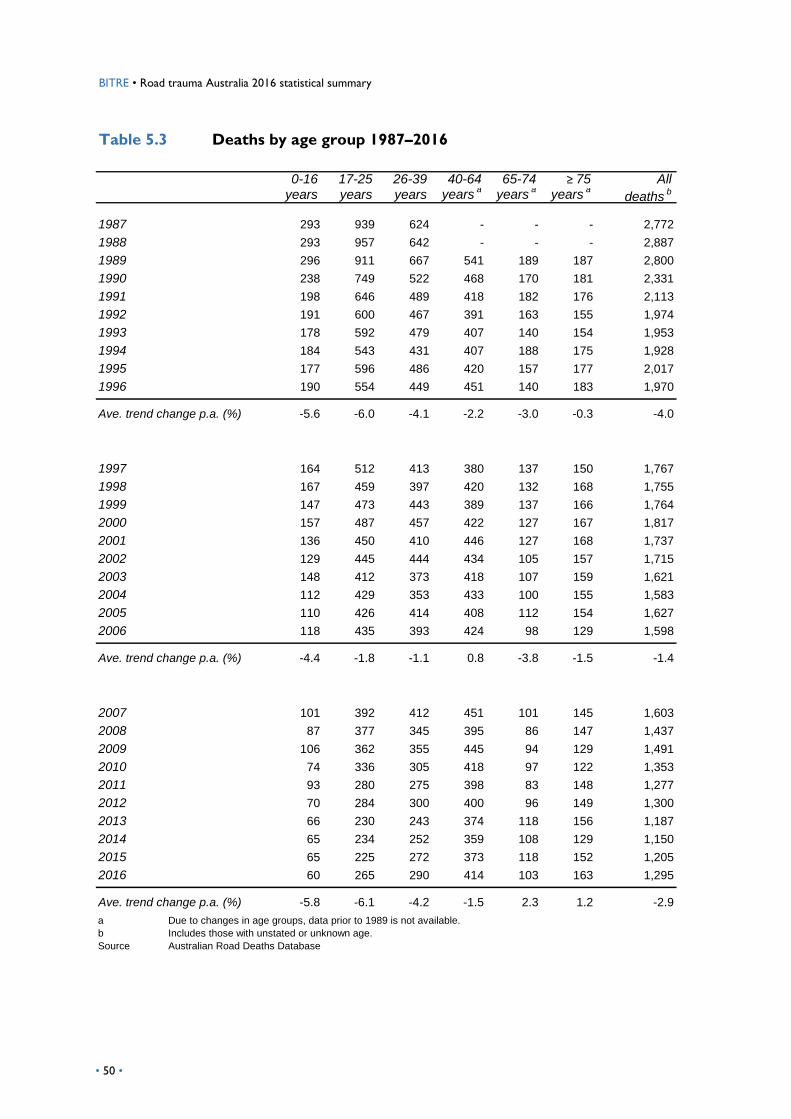
BITRE • Road trauma Australia 2016 statistical summary
Table 5.3 Deaths by age group 1987–2016
0-16 17-25 26-39 40-64 65-74 ≥ 75 Allyears years years years
ayears
ayears
adeaths
b
1987 293 939 624 - - - 2,772
1988 293 957 642 - - - 2,887
1989 296 911 667 541 189 187 2,800
1990 238 749 522 468 170 181 2,331
1991 198 646 489 418 182 176 2,113
1992 191 600 467 391 163 155 1,974
1993 178 592 479 407 140 154 1,953
1994 184 543 431 407 188 175 1,928
1995 177 596 486 420 157 177 2,017
1996 190 554 449 451 140 183 1,970
Ave. trend change p.a. (%) -5.6 -6.0 -4.1 -2.2 -3.0 -0.3 -4.0
1997 164 512 413 380 137 150 1,767
1998 167 459 397 420 132 168 1,755
1999 147 473 443 389 137 166 1,764
2000 157 487 457 422 127 167 1,817
2001 136 450 410 446 127 168 1,737
2002 129 445 444 434 105 157 1,715
2003 148 412 373 418 107 159 1,621
2004 112 429 353 433 100 155 1,583
2005 110 426 414 408 112 154 1,627
2006 118 435 393 424 98 129 1,598
Ave. trend change p.a. (%) -4.4 -1.8 -1.1 0.8 -3.8 -1.5 -1.4
2007 101 392 412 451 101 145 1,603
2008 87 377 345 395 86 147 1,437
2009 106 362 355 445 94 129 1,491
2010 74 336 305 418 97 122 1,353
2011 93 280 275 398 83 148 1,277
2012 70 284 300 400 96 149 1,300
2013 66 230 243 374 118 156 1,187
2014 65 234 252 359 108 129 1,150
2015 65 225 272 373 118 152 1,205
2016 60 265 290 414 103 163 1,295
Ave. trend change p.a. (%) -5.8 -6.1 -4.2 -1.5 2.3 1.2 -2.9
a Due to changes in age groups, data prior to 1989 is not available.
b Includes those with unstated or unknown age.
Source Australian Road Deaths Database
• 50 •
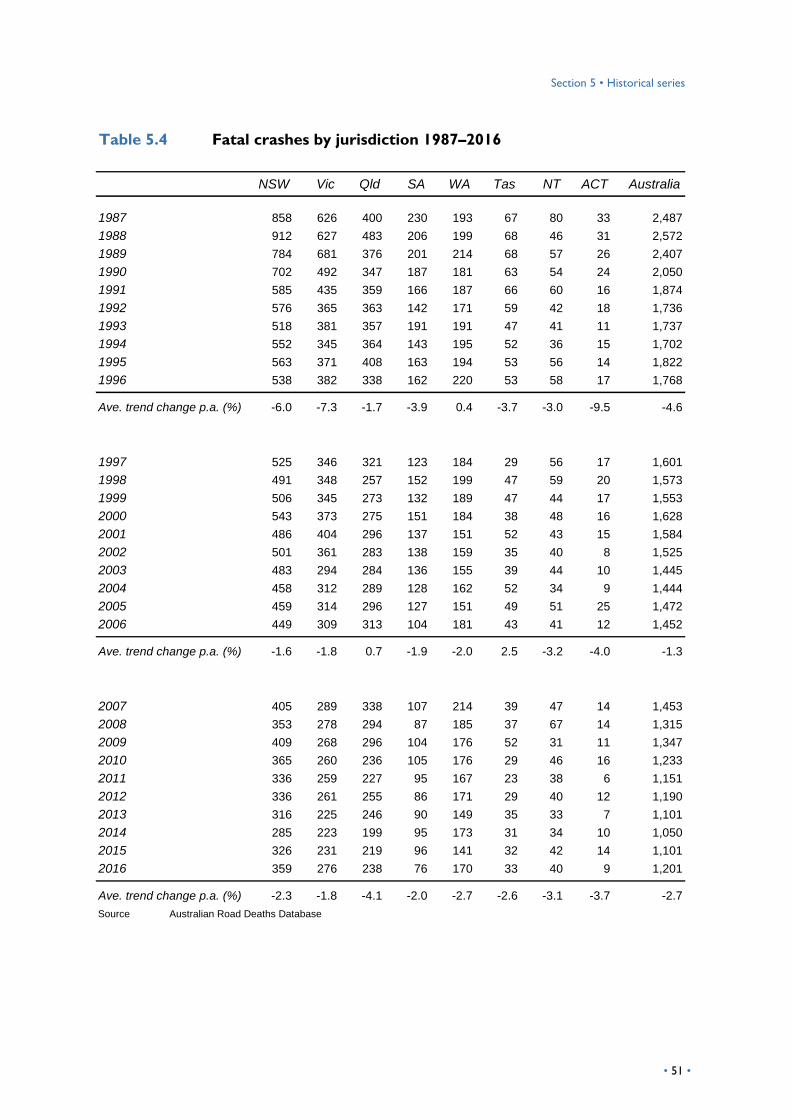
Section 5 • Historical serieseeeeee
Table 5.4 Fatal crashes by jurisdiction 1987–2016
NSW Vic Qld SA WA Tas NT ACT Australia
1987 858 626 400 230 193 67 80 33 2,487
1988 912 627 483 206 199 68 46 31 2,572
1989 784 681 376 201 214 68 57 26 2,407
1990 702 492 347 187 181 63 54 24 2,050
1991 585 435 359 166 187 66 60 16 1,874
1992 576 365 363 142 171 59 42 18 1,736
1993 518 381 357 191 191 47 41 11 1,737
1994 552 345 364 143 195 52 36 15 1,702
1995 563 371 408 163 194 53 56 14 1,822
1996 538 382 338 162 220 53 58 17 1,768
Ave. trend change p.a. (%) -6.0 -7.3 -1.7 -3.9 0.4 -3.7 -3.0 -9.5 -4.6
1997 525 346 321 123 184 29 56 17 1,601
1998 491 348 257 152 199 47 59 20 1,573
1999 506 345 273 132 189 47 44 17 1,553
2000 543 373 275 151 184 38 48 16 1,628
2001 486 404 296 137 151 52 43 15 1,584
2002 501 361 283 138 159 35 40 8 1,525
2003 483 294 284 136 155 39 44 10 1,445
2004 458 312 289 128 162 52 34 9 1,444
2005 459 314 296 127 151 49 51 25 1,472
2006 449 309 313 104 181 43 41 12 1,452
Ave. trend change p.a. (%) -1.6 -1.8 0.7 -1.9 -2.0 2.5 -3.2 -4.0 -1.3
2007 405 289 338 107 214 39 47 14 1,453
2008 353 278 294 87 185 37 67 14 1,315
2009 409 268 296 104 176 52 31 11 1,347
2010 365 260 236 105 176 29 46 16 1,233
2011 336 259 227 95 167 23 38 6 1,151
2012 336 261 255 86 171 29 40 12 1,190
2013 316 225 246 90 149 35 33 7 1,101
2014 285 223 199 95 173 31 34 10 1,050
2015 326 231 219 96 141 32 42 14 1,101
2016 359 276 238 76 170 33 40 9 1,201
Ave. trend change p.a. (%) -2.3 -1.8 -4.1 -2.0 -2.7 -2.6 -3.1 -3.7 -2.7
Source Australian Road Deaths Database
• 51 •eeeee
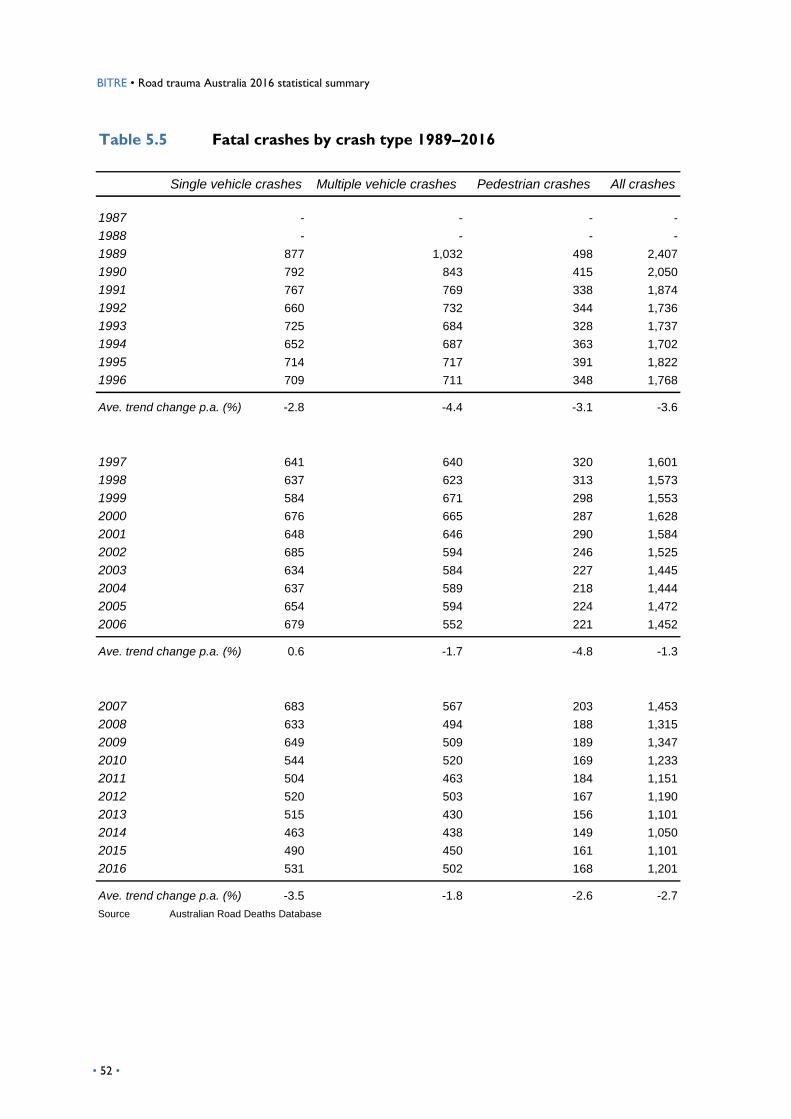
eeBITRE • Road trauma Australia 2016 statistical summary
Table 5.5 Fatal crashes by crash type 1989–2016
Single vehicle crashes Multiple vehicle crashes Pedestrian crashes All crashes
1987 - - - -
1988 - - - -
1989 877 1,032 498 2,407
1990 792 843 415 2,050
1991 767 769 338 1,874
1992 660 732 344 1,736
1993 725 684 328 1,737
1994 652 687 363 1,702
1995 714 717 391 1,822
1996 709 711 348 1,768
Ave. trend change p.a. (%) -2.8 -4.4 -3.1 -3.6
1997 641 640 320 1,601
1998 637 623 313 1,573
1999 584 671 298 1,553
2000 676 665 287 1,628
2001 648 646 290 1,584
2002 685 594 246 1,525
2003 634 584 227 1,445
2004 637 589 218 1,444
2005 654 594 224 1,472
2006 679 552 221 1,452
Ave. trend change p.a. (%) 0.6 -1.7 -4.8 -1.3
2007 683 567 203 1,453
2008 633 494 188 1,315
2009 649 509 189 1,347
2010 544 520 169 1,233
2011 504 463 184 1,151
2012 520 503 167 1,190
2013 515 430 156 1,101
2014 463 438 149 1,050
2015 490 450 161 1,101
2016 531 502 168 1,201
Ave. trend change p.a. (%) -3.5 -1.8 -2.6 -2.7
Source Australian Road Deaths Database
eee• 52 •
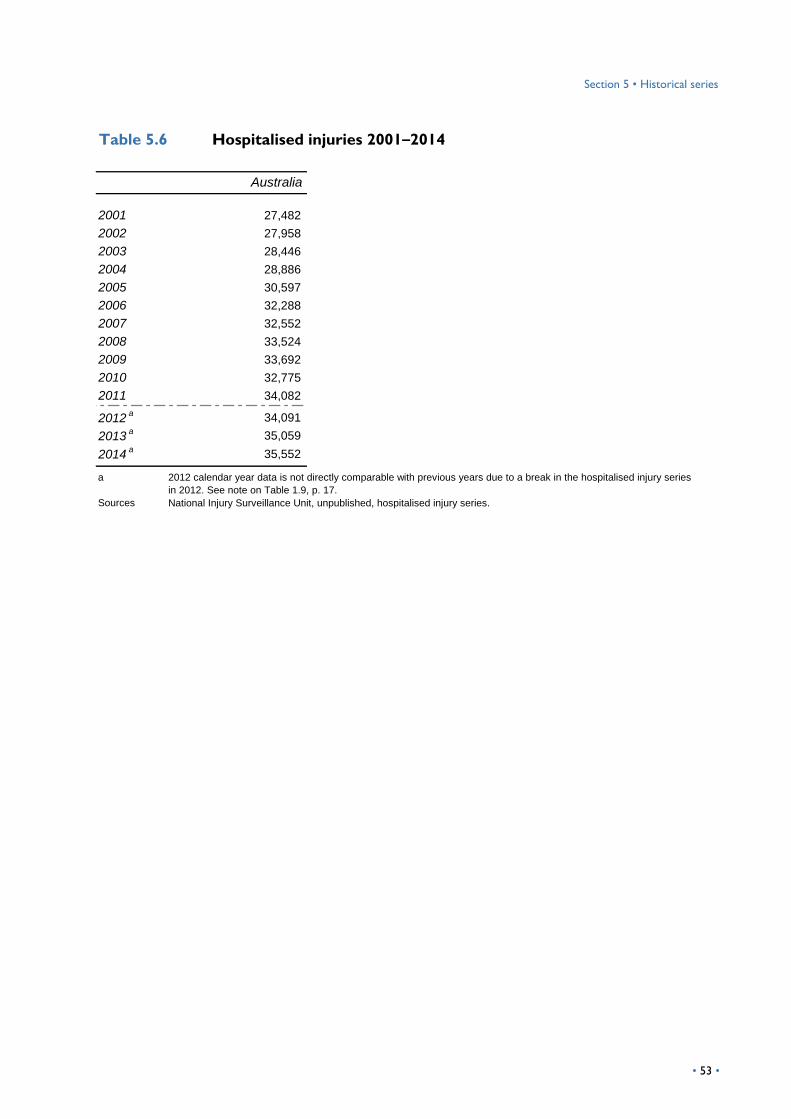
Section 5 • Historical series
Table 5.6 Hospitalised injuries 2001–2014
2001 27,482
2002 27,958
2003 28,446
2004 28,886
2005 30,597
2006 32,288
2007 32,552
2008 33,524
2009 33,692
2010 32,775
2011 34,082
2012a 34,091
2013a 35,059
2014a
35,552
a 2012 calendar year data is not directly comparable with previous years due to a break in the hospitalised injury series
in 2012. See note on Table 1.9, p. 17.
Sources National Injury Surveillance Unit, unpublished, hospitalised injury series.
Australia
• 53 •
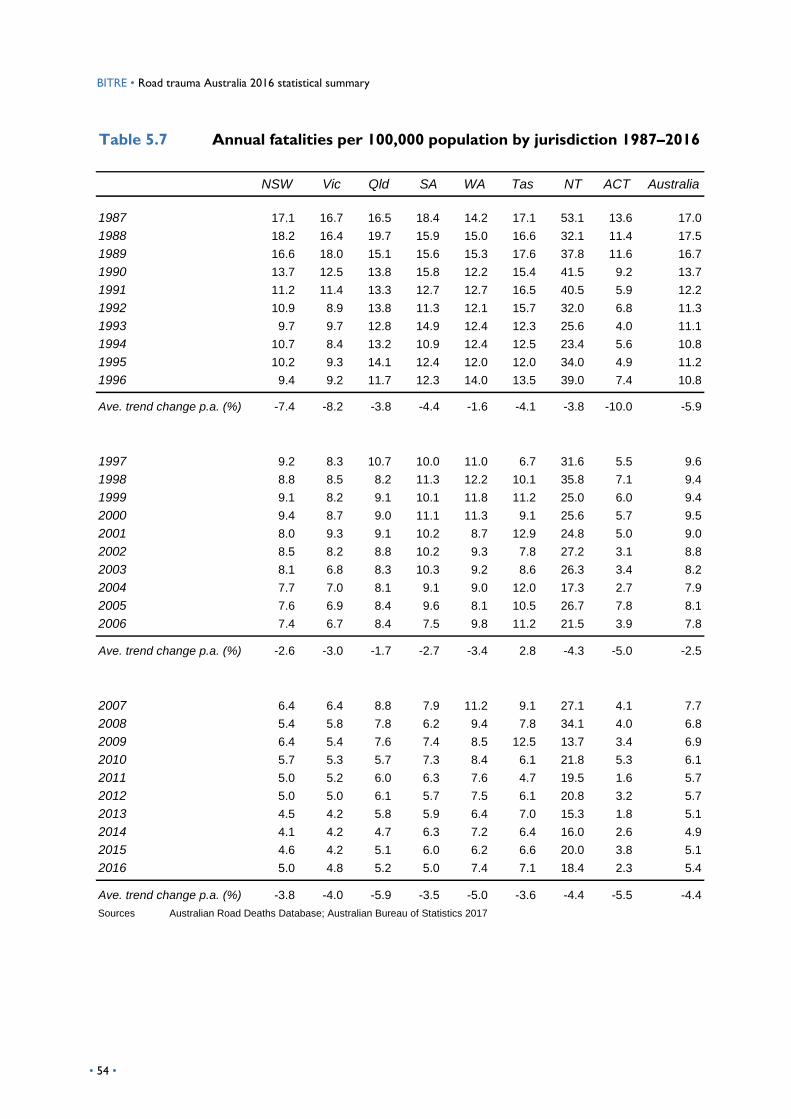
eeBITRE • Road trauma Australia 2016 statistical summary
Table 5.7 Annual fatalities per 100,000 population by jurisdiction 1987–2016
NSW Vic Qld SA WA Tas NT ACT Australia
1987 17.1 16.7 16.5 18.4 14.2 17.1 53.1 13.6 17.0
1988 18.2 16.4 19.7 15.9 15.0 16.6 32.1 11.4 17.5
1989 16.6 18.0 15.1 15.6 15.3 17.6 37.8 11.6 16.7
1990 13.7 12.5 13.8 15.8 12.2 15.4 41.5 9.2 13.7
1991 11.2 11.4 13.3 12.7 12.7 16.5 40.5 5.9 12.2
1992 10.9 8.9 13.8 11.3 12.1 15.7 32.0 6.8 11.3
1993 9.7 9.7 12.8 14.9 12.4 12.3 25.6 4.0 11.1
1994 10.7 8.4 13.2 10.9 12.4 12.5 23.4 5.6 10.8
1995 10.2 9.3 14.1 12.4 12.0 12.0 34.0 4.9 11.2
1996 9.4 9.2 11.7 12.3 14.0 13.5 39.0 7.4 10.8
Ave. trend change p.a. (%) -7.4 -8.2 -3.8 -4.4 -1.6 -4.1 -3.8 -10.0 -5.9
1997 9.2 8.3 10.7 10.0 11.0 6.7 31.6 5.5 9.6
1998 8.8 8.5 8.2 11.3 12.2 10.1 35.8 7.1 9.4
1999 9.1 8.2 9.1 10.1 11.8 11.2 25.0 6.0 9.4
2000 9.4 8.7 9.0 11.1 11.3 9.1 25.6 5.7 9.5
2001 8.0 9.3 9.1 10.2 8.7 12.9 24.8 5.0 9.0
2002 8.5 8.2 8.8 10.2 9.3 7.8 27.2 3.1 8.8
2003 8.1 6.8 8.3 10.3 9.2 8.6 26.3 3.4 8.2
2004 7.7 7.0 8.1 9.1 9.0 12.0 17.3 2.7 7.9
2005 7.6 6.9 8.4 9.6 8.1 10.5 26.7 7.8 8.1
2006 7.4 6.7 8.4 7.5 9.8 11.2 21.5 3.9 7.8
Ave. trend change p.a. (%) -2.6 -3.0 -1.7 -2.7 -3.4 2.8 -4.3 -5.0 -2.5
2007 6.4 6.4 8.8 7.9 11.2 9.1 27.1 4.1 7.7
2008 5.4 5.8 7.8 6.2 9.4 7.8 34.1 4.0 6.8
2009 6.4 5.4 7.6 7.4 8.5 12.5 13.7 3.4 6.9
2010 5.7 5.3 5.7 7.3 8.4 6.1 21.8 5.3 6.1
2011 5.0 5.2 6.0 6.3 7.6 4.7 19.5 1.6 5.7
2012 5.0 5.0 6.1 5.7 7.5 6.1 20.8 3.2 5.7
2013 4.5 4.2 5.8 5.9 6.4 7.0 15.3 1.8 5.1
2014 4.1 4.2 4.7 6.3 7.2 6.4 16.0 2.6 4.9
2015 4.6 4.2 5.1 6.0 6.2 6.6 20.0 3.8 5.1
2016 5.0 4.8 5.2 5.0 7.4 7.1 18.4 2.3 5.4
Ave. trend change p.a. (%) -3.8 -4.0 -5.9 -3.5 -5.0 -3.6 -4.4 -5.5 -4.4
Sources Australian Road Deaths Database; Australian Bureau of Statistics 2017
eee• 54 •
• 55 •
SECTION 6 Exposure series
This section presents longer time series of exposure data.
During the ten years to 2016, Australia’s population increased by 15.9 per cent. By jurisdiction,
the increments ranged from 5.2 per cent (for Tasmania) to 24.3 per cent (for Western Australia).
Over the last 30 years, Australia’s population increased by 48.4 per cent. Queensland’s and
Western Australia’s populations increased the most (81 per cent and 75 per cent respectively)
(Table 6.1, p. 56).
By age group, the population of people aged 40 years and over, increased during the ten years
to 2016 by 19.2 per cent. For people aged under 40 years, the increment was 13.0 per cent.
Over 30 years the population of people aged 40 years and over increased by 89.7 per cent, and
for the younger age group, the increment was 24.6 per cent (Table 6.2, p. 57).
During the last ten years, the count of total vehicle registrations increased by 24 per cent.
Passenger car registrations increased by 20 per cent, motorcycle registrations increased by
62 per cent and light commercial vehicle registrations increased by 36 per cent. In the last 30
years, registered vehicles increased by 96.2 per cent: registrations of Light Commercial vehicles
increased by 149 per cent and Motorcycles increased by 136 per cent (Table 6.3, p. 58).
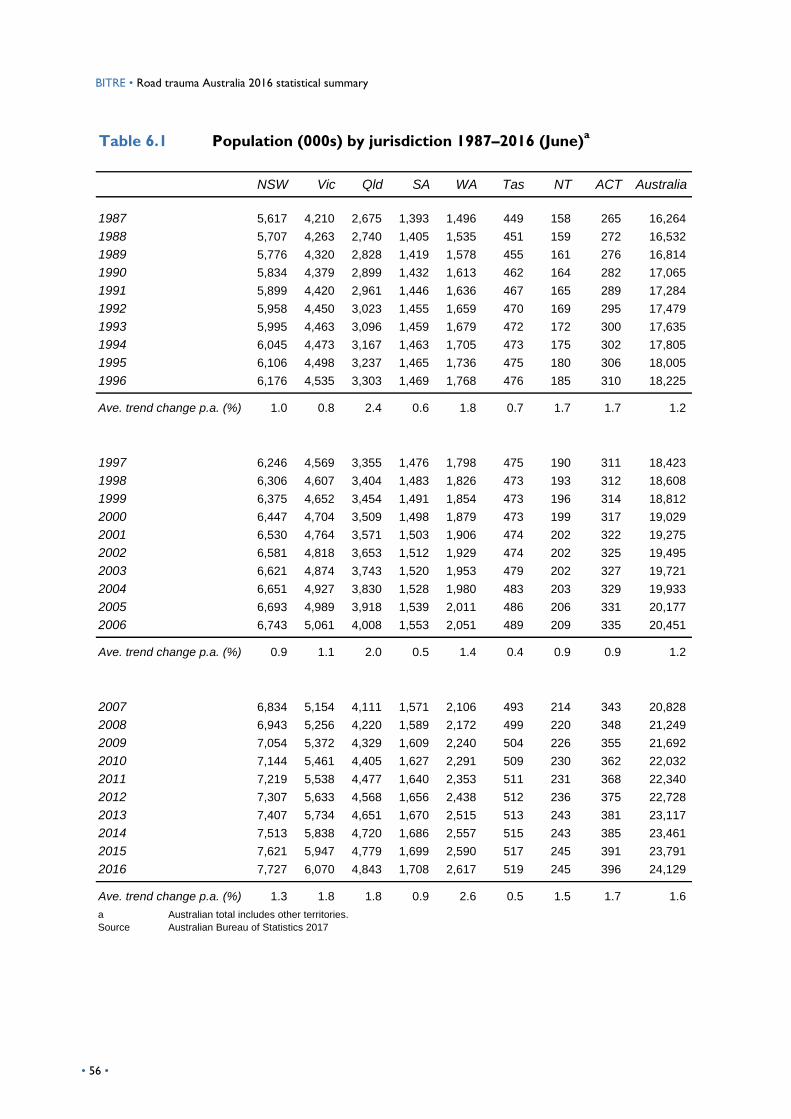
BITRE • Road trauma Australia 2016 statistical summary
Table 6.1 Population (000s) by jurisdiction 1987–2016 (June)a
NSW Vic Qld SA WA Tas NT ACT Australia
1987 5,617 4,210 2,675 1,393 1,496 449 158 265 16,264
1988 5,707 4,263 2,740 1,405 1,535 451 159 272 16,532
1989 5,776 4,320 2,828 1,419 1,578 455 161 276 16,814
1990 5,834 4,379 2,899 1,432 1,613 462 164 282 17,065
1991 5,899 4,420 2,961 1,446 1,636 467 165 289 17,284
1992 5,958 4,450 3,023 1,455 1,659 470 169 295 17,479
1993 5,995 4,463 3,096 1,459 1,679 472 172 300 17,635
1994 6,045 4,473 3,167 1,463 1,705 473 175 302 17,805
1995 6,106 4,498 3,237 1,465 1,736 475 180 306 18,005
1996 6,176 4,535 3,303 1,469 1,768 476 185 310 18,225
Ave. trend change p.a. (%) 1.0 0.8 2.4 0.6 1.8 0.7 1.7 1.7 1.2
1997 6,246 4,569 3,355 1,476 1,798 475 190 311 18,423
1998 6,306 4,607 3,404 1,483 1,826 473 193 312 18,608
1999 6,375 4,652 3,454 1,491 1,854 473 196 314 18,812
2000 6,447 4,704 3,509 1,498 1,879 473 199 317 19,029
2001 6,530 4,764 3,571 1,503 1,906 474 202 322 19,275
2002 6,581 4,818 3,653 1,512 1,929 474 202 325 19,495
2003 6,621 4,874 3,743 1,520 1,953 479 202 327 19,721
2004 6,651 4,927 3,830 1,528 1,980 483 203 329 19,933
2005 6,693 4,989 3,918 1,539 2,011 486 206 331 20,177
2006 6,743 5,061 4,008 1,553 2,051 489 209 335 20,451
Ave. trend change p.a. (%) 0.9 1.1 2.0 0.5 1.4 0.4 0.9 0.9 1.2
2007 6,834 5,154 4,111 1,571 2,106 493 214 343 20,828
2008 6,943 5,256 4,220 1,589 2,172 499 220 348 21,249
2009 7,054 5,372 4,329 1,609 2,240 504 226 355 21,692
2010 7,144 5,461 4,405 1,627 2,291 509 230 362 22,032
2011 7,219 5,538 4,477 1,640 2,353 511 231 368 22,340
2012 7,307 5,633 4,568 1,656 2,438 512 236 375 22,728
2013 7,407 5,734 4,651 1,670 2,515 513 243 381 23,117
2014 7,513 5,838 4,720 1,686 2,557 515 243 385 23,461
2015 7,621 5,947 4,779 1,699 2,590 517 245 391 23,791
2016 7,727 6,070 4,843 1,708 2,617 519 245 396 24,129
Ave. trend change p.a. (%) 1.3 1.8 1.8 0.9 2.6 0.5 1.5 1.7 1.6
a Australian total includes other territories.
Source Australian Bureau of Statistics 2017
h • 56 •
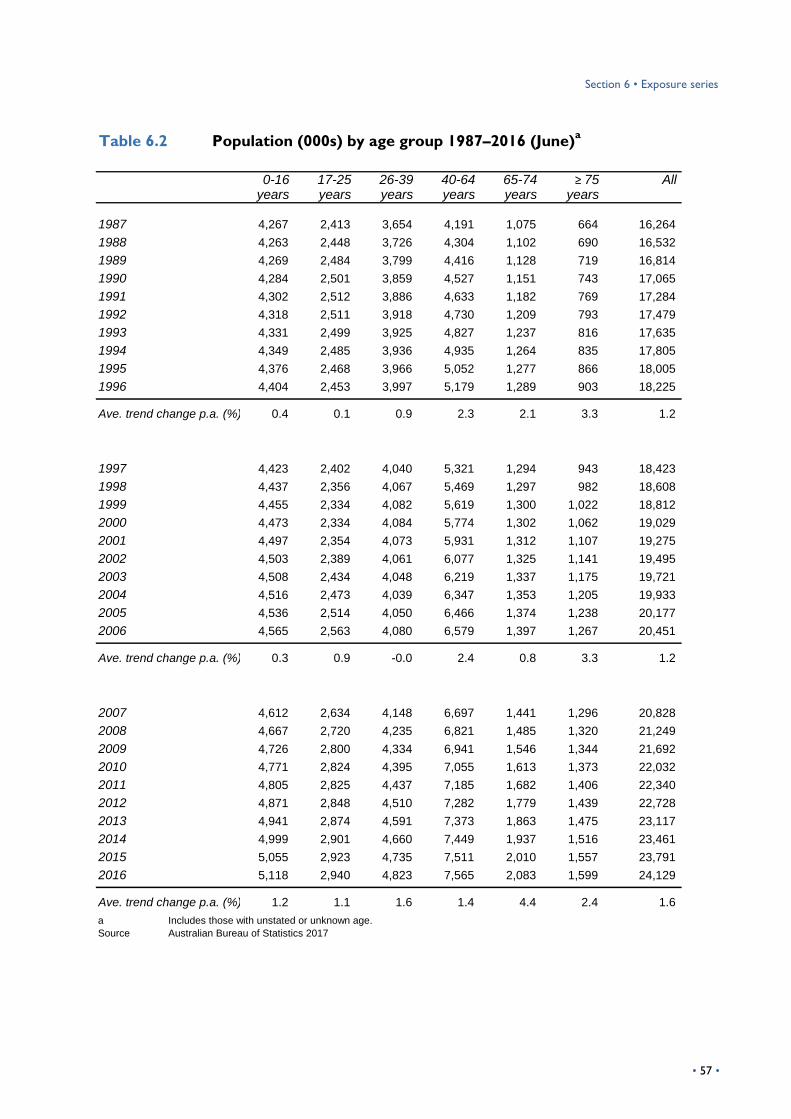
Section 6 • Exposure series
Table 6.2 Population (000s) by age group 1987–2016 (June)a
0-16 17-25 26-39 40-64 65-74 ≥ 75 Allyears years years years years years
1987 4,267 2,413 3,654 4,191 1,075 664 16,264
1988 4,263 2,448 3,726 4,304 1,102 690 16,532
1989 4,269 2,484 3,799 4,416 1,128 719 16,814
1990 4,284 2,501 3,859 4,527 1,151 743 17,065
1991 4,302 2,512 3,886 4,633 1,182 769 17,284
1992 4,318 2,511 3,918 4,730 1,209 793 17,479
1993 4,331 2,499 3,925 4,827 1,237 816 17,635
1994 4,349 2,485 3,936 4,935 1,264 835 17,805
1995 4,376 2,468 3,966 5,052 1,277 866 18,005
1996 4,404 2,453 3,997 5,179 1,289 903 18,225
Ave. trend change p.a. (%) 0.4 0.1 0.9 2.3 2.1 3.3 1.2
1997 4,423 2,402 4,040 5,321 1,294 943 18,423
1998 4,437 2,356 4,067 5,469 1,297 982 18,608
1999 4,455 2,334 4,082 5,619 1,300 1,022 18,812
2000 4,473 2,334 4,084 5,774 1,302 1,062 19,029
2001 4,497 2,354 4,073 5,931 1,312 1,107 19,275
2002 4,503 2,389 4,061 6,077 1,325 1,141 19,495
2003 4,508 2,434 4,048 6,219 1,337 1,175 19,721
2004 4,516 2,473 4,039 6,347 1,353 1,205 19,933
2005 4,536 2,514 4,050 6,466 1,374 1,238 20,177
2006 4,565 2,563 4,080 6,579 1,397 1,267 20,451
Ave. trend change p.a. (%) 0.3 0.9 -0.0 2.4 0.8 3.3 1.2
2007 4,612 2,634 4,148 6,697 1,441 1,296 20,828
2008 4,667 2,720 4,235 6,821 1,485 1,320 21,249
2009 4,726 2,800 4,334 6,941 1,546 1,344 21,692
2010 4,771 2,824 4,395 7,055 1,613 1,373 22,032
2011 4,805 2,825 4,437 7,185 1,682 1,406 22,340
2012 4,871 2,848 4,510 7,282 1,779 1,439 22,728
2013 4,941 2,874 4,591 7,373 1,863 1,475 23,117
2014 4,999 2,901 4,660 7,449 1,937 1,516 23,461
2015 5,055 2,923 4,735 7,511 2,010 1,557 23,791
2016 5,118 2,940 4,823 7,565 2,083 1,599 24,129
Ave. trend change p.a. (%) 1.2 1.1 1.6 1.4 4.4 2.4 1.6
a Includes those with unstated or unknown age.
Source Australian Bureau of Statistics 2017
• 57 •
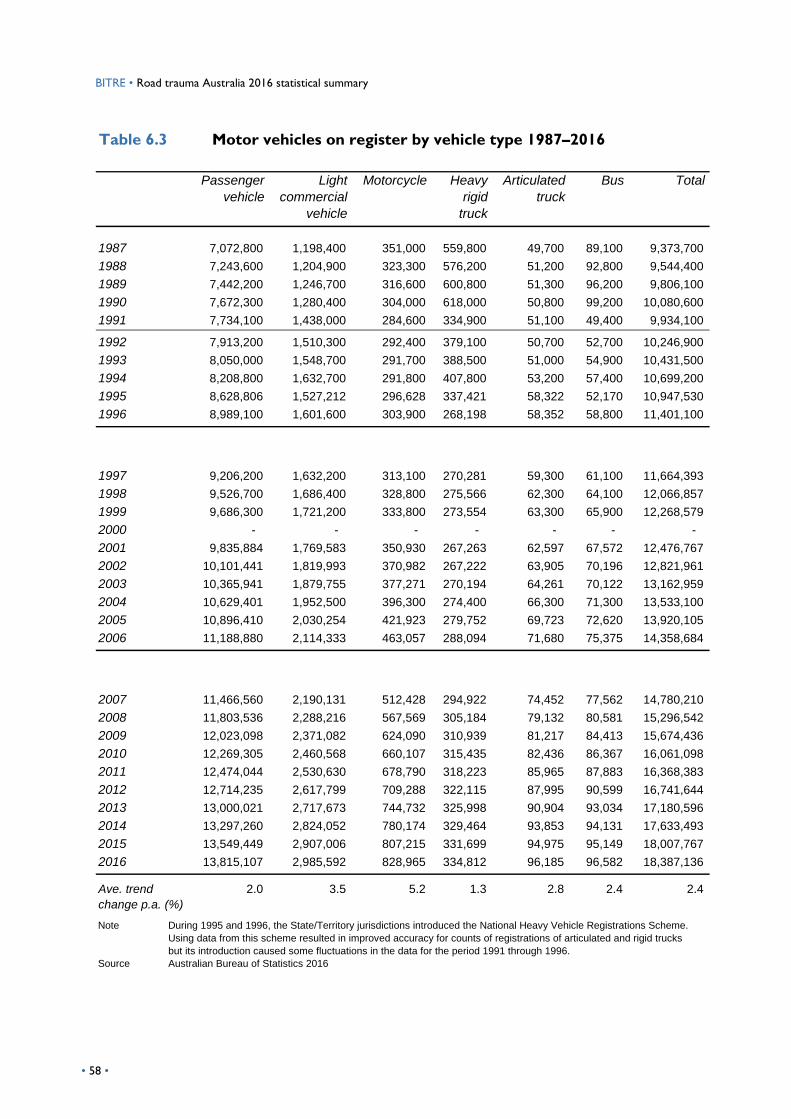
BITRE • Road trauma Australia 2016 statistical summary
Table 6.3 Motor vehicles on register by vehicle type 1987–2016
Light
commercial
vehicle
Motorcycle Heavy
rigid
truck
Articulated
truck
Bus Total
1987 7,072,800 1,198,400 351,000 559,800 49,700 89,100 9,373,700
1988 7,243,600 1,204,900 323,300 576,200 51,200 92,800 9,544,400
1989 7,442,200 1,246,700 316,600 600,800 51,300 96,200 9,806,100
1990 7,672,300 1,280,400 304,000 618,000 50,800 99,200 10,080,600
1991 7,734,100 1,438,000 284,600 334,900 51,100 49,400 9,934,100
1992 7,913,200 1,510,300 292,400 379,100 50,700 52,700 10,246,900
1993 8,050,000 1,548,700 291,700 388,500 51,000 54,900 10,431,500
1994 8,208,800 1,632,700 291,800 407,800 53,200 57,400 10,699,200
1995 8,628,806 1,527,212 296,628 337,421 58,322 52,170 10,947,530
1996 8,989,100 1,601,600 303,900 268,198 58,352 58,800 11,401,100
1997 9,206,200 1,632,200 313,100 270,281 59,300 61,100 11,664,393
1998 9,526,700 1,686,400 328,800 275,566 62,300 64,100 12,066,857
1999 9,686,300 1,721,200 333,800 273,554 63,300 65,900 12,268,579
2000 - - - - - - -
2001 9,835,884 1,769,583 350,930 267,263 62,597 67,572 12,476,767
2002 10,101,441 1,819,993 370,982 267,222 63,905 70,196 12,821,961
2003 10,365,941 1,879,755 377,271 270,194 64,261 70,122 13,162,959
2004 10,629,401 1,952,500 396,300 274,400 66,300 71,300 13,533,100
2005 10,896,410 2,030,254 421,923 279,752 69,723 72,620 13,920,105
2006 11,188,880 2,114,333 463,057 288,094 71,680 75,375 14,358,684
2007 11,466,560 2,190,131 512,428 294,922 74,452 77,562 14,780,210
2008 11,803,536 2,288,216 567,569 305,184 79,132 80,581 15,296,542
2009 12,023,098 2,371,082 624,090 310,939 81,217 84,413 15,674,436
2010 12,269,305 2,460,568 660,107 315,435 82,436 86,367 16,061,098
2011 12,474,044 2,530,630 678,790 318,223 85,965 87,883 16,368,383
2012 12,714,235 2,617,799 709,288 322,115 87,995 90,599 16,741,644
2013 13,000,021 2,717,673 744,732 325,998 90,904 93,034 17,180,596
2014 13,297,260 2,824,052 780,174 329,464 93,853 94,131 17,633,493
2015 13,549,449 2,907,006 807,215 331,699 94,975 95,149 18,007,767
2016 13,815,107 2,985,592 828,965 334,812 96,185 96,582 18,387,136
Ave. trend 2.0 3.5 5.2 1.3 2.8 2.4 2.4
change p.a. (%)
Note During 1995 and 1996, the State/Territory jurisdictions introduced the National Heavy Vehicle Registrations Scheme.
Using data from this scheme resulted in improved accuracy for counts of registrations of articulated and rigid trucks
but its introduction caused some fluctuations in the data for the period 1991 through 1996.
Source Australian Bureau of Statistics 2016
Passenger
vehicle
h • 58 •
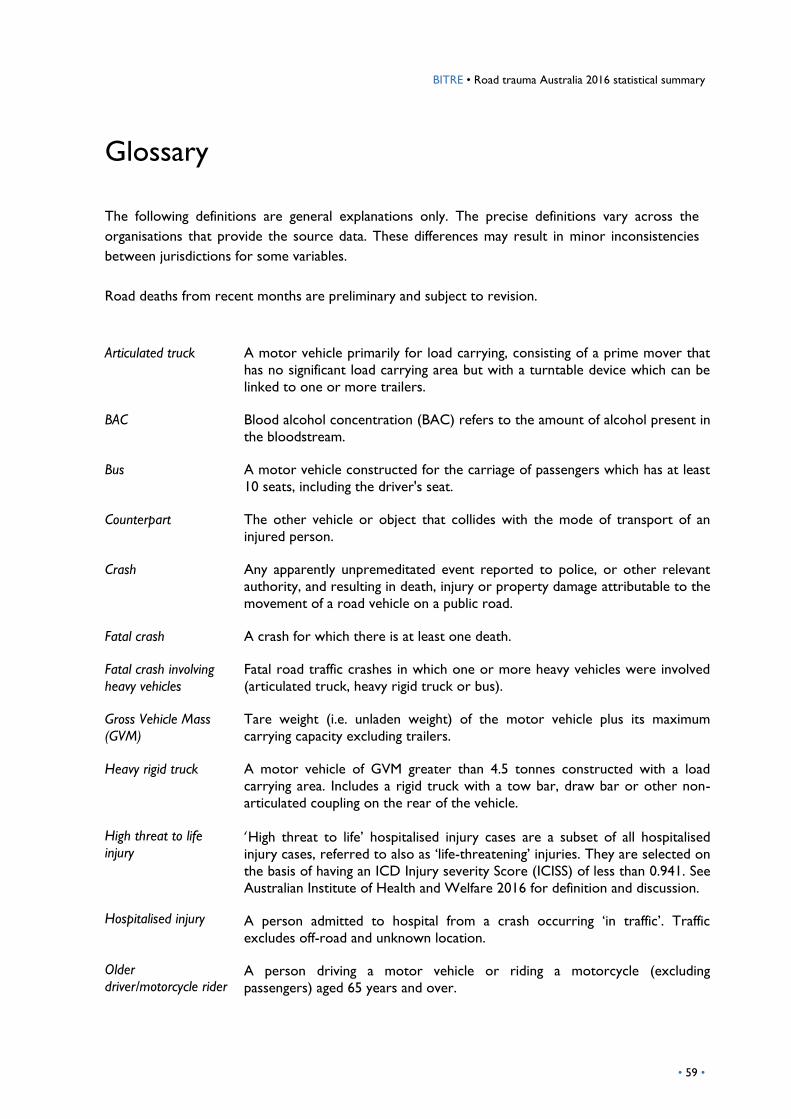
BITRE • Road trauma Australia 2016 statistical summary
• 59 •
Glossary
The following definitions are general explanations only. The precise definitions vary across the
organisations that provide the source data. These differences may result in minor inconsistencies
between jurisdictions for some variables.
Road deaths from recent months are preliminary and subject to revision.
Articulated truck A motor vehicle primarily for load carrying, consisting of a prime mover that
has no significant load carrying area but with a turntable device which can be
linked to one or more trailers.
BAC Blood alcohol concentration (BAC) refers to the amount of alcohol present in
the bloodstream.
Bus A motor vehicle constructed for the carriage of passengers which has at least
10 seats, including the driver's seat.
Counterpart The other vehicle or object that collides with the mode of transport of an
injured person.
Crash Any apparently unpremeditated event reported to police, or other relevant
authority, and resulting in death, injury or property damage attributable to the
movement of a road vehicle on a public road.
Fatal crash A crash for which there is at least one death.
Fatal crash involving
heavy vehicles
Fatal road traffic crashes in which one or more heavy vehicles were involved
(articulated truck, heavy rigid truck or bus).
Gross Vehicle Mass
(GVM)
Tare weight (i.e. unladen weight) of the motor vehicle plus its maximum
carrying capacity excluding trailers.
Heavy rigid truck A motor vehicle of GVM greater than 4.5 tonnes constructed with a load
carrying area. Includes a rigid truck with a tow bar, draw bar or other non-
articulated coupling on the rear of the vehicle.
High threat to life
injury
Hospitalised injury
Older
driver/motorcycle rider
‘High threat to life’ hospitalised injury cases are a subset of all hospitalised
injury cases, referred to also as ‘life-threatening’ injuries. They are selected on
the basis of having an ICD Injury severity Score (ICISS) of less than 0.941. See
Australian Institute of Health and Welfare 2016 for definition and discussion.
A person admitted to hospital from a crash occurring ‘in traffic’. Traffic
excludes off-road and unknown location.
A person driving a motor vehicle or riding a motorcycle (excluding
passengers) aged 65 years and over.
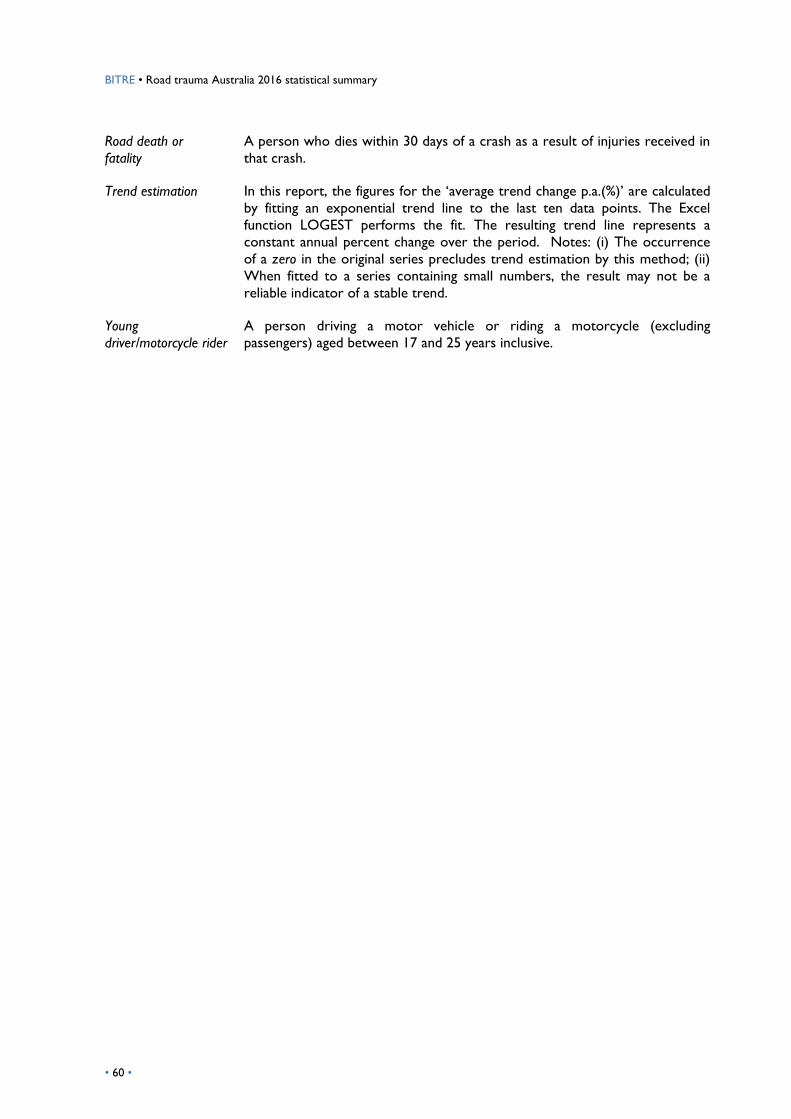
BITRE • Road trauma Australia 2016 statistical summary
• 60 •
Road death or
fatality
A person who dies within 30 days of a crash as a result of injuries received in
that crash.
Trend estimation
In this report, the figures for the ‘average trend change p.a.(%)’ are calculated
by fitting an exponential trend line to the last ten data points. The Excel
function LOGEST performs the fit. The resulting trend line represents a
constant annual percent change over the period. Notes: (i) The occurrence
of a zero in the original series precludes trend estimation by this method; (ii)
When fitted to a series containing small numbers, the result may not be a
reliable indicator of a stable trend.
Young
driver/motorcycle rider
A person driving a motor vehicle or riding a motorcycle (excluding
passengers) aged between 17 and 25 years inclusive.
BITRE • Road trauma Australia 2016 statistical summary
• 61 •
References
Australian Bureau of Statistics 2013, Australian Statistical Geography Standard (ASGS): Volume 5 –
Remoteness Structure Cat No 1270.0.55.005, Volume 4– Significant Urban Areas, Urban Centres and
Localities, Section of State Cat No 1270.0.55.004, July 2011 July 2011.
Australian Bureau of Statistics 2016, Motor Vehicle Census, July 2016 Cat No 9309.0.
Australian Bureau of Statistics 2017, Australian Demographic Statistics, September 2016,
Cat No 3101.0.
Australian Bureau of Statistics 2017b, Regional Population Growth, Australia, 2015-16, March 2017 Cat
No 3218.0
Australian Institute of Health and Welfare 2016, Henley G & Harrison JE, Trends in serious injury due
to road vehicle traffic crashes, Australia 2001 to 2010. Injury research and statistics series no. 89, Cat.
no. INJCAT 165. Canberra.
Bureau of Infrastructure, Transport and Regional Economics (BITRE) unpublished, State and capital
city vehicle kilometres travelled October 2016.


