
ROLE OF GAS IN THE ENERGY MIX
Dr Philippe A. TanguyTotal
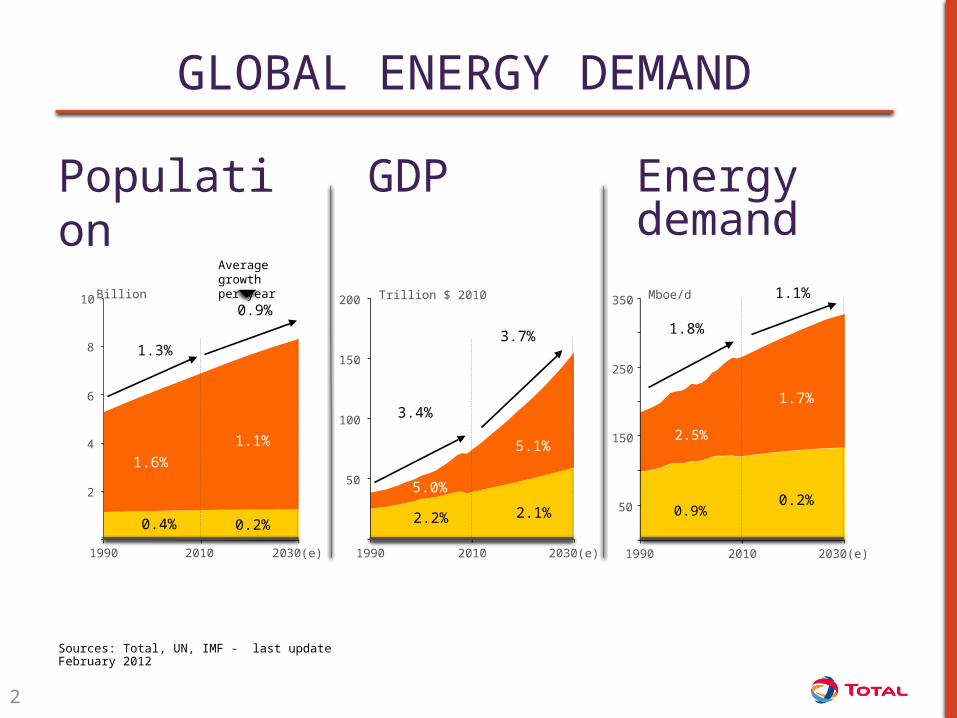
GLOBAL ENERGY DEMAND
Sources: Total, UN, IMF - last update February 2012
GDP Energydemand
Average growthper year
0.9%
2
4
6
8
10
1990 2010 2030(e)
Billion
1.1%
0.2%
1.3%
1.6%
0.4%
Trillion $ 2010
50
100
150
200
1990 2010 2030(e)
3.7%
5.1%
2.1%2.2%
5.0%
3.4%
50
150
250
350
1990 2010 2030(e)
Mboe/d 1.1%
1.8%
1.7%
0.2%
2.5%
0.9%
Population
2

Gas to become the second largest energy source by 2030
EVOLUTION OF ENERGY MIX
Total estimations
3

VERY SIGNIFICANT RESOURCES
Oil resources Natural gas resources
Conventional gas mainly in Russia, Iran and QatarShale gas development in the US
Transport and liquefaction constraints to development of isolated gas resources
Conventional oil mainly in the Middle EastExtra-heavy oil mainly in Canada and Venezuela
~3000 bboe
Non conventional resources
Extra-heavy oils
New discoveries and enhanced oil recovery
Known resources
33 yrs production at present rates
50 yr
100 yr
70 yr
~3000 bboe (16.000 Tcf)
55 yrs production at present rates
80 yr
145 yr
Already producted
Total estimations
4

ENERGY CONSUMPTION TRENDS
Sources: IEA5

2010-2020 EVOLUTION OF GAS MARKET
6
Total estimations
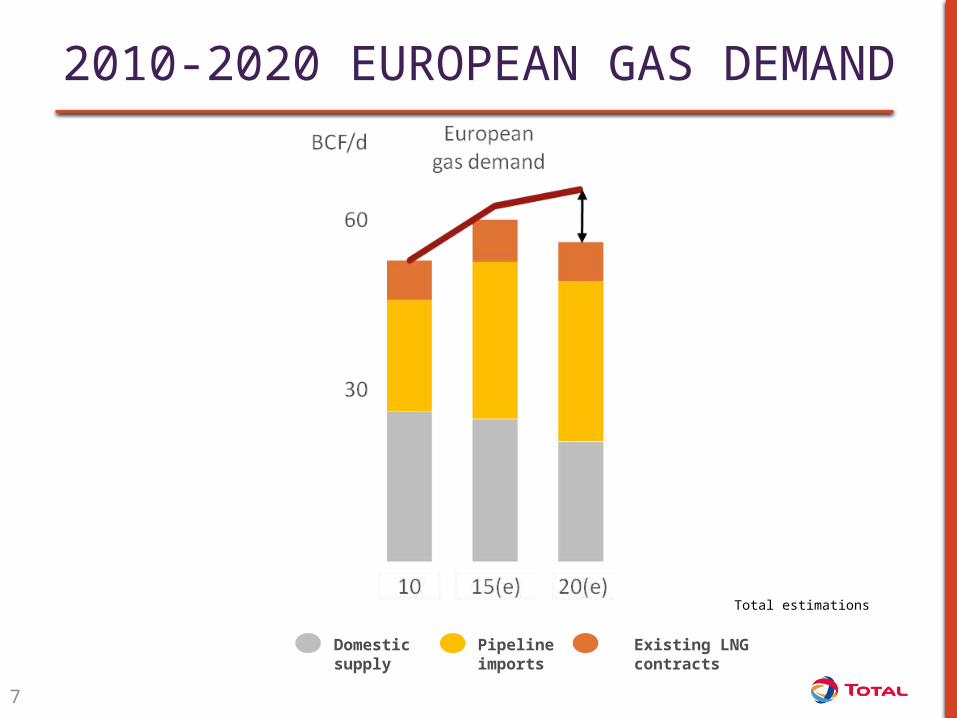
Domestic supply
Pipeline imports
Existing LNG contracts
2010-2020 EUROPEAN GAS DEMAND
7
Total estimations

0
50
100
150
200
250
300
350
400
450
500
Coal bed methane* Tight gas* Shale gas*
EuropeAmérique LatineCEIAfriqueMoyen OrientAmérique du NordAsie
VERY LARGE NON CONVENTIONAL GAS RESOURCES POTENTIAL
Sources: Total, IEA, CERA
Non conventional gas resourcesBillions boe
Potential constraints : geological structures, production costs, environment, logistics
Latin America
Africa
Middle East
North America
Asia
Europe
CEI
8

UNCONVENTIONAL GAS A REAL RESOURCE IN THE FUTURE EUROPEAN ENERGY LANDSCAPE?
Dr Philippe A. TanguyTotal

10
RESOURCE TYPOLOGY
Sources: IFPEN

COAL BED METHANE
CBM production (Shell Document)
11

SHALE GAS PRODUCTION
1,000+ m horizontal
Water fracs with sand
5-20 fracs per well
10-20 km3 water/well
30-70% water flowback
12
Sources: MIT

IMPACT MANAGEMENT
13
Sources: MIT

IMPLEMENTING BEST PRACTICES
IEA 2011
14

Sources: MIT
SHALE GAS RESOURCE WORLDWIDE
15

16
PRODUCTION OF GAS IN 2035
Sources: IEA


