
Confederation of Indian Industry Management Consultants
Knowledge Partner
14International Conference and Exposition on Textiles & Apparel
15 - 16 October 2014: New Delhi
THEME PAPER
ROLE OF INDIAN TEXTILE ANDAPPAREL INDUSTRY IN CHANGING
GLOBAL SUPPLY-DEMAND SCENARIO

1
Table of Contents Foreword ....................................................................................................................................................... 2
1. Global Apparel Market – Present and Future ....................................................................................... 3
1.1. Global Apparel Consumption ............................................................................................................ 3
1.2. Chinese and Indian Apparel Market ................................................................................................. 4
1.3. Future Projections ............................................................................................................................. 5
2. Global Trade in Textiles and Apparel .................................................................................................... 7
2.1. Historical Trade Pattern .................................................................................................................... 7
2.2. Major Exporter and Importer Nations .............................................................................................. 7
2.3. Key Categories ................................................................................................................................... 9
3. Indian Textile and Apparel Sector Scenario ........................................................................................ 10
3.1. Manufacturing ................................................................................................................................ 11
3.2. Domestic Market............................................................................................................................. 13
3.3. International Trade ......................................................................................................................... 18
3.4. SWOT Analysis ................................................................................................................................. 21
4. Emerging Changes in Global Trade Scenario ...................................................................................... 25
4.1. Higher Growth of Synthetic Fibre based Categories ....................................................................... 25
4.2. Supply Base Consolidation by Buyers ............................................................................................. 27
4.3. Trade Agreements to Play an Important Role ................................................................................ 29
5. Way Ahead .......................................................................................................................................... 33
About Confederation of Indian Industries (CII) ........................................................................................... 34
About Wazir Advisor ................................................................................................................................... 35
2
Foreword
Texcon 2014 is the 3rd textile and apparel sector conference organized by Confederation of Indian
Industries (CII) in consecutive years. Since the first conference in 2012, Texcon has come a long
distance. Today it is positioned as one of the premier events in Indian textile and apparel sector
which is joined by decision makers from private as well as government sector. Since its inception, the
conference has not restricted itself to being a single day event. Deliberations held in Texcon have
always been taken forward to Government and industry fora for further action. Wazir Advisors,
which has been associated with Texcon as a Knowledge Partner since the first edition, has been
instrumental in supporting CII for representing the issues and recommendations. This differentiating
factor has brought immense support and appreciation to Texcon from all industry stakeholders. In
2014, Texcon has grown in its scope and format as well – the conference proceedings will span 2
days and it will also feature a trade exhibition.
The present time in itself is vibrant. With a stable central government and receding macroeconomic
problems at global level, the country is in what we can call a propulsion phase. Textile and apparel
sector is no different. The optimism in sector should soon start getting converted to actual business.
India textile and apparel sector can, and needs to, play an increasingly larger role in country’s
economic growth by generating employment and through exports. The challenges for textile and
apparel sector nonetheless have not eliminated. On domestic front issues related to manpower and
procedural delay need urgent attention, while globally new nations are emerging in the list of largest
suppliers due to their FTAs and lower manufacturing costs.
It is in this setting that a relevant theme for Texcon 2014 has been chosen viz. ‘Role of Indian Textile
and Apparel Sector in Changing Global Supply-Demand Scenario’. This whitepaper on the conference
theme has been prepared by Wazir Advisors, which should act as the initiator for discussions to
come out with appropriate and implementable recommendations.
We look forward to have your active participation and welcome your invaluable inputs.
D. L. Sharma Director Conference Chairman, CII Texcon 2014 & Director Vardhman Textiles
Prakash Bhagwati Conference Co-Chairman, CII Texcon 2014 & Chairman InspirOn Engineering Pvt. Ltd. (Conference Co-Chairman)
Prashant Agarwal Joint Managing Director Wazir Advisors (Knowledge Partner)

3
1. Global Apparel Market – Present and Future
1.1. Global Apparel Consumption
The current global apparel market is estimated at approximately US$ 1.15 trillion which forms
nearly 1.8% of the world GDP. Almost 75% of this market is concentrated in EU-27, USA, China
and Japan. The next largest markets are Brazil, India, Russia, Canada and Australia, in
descending order with a share of approximately 18%.
Table 1: Global Apparel Market Size in 2013 (In US$ Bn.)
S. No. Region Market Size
1 EU-27 355
2 United States 230
3 China 165
4 Japan 110
5 Brazil 60
6 India 46
7 Russia 45
8 Canada 30
9 Australia 25
10 Rest of the world 80
Total 1,146
Source: Wazir Advisors
Within the top markets, there is a major distinction between developed countries and the
emerging ones in terms of per capita spend on apparel. The lowest per capita spend on
apparel among these markets is of India (US$ 37) which is only 4% of the highest one viz.
Australia (US$ 1,131).
Figure 1: Per Capita Spend on Apparel in 2013 (In US$)
Source: Wazir Advisors
37 122 163
287 300
703 725
885 887
1,131
India China Global Brazil Russia EU-27 USA Japan Canada Australia

4
1.2. Chinese and Indian Apparel Market
The present apparel market size of China and India are estimated to be US$ 165 billion and US$
46 billion, respectively. Both markets have shown robust growth, despite global uncertainties
and slackened demand. From 2009 to 2013, the Chinese market has registered a CAGR of 13%
whereas the Indian market registered a growth of 10%. Both the markets have performed
better than other major consumption regions viz. USA, EU and Japan.
Figure 2: Growth of Chinese and Indian Apparel Market (In US$ bn.)
Source: Wazir Advisors
Very often, comparisons are drawn between the markets of China and India; but it is interesting
to note that per capita spend on apparel in India is only one-third of that in China. From 2009 to
2013, the per capita apparel spend in China grew at CAGR of 13% and reached US$ 122 by
2013. During the same period in India, the growth rate registered was approximately 9% and
reached US$ 37.
Figure 3: Change in per Capita Spend on Apparel by Chinese and Indian Consumers (In US$)
Source: Wazir Advisors
The Chinese and Indian apparel markets are also different in terms of market segmentation into
men’s, women’s and kid’s wear. In China, women’s wear is the largest category whereas in
India it is the men’s wear. In fact, India is the only major apparel market where women’s wear
101 120
141 150
165
31 35 40 45 46
2009 2010 2011 2012 2013
China India
76 89
101 109 122
26 29 32 35 37
2009 2010 2011 2012 2013
China
India13%
9%
13% CAGR
10% CAGR

5
is not the largest category in value terms. The reason behind this anomaly is the fact that
women’s wear in India is largely dominated by traditional, unbranded dresses which in value
terms are lower than men’s wear products, despite having larger volumes overall.
Figure 4: Chinese and Indian Apparel Market Segmentation
Source: Wazir Advisors
1.3. Future Projections
There is a positive correlation between consumer’s spending on various categories and the
economic stature of each country. In lesser developed economies, consumer’s spending is
highest on food followed by clothing, housing and other items. In developed economies, as the
consumer’s disposable income increases, the share of basic categories such as apparel reduces,
whereas the share of new categories like entertainment, recreation, consumer durables, travel,
etc. increases. Though in absolute value terms, the spending on clothing will not go down, but
the increase will be slower than the overall increase in disposable income. This behavior in an
aggregate form causes per capita spend on clothing to rise faster initially and slow down later.
In developed economies, this growth slows down or stagnates, while in value terms the
spending on apparel continues to grow. Based on this fact, it is expected that the per capita
spend on apparel will grow at a faster rate than the economy in Brazil, Russia, India and China;
whereas it will be slower or at par with the economic growth in developed markets over next
few years. When the population base of China and India is taken into account; one can see the
enormous growth in consumption in both these countries.
48% 35%
32% 40%
29% 25%
China India
Women's wear
Men's wear
Kid's wear

6
Figure 5: Change in Per Capita Spend on Apparel from 2013 to 2025 (In US$)
Source: Wazir Advisors
The projected growth in per capita apparel spend and population will cause the world apparel
market to grow at a CAGR of approx. 5% and attaining a size of approx. US$ 2.1 trillion by 2025.
Table 2: Apparel Market Size Projections from 2013 to 2025 (In US$ billion)
Region 2013 2025 CAGR
EU-27 355 440 2%
USA 230 285 2%
China 165 540 10%
Japan 110 150 2%
Brazil 60 100 5%
India 46 200 12%
Russia 45 105 8%
Canada 30 50 4%
Australia 25 45 5%
Rest of the world 80 195 8%
Total 1,146 2,110 5%
Source: Wazir Advisors
It is expected that by 2025, the cumulative size of Indian and Chinese markets will be higher
than that of USA and EU.
1,131
887 885
725 703
300 287
122 37
1,709
1,265 1,149
817 841 756
460 383
129
Australia Canada Japan USA EU-27 Russia Brazil China India
2013 2025

7
2. Global Trade in Textiles and Apparel
2.1. Historical Trade Pattern
The global trade of textile and apparel was worth US$ 781 billion in 2013. This is approximately
4.6% of the trade of all commodities which is estimated at ~US$ 17 trillion. From 2008 to 2013,
the global textile and apparel trade has grown at a rate of 4% per annum.
Figure 6: Global Trade of Textile and Apparel (In US$ Bn.)
Data Source: UN Comtrade
2.2. Major Exporter and Importer Nations
The top 5 textile and apparel exporting nations are China, India, Italy, Germany and Turkey.
China, the largest exporter, has a share of 39% while India stood at a distant second place with
5% share.
Figure 7: Major Exporting Nations (2013)
Data Source: UN Comtrade
The European nations, in general, are seeing a decline in their textile and apparel exports.
Germany’s exports has remained unchanged from 2008 to 2013, whereas Italy’s exports have
declined at a CAGR of -2% in the same period. India has emerged as the fastest growing large
643 558
642 751 728
781
2008 2009 2010 2011 2012 2013
China, 39% India, 5%
Italy, 5%
Germany, 4%
Turkey, 4%
USA, 3%
Bangladesh, 3% Viet Nam, 3%
Others, 33%
4% CAGR

8
exporter nation from 2008 to 2013. Its trade increased at a CAGR of 12% while China registered
growth of 7% CAGR in the said period.
Table 3: Historical Trade Pattern of Top 5 Exporting Nations
(In US$ Bn.) 2008 2009 2010 2011 2012 2013 CAGR
China & HK 219 193 234 275 278 304 7%
India 23 22 27 33 33 40 12%
Germany 35 31 33 38 35 35 -
Italy 40 31 32 37 34 36 -2%
USA 23 18 24 29 27 27 3% Data Source: UN Comtrade
The top 5 textile and apparel importing nations are USA, China, Germany, Japan and United
Kingdom. USA is the single largest importer with a share of approx. 17% of the total global
trade.
Figure 8: Major Markets (2013)
Source: Wazir Estimates based on UN Comtrade data
India’s share in several major apparel markets is quite low. An analysis of major apparel
importing nations of the world indicates that in several countries the India’s apparel exports is
negligible. The table below shows the major apparel importing nations where India’s share is
very low:
USA, 17% China, 9%
Germany, 8%
Japan, 7%
United Kingdom, 5%
France, 4%
Italy, 4%
Others, 47%
9
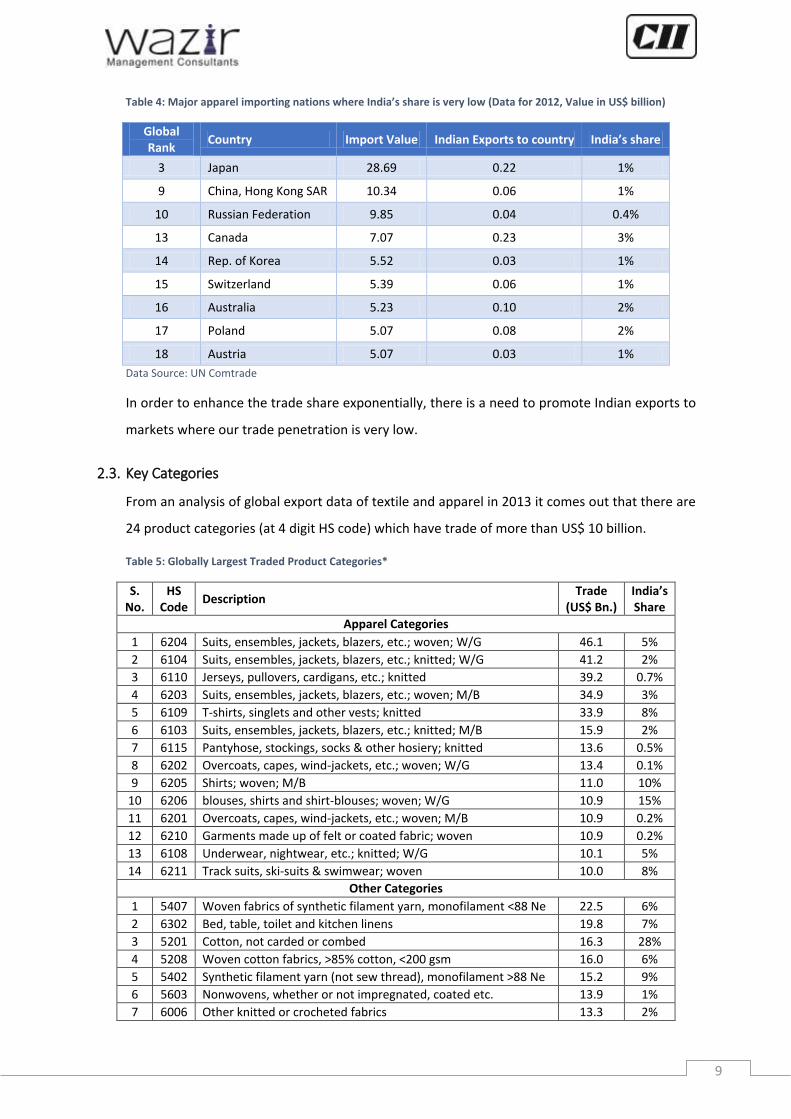
Table 4: Major apparel importing nations where India’s share is very low (Data for 2012, Value in US$ billion)
Global Rank
Country Import Value Indian Exports to country India’s share
3 Japan 28.69 0.22 1%
9 China, Hong Kong SAR 10.34 0.06 1%
10 Russian Federation 9.85 0.04 0.4%
13 Canada 7.07 0.23 3%
14 Rep. of Korea 5.52 0.03 1%
15 Switzerland 5.39 0.06 1%
16 Australia 5.23 0.10 2%
17 Poland 5.07 0.08 2%
18 Austria 5.07 0.03 1%
Data Source: UN Comtrade
In order to enhance the trade share exponentially, there is a need to promote Indian exports to
markets where our trade penetration is very low.
2.3. Key Categories
From an analysis of global export data of textile and apparel in 2013 it comes out that there are
24 product categories (at 4 digit HS code) which have trade of more than US$ 10 billion.
Table 5: Globally Largest Traded Product Categories*
S. No.
HS Code
Description Trade
(US$ Bn.) India’s Share
Apparel Categories
1 6204 Suits, ensembles, jackets, blazers, etc.; woven; W/G 46.1 5%
2 6104 Suits, ensembles, jackets, blazers, etc.; knitted; W/G 41.2 2%
3 6110 Jerseys, pullovers, cardigans, etc.; knitted 39.2 0.7%
4 6203 Suits, ensembles, jackets, blazers, etc.; woven; M/B 34.9 3%
5 6109 T-shirts, singlets and other vests; knitted 33.9 8%
6 6103 Suits, ensembles, jackets, blazers, etc.; knitted; M/B 15.9 2%
7 6115 Pantyhose, stockings, socks & other hosiery; knitted 13.6 0.5%
8 6202 Overcoats, capes, wind-jackets, etc.; woven; W/G 13.4 0.1%
9 6205 Shirts; woven; M/B 11.0 10%
10 6206 blouses, shirts and shirt-blouses; woven; W/G 10.9 15%
11 6201 Overcoats, capes, wind-jackets, etc.; woven; M/B 10.9 0.2%
12 6210 Garments made up of felt or coated fabric; woven 10.9 0.2%
13 6108 Underwear, nightwear, etc.; knitted; W/G 10.1 5%
14 6211 Track suits, ski-suits & swimwear; woven 10.0 8%
Other Categories
1 5407 Woven fabrics of synthetic filament yarn, monofilament <88 Ne 22.5 6%
2 6302 Bed, table, toilet and kitchen linens 19.8 7%
3 5201 Cotton, not carded or combed 16.3 28%
4 5208 Woven cotton fabrics, >85% cotton, <200 gsm 16.0 6%
5 5402 Synthetic filament yarn (not sew thread), monofilament >88 Ne 15.2 9%
6 5603 Nonwovens, whether or not impregnated, coated etc. 13.9 1%
7 6006 Other knitted or crocheted fabrics 13.3 2%
10
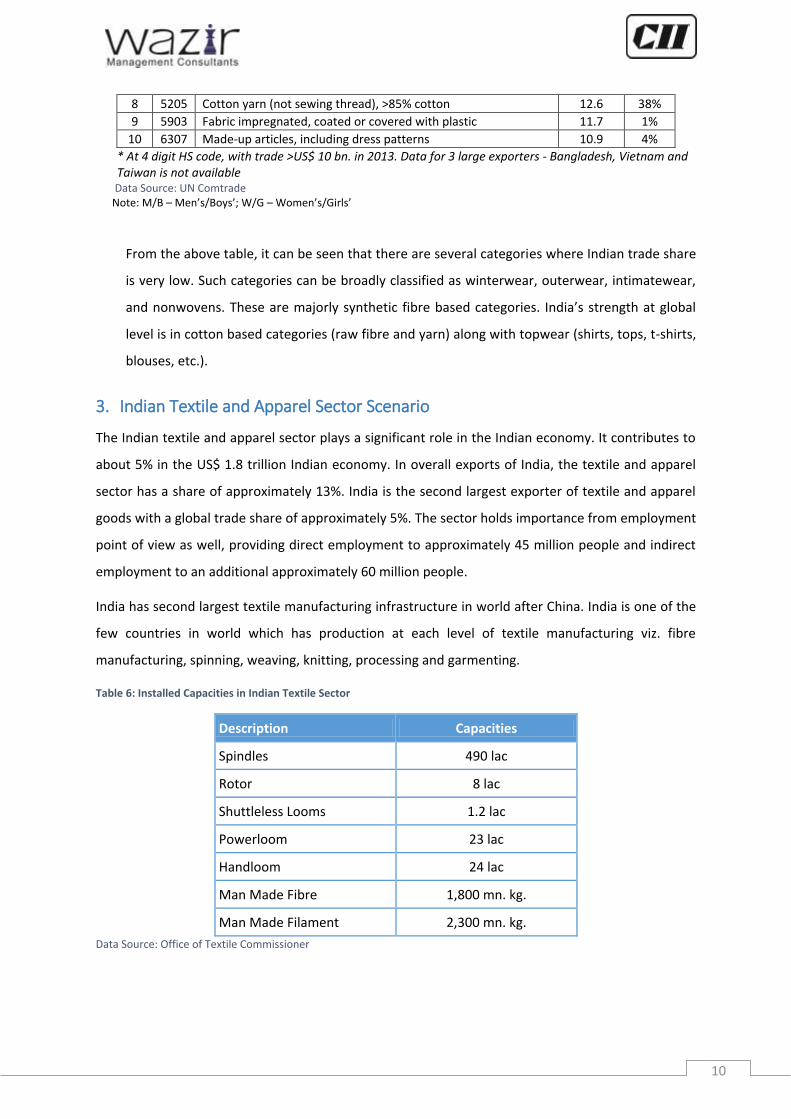
8 5205 Cotton yarn (not sewing thread), >85% cotton 12.6 38%
9 5903 Fabric impregnated, coated or covered with plastic 11.7 1%
10 6307 Made-up articles, including dress patterns 10.9 4%
* At 4 digit HS code, with trade >US$ 10 bn. in 2013. Data for 3 large exporters - Bangladesh, Vietnam and Taiwan is not available Data Source: UN Comtrade Note: M/B – Men’s/Boys’; W/G – Women’s/Girls’
From the above table, it can be seen that there are several categories where Indian trade share
is very low. Such categories can be broadly classified as winterwear, outerwear, intimatewear,
and nonwovens. These are majorly synthetic fibre based categories. India’s strength at global
level is in cotton based categories (raw fibre and yarn) along with topwear (shirts, tops, t-shirts,
blouses, etc.).
3. Indian Textile and Apparel Sector Scenario
The Indian textile and apparel sector plays a significant role in the Indian economy. It contributes to
about 5% in the US$ 1.8 trillion Indian economy. In overall exports of India, the textile and apparel
sector has a share of approximately 13%. India is the second largest exporter of textile and apparel
goods with a global trade share of approximately 5%. The sector holds importance from employment
point of view as well, providing direct employment to approximately 45 million people and indirect
employment to an additional approximately 60 million people.
India has second largest textile manufacturing infrastructure in world after China. India is one of the
few countries in world which has production at each level of textile manufacturing viz. fibre
manufacturing, spinning, weaving, knitting, processing and garmenting.
Table 6: Installed Capacities in Indian Textile Sector
Description Capacities
Spindles 490 lac
Rotor 8 lac
Shuttleless Looms 1.2 lac
Powerloom 23 lac
Handloom 24 lac
Man Made Fibre 1,800 mn. kg.
Man Made Filament 2,300 mn. kg.
Data Source: Office of Textile Commissioner

11
3.1. Manufacturing
3.1.1 Fibre and Filament Production
Raw material availability is one of the key strengths of the Indian textile sector. India is
counted among the largest producer, consumer and exporter of several natural and synthetic
fibre. At an overall level India produces about 11 million tons of fibre and filaments annually.
The data in table that follows indicates that the fibre and filament production in India has
grown at a CAGR of 3% over last 5-years. A closer look at the statistics reveal that Cotton is the
only major fibre which has grown to some extent. The production of manmade filament yarn
and fibres, at consolidated level, in last 5 years has shown de-growth or stagnancy.
Table 7: Indian Fibre and Filament Production
(In Million Kg) 2009-10 2010-11 2011-12 2012-13 2013-14 (P) CAGR
Staple Fibre:
Cotton 5,185 5,763 6,001 6,205 6,375 5%
Jute 1,620 1,800 1,845 1,674 1,620 0%
Polyester 872 896 830 848 846 -1%
Viscose 302 305 323 337 361 5%
Acrylic 90 79 78 74 96 2%
Wool 43 43 44 44 49 3%
Polypropylene 3 4 4 4 4 7%
Subtotal 8,115 8,890 9,125 9,186 9,351 4%
Filament:
Polyester 1,434 1,462 1,380 1,288 1,213 -4%
Viscose 43 41 42 43 44 1%
Silk 20 20 23 24 26 7%
Nylon 30 33 28 23 24 -5%
Polypropylene 15 13 13 17 13 -4%
Subtotal 1,542 1,569 1,486 1,395 1,320 -4%
Grand Total 9,657 10,459 10,611 10,581 10,671 3% Data Source: Cotton Corporation of India; Textile Statistics & Official Indian Textile Statistics 2012-13, Office of Textile Commissioner; Central Silk Board; Ministry of Agriculture; Jute Advisory Board
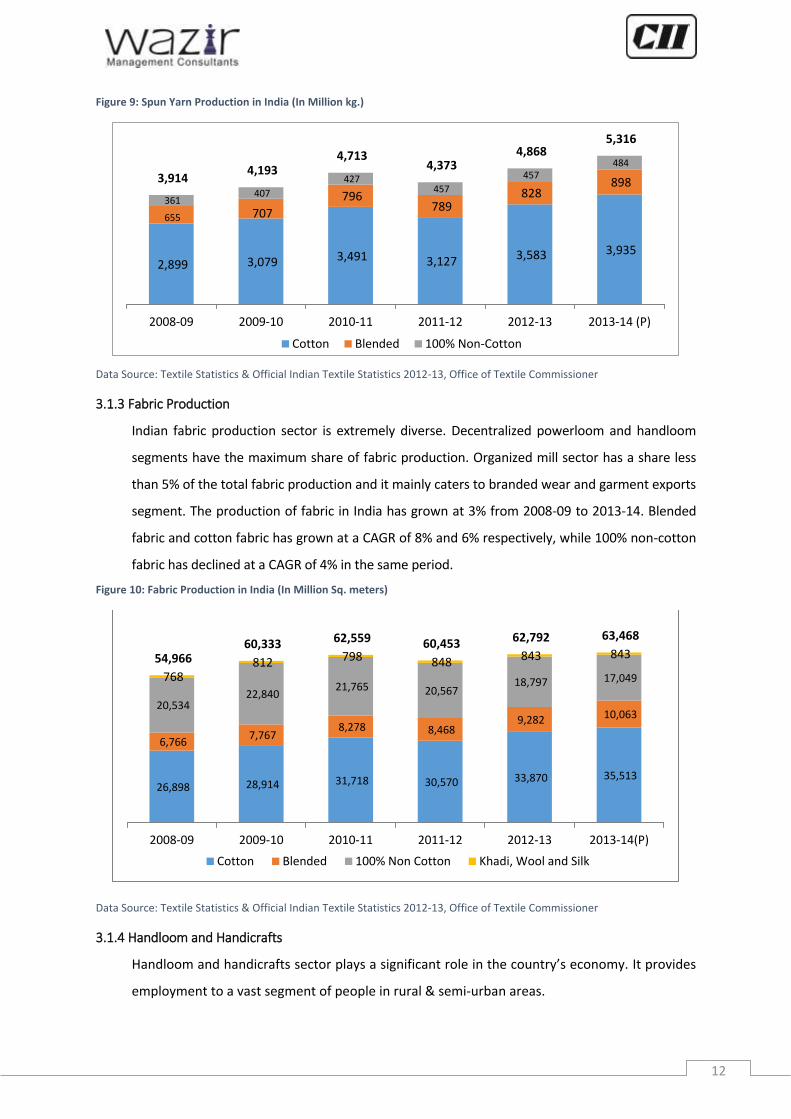
3.1.2 Spun Yarn Production
Spinning is a matured textile sub-segment in India. India is a leading spun yarn producer in the
world and also the most cost competitive producer. The production of spun yarn in India has
increased from 3,914 million kg. in 2008-09 to 5,316 million kg. in the year 2013-14 at a CAGR of
6%. Approximately 75% of the total spun yarn produced in India is 100% cotton yarn.
12
Figure 9: Spun Yarn Production in India (In Million kg.)
Data Source: Textile Statistics & Official Indian Textile Statistics 2012-13, Office of Textile Commissioner
3.1.3 Fabric Production
Indian fabric production sector is extremely diverse. Decentralized powerloom and handloom
segments have the maximum share of fabric production. Organized mill sector has a share less
than 5% of the total fabric production and it mainly caters to branded wear and garment exports
segment. The production of fabric in India has grown at 3% from 2008-09 to 2013-14. Blended
fabric and cotton fabric has grown at a CAGR of 8% and 6% respectively, while 100% non-cotton
fabric has declined at a CAGR of 4% in the same period.
Figure 10: Fabric Production in India (In Million Sq. meters)
Data Source: Textile Statistics & Official Indian Textile Statistics 2012-13, Office of Textile Commissioner
3.1.4 Handloom and Handicrafts
Handloom and handicrafts sector plays a significant role in the country’s economy. It provides
employment to a vast segment of people in rural & semi-urban areas.
2,899 3,079 3,491 3,127 3,583 3,935
655 707
796 789
828 898
361 407
427 457
457 484
3,914 4,193
4,713 4,373
4,868 5,316
2008-09 2009-10 2010-11 2011-12 2012-13 2013-14 (P)
Cotton Blended 100% Non-Cotton
26,898 28,914 31,718 30,570 33,870 35,513
6,766 7,767
8,278 8,468 9,282 10,063
20,534 22,840
21,765 20,567 18,797 17,049 768
812 798 848 843 843 54,966 60,333 62,559 60,453 62,792 63,468
2008-09 2009-10 2010-11 2011-12 2012-13 2013-14(P)
Cotton Blended 100% Non Cotton Khadi, Wool and Silk

13
The handloom industry provides direct and indirect employment to 7 million people. The
sector contributes 95% to the world’s hand woven fabric production. In 2013-14, Indian
handloom industry produced 7,116 million square meter fabric which accounted for 11% of
the total fabric production in the country. However, the production of hand woven fabric has
remained almost stagnant in last few years.
Handicrafts contribute substantially to employment generation and exports. The sector is
estimated to employ about 8 million artisans. The exports of handicrafts including handmade
carpet is US$ 3,885 million in 2013-14, growing at a CAGR of 21% for last five years.
3.2. Domestic Market
Indian domestic consumption of textile and apparel is estimated at US$ 63 bn. in 2013. Within
this, apparel retail contributes US$ 46 bn., technical textiles contribute US$ 13 bn. and home
textiles contribute US$ 4 bn.
Figure 11: Indian Domestic Textile and Apparel Consumption (2013)
Source: Wazir Advisors
3.2.1 Apparel Market
The present apparel market size of India is estimated to be US$ 46. Since 2007, the market has
grown at a CAGR of 11% despite global uncertainties and slack international demand.
Figure 12: Historical Growth of Indian Apparel Market (In US$ bn.)
Source: Wazir Advisors
Indian Domestic Textile & Apparel Market
US$ 63 billion
Apparel
US$ 46 billion
Home Textiles
US$ 4 billion
Technical Textiles
US$ 13 billion
25 27 31
35 40
45 46
2007 2008 2009 2010 2011 2012 2013
11% CAGR

14
In terms of segmentation, Indian Apparel market is dominated by men’s wear which has a
majority share of approx. 40%. Women’s wear comes next with a share of approx. 35%
followed by kid’s wear which has a share of approx. 25%.
Figure 13: Indian Apparel Market Segmentation
Source: Wazir Advisors
Within India, North, West and South are larger consumption bases owing to higher per capita
income, affluence level and propensity to spend. Climatic conditions also play a critical role
pushing sales in North, as the region witnesses acute summers as well as acute winters forcing
consumers to maintain a separate wardrobe for each season. An estimate of regional split is
given in table ahead.
Table 8: Region-wise Split of Indian Apparel Consumption
Region Market share
North India 35%
West India 25%
South India 25%
East India 15%
While the Indian consumer’s disposable income and awareness about brands have increased
in recent years, yet the unbranded apparel form the major chunk of market, approx. 70%. The
main reason behind this is the low level of brand penetration in rural parts of India. However,
there is a clear trend of higher growth of branded segment than the unbranded one.
Men's wear 40%
Women's wear 35%
Kid's wear 25%

15
Figure 14: Brand Penetration Level in Indian Market
Source: Wazir Advisors
3.2.2 Home Textiles Market
The current domestic consumption of home textiles is estimated to be ~US$ 4 billion. It has
grown at a CAGR of 12% from 2007 to 2013.
Figure 15: Historical Growth of Indian Home Textiles Market (In US$ bn.)
Source: Wazir Advisors
The home textiles market is dominated by the unorganized sector (95%) which is catered by
small niche players and street markets.
Apparel Market
US$ 46 Bn.
Urban
55%
(US$ 25 Bn.)
Branded
45%
(US$ 11 Bn.)
Unbranded
55%
(US$ 14 Bn.)
Rural
45%
(US$ 21 Bn.)
Branded
10%
(US$ 2 Bn.)
Unbranded
90%
(US$ 19 Bn.)
2
3 3
4 4 4 4
2007 2008 2009 2010 2011 2012 2013
12% CAGR

16
Figure 16: Indian Home Textile Market Structure
Source: Wazir Advisors
In home textiles market, the largest share is of bed linens, followed by curtains, upholstery,
towels, rugs & carpets, blankets and kitchen linen.
Figure 17: Indian Home Textiles Market Segmentation
Source: Wazir Advisors
3.2.3 Technical Textiles Market
The current market size of technical textiles is estimated at approximately US$ 13 billion. It is
growing at 11% per annum from 2007-08 to 2013-14.
Indian Home Textile Market
Organized Market
(5%)
Category Specific
Retailers
Niche Players All Under One Roof (Jagdish
Stores)
General Retailers
Hypermarkets (Big Bazaar, Hypercity)
Departmental Stores
(Lifestyle, ShopperStop)
Unorganized Market
(95%)
Small Niche Players
Street Markets
Bed Linen, 37%
Curtains, 16% Upholstery, 13%
Towels, 11%
Rugs & Carpets, 10%
Blankets, 7%
Kitchen linen, 6%

17
Figure 18: Historical Growth of Indian Technical Textiles Market (In US$ bn.)
Data Source: Baseline Survey of the Technical Textile Industry in India, Office of Textile Commissioner
Note: 1 US$ = Rs. 60
Based on end-user application, the technical textile market is segmented into following 12
categories:
S. No. Category Application
1 Agrotech Agriculture, horticulture and forestry
2 Buildtech Building and construction
3 Clothtech Technical components of shoes and clothing
4 Geotech Geotextiles and civil engineering
5 Hometech Components of furniture, household textiles and floor coverings
6 Indutech Filtration, cleaning and other industrial usage
7 Meditech Hygiene and medical
8 Mobiltech Automobiles, shipping, railways and aerospace
9 Oekotech Environmental protection
10 Packtech Packaging
11 Protech Personal and property protection
12 Sportech Sport and leisure
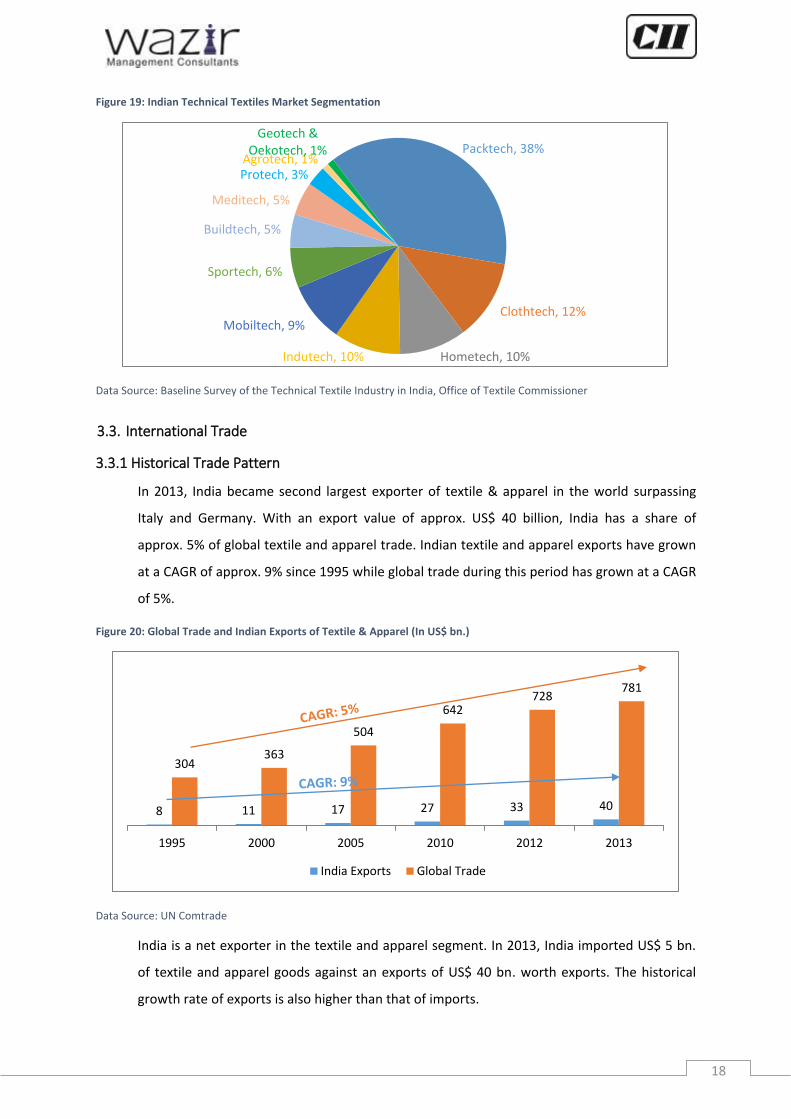
The top five categories of technical textiles, i.e. packtech, clothtech, hometech, indutech and
mobiltech have a combined share of approx. 80% in the market. The other six categories
contributes only 20% in the technical textiles market.
7 8
9 10
11 12
13
2007-08 2008-09 2009-10 2010-11 2011-12 2012-13 2013-14(P)
11% CAGR
18
Figure 19: Indian Technical Textiles Market Segmentation
Data Source: Baseline Survey of the Technical Textile Industry in India, Office of Textile Commissioner
3.3. International Trade
3.3.1 Historical Trade Pattern
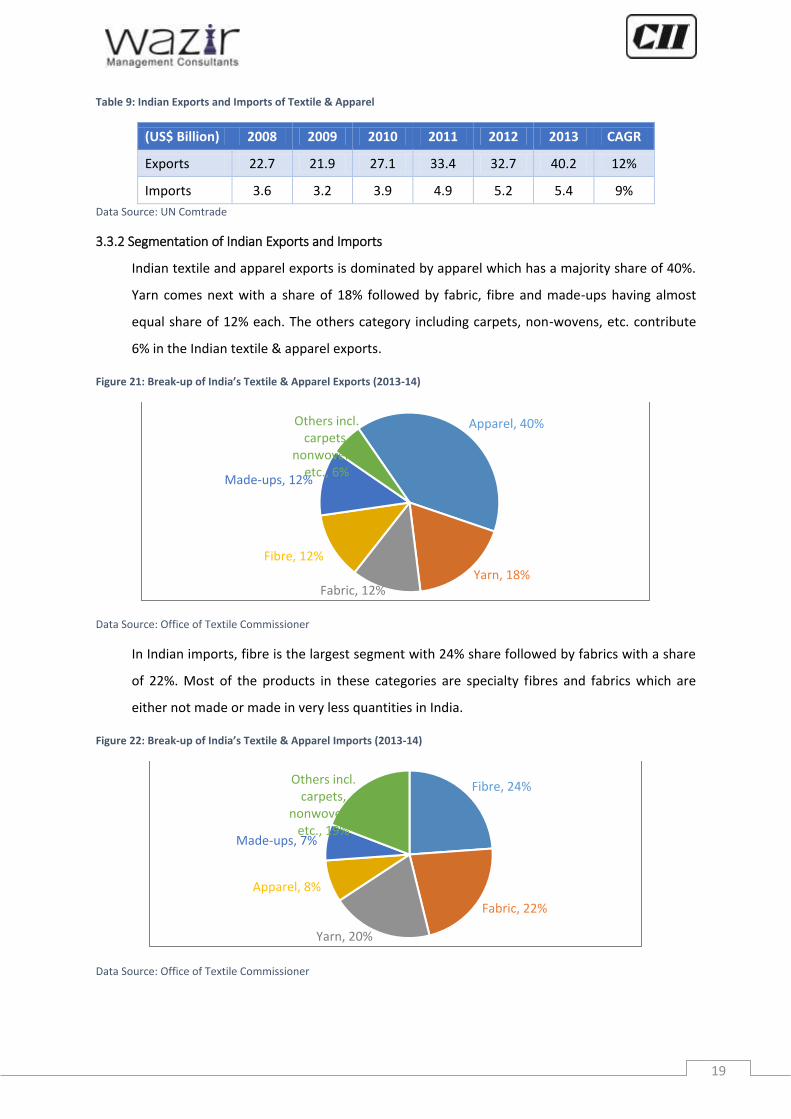
In 2013, India became second largest exporter of textile & apparel in the world surpassing
Italy and Germany. With an export value of approx. US$ 40 billion, India has a share of
approx. 5% of global textile and apparel trade. Indian textile and apparel exports have grown
at a CAGR of approx. 9% since 1995 while global trade during this period has grown at a CAGR
of 5%.
Figure 20: Global Trade and Indian Exports of Textile & Apparel (In US$ bn.)
Data Source: UN Comtrade
India is a net exporter in the textile and apparel segment. In 2013, India imported US$ 5 bn.
of textile and apparel goods against an exports of US$ 40 bn. worth exports. The historical
growth rate of exports is also higher than that of imports.
Packtech, 38%
Clothtech, 12%
Hometech, 10% Indutech, 10%
Mobiltech, 9%
Sportech, 6%
Buildtech, 5%
Meditech, 5%
Protech, 3% Agrotech, 1%
Geotech & Oekotech, 1%
8 11 17 27 33 40
304 363
504
642 728
781
1995 2000 2005 2010 2012 2013
India Exports Global Trade
19
Table 9: Indian Exports and Imports of Textile & Apparel
(US$ Billion) 2008 2009 2010 2011 2012 2013 CAGR
Exports 22.7 21.9 27.1 33.4 32.7 40.2 12%
Imports 3.6 3.2 3.9 4.9 5.2 5.4 9%
Data Source: UN Comtrade
3.3.2 Segmentation of Indian Exports and Imports
Indian textile and apparel exports is dominated by apparel which has a majority share of 40%.
Yarn comes next with a share of 18% followed by fabric, fibre and made-ups having almost
equal share of 12% each. The others category including carpets, non-wovens, etc. contribute
6% in the Indian textile & apparel exports.
Figure 21: Break-up of India’s Textile & Apparel Exports (2013-14)
Data Source: Office of Textile Commissioner
In Indian imports, fibre is the largest segment with 24% share followed by fabrics with a share
of 22%. Most of the products in these categories are specialty fibres and fabrics which are
either not made or made in very less quantities in India.
Figure 22: Break-up of India’s Textile & Apparel Imports (2013-14)
Data Source: Office of Textile Commissioner
Apparel, 40%
Yarn, 18% Fabric, 12%
Fibre, 12%
Made-ups, 12%
Others incl. carpets,
nonwovens, etc., 6%
Fibre, 24%
Fabric, 22%
Yarn, 20%
Apparel, 8%
Made-ups, 7%
Others incl. carpets,
nonwovens, etc., 19%

20
3.3.3 Top Export and Import Partners
India’s leading textile and apparel export partner is USA with a share of 18%. China is the other
major one, which in recent years have started importing significant volumes of fibre and yarn from
India. Bangladesh is also one of the destinations where Indian textile exports have grown in recent
years.
Figure 23: Market-wise segmentation of Indian T&A Exports (2013)
Data Source: UN Comtrade
China is the largest supplier of textile and apparel to India with a share of 47%. The imports from
China are diverse, from fibre to garments all types of products are being imported.
Figure 24: Market-wise segmentation of Indian T&A Imports (2013)
Data Source: UN Comtrade
USA, 18%
China, 14%
UAE , 7%
UK , 6%
Bangladesh, 5%
Germany, 5%
France, 3%
Others, 43%
China, 47%
USA, 5%
Bangladesh, 5%
Taiwan, 4%
Australia, 4%
Rep. of Korea, 3%
Germany, 3% Others, 30%
21
3.4. SWOT Analysis
Strengths:
i. Raw Material Availability
The fundamental strength of the Indian textile industry is its strong production base of wide
range of fibre/ yarns from natural fibres like cotton, jute, silk and wool to synthetic/ manmade
fibres like polyester, viscose, nylon and acrylic.
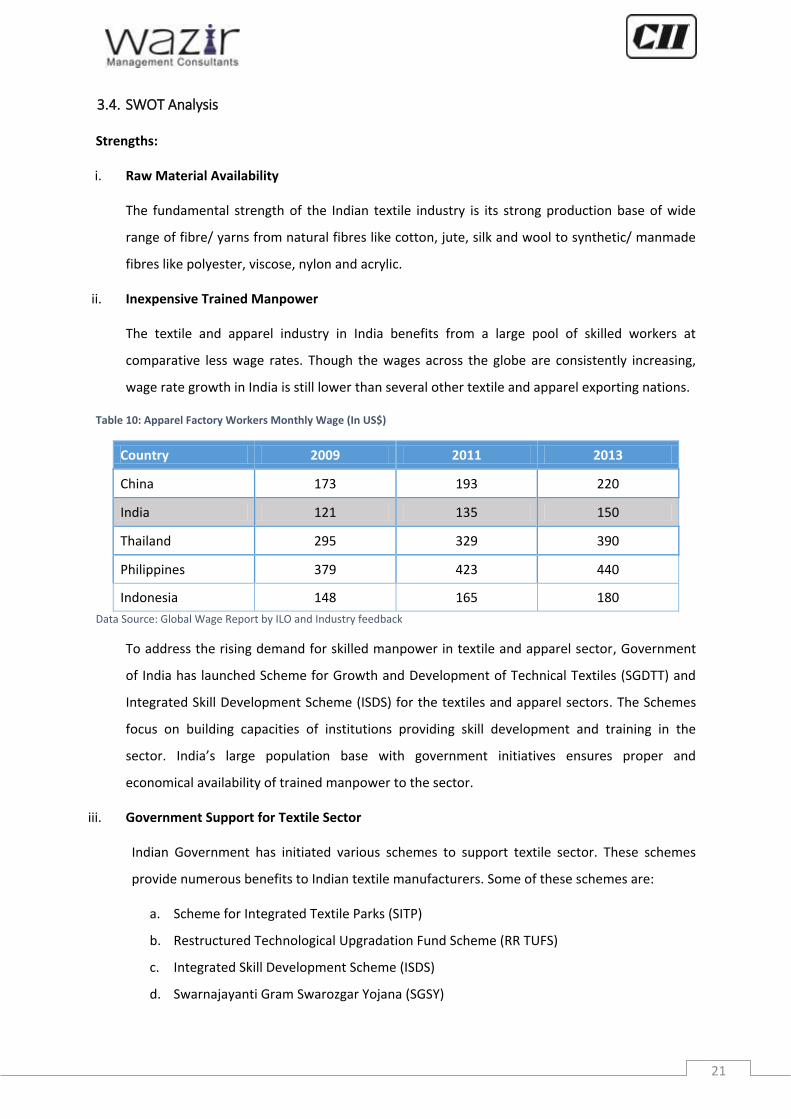
ii. Inexpensive Trained Manpower
The textile and apparel industry in India benefits from a large pool of skilled workers at
comparative less wage rates. Though the wages across the globe are consistently increasing,
wage rate growth in India is still lower than several other textile and apparel exporting nations.
Table 10: Apparel Factory Workers Monthly Wage (In US$)
Country 2009 2011 2013
China 173 193 220
India 121 135 150
Thailand 295 329 390
Philippines 379 423 440
Indonesia 148 165 180
Data Source: Global Wage Report by ILO and Industry feedback
To address the rising demand for skilled manpower in textile and apparel sector, Government
of India has launched Scheme for Growth and Development of Technical Textiles (SGDTT) and
Integrated Skill Development Scheme (ISDS) for the textiles and apparel sectors. The Schemes
focus on building capacities of institutions providing skill development and training in the
sector. India’s large population base with government initiatives ensures proper and
economical availability of trained manpower to the sector.
iii. Government Support for Textile Sector
Indian Government has initiated various schemes to support textile sector. These schemes
provide numerous benefits to Indian textile manufacturers. Some of these schemes are:
a. Scheme for Integrated Textile Parks (SITP)
b. Restructured Technological Upgradation Fund Scheme (RR TUFS)
c. Integrated Skill Development Scheme (ISDS)
d. Swarnajayanti Gram Swarozgar Yojana (SGSY)

22
e. Market Development Assistance (MDA)
f. Market Access Initiative (MAI)
g. Technology Mission on Technical Textiles (TMTT)
Apart from the central government, many State Governments are also making efforts to
attract investments in their states. States like Maharashtra, Gujarat, Tamil Nadu, Karnataka,
Andhra Pradesh, Rajasthan, Madhya Pradesh and Punjab have come out with a host of
investment related incentives in the sector. The states policies provide support in addition to
central Government schemes like RRTUFS, thus making investments more attractive. The
benefits generally include subsidized power, stamp duty, refund of state taxes etc. along with
capital and interest subsidy.
iv. Presence of Complete Textile Value Chain
India is one of the few textile manufacturing countries in the world where all levels of textile
value chain i.e. from fibre/ filament to garment manufacturing are present.
Weakness:
i. Unorganized fabric manufacturing and processing sector
The weaving and fabric processing sector in India is largely unorganized. The unorganized sector
units suffer from lack of capacity and many of them use old technologies. Scale as well as
quality are key areas of concern for the unorganized sector units.
ii. Lower efficiency
Productivity levels in India are low compared to peers including China, Bangladesh, Turkey, etc.
Level 1 Level 2 Level 3 Level 4
Fibre Manufacturing
Spinning
Weaving/ Knitting
Processing Garment
Manufacturing
Level 5
Filament Manufacturing
Figure 25: Indian Textile Manufacturing Value Chain
23
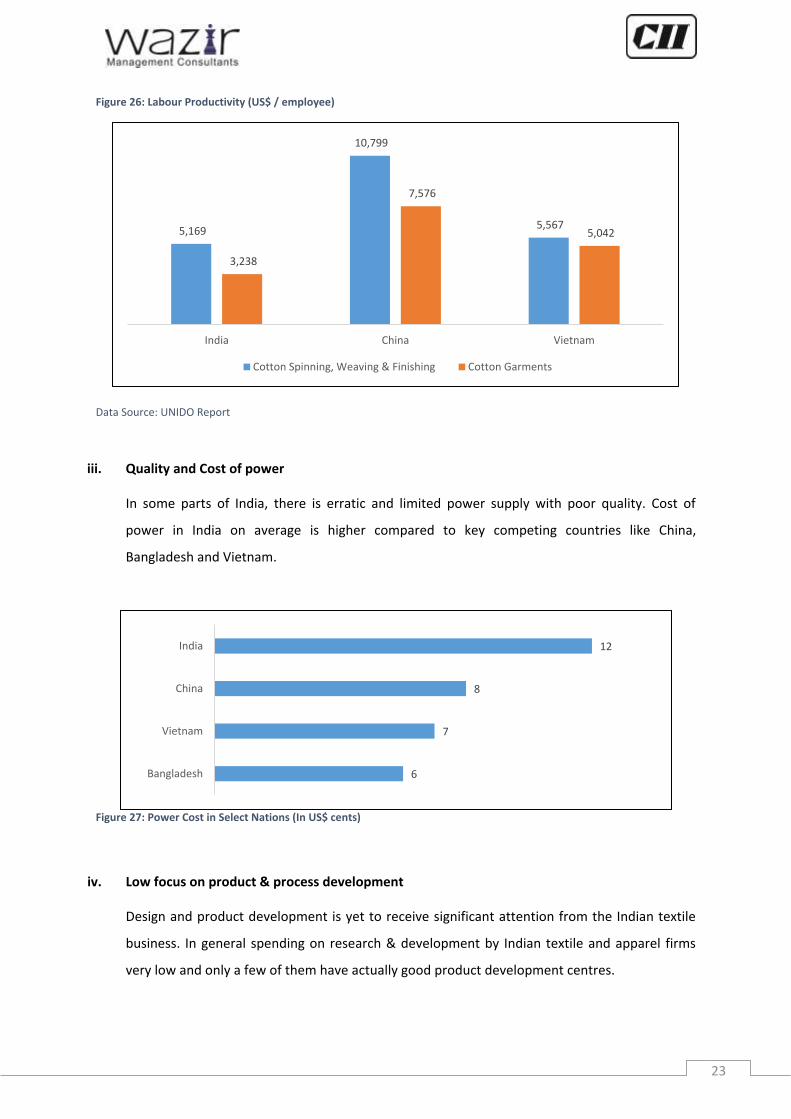
Figure 26: Labour Productivity (US$ / employee)
Data Source: UNIDO Report
iii. Quality and Cost of power
In some parts of India, there is erratic and limited power supply with poor quality. Cost of
power in India on average is higher compared to key competing countries like China,
Bangladesh and Vietnam.
Figure 27: Power Cost in Select Nations (In US$ cents)
iv. Low focus on product & process development
Design and product development is yet to receive significant attention from the Indian textile
business. In general spending on research & development by Indian textile and apparel firms
very low and only a few of them have actually good product development centres.
5,169
10,799
5,567
3,238
7,576
5,042
India China Vietnam
Cotton Spinning, Weaving & Finishing Cotton Garments
6
7
8
12
Bangladesh
Vietnam
China
India

24
Opportunities:
i. Growth in Domestic demand
Domestic demand will increase owing to urbanization and rising income levels of consumers.
Also, organized retailing sector is booming and with further opening up of sector for FDI,
several International brands are expected to enter India soon, providing thrust to the domestic
sector.
ii. China vacating space in International trade
Per capita spend on apparel in China is expected to grow from US$ 122 in 2013 to US$ 377 by
2025, which will make the domestic market very attractive for the Chinese manufacturers. On
supply side, China is facing few challenges which will make it less competitive in international
trade. Overall China’s share in global trade is expected to reduce from current 40% level to 35%
by 2025. This lower-than-market performance will create a vacuum of ~US$ 100 Bn. by 2025.
India is best poised to capture maximum share of this opportunity.
Threats:
i. Competition from other exporting countries
Competitors like China, Bangladesh, Turkey, Sri Lanka, Germany, Italy, Vietnam etc. have
developed their core strengths and established USPs in the global market.
Table 11: USPs of Key Textile & Apparel Exporting Countries
Country USP
China Scale and productivity
Turkey High design and product focus
Italy High end skill and design orientation
Germany Technical orientation and innovation focus
Sri Lanka Product focus
Bangladesh Low cost and large factories
Bangladesh’s apparel exports has already surpassed that of India. Vietnam in last few years has
also gained higher market share in global trade. On the same hand, Myanmar and Ethiopia are
receiving attention from the global investor and buyer community. All these countries will pose
a tough competition to Indian in near future.

25
4. Emerging Changes in Global Trade Scenario
4.1. Higher Growth of Synthetic Fibre based Categories
Dominance of natural fibres like cotton and wool at global level has been gradually taken up by
the cost and availability of manmade fibres.
Figure 28: World Mill Consumption by Fibre (In 000’ tons)
Data Source: PCI Fibres
Polyester is now by far the dominant textile constituent in most end use sectors requiring
manmade, including predominantly, apparel but also home textiles and industrial-technical
textiles. By virtue of price, performance and scale it is gradually taking the market shares of the
more expensive.
Figure 29: Global Man-Made Fibre Segmentation (2012)
-
10,000
20,000
30,000
40,000
50,000
60,000
70,000
2000 2005 2007 2010 2015 (P) 2020 (P)
Polyester Others Cotton
Polyester63%
Nylon15%
Acrylic1%
Viscose21%
Industrial Textile
Apparel50%
Home7%
Industrial43%
Nylon 6 & 66
Apparel65%
Home27%
Industrial8%
Polyester
Polyester83%
Nylon6%
Acrylic4%
Viscose7%
Fibre Market by Product
Textile Industry Overview - Manmade Fibre Market Segmentation
Polyester85%
Nylon5%Acrylic
4%
Viscose6%
Apparel
Polyester91%
Nylon2%
Acrylic4%
Viscose3%
Home Textile
Apparel60%
Home Textile
24%
Industrial Textile
16%
Textile Market by End Use
2012 Total
51,920 KT
2012 Total
31,332 KT
2012 Total
8,216 KT
2012 Total
12,372 KT
Apparel65%
Home30%
Industrial5%
Acrylic
Apparel46%
Home9%
Industrial45%
Viscose
2012 Total
41,080 KT
2012 Total
2,859 KT
2012 Total
1,872 KT
2012 Total
3,642 KT2012 Total
49,453 KT*Excludes PP
& Others Polyester dominates the fibre market in most applications, growing at 6-7%
Market
Trends1
Trends 2

26
Data Source: PCI Fibres
Indian textile industry, however, is primarily cotton focused with cotton accounting for nearly
55% of total fibre consumption in 2012. But consumption of polyester fibre is gaining
momentum due to factors like fluctuation of cotton prices, increased presence & sourcing by
global brands where polyester fibre dominates, growth of women’s wear segment, growth of
value retail etc.
Figure 30: Fibre Consumption Trend in India
Source: Fibre Policy 2011, Wazir Analysis
India’s overall share in global textile and apparel trade is about 5% in 2013. However, out of
total 864 textile and apparel commodities traded in 2012 there are 317 commodities in which
India had a share less than 1%. Collective trade in these commodities is approx. US$ 208 bn.,
while India’s trade in them is only US$ 385 mn. (0.19%).The untapped opportunity remains in
MMF based product categories, which can give an exponential growth to India’s export of
textile and apparel.
Table 12: India’s Trade Share in Top Traded MMF based Apparel Categories (2012)
Category End user
Type Total Trade
(US$ Bn.)
Indian Trade
(US$ Bn.) Share
Jerseys, pullovers, cardigans, waistcoats - Knitted 18.05 0.03 0.20%
Overcoats, capes, cloaks, wind-cheaters, etc. M/B Woven 6.58 0.001 0.02%
Overcoats, capes, cloaks, wind-cheaters, etc. W/G Woven 5.94 0.001 0.02%
Dresses W/G Woven 5.1 0.35 6.90%
Trousers, bib and brace overalls, breeches and shorts
M/B Woven 4.85 0.07 1.40%
Blouses, shirts and shirt-blouses W/G Woven 4.3 0.37 8.60%
Dresses W/G Knitted 4.07 0.06 1.50% Data Source: United Nation Commodity Trade Database Note: M/B – Men’s/Boys’; W/G – Women’s/Girls’
60% 59% 59% 59% 58% 56% 55%
34% 35% 35% 35% 36% 37% 38%
6% 6% 6% 6% 6% 7% 7%
2000 2007 2008 2009 2010 2011 2012
Cotton Polyester Others

27
Till 2000, fibre consumption at global level was majorly cotton focused. By 2030, it is expected
that consumption of polyester will be more than double to that of the cotton fibre.
Figure 31: Global Fibre Consumption Trend
Data Source: PCI Fibres
Volatility and upward trend of cotton price has already pushed the fibre mix in favor of
Polyester for major apparel and home textile products. Following are the few major trends
which will help increased consumption of Polyester fibre in Indian domestic market:
Increasing women participation in workforce will push the demand of western office wear,
party dresses as well as lingerie
India’s large young population base with increasing awareness towards fitness will increase
the consumption of active-wear / sportswear
Awareness of Indian women towards health and hygiene will cause increased women
hygiene product usage
India’s emergence as global automobile manufacturing hub will surge the demand of
technical textile products like seat belts, airbags, seat covers and headliners
Stricter compliance norms and increasing workers’ awareness towards health and safety will
create large demand for protective wear products
4.2. Supply Base Consolidation by Buyers
An analysis of the share of suppliers in the global exports shows a clear trend of consolidation in
global textile and apparel trade, where fewer and fewer countries having share of significance
in total trade.
37% 36% 36% 35% 33% 31% 31% 30% 27%
36%
43% 44% 46% 48% 50% 50% 52% 59%
27% 21% 20%
19% 19%
19% 18% 18% 14%
2000 2007 2008 2009 2010 2011 2012 2020 (P) 2030 (P)
Cotton Polyester Others
Widening gap
28
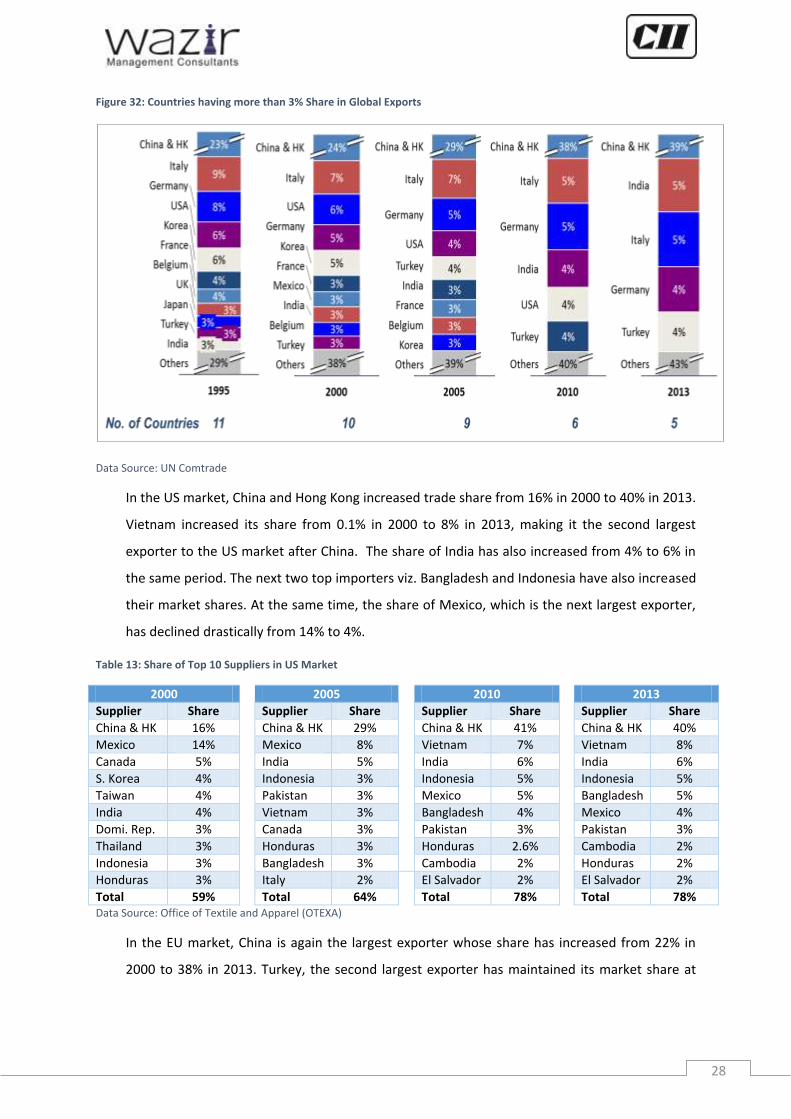
Figure 32: Countries having more than 3% Share in Global Exports
Data Source: UN Comtrade
In the US market, China and Hong Kong increased trade share from 16% in 2000 to 40% in 2013.
Vietnam increased its share from 0.1% in 2000 to 8% in 2013, making it the second largest
exporter to the US market after China. The share of India has also increased from 4% to 6% in
the same period. The next two top importers viz. Bangladesh and Indonesia have also increased
their market shares. At the same time, the share of Mexico, which is the next largest exporter,
has declined drastically from 14% to 4%.
Table 13: Share of Top 10 Suppliers in US Market
2000 2005 2010 2013
Supplier Share Supplier Share Supplier Share Supplier Share
China & HK 16% China & HK 29% China & HK 41% China & HK 40%
Mexico 14% Mexico 8% Vietnam 7% Vietnam 8%
Canada 5% India 5% India 6% India 6%
S. Korea 4% Indonesia 3% Indonesia 5% Indonesia 5%
Taiwan 4% Pakistan 3% Mexico 5% Bangladesh 5%
India 4% Vietnam 3% Bangladesh 4% Mexico 4%
Domi. Rep. 3% Canada 3% Pakistan 3% Pakistan 3%
Thailand 3% Honduras 3% Honduras 2.6% Cambodia 2%
Indonesia 3% Bangladesh 3% Cambodia 2% Honduras 2%
Honduras 3% Italy 2% El Salvador 2% El Salvador 2%
Total 59% Total 64% Total 78% Total 78% Data Source: Office of Textile and Apparel (OTEXA)
In the EU market, China is again the largest exporter whose share has increased from 22% in
2000 to 38% in 2013. Turkey, the second largest exporter has maintained its market share at

29
14% in 2013. The share of Bangladesh in the overall textile and imports to EU 28 has increased
from 4% in 2000 to 11% in 2013 while India has maintained its share at 7%.
Table 14: Share of Top 10 Suppliers in EU-28 Market
2000 2005 2010 2013
Supplier Share Supplier Share Supplier Share Supplier Share
China 22% China 34% China 42% China 38%
Turkey 13% Turkey 17% Turkey 13% Turkey 14%
India 7% India 8% India 8% Bangladesh 11%
Tunisia 5% Bangladesh 5% Bangladesh 7% India 7%
Bangladesh 4% Tunisia 4% Pakistan 3% Pakistan 3%
Morocco 4% Morocco 3% Tunisia 3% Tunisia 3%
Indonesia 4% Pakistan 3% Morocco 3% Morocco 2%
USA 4% Indonesia 2% Viet Nam 2% Viet Nam 2%
Rep. of Korea 3% Switzerland 2% Indonesia 2% Cambodia 2%
Switzerland 3% USA 2% USA 2% Indonesia 2%
Total 69% Total 80% Total 84% Total 84% Data Source: UN Comtrade
The concentration of textile and apparel imports to both the US and EU 28 market has
increased, with top 10 supplier countries reaching 78% and 84% respectively in 2013.
Supply chain rationalization has led to the global consolidation in textile and apparel sector. The
buyers are now seeking for a long term arrangement with fewer suppliers that have capabilities
to support their operations. Consolidation of supplier base results in lower purchased costs (i.e.
shipping, handling, taxes and duties/fees, etc.) and reduced procurement and supplier
management cost fees. Beyond cost savings, it also results in increased stake-holder
satisfaction in form of better discounts, fraud reduction and better quality.
4.3. Trade Agreements to Play an Important Role
Trade Agreements have always been a key factor in determining the trade flow between
regions, more so for textile and apparel sector. The capacity expansion of textile and apparel
manufacturing in several countries can be attributed to their market access to one or more
prominent markets. Latin American nations were fully exploiting free market access to USA till
the markets opened up. Similar is the case with North African nations of Morocco, Tunisia, etc.
which have preferential access to EU, and also proximity.
Over the years the ‘proximity to market’ angle has lost some of its importance thanks to
improved global logistics and systems. Vietnam emerged as the second largest apparel supplier
to USA in 2008, replacing Mexico. Similarly, Bangladesh replaced Turkey as the second largest
non-European apparel supplier to EU market in 2012.

30
USA and Vietnam signed a bilateral trade agreement on July 2000 which came to force on
December 2001. Since then, Vietnam has become a significant trade partner for the US.
Vietnam is the second largest source of US clothing imports after China. From US$ 48 million in
2001, the US import of apparel from Vietnam has increased to US$ 8,126 million in 2013 at an
impressive CAGR of 53%.
Figure 33: US Apparel Imports from Vietnam (In US$ million)
Data Source: Office of Textile and Apparel (OTEXA)
Bangladesh has been a WTO member since 1995 and benefits from the EU's "Everything but
Arms" arrangement, which grants duty free, quota free access for all exports, except arms and
ammunition. The EU works closely with Bangladesh in the framework of the EU-Bangladesh Co-
operation Agreement, concluded in 2001. Taking advantage of these arrangements, Bangladesh
exports of apparel to EU-27 region has significantly increased from US$ 3.3 billion in 2000 to
US$ 12 billion in 2013 at a CAGR of 11%.
Figure 34: Bangladesh Exports to EU-27 (In US$ million)
Data Source: Eurostat
17 47 48 895
2,375 2,562 2,725 3,222
4,359 5,223 5,068
5,877 6,644
7,101
8,126
1995 2000 2001 2002 2003 2004 2005 2006 2007 2008 2009 2010 2011 2012 2013
Before FTA After FTA
3,264 4,458
7,819
12,234
2000 2005 2010 2013
CAGR: 11%
53% 19%
31
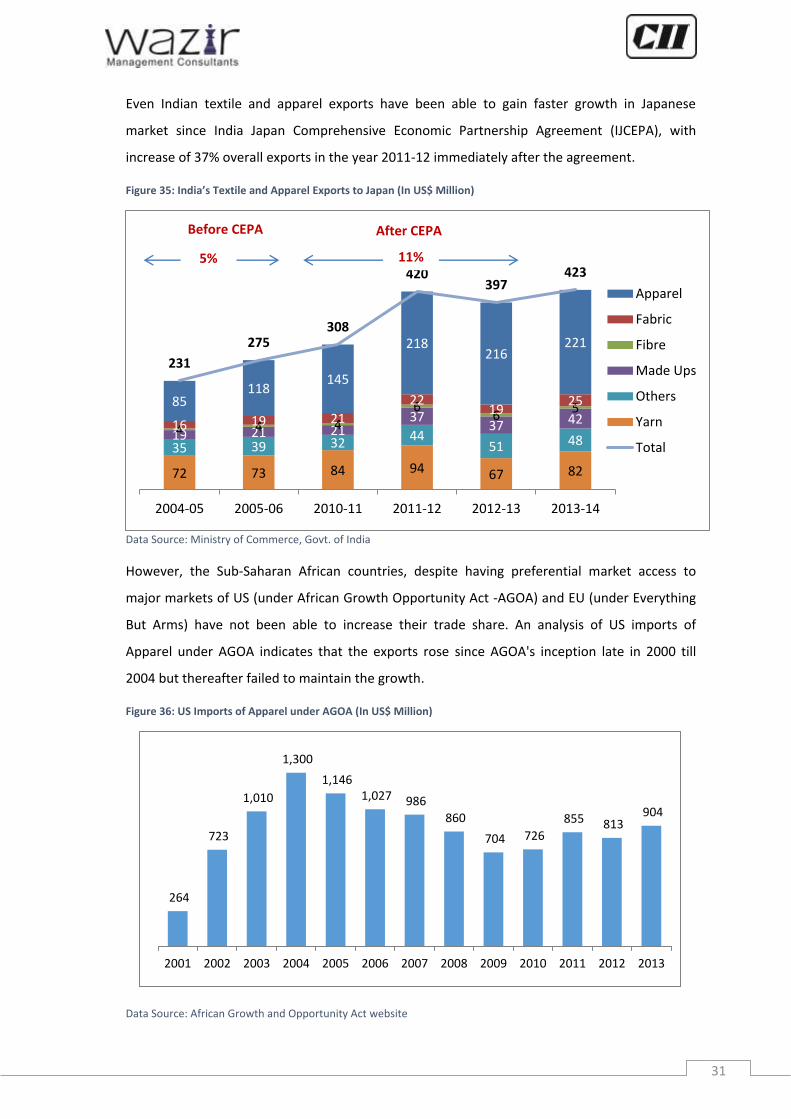
Even Indian textile and apparel exports have been able to gain faster growth in Japanese
market since India Japan Comprehensive Economic Partnership Agreement (IJCEPA), with
increase of 37% overall exports in the year 2011-12 immediately after the agreement.
Figure 35: India’s Textile and Apparel Exports to Japan (In US$ Million)
Data Source: Ministry of Commerce, Govt. of India
However, the Sub-Saharan African countries, despite having preferential market access to
major markets of US (under African Growth Opportunity Act -AGOA) and EU (under Everything
But Arms) have not been able to increase their trade share. An analysis of US imports of
Apparel under AGOA indicates that the exports rose since AGOA's inception late in 2000 till
2004 but thereafter failed to maintain the growth.
Figure 36: US Imports of Apparel under AGOA (In US$ Million)
Data Source: African Growth and Opportunity Act website
72 73 84 94 67 82
35 39 32 44 51 48 19 21 21
37 37 42
4 4 4 6
6 5
16 19 21
22 19
25 85 118
145
218 216
221
231
275 308
420 397
423
2004-05 2005-06 2010-11 2011-12 2012-13 2013-14
Apparel
Fabric
Fibre
Made Ups
Others
Yarn
Total
264
723
1,010
1,300
1,146 1,027 986
860
704 726
855 813 904
2001 2002 2003 2004 2005 2006 2007 2008 2009 2010 2011 2012 2013
5% 11%
Before CEPA After CEPA

32
There are several reasons behind this anomaly ranging from lack of export infrastructure to
political instability to absence of integrated capacities.
Another FTA on the horizon - Trans Pacific Partnership (TPP) agreement, where United States is
negotiating with 11 other countries throughout the Asia-Pacific region (Australia, Brunei
Darussalam, Canada, Chile, Japan, Malaysia, Mexico, New Zealand, Peru, Singapore, and
Vietnam). The inclusion of a significant apparel producer, Vietnam in this free trade agreement
will provide it with great advantage in markets of Canada, Australia and Japan.
33
5. Way Ahead
From an overall perspective Indian textile and apparel sector is in a position of good advantage. To
buyers looking for alternate, large supply bases India offers a credible alternate. India’s economic
growth is also expected to be higher for next few years which will result in higher demand for textile
and apparel products in domestic front too. However, our lack of focus on synthetic value chain,
manpower challenge and duty disadvantage in major markets compared to our competing nations
are main threats that can mar the anticipated growth at country level.
For manufacturers to take benefit of the domestic market growth story, the requirement will be to
be flexible enough to tap opportunities appearing in various market segments. On one hand the
manufacturers will need to cater large international brands and retailers, who will prefer sourcing
locally; while there will be fast growing Indian brands too. Need of brands and retailers to develop
lower cost business models will be key to enhance their presence in cities beyond Tier I and II. For
this, e-commerce will become more important. Manufacturers will have to focus on being lean and
enhance their productivity. As the brands and retailers will grow large within the country, they will
look for manufacturers with economies of scale who can cater to large orders timely. Strategic tie-
ups between such manufacturers and buyers will happen which will enhance stability and efficiency
in the overall sector.
For exports, establishment of larger, integrated set-ups will be required. It will also be important for
Indian textile exporters to have business tie-ups in countries like Bangladesh, Vietnam, Myanmar,
etc. These countries will be attractive export destinations for Indian fibre manufacturers, spinners
and fabric manufacturers. In addition, they may prove good investment destinations for Indian
companies too, because of competitive manufacturing cost and preferential market access to US, EU
and Japan.

The Confederation of Indian Industry (CII) works to create and sustain an environment conducive to the
development of India, partnering industry, Government, and civil society, through advisory and
consultative processes.
CII is a non-government, not-for-profit, industry-led and industry-managed organization, playing a
proactive role in India's development process. Founded in 1895, India's premier business association
has over 7200 members, from the private as well as public sectors, including SMEs and MNCs, and an
indirect membership of over 100,000 enterprises from around 242 national and regional sectoral
industry bodies.
CII charts change by working closely with Government on policy issues, interfacing with thought
leaders, and enhancing efficiency, competitiveness and business opportunities for industry through a
range of specialized services and strategic global linkages. It also provides a platform for consensus-
building and networking on key issues.
Extending its agenda beyond business, CII assists industry to identify and execute corporate
citizenship programmes. Partnerships with civil society organizations carry forward corporate
initiatives for integrated and inclusive development across diverse domains including affirmative action,
healthcare, education, livelihood, diversity management, skill development, empowerment of women,
and water, to name a few.
The CII theme of ‘Accelerating Growth, Creating Employment’ for 2014-15 aims to strengthen a growth
process that meets the aspirations of today’s India. During the year, CII will specially focus on economic
growth, education, skill development, manufacturing, investments, ease of doing business, export
competitiveness, legal and regulatory architecture, labour law reforms and entrepreneurship as growth
enablers.
With 64 offices, including 9 Centres of Excellence, in India, and 7 overseas offices in Australia, China,
Egypt, France, Singapore, UK, and USA, as well as institutional partnerships with 312 counterpart
organizations in 106 countries, CII serves as a reference point for Indian industry and the international
business community.
.
Confederation of Indian Industry
The Mantosh Sondhi Centre
23, Institutional Area, Lodi Road, New Delhi – 110 003 (India)
T: 91 11 45771000 / 24629994-7 | F: 91 11 24626149
E: [email protected] | W: www.cii.in
Reach us via our Membership Helpline: 00-91-11-435 46244 / 00-91-99104 46244CII Helpline Toll free No: 1800-103-1244
Follow us on :
www.mycii.infacebook.com/followcii twitter.com/followcii
34
35
About Wazir Advisor
Wazir Advisors is a management consulting firm that supports clients globally on strategy,
investment, alliance and implementation assignments in sectors of Textiles, Apparel, Technical
Textiles, Retail, and other consumer focused sectors. Wazir also works with Government and
Development Bodies for scheme and policy formulation as well as implementation.
Having worked with leading Indian and International private companies, public sector organization,
Government departments, development bodies and trade bodies over the years Wazir has
developed an in-depth understanding of global sector dynamics and connects with the decision
makers. This body of knowledge and contacts are leveraged in delivering value to clients in each
assignment. Wazir also has tied-up with select international consulting partner firms in key global
regions for delivering international projects.
With a team of experienced professionals, Wazir offers a comprehensive range of services to its
clients in fibre to fashion value chain.
Wazir’s Service Offerings:
a) Strategy advisory services
• Corporate strategy
• Market entry strategy
• Manufacturing strategy
• Product diversification strategy
• Marketing and distribution strategy
b) Implementation assistance
• Garment factory re-engineering
• Supply chain optimization
• Process re-engineering
• Productivity improvement
• Benchmarking against best practices
• Cluster and industrial parks
development
• Workforce & middle management
training
c) Services for Govt. and development
bodies
• Sector growth strategy
• Scheme / Policy recommendations &
formulation
• Scheme / Policy evaluation
• Investment Promotion – FDI & Domestic
• Project management and monitoring
d) Market research
• Surveys
• Trade research
• Market intelligence
• Customer feedback & relationship
management
e) Support for investments
• Cross border investments
• Company due-diligence
• Location analysis
• Debt restructuring
• Partner search - M&A, JV, other forms
of business partnerships
• Feasibility studies and DPR preparation
• Techno-Economic Viability (TEV) Studies
f) Thought leadership
• Sector white paper
• Knowledge partner in conferences


