Download - Ross - Does Oil Hinder Democracy

8/10/2019 Ross - Does Oil Hinder Democracy
http://slidepdf.com/reader/full/ross-does-oil-hinder-democracy 1/37
P
DOES OIL HINDER DEMOCR ACY?
By MICHAEL L. ROSS*
INTR ODUCTION
OLITICALscientists believe that oil has some very odd pr oper-ties. Many studies show that when incomes rise, governments tend
to become more democratic. Yet some scholars imply there is an excep-tion to this rule: if rising incomes can be traced to a countr y ’s oil
wealth, they suggest, this democratizing effect will shrink or disappear.Does oil really have antidemocratic properties? What about other min-erals and other commodities? What might explain these effects?
The claim that oil and democracy do not mix is often used by areaspecialists to explain why the high-income states of the Arab MiddleEast have not become democratic. If oil is truly at fault, this insightcould help explain-----and perhaps, predict-----the political problems of oilexporters around the world, such as Nigeria, Indonesia, Venezuela, and
the oil-rich states of Central Asia. If other minerals have similar prop-erties, this effect might help account for the absence or weakness of de-mocracy in dozens of additional states in sub-Saharan Africa, Latin
America, and Southeast Asia. Yet the ‘‘oil impedes democracy’’ claimhas received little attention outside the circle of Mideast scholars;moreover, it has not been carefully tested with regression analysis, ei-ther within or beyond the Middle East.
I use pooled time-series cross-national data from 113 states between 1971 and 1997 to explore three aspects of the oil-impedes-democrac y claim. The first is the claim’s validity: is it true? Although the claim has been championed by Mideast specialists, it is difficult to test by examining only cases from the Middle East because the region provides scholars with
* Previous versions of this article were presented to seminars at Princeton University, Yale Univer-sity, and the University of California, Los Angeles, and at the September 2000 annual meeting of the
American Political Science Association in Washington, D.C. For their thoughtful comments on ear- lier drafts, I am grateful to Pradeep Chhibber, Indra de Soysa, Geoffrey Garrett, Phil Keefer, SteveKnack, Miriam Lowi, Ellen Lust-Okar, Lant Pritchett, Nicholas Sambanis, Jennifer Widner, Michael
Woolcock, and three anonymous reviewers. I owe special thanks to Irfan Nooruddin for his research
assistance and advice and to Colin Xu for his help with the Stata. I wrote this article while I was a vis-iting scholar at The World Bank in Washington, D.C. The views I express in this article, and all re-maining errors, are mine alone.
World Politics 53 (April 2001), 325---61

8/10/2019 Ross - Does Oil Hinder Democracy
http://slidepdf.com/reader/full/ross-does-oil-hinder-democracy 2/37
326 WORLD POLI T ICS
T ABLE 1 INDEX OF OIL-R ELIANT S TA TES A
1. Brunei (1994) 47.58 2. Kuwait 46.14 3. Bahrain 45.60 4. Nigeria (1991) 45.38 5. Congo, Dem. Rep. 45.14 6. Angola (1996) 45 7. Yemen 38.58 8. Oman 38.43 9. Saudi Arabia 33.85
10. Qatar (1994) 33.85 11. Libya (1988) 29.74
12. Iraq (1983) 23.48 13. Algeria 21.44 14. Venezuela 18.84 15. Syria 15.00 16. Norway 13.46 17. Iran (1983) 11.95 18. Ecuador 8.53 19. Malaysia 5.91 20. Indonesia 5.69 21. Cameroon 5.63
22. Lithuania 4.48 23. Kyrgyz Republic (1996) 4.25 24. Netherlands 3.14 25. Colombia 3.13
a Oil reliance is measured by the value of fuel-based exports divided by GDP. Most figuresare based on data for 1995 from World Bank (fn. 71).Figures for Brunei, Nigeria, Qatar,Libya, Iraq, and Iran are the most recent available. Since 1995 figures for Angola and Kyr-gyz Republic are not available, 1996 figures are reported.
little variation on the dependent variable: virtually all Mideast govern-ments have been authoritarian since gaining independence. Moreover,there are other plausible explanations for the absence of democracy in theMideast, including the influence of Islam and the region’s distinct cultureand colonial history. Does oil have a consistently negative influence on de-mocracy once one accounts for these and other variables?
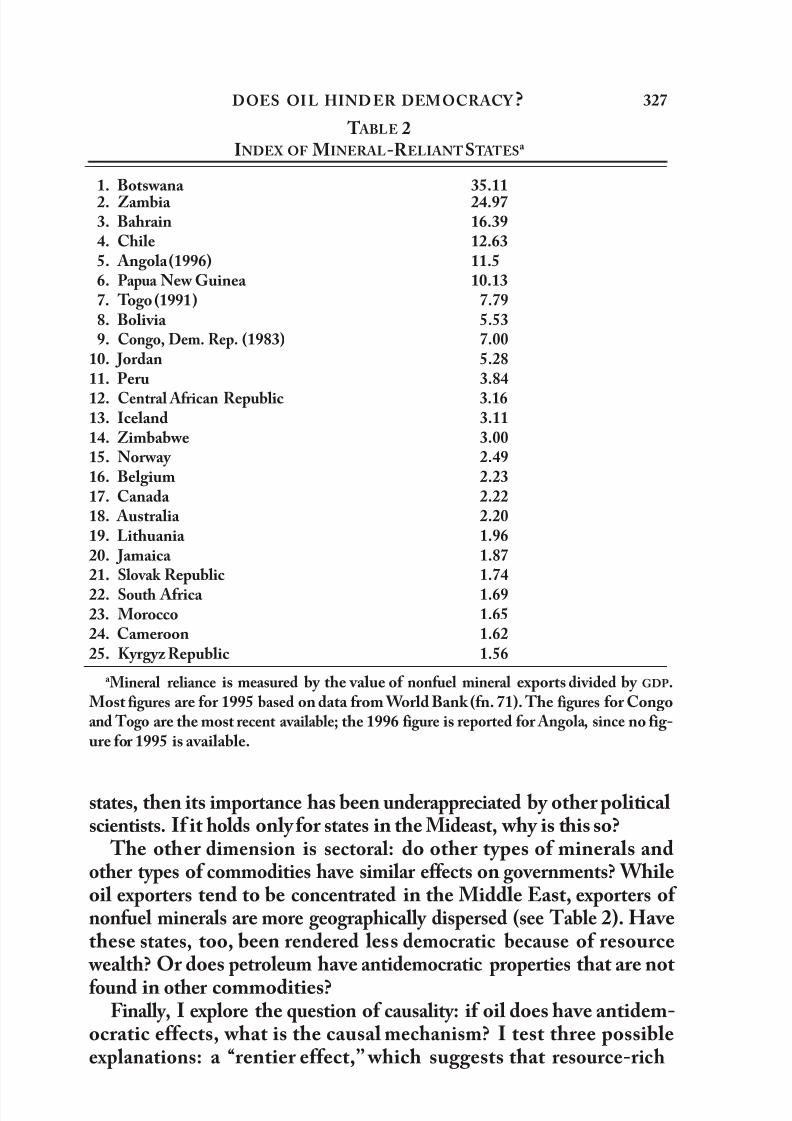
Second, I examine the claim’s generality along two dimensions. Oneis geographic. For obvious reasons the oil-impedes-democracy claimhas been explored most carefully by Mideast specialists: ten of the fif-teen states most reliant on oil wealth are in the Middle East region (see Table 1). But is oil an obstacle to democracy only in the Mideast, or doesit harm oil exporters everywhere? If the hypothesis is true for all oil-rich
8/10/2019 Ross - Does Oil Hinder Democracy
http://slidepdf.com/reader/full/ross-does-oil-hinder-democracy 3/37

8/10/2019 Ross - Does Oil Hinder Democracy
http://slidepdf.com/reader/full/ross-does-oil-hinder-democracy 4/37
328 WORLD POLI T ICS
governments use low tax rates and patronage to relieve pressures forgreater accountability; a ‘‘repression effect,’’ which argues that resource wealth retards democratization by enabling governments to boost their
funding for internal security; and a ‘‘modernization effect,’’ which holdsthat growth based on the export of oil and minerals fails to bring aboutthe social and cultural changes that tend to produce democratic gov-ernment.
I also have two broader aims. The first is to encourage scholars whostudy democracy to incorporate the Middle East into their analyses.Many ‘‘global’’ studies of democratization have avoided the Mideast en-tirely.1 Influential studies by Przeworski and Limongi and Przeworski,
Alvarez, Cheibub, and Limongi simply drop the oil-rich Mideast statesfrom their database.2 There is, however, no sound analytical reason forscholars of democracy to exclude these states from their research, anddoing so can only weaken any general findings. It also tends to margin-alize the field of Middle East studies.
My second aim is to address the literature on the ‘‘resource curse.’’Many of the poorest and most troubled states in the developing worldhave, paradoxically, high levels of natural resource wealth. There is agrowing body of evidence that resource wealth itself may harm a coun-
tr y ’s prospects for development. States with greater natural resource wealth tend to grow more slowly than their resource-poor counter-parts.3 They are also more likely to suffer from civil wars.4 This articlesuggests as well that there is a third component to the resource curse:oil and mineral wealth tends to make states less democratic.
1 See, for example, Guillermo O’Donnell, Philippe C. Schmitter, and Lawrence Whitehead, eds.,Transitions from Authoritarian Rule: Prospects for Democracy (Baltimore: Johns Hopkins UniversityPress, 1986); D. Larry Diamond, Juan J. Linz, and Seymour Martin Lipset, eds., Democracy in Devel-
oping Countries (Boulder, Colo.: Lynne Rienner, 1988); Ronald Inglehart, Modernization and Postmod-ernization (Princeton: Princeton University Press, 1997).
2 Adam Przeworski and Fernando Limongi, ‘‘Modernization: Theories and Facts,’’ World Politics 49 ( January 1997); Adam Przeworski, Michael Alvarez, José Antonio Cheibub, and Fernando Limongi,‘‘What Makes Democracies Endure?’’ Journal of Democracy 7 ( January 1996); idem, Democracy and De-velopment: Political Institutions and Well-Being in the World, 1950---1990 (New York: Cambridge Uni-
versity Press, 2000). 3 Jeffrey D. Sachs and Andrew M. Warner, ‘‘Natural Resource Abundance and Economic Growth,’’
Development Discussion Paper no. 517a (Cambridge: Harvard Institute for International Develop-ment, 1995); idem, ‘‘The Big Push, Natural Resource Booms and Growth,’’ Journal of Development Economics 59 (February 1999); Carlos Leite and Jens Weidmann, ‘‘Does Mother Nature Corrupt? Nat-ural Resources, Corruption, and Economic Growth,’’ IMF Working Paper, WP/99/85 (1999); Michael
L. Ross, ‘‘The Political Economy of the Resource Curse,’’ World Politics 51 ( January 1999); R. M. Auty, Resource Abundance and Economic Development (Oxford: Oxford University Press, 2001). 4 Paul Collier and Anke Hoeffler, ‘‘On Economic Causes of Civil War,’’ Oxford Economic Papers 50
(October 1998); Indra de Soysa, ‘‘ The Resource Curse: Are Civil Wars Driven by Rapacity orPaucity?’’ in Mats Berdal and David M. Malone, eds., Greed and Grievance: Economic Agendas in CivilWars (Boulder, Colo.: Lynne Rienner, 2000).

8/10/2019 Ross - Does Oil Hinder Democracy
http://slidepdf.com/reader/full/ross-does-oil-hinder-democracy 5/37
D O E S OI L H IND ER D EM O CR ACY ? 329
I begin by outlining the oil-impedes-democracy claim and the limi-tations of previous work on the topic. I then draw on earlier case stud-ies of oil-rich states to specify three causal mechanisms that might
explain how oil makes governments more authoritarian. The next sec-tion presents a model of regime types and describes the research design.I then present the results of the validity and generality tests and followthat with a discussion of the results of tests on the causal mechanismsand a conclusion.
THE CONCEPT OF THE ‘‘R ENTIERS TATE’’
Area specialists often describe most of the governments of the Mideastand North Africa as ‘‘rentier states,’’ since they derive a large fraction oftheir revenues from external rents.5 More than half of the government’srevenues in Saudi Arabia, Bahrain, the United Arab Emirates, Oman,Kuwait, Qatar, and Libya have, at times, come from the sale of oil. Thegovernments of Jordan, Syria, and Egypt variously earn large locationalrents from payments for pipeline crossings, transit fees, and passagethrough the Suez Canal. Workers’ remittances have been an importantsource of foreign exchange in Egypt, Yemen, Syria, Lebanon, Tunisia,
Algeria, and Morocco, although these rents go (at least initially) to pri- vate actors, not the state. The foreign aid that flows to Israel, Egypt, and Jordan may also be considered a type of economic rent.
Economists in the early twentieth centur y used the term ‘‘rentierstate’’ to refer to the European states that extended loans to non-European governments.6 Mahdavy is widely credited with giving theterm its current meaning: a state that receives substantial rents from‘‘foreign individuals, concerns or governments.’’7 Beblawi later refined
this definition, suggesting that a rentier state is one where the rents arepaid by foreign actors, where they accrue directly to the state, and where‘‘only a few are engaged in the generation of this rent (wealth), the ma- jority being only involved in the distribution or utilization of it.’’8
5 Throughout this article I use the term ‘‘Middle East’’ to include North Africa. I adopt the WorldBank’s definition of this region: Algeria, Bahrain, Egypt, Iran, Iraq, Israel, Jordan, Kuwait, Lebanon,Libya, Malta, Morocco, Oman, Qatar, Saudi Arabia, Syria, Tunisia, United Arab Emirates, and Yemen.
6 According to Lenin, ‘‘The rentier state is a state of parasitic, decaying capitalism, and this circum-stance cannot fail to influence all the socio-political conditions of the countries concerned.’’ V. I.Lenin, ‘‘Imperialism, the Highest Stage of Capitalism,’’ in Robert C. Tucker, ed., The Lenin Anthology
(New York: W. W. Norton, 1975). 7 Hussein Mahdavy, ‘‘The Patterns and Problems of Economic Development in Rentier States: TheCase of Iran,’’ in M. A. Cook, ed., Studies in Economic History of the Middle East (London: Oxford Uni-
versity Press, 1970), 428. 8 Hazem Beblawi, ‘‘The Rentier State in the Arab World,’’ in Hazem Beblawi and Giacomo Lu-
ciani, eds., The Rentier State (New York: Croom Helm, 1987), 51. Note that this definition excludes
8/10/2019 Ross - Does Oil Hinder Democracy
http://slidepdf.com/reader/full/ross-does-oil-hinder-democracy 6/37
330 WORLD POLI T ICS
Claims about the rentier state can be sorted into two categor ies:those that suggest oil wealth makes states less democratic and thosethat suggest oil wealth causes governments to do a poorer job of pro-
moting economic development. Often the two are conflated. This arti-cle focuses on the first claim.
According to Anderson, ‘‘The notion of the rentier state is one of themajor contributions of Middle East regional studies to political sci-ence.’’9 Indeed, some scholars of democracy now use a version of thisargument to account for the otherwise puzzling states of the MiddleEast. Huntington, for example, suggests that the democratic trend may
bypass the Middle East since many of these states ‘‘depend heavily on
oil exports, which enhances the control of the state bureaucrac y .’’10
Others have adapted the ‘‘rentier state’’ idea to oil-rich countries out-side the Middle East.11
The claim that oil wealth per se inhibits democratization has not been subjected to careful statistical tests, however, as most quantitativestudies of democracy simply overlook it as an explanatory variable. Andthe handful that even acknowledge that oil-rich states have odd prop-erties do little to explain why. Przeworski and his collaborators, for ex-ample, drop countries from their database if their ‘‘ratio of fuel exports
to total exports in 1984---1986 exceeded fifty percent’’-----an eccentric cri-terion that excludes six oil-rich states, all of which are located on the
Arabian Peninsula.12 Barro’s study of democracy includes a dummy variable for states ‘‘whose net oil exports represent a minimum of two-thirds of total exports and are at least equivalent to approximately onepercent of world exports of oil.’’13 The Barro oil dummy is statisticallysignificant and negatively correlated with democracy. But as in theanalyses of Przeworski et al., the dummy variable uses an arbitrary cut-
workers’ remittances. As Chaudhry notes, large flows of remittances have different political implica-tions than do large oil rents. See Kiren Aziz Chaudhry, The Price of Wealth: Economies and Institutionsin the Middle East (Ithaca, N.Y.: Cornell University Press, 1997).
9 Lisa Anderson, ‘‘The State in the Middle East and North Africa,’’ Comparative Politics 20 (Octo- ber 1987), 9.
10 Samuel P. Huntington, The Third Wave: Democratization in the Late Twentieth Century (Norman:University of Oklahoma Press, 1991), 31---32.
11 See, for example, Olle Törnquist, ‘‘Rent Capitalism, State, and Democracy: A Theoretical Propo-sition,’’ in Arief Budiman, ed., State and Civil Society in Indonesia, Monash Papers on Southeast Asia,no. 22 (1990); Douglas A. Yates, The Rentier State in Africa: Oil Rent Dependency and Neocolonialism inthe Republic of Gabon (Trenton, N.J.: Africa World Press, 1996); Terr y Lynn Karl, The Paradox of
Plenty: Oil Booms and Petro-States (Berkeley: University of California Press, 1997); John Clark, ‘‘Petro-Politics in Congo,’’ Journal of Democracy 8 ( July 1997); idem, ‘‘The Nature and Evolution of the Statein Zaire,’’ Studies in Comparative International Development 32 ( Winter 1998).
12 See Przeworski et al. (fn. 2, 2000), 77. 13 Robert J. Barro, ‘‘Determinants of Democracy,’’ Journal of Political Economy 107 (December 1999).
8/10/2019 Ross - Does Oil Hinder Democracy
http://slidepdf.com/reader/full/ross-does-oil-hinder-democracy 7/37
D O E S OI L H IND ER D EM O CR ACY ? 331
point to distinguish between ‘‘oil states’’ and ‘‘non---oil states’’ and im-plies that oil has little or no influence on regime type until some thresh-old is reached.
Qualitative studies of the oil-impedes-democracy hypothesis alsohave important limitations. The vast majority have been country-levelcase studies of oil-rich states in the Mideast. Although many have beenempirically rich and analytically nuanced, the Mideast is nevertheless adifficult place to test this claim, since virtually all oil-rich Mideast gov-ernments have been highly authoritarian since gaining independence.
The absence of variation on the dependent variable-----as well as onIslam, an important control variable-----has made testing difficult. It has
also allowed Mideast specialists to neglect tasks that would helpsharpen and refine the oil-impedes-democracy claim-----defining the key variables better, specifying the causal arguments in falsifiable terms, andoutlining the domain of relevant cases to which their arguments apply.
As a result, the notion of the rentier state has suffered from a bad caseof conceptual overstretch: assertions about the influence of oil on Mid-dle East politics have become so general that their validity has been di- luted. As Okruhlik observes, ‘‘The idea of the rentier state has come toimply so much that it has lost its content.’’14
One way to restore the usefulness of an overstretched concept is bytesting it statistically. I thus evaluate one core facet of the rentier stateconcept-----the oil-impedes-democracy claim-----with threequestions. First, is there a statistically valid correlation between oil andauthoritar- ianism once other germane variables are accounted for?Second, can the claim be generalized both beyond the Middle East and
beyond the case of oil? Finally, if oil thwarts democracy, what is thecausal mechanism?
Proponents of the oil-impedes-democracy hypothesis naturally sug-gest both that it is valid and that it can be generalized to oil exportersoutside the Middle East. Some also imply that other types of com-modities have similar effects. Nothing in Beblawi’s definition, which is
widely accepted among Mideast specialists, restricts the set of rentierstates to oil exporters. In fact, the definition appears to cover manymineral exporters on the grounds that (1) minerals tend to generaterents, (2) the rents are largely captured by states via export taxes, cor-porate taxes, and state-owned enterprises, and (3) mineral extraction
employs relatively little labor. The same definition, however, impliesthat exporters of agricultural commodities will not be rentier states.
14 Gwenn Okruhlik, ‘‘Rentier Wealth, Unruly Law, and the Rise of Opposition,’’ Comparative Poli-tics 31 (April 1999), 308.

8/10/2019 Ross - Does Oil Hinder Democracy
http://slidepdf.com/reader/full/ross-does-oil-hinder-democracy 8/37
332 WORLD POLI T ICS
This is because (1) agricultural commodities generally do not producerents, (2) export revenues in most cases go directly to private actors, notthe state, and (3) agricultural production is more labor intensive and
hence employs a larger fraction of the population for a given value ofexports.15
C AUSAL MECHANISMS
At least three causal mechanisms might explain the alleged link be-tween oil exports and authoritarian rule. The first comes largely fromMideast specialists and might be called the ‘‘rentier effect.’’ A close
reading of case studies suggests a second mechanism: a ‘‘repression ef-fect.’’ Modernization theory implies a third possible cause, which I callthe ‘‘modernization effect.’’
THE R ENTIER EFFECT
The first causal mechanism comes from the work of Middle Eastscholars, who have pondered this issue for over two decades.16 In gen-eral they argue that governments use their oil revenues to relieve socialpressures that might otherwise lead to demands for greater account-
ability. Case studies describe three ways this may occur.17
The first is through what might be called a ‘‘taxation effect.’’ It sug-gests that when governments derive sufficient revenues from the sale ofoil, they are likely to tax their populations less heavily or not at all, andthe public in turn will be less likely to demand accountability from-----and representation in-----their government.18
The logic of the argument is grounded in studies of the evolution ofdemocratic institutions in early modern England and France. Histori-
ans and political scientists have argued that the demand for representa-tion in government arose in response to the sovereign’s attempts to raise
15 Note that, by contrast, dependency theory suggests that developing states are politically con-strained by their reliance on the export of all types of primary commodities to advanced industrializedstates. See, for example, Fernando Henrique Cardoso and Enzo Faletto, Dependency and Developmentin Latin America (Berkeley: University of California Press, 1979); Peter Evans, Dependent Development:The Alliance of Multinational, State, and Local Capital in Brazil (Princeton: Princeton University Press, 1979); Kenneth A. Bollen, ‘‘ World System Position, Dependency, and Democracy: The Cross-Na-tional Evidence,’’ American Sociological Review 48 (August 1983).
16 Perhaps they have thought about it too carefully. Chaudhry (fn. 8), notes that ‘‘theories of the ren-
tier state far outstrip detailed empirical analysis of actual cases’’ (p. 187). 17 Case studies often conflate these three effects. I treat them here as separate mechanisms to clar-ify their logic.
18 Giacomo Luciani, ‘‘Allocation vs. Production States: A Theoretical Framework,’’ in Beblawi and Luciani (fn. 8).

8/10/2019 Ross - Does Oil Hinder Democracy
http://slidepdf.com/reader/full/ross-does-oil-hinder-democracy 9/37
D O E S OI L H IND ER D EM O CR ACY ? 333
taxes.19 Some Mideast scholars have looked for similar correlations be-tween variations in tax levels and variations in the demand for politicalaccountability. Crystal found that the discovery of oil made the govern-
ments of Kuwait and Qatar less accountable to the traditional merchantclass.20 Brand’s study of Jordan argued that a drop in foreign aid and re-mittances in the 1980s led to greater pressures for political representa-tion.21 Yet not all Middle East specialists have been persuaded: Waterbury argues that ‘‘neither historically nor in the twentieth century isthere much evidence [in the Middle East] that taxation has evoked de-mands that governments account for their use of tax monies. Predatorytaxation has produced revolts, especially in the countryside, but there has
been no translation of tax burden into pressures for democratization.’’22
A second component of the rentier effect might be called the
‘‘spending effect ’’: oil wealth may lead to greater spending on patron-age, which in turn dampens latent pressures for democr atization.23
Entelis, for example, argues that the Saudi Arabian government usedits oil wealth for spending programs that helped reduce pressures fordemocracy.24 Vandewalle makes a similar argument about the Libyangovernment.25 And Kessler and Bazdresch and Levy find that theMexican oil boom of the 1970s helped prop up-----and perhaps pro-
long-----one-party rule.26 While all authoritarian governments may use
19 Charles Tilly, ed., The Formation of National States in Western Europe (Princeton: Princeton Uni- versity Press, 1975); Robert Bates and Da-Hsiang Donald Lien, ‘‘A Note on Taxation, Development,and Representative Government,’’ Politics and Society 14 ( Januar y 1985); Philip T. Hoffman andKathryn Norberg, eds., Fiscal Crises, Liberty, and Representative Government, 1450---1789 (Stanford,Calif.: Stanford University Press, 1994).
20 Jill Crystal, Oil and Politics in the Gulf: Rulers and Merchants in Kuwait and Qatar (New York:Cambridge University Press, 1990).
21 Laurie A. Brand, ‘‘Economic and Political Liberalization in a Rentier Economy: The Case of theHashemite Kingdom of Jordan,’’ in Iliya Harik and Denis J. Sullivan, eds., Privatization and Liberal-
ization in the Middle East (Bloomington: Indiana University Press, 1992). 22 John Waterbury, ‘‘Democracy without Democrats? The Potential for Political Liberalization inthe Middle East,’’ in Ghassan Salamé, ed., Democracy without Democrats? The Renewal of Politics in the
Muslim World (New York: I. B. Tauris, 1994), 29. 23 Lam and Wantchekon develop a formal model that makes a similar point, that resource wealth
can impede democracy by enhancing the distributive influence of an elite. Ricky Lam and Leonard Wantchekon, ‘‘Dictatorships as a Political Dutch Disease’’ (Manuscript, Department of Political Sci-ence, Yale University, January 1999).
24 John P. Entelis, ‘‘Oil Wealth and the Prospects for Democratization in the Arabian Peninsula: The Case of Saudi Arabia,’’ in Naiem A. Sherbiny and Mark A. Tessler, eds., Arab Oil: Impact on the Arab Countries and Global Implications (New York: Praeger, 1976).
25 Dirk Vandewalle, Libya since Independence: Oil and State-Building (Ithaca, N.Y.: Cornell Univer-sity Press, 1998).
26 Carlos Bazresch and Santiago Levy, ‘‘Populism and Economic Policy in Mexico, 1970---82,’’ inRudiger Dornbusch and Sebastian Edwards, eds., The Macroeconomics of Populism in Latin America(Chicago: University of Chicago Press, 1991); Timothy P. Kessler, Global Capital and National Politics: Reforming Mexico’s Financial System ( Westport, Conn.: Praeger, 1999).
8/10/2019 Ross - Does Oil Hinder Democracy
http://slidepdf.com/reader/full/ross-does-oil-hinder-democracy 10/37
334 WORLD POLI T ICS
their fiscal powers to reduce dissent, these scholars imply that oil wealthprovides Middle East governments with budgets that are exceptionally
large and unconstrained.27 Rulers in the Middle East may follow the
same tactics as their authoritarian counterparts elsewhere, but oil rev-enues could make their efforts at fiscal pacification more effective.
The third component might be called a ‘‘group formation’’ effect. Itimplies that when oil revenues provide a government with enoughmoney, the government will use its largesse to prevent the formation ofsocial groups that are independent from the state and hence that may
be inclined to demand political rights. One version of this argument isrooted in Moore’s claim that the formation of an independent bour-
geoisie helped bring about democracy in England and France.28
Schol-ars examining the cases of Algeria, Libya, Tunisia, and Iran have allobserved oil-rich states blocking the formation of independent socialgroups; all argue that the state is thereby blocking a necessary precon-dition of democracy.29
A second version of the group-formation effect draws on Putnam’sargument that the formation of social capital-----civic institutions that lieabove the family and below the state-----tends to promote more demo-cratic governance.30 Scholars studying the cases of Algeria, Iran, Iraq,
and the Arab Gulf states have all suggested that the go ver nment ’s oil wealth has impeded the formation of social capital and hence blocked atransition to democracy.31
Whether Mideast states use their oil revenues to deliberately inhibitgroup formation is a matter of some disagreement. In the case of Libya,First suggests ‘‘there is not a consistent policy against the development of
27 Lisa Anderson, ‘‘Peace and Democracy in the Middle East: The Constraints of Soft Budgets,’’ Journal of International Affairs 49 (Summer 1995).
28 Barrington Moore, Social Origins of Dictatorship and Democracy (Boston: Beacon Press, 1966). 29 On Algeria, see Clement Henry Moore, ‘‘Petroleum and Political Development in the Maghreb,’’
in Sherbiny and Tessler (fn. 24); on Libya, see Ruth First, ‘‘Libya: Class and State in an Oil Economy ,’’ in Petter Nore and Terisa Turner, eds., Oil and Class Struggle (London: Zed Press, 1980); also on Libya, see Vandewalle (fn. 25); on Tunisia, see Eva Bellin ‘‘The Politics of Profit in Tunisia: Utility of the Ren- tier Paradigm?’’ World Development 22 (March 1994); and on Iran, see Hootan Shambayati, ‘‘The Ren- tier State, Interest Groups, and the Paradox of Autonomy: State and Business in Turkey and Iran,’’ Comparative Politics 26 (April 1994).
30 Robert Putnam, Making Democracy Work: Civic Traditions in Modern Italy (Princeton: Princeton University Press, 1993).
31 On Algeria, see John P. Entelis, ‘‘Civil Society and the Authoritarian Temptation in Algerian Politics,’’ in Augustus Richard Norton, ed., Civil Society in the Middle East, vol. 2 (Leiden: E. J. Br ill,
1995); on Iran, see Farhad Kazemi, ‘‘Civil Society and Iranian Politics,’’ in Norton; on the Gulf states, see Jill Crystal, ‘‘Civil Society in the Arab Gulf States,’’ in Norton; on Iraq, see Zuhair Humadi, ‘‘Civil Society under the Ba’th in Iraq,’’ in Jillian Schwedler, ed., Toward Civil Society in the Middle East? (Boulder, Colo.: Lynne Rienner, 1995). Other scholars have argued that the weakness of civil societ y in the Middle East has hampered a transition to democracy, without suggesting that oil wealth is the source of this weakness.

8/10/2019 Ross - Does Oil Hinder Democracy
http://slidepdf.com/reader/full/ross-does-oil-hinder-democracy 11/37
D O E S OI L H IND ER D EM O CR ACY ? 335
an indigenous bourgeoisie, but the growth of this class is in practice con-strained by the state’s own economic ventures and its links with interna-tional capital.’’32 Chaudhry, by contrast, argues that in the 1970s the
Mideast governments used their oil revenues to develop programs that were ‘‘explicitly designed to depoliticize the population. . . . In all cases,governments deliberately destroyed independent civil institutions whilegenerating others designed to facilitate the political aims of the state.’’33
Collectively, the taxation, spending, and group-formation effectsconstitute the rentier effect. Together they imply that a state’s fiscalpolicies influence its regime type: governments that fund themselvesthrough oil revenues and have larger budgets are more likely to be au-
thoritarian; governments that fund themselves through taxes and arerelatively small are more likely to become democratic.
THE R EPRESSION EFFECT
A close reading of case studies from the Mideast, Africa, and Southeast Asia suggests that oil wealth and authoritarianism may also be linked by repression. Citizens in resource-rich states may want democracy asmuch as citizens elsewhere, but resource wealth may allow their gov-ernments to spend more on internal security and so block the popula-
tion’s democratic aspirations. Skocpol notes that much of Iran’spre-1979 oil wealth was spent on the military, producing what she callsa ‘‘rentier absolutist state.’’34 Clark, in his study of the 1990s oil boom inthe Republic of Congo, finds that the surge in revenues allowed thegovernment to build up the armed forces and train a special presidentialguard to help maintain order.35 And Gause argues that Middle East de-mocratization has been inhibited in part by the prevalence of themukhabarat (national security) state.36
There are at least two reasons why resource wealth might lead to larger military forces. One may be pure self-interest: given the oppor-tunity to better arm itself against popular pressures, an authoritariangovernment will readily do so. A second reason may be that resource wealth causes ethnic or regional conflict; a larger military might reflectthe government’s response. Mineral wealth is often geographically con-
32 First (fn. 29), 137. 33 Kiren Aziz Chaudhry, ‘‘Economic Liberalization and the Lineages of the Rentier State,’’ Com-
parative Politics 27 (October 1994), 9. 34
ThedaSkocpol, ‘‘Rentier State and Shi’a Islam in the Iranian Revolution,’’ Theory and Society 11 (April 1982). 35 Clark (fn. 11, 1997). 36 F. Gregory Gause II, ‘‘Regional Influences on Experiments in Political Liberalization in the Arab
World,’’ in Rex Brynen, Bahgat Korany, and Paul Noble, eds., Political Liberalization and Democrati- zation in the Arab World, vol. 1, Theoretical Perspectives (Boulder, Colo.: Lynne Rienner, 1995).

8/10/2019 Ross - Does Oil Hinder Democracy
http://slidepdf.com/reader/full/ross-does-oil-hinder-democracy 12/37
336 WORLD POLI T ICS
centrated. If it happens to be concentrated in a region populated by anethnic or religious minority, resource extraction may promote or exac-erbate ethnic tensions, as federal, regional, and local actors compete for
mineral rights. These disputes may lead to larger military forces and less democracy in resource-rich, ethnically fractured states such as An-gola, Burma, the Democratic Republic of Congo, Indonesia, Nigeria,Papua New Guinea, Sierra Leone, and South Africa. This mechanism
would be consistent with the research of Collier and Hoeffler and deSoysa, who find that natural resource wealth tends to make civil warmore likely.37
THE MODERNIZATION EFFECT
Finally, a third explanation can be derived from modernization theory, which holds that democracy is caused by a collection of social and cul-tural changes-----including occupational specialization, urbanization, andhigher levels of education-----that in turn are caused by economic devel-opment.38 Different scholars emphasize different clusters of social andcultural changes. Perhaps the most carefully shaped position comesfrom Inglehart, who argues that two types of social change have a directimpact on the likelihood that a state will become democratic:
1. Rising education levels, which produce a more articulate public that is bet-ter equipped to organize and communicate, and
2. Rising occupational specialization, which first shifts the workforce into thesecondary sector and then into the tertiary sector. These changes produce a moreautonomous workforce, accustomed to thinking for themselves on the job andhaving specialized skills that enhance their bargaining power against elites.39
Although modernization theory does not address the question of re-source wealth per se, an implicit corollary is that if economic develop-ment does not produce these cultural and social changes, it will notresult in democratization. As Inglehart notes: ‘‘Is the linkage betweendevelopment and democracy due to wealth per se? Apparently not: ifdemocracy automatically resulted from simply becoming wealthy, thenKuwait and Libya would be model democracies.’’40 In other words, ifresource-led growth does not lead to higher education levels and
37 See Collier and Hoeffler (fn. 4); de Soysa (fn. 4). 38 Seymour Martin Lipset, ‘‘Some Social Requisites of Democracy: Economic Development and
Political Legitimacy,’’ American Political Science Review 53 (March 1959); Karl W. Deutsch, ‘‘Social Mobilization and Political Development,’’ American Political Science Review 55 (September 1961); In- glehart (fn. 1).
39 Inglehart (fn. 1), 163. 40 Ibid., 161.
8/10/2019 Ross - Does Oil Hinder Democracy
http://slidepdf.com/reader/full/ross-does-oil-hinder-democracy 13/37
D O E S OI L H IND ER D EM O CR ACY ? 337
greater occupational specialization, it should also fail to bring about de-mocracy. Unlike the rentier and repression effects, the modernizationeffect does not work through the state: it is a social mechanism, not a
political one. The rentier, repression, and modernization effects are largely com-
plementary. The rentier effect focuses on the government’s use of fiscalmeasures to keep the public politically demobilized; the repression ef-fect stresses the government’s use of force to keep the public demobi- lized; and the modernization effect looks at social forces that may keepthe public demobilized. All three explanations, or any combination ofthem, may be simultaneously valid.41
MODEL SPECIFICATION AND R ESEARCH DESIGN
To test the oil-impedes-democracy claim, I present a model to predictregime types and test it using a feasible generalized least-squaresmethod with a pooled time-series cross-national data set, which in-cludes data on all sovereign states with populations over one hundredthousand between 1971 and 1997. The model includes five causal vari-ables that according to previous studies are the most robust determi-
nants of democracy. It also includes variables that measure a state’s oiland mineral wealth to see if they add explanatory power.
The basic regression model is: Regime
i,t= a
1+ b
1(Oil
i,t-5 ) + b
2(Minerals
i,t-5 ) + b
3(Log Income
i,t-5 )
+ b4
(Islami ) + b
5 (OECD
i ) + b
6(Regime
i,t-5 ) + b
7 ( Year
1 ) . . . + b
33( Year
26 )
where i is the country and t is the year. The dependent variable, Regime, is derived from the Polity98 data
set constructed by Gurr and Jaggers.42 Gurr and Jaggers compile two 0---10 inter val scale variables, DEMOC and AU TOC; the former differ- entiates between states that are relatively democratic, while the latter variable differentiates between authoritarian states. Since the two indi- cators contain separate, nonoverlapping types of information about each country year, I combine them into a single measure by subtracting
41 A fourth explanation has been offered by U.S. vice president Richard Cheney, a political scientist by training: ‘‘The problem is that the good Lord didn’t see fit to put oil and gas reserves where there are
democratic governments.’’ Cited in David Ignatius, ‘‘Oil and Politics Mix Suspiciously Well in America,’’ Washington Post, July 30, 2000, A31.
42 Each of the variables is defined more precisely in Appendix 1. Ted R. Gurr and Keith Jaggers,‘‘Polity 98: Regime Characteristics, 1800---1998,’’ http://www.bsos.umd.edu/cidcm/polity/, 1999 (con-sulted March 1, 2000).
8/10/2019 Ross - Does Oil Hinder Democracy
http://slidepdf.com/reader/full/ross-does-oil-hinder-democracy 14/37
338 WORLD POLI T ICS
the autocracy measure from the democracy measure.43I then rescale itas a 0---10 variable, with 10 representing ‘‘most democratic.’’
Oil and Minerals are the independent variables; they measure the ex-
port value of mineral-based fuels (petroleum, natural gas, and coal) andthe export value of nonfuel ores and metals exports, as fractions of GDP.
These variables capture both the importance of fuels and minerals assources of export revenue and their relative importance in the domesticeconomy.44
The right-hand side of the equation also includes five control vari-ables designed to capture the factors most robustly associated withregime type, for which indicators are available for most of the countries
and years. The first is Income, measured as the natural log of per capitaGDP corrected for purchasing power parity (PPP), in current interna-tional dollars. Per capita income has been widely accepted as a correlateof democracy since Lipset; its validity has been confirmed in more re-cent tests by Burkhart and Lewis-Beck, Londregan and Poole, Prze-
worski and Limongi, and Barro.45
The second control variable is Islam, which denotes the Muslim per-centage of the state’s population in 1970.46 Previous studies have sug-gested that states with large Muslim populations tend to be less
democratic than non-Muslim states.47 Of all the religious categoriestested by Barro, Islam (measured the same way with the same data set)had by far the largest and most statistically significant influence on astate’s regime type.48 Placing Islam in this model has special importance
43 Here I am following the practice of John B. Londregan and Keith T. Poole, ‘‘Does High Income Promote Democracy?’’ World Politics 49 (October 1996).
44 Oil and Minerals are similar to the indicators used by Sachs and Warner (fn. 3, 1995) and by Leite and Weidmann (fn. 3) in their studies of the influence of resource wealth on economic performance.
While Sachs and Warner combinefuels, nonfuel minerals, and agricultural goods into a single var i- able, I consider them as separate variables to see if their regression coefficients (and hence their influ- ence on regime types) differ.
45 Lipset (fn. 38); Ross E. Burkhart and Michael S. Lewis-Beck ‘‘Comparative Democracy: The Economic Development Thesis,’’ American Political Science Review 88 (December 1994); Londregan and Poole (fn. 43); Przeworski and Limongi (fn. 2); Barro (fn. 13).
46 In virtually all cases, the figure for 1980 (the only other year for which data were available) was identical to the 1970 figure.
47 Salamé (fn. 22); Seymour Martin Lipset,’’The Social Requisites of Democracy Revisited,’’ Ameri - can Sociological Review 59 (February1994); Manus Midlarsky, ‘‘Democracy and Islam: Implications for Civilizational Conflict and the Democratic Peace,’’ International Studies Quarterly 42 (December 1998).
48 Barro (fn. 13). Observers offer different arguments to explain the negative correlation bet ween
democracy and Islamic populations (---.38). See, for example, Hisham Sharabi, Neopatriarchy: A Theor y of Distorted Change in Arab Society (New York: Oxford University Press, 1988); Bernard Lewis, ‘‘Islam and Liberal Democracy,’’ Atlantic Monthly 271 (February 1993); and Michael Hudson, ‘‘The Political Culture Approach to Arab Democratization: The Case for Bringing It Back In, Carefully,’’ in Br y nen, Korany, and Noble (fn. 36). Although they are negatively correlated for the period covered by this data set (1971---97), it is not obvious that they will continue to be negatively correlated in the future. T w o
8/10/2019 Ross - Does Oil Hinder Democracy
http://slidepdf.com/reader/full/ross-does-oil-hinder-democracy 15/37
D O E S OI L H IND ER D EM O CR ACY ? 339
because many states with great mineral wealth also have large Muslimpopulations, not only in the Middle East but also in parts of Asia (In-donesia, Malaysia, Brunei) and Africa (Nigeria). The simple correlation
between Oil and Islam is 0.44. The third control variable is OECD , a dummy that is coded 1 for
states that are members of the Organization for Economic Coopera-tion and Development (excluding newer members Mexico and SouthKorea) and 0 for all others. Previous researchers have found that the ad- vanced industrialized states of the OECD are significantly more likely to be democratic in the post---World War II era than the states of the de- veloping world, even after the influence of income and other factors are
accounted for.49
There is no consensus on why this is so. It has variously been attributed to the West’s unique historical trajectory;50 the culturalinfluence of Protestantism;51 the residual effects of Western colonialismon non-Western states;52 and a ‘‘world system’’ that constrains theprospects of states in the non-Western ‘‘periphery.’’53 Conceivably anyantidemocratic effects from Oil and Minerals might be spurious andmerely reflect the location of most fuel- and mineral-exporting statesin the non-Western world. The OECD dummy helps account for any ofthese Western-specific effects, without taking a position on the mech-
anisms behind it. The fourth control variable is Regime
t-5 , which is the dependent vari-
able lagged by five years. Placing it on the right-hand side of the modelhas three purposes. First, the most important influence on a state’sregime type may often be its own peculiar history; Regime
t-5helps cap-
ture any countr y-specific historical or cultural features that may bemissed by the other right-hand-side variables. Second, including
Regimet-5
helps turn the equation into a change model, transforming
the dependent variable from regime type to the change in a country’sregime type over a given five-year period. This helps ensure that the re-
states with large Islamic populations, Nigeria and Indonesia, have recently moved toward democracy,and some of the most important prodemocracy forces in other Islamic states (including Algeria, Egypt,
Jordan, and Malaysia) are often classified as Islamic ‘‘traditionalists’’ or ‘‘fundamentalists.’’ It is instruc-tive to recall that until the ‘‘third wave’’ of democratization began in the mid-1970s, democracy andCatholicism were negatively correlated.
49 See Burkhart and Lewis-Beck (fn. 45); Londregan and Poole (fn. 43); Przeworski and Limongi (fn. 2).
50
See Moore (fn. 28). 51 See Lipset (fn. 38); Huntington (fn. 10). 52 See Robert A. Dahl, Polyarchy: Participation and Opposition (New Haven: Yale University Press,
1971). 53 See Immanuel Wallerstein, The Modern World-System (New York: Academic Press, 1974); Bollen
(fn. 15); Burkhart and Lewis-Beck (fn. 45).

8/10/2019 Ross - Does Oil Hinder Democracy
http://slidepdf.com/reader/full/ross-does-oil-hinder-democracy 16/37
340 WORLD POLI T ICS
gression will indeed measure both time-series and cross-sectionalchanges in regime types. Third, Regime
t-5helps address the problem of
serial correlation that tends to bedevil pooled time-series cross-sec-
tional data sets.54
Finally, the model includes a set of twenty-six dummy variables, onefor each year covered by the data (1971---97), less one to mitigate auto-correlation. These are designed to capture two types of time-specific ef-fects. The first is the cold war, which may have blocked many transitionsto democracy. The second are contagion effects that influenced states atdifferent times in Southern and Eastern Europe, Latin America, andsub-Saharan Africa, where early transitions to democracy appeared to
boost the likelihood of subsequent transitions in proximate states. The tests were run with a feasible generalized least-squares processusing Stata 6.0.55 Since I include a lagged dependent variable on theright-hand side of the equation, I correct for first-order autocorrelationusing a panel-specific process, which allows the degree of autocorrela-tion to vary from country to country.
I use a five-year lag for all independent and control variables. The laggives more confidence that the causal arrow is pointing in the right di-rection; it also enables me to look for factors that have an enduring im-
pact on regime types. As I illustrate below, using shorter lags does notchange the results of the basic model, but it does increase the absolute value of the coefficient of the lagged dependent variable relative to theother explanatory variables. Hence with a one-year lag, a country’s cur-rent regime type becomes overwhelmingly a function of its regime typein the previous year, while the influence of other variables is artificiallysuppressed.56
R ESUL TS
For the basic model described below, Stata is able to utilize 2,183country-year obser vations from 113 states, out of a possible 3,752observations from 158 states. The data for each of the variables are sum-marized in Appendix 2.
54 James A. Stimson, ‘‘Regression in Space and Time: A Statistical Essay,’’ American Journal of Polit-ical Science 29 (November 1985); Nathaniel Beck and Jonathan N. Katz, ‘‘What to Do (and Not to Do) with Time-Series Cross-Section Data,’’ American Political Science Review 89 (September 1995).
55
Beck and Katz (fn. 54) recommend using ordinary least squares with ‘‘panel-corrected standarderrors’’ when working with panel data if the number of units is less than the number of time points. Inthis data set the number of units (113) exceeds the number of time points (27).
56 Christopher H. Achen, ‘‘Why Lagged Dependent Variables Can Suppress the Explanatory Powerof Other Independent Variables’’ (Paper presented at the annual meeting of the Political MethodologySection of the American Political Science Association, Los Angeles, July 20---22, 2000).
8/10/2019 Ross - Does Oil Hinder Democracy
http://slidepdf.com/reader/full/ross-does-oil-hinder-democracy 17/37
D O E S OI L H IND ER D EM O CR ACY ? 341
T ABLE 3 R ESOURCE W EALTH AND DEMOCR A C Y a
(DEPENDENT VARIABLE I S R EGIME)
1 2 3 4
Regime .253***(.0203)
.894***(.00846)
.25***(.0203)
.246***(.0204)
Oil ---.0346***(.0051)
---.0078***(.0024)
---.0339***(.00506)
---.0393***(.00543)
Minerals ---.0459***(.00778)
---.00718*(.00317)
---.0438***(.0081)
---.0455***(.00804)
Income (log) .922***(.105)
.119***(.0342)
.935***(.106)
.965***(.107)
Islam ---.018***(.00208)
---.0031***(.000665)
---.0178***(.0021)
---.0173***(.00211)
OECD 1.47***(.308)
.176*(.0781)
1.42***(.305)
1.44***(.308)
Food ----- ----- .0244*(.0102)
-----
Agriculture ----- ----- ----- .042 (.0239)
Observations 2183 2498 2182 2178
States Log likelihood
113 ---3133
115 ---3283
113 ---3129
113 ---3123
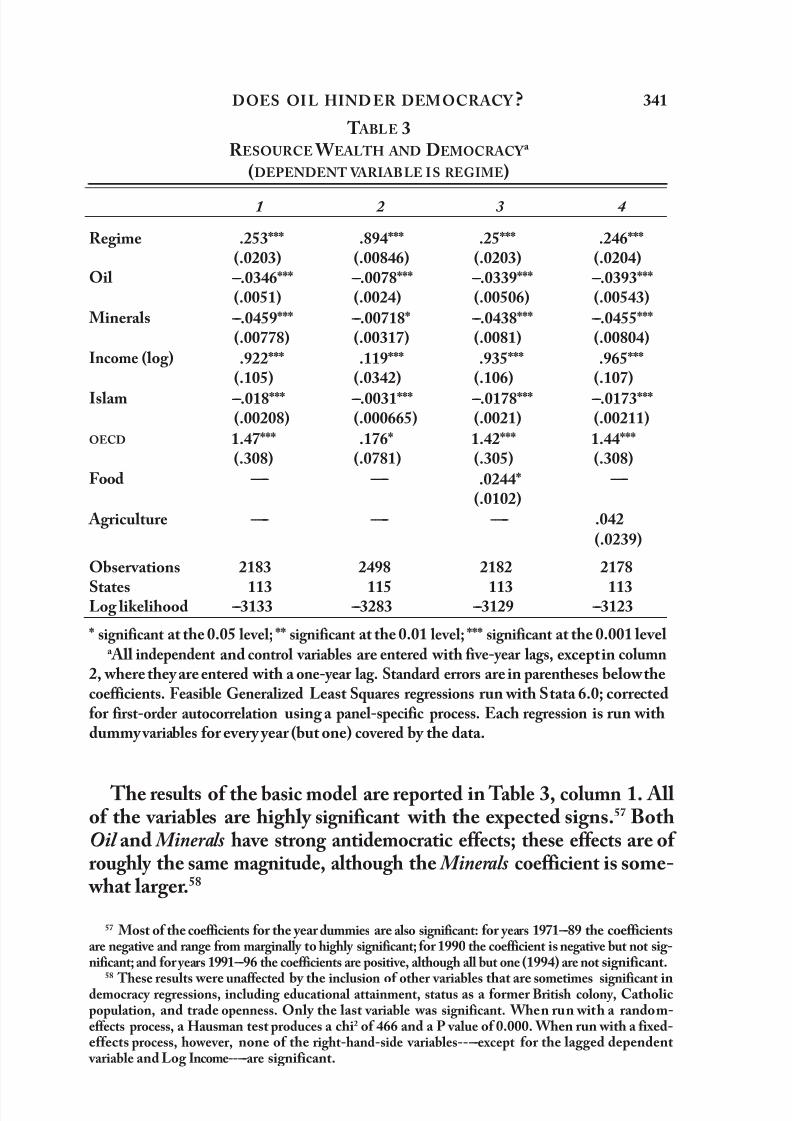
* significant at the 0.05 level; ** significant at the 0.01 level; *** significant at the 0.001 level a All independent and control variables are entered with five-year lags, except in column
2, where they are entered with a one-year lag. Standard errors are in parentheses below the coefficients. Feasible Generalized Least Squares regressions run with Stata 6.0; corrected for first-order autocorrelation using a panel-specific process. Each regression is run with dummy variables for every year (but one) covered by the data.
The results of the basic model are reported in Table 3, column 1. Allof the variables are highly significant with the expected signs.57 BothOil and Minerals have strong antidemocratic effects; these effects are ofroughly the same magnitude, although the Minerals coefficient is some-
what larger.58
57 Most of the coefficients for the year dummies are also significant: for years 1971---89 the coefficientsare negative and range from marginally to highly significant; for 1990 the coefficient is negative but not sig-nificant; and for years 1991---96 the coefficients are positive, although all but one (1994) are not significant.
58
These results were unaffected by the inclusion of other variables that are sometimes significant indemocracy regressions, including educational attainment, status as a former British colony, Catholicpopulation, and trade openness. Only the last variable was significant. When run with a random-effects process, a Hausman test produces a chi2 of 466 and a P value of 0.000. When run with a fixed-effects process, however, none of the right-hand-side variables-----except for the lagged dependent
variable and Log Income-----are significant.
8/10/2019 Ross - Does Oil Hinder Democracy
http://slidepdf.com/reader/full/ross-does-oil-hinder-democracy 18/37
8/10/2019 Ross - Does Oil Hinder Democracy
http://slidepdf.com/reader/full/ross-does-oil-hinder-democracy 19/37
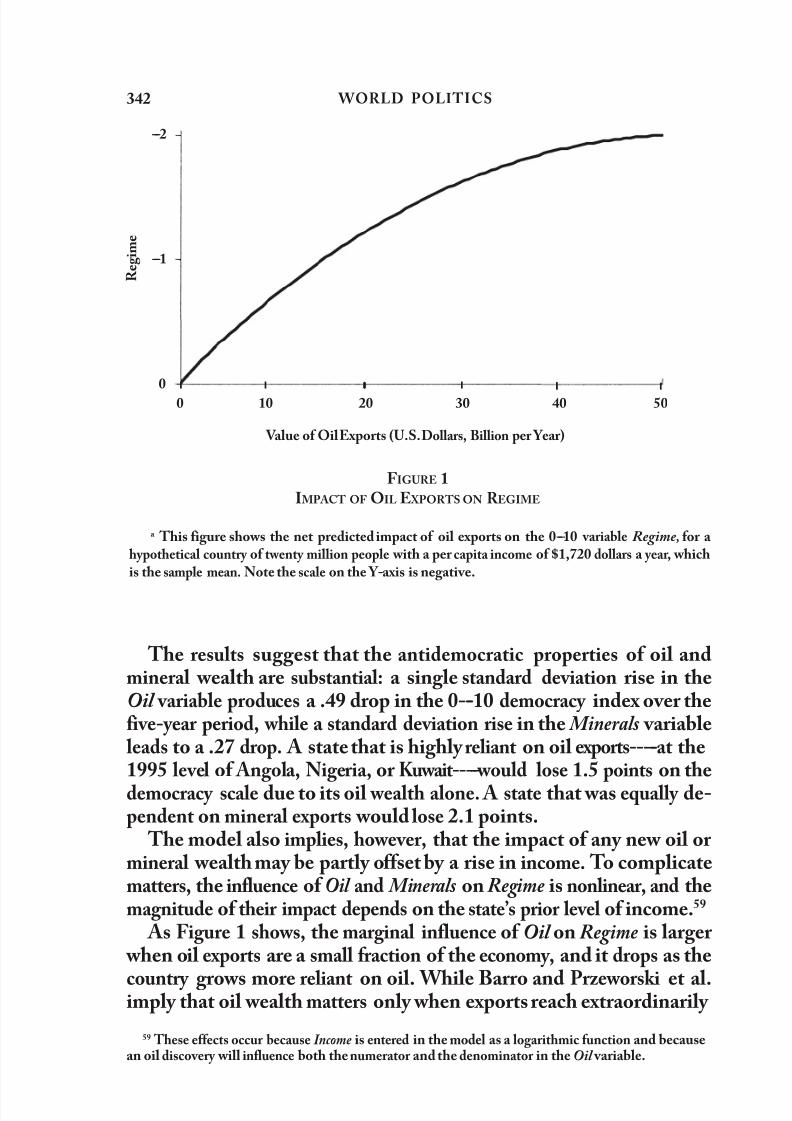
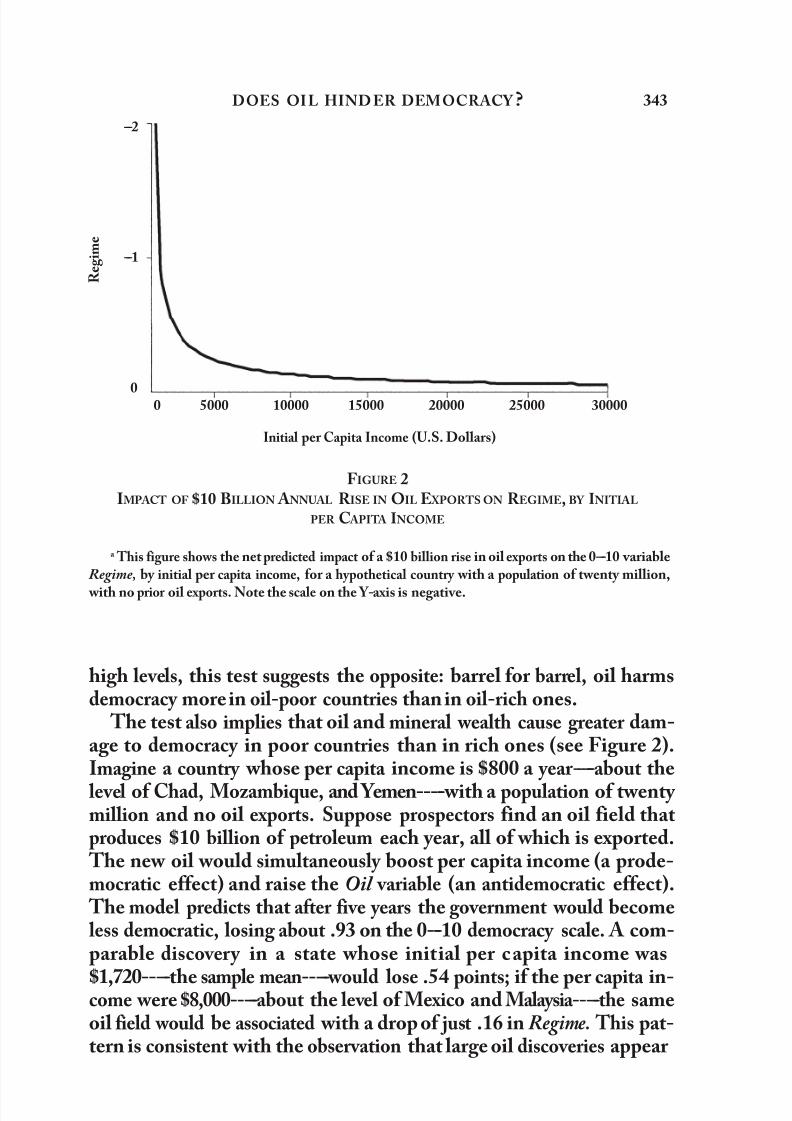
D O E S OI L H IND ER D EM O CR ACY ? 343
R e g i m e
---2
---1
0 0 5000 10000 15000 20000 25000 30000
Initial per Capita Income (U.S. Dollars)
F IGURE 2 IMPACT OF $10 BILLION A NNUAL R ISE IN OIL E XPORTS ON R EGIME, BY INITI A L
PER C APITA INCOME
a This figure shows the net predicted impact of a $10 billion rise in oil exports on the 0---10 variable Regime, by initial per capita income, for a hypothetical country with a population of twenty million,
with no prior oil exports. Note the scale on the Y-axis is negative.
high levels, this test suggests the opposite: barrel for barrel, oil harmsdemocracy more in oil-poor countries than in oil-rich ones.
The test also implies that oil and mineral wealth cause greater dam-age to democracy in poor countries than in rich ones (see Figure 2).Imagine a country whose per capita income is $800 a year-----about the
level of Chad, Mozambique, and Yemen-----with a population of twentymillion and no oil exports. Suppose prospectors find an oil field thatproduces $10 billion of petroleum each year, all of which is exported.
The new oil would simultaneously boost per capita income (a prode-mocratic effect) and raise the Oil variable (an antidemocratic effect).
The model predicts that after five years the government would become less democratic, losing about .93 on the 0---10 democracy scale. A com-parable disco v er y in a state whose initial per capita income was
$1,720-----the sample mean-----would lose .54 points; if the per capita in-come were $8,000-----about the level of Mexico and Malaysia-----the sameoil field would be associated with a drop of just .16 in Regime. This pat-tern is consistent with the observation that large oil discoveries appear
8/10/2019 Ross - Does Oil Hinder Democracy
http://slidepdf.com/reader/full/ross-does-oil-hinder-democracy 20/37
344 WORLD POLI T ICS
to have no discernible antidemocratic effects in advanced industrializedstates, such as Norway, Britain, and the U.S., but may harm or destabi-
lize democracy in poorer countries.
To determine how general and robust these effects are, I carry outfive additional tests. First, to see whether the results are sensitive to theduration of the lag on the right-hand-side variables, I run the samemodel using one-year lags on all the explanatory variables (Table 3, col-umn 2). All of the variables remain significant, although the absolute
value of the coefficient on the lagged regime type variable grows, andthe absolute values and significance of the coefficients on the other variables are reduced, perhaps artificially.60
Next, to see whether other types of commodity exports also inhibitdemocratization, I add two variables to the model: Food, which mea-sures the value of all food exports as a fraction of GDP, and Agriculture,
which measures the value of all nonfood agricultural exports as a frac-tion of GDP. As columns 3 and 4 of Table 3 show, the coefficients on
Food and Agriculture are both positive-----unlike Oil and Minerals, whichare negative. These findings are consistent with the rentier state thesis:oil and other minerals impede democracy, but other primary commodi-ties-----which generate few or no rents, produce less export income for
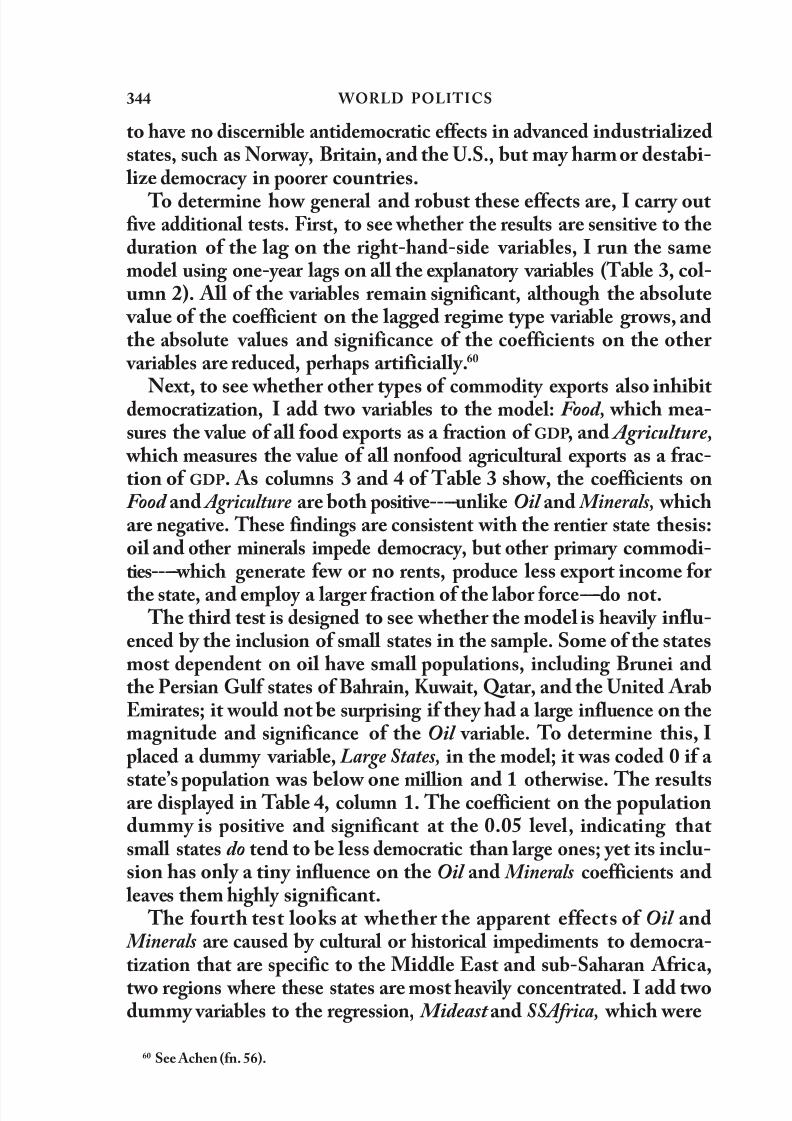
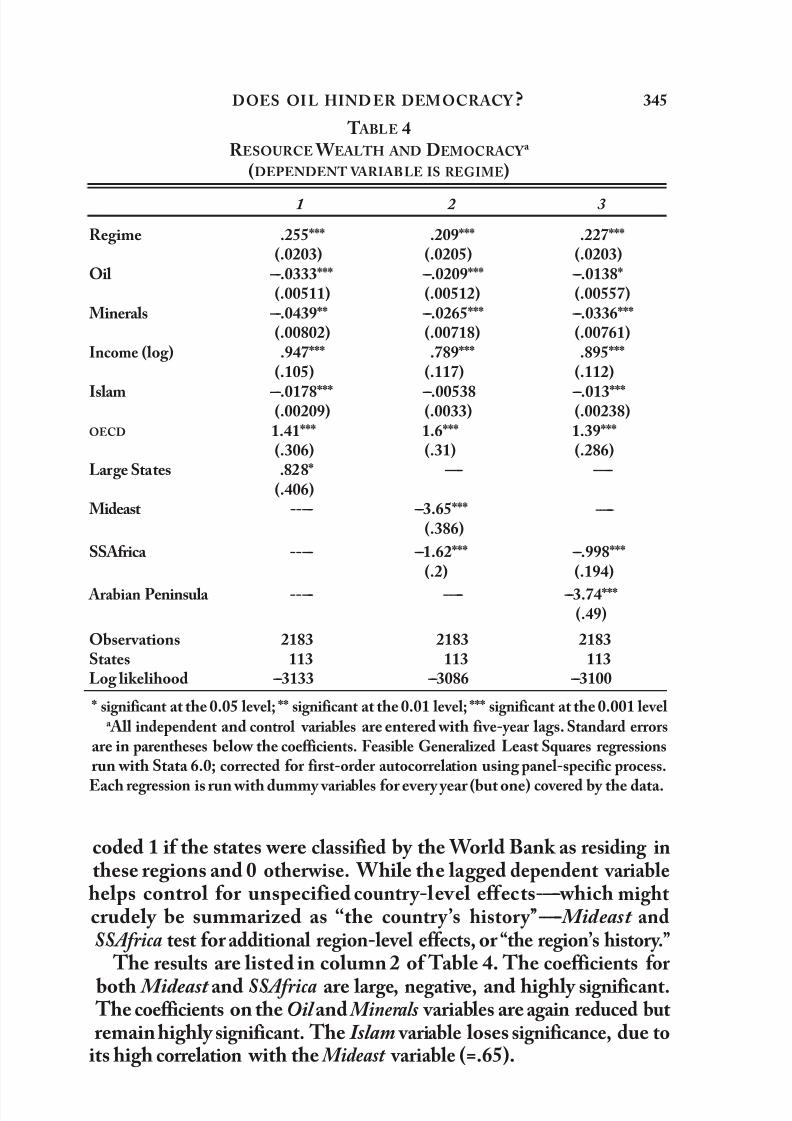
the state, and employ a larger fraction of the labor force-----do not. The third test is designed to see whether the model is heavily influ-
enced by the inclusion of small states in the sample. Some of the statesmost dependent on oil have small populations, including Brunei andthe Persian Gulf states of Bahrain, Kuwait, Qatar, and the United ArabEmirates; it would not be surprising if they had a large influence on themagnitude and significance of the Oil variable. To determine this, Iplaced a dummy variable, Large States, in the model; it was coded 0 if a
state’s population was below one million and 1 otherwise. The resultsare displayed in Table 4, column 1. The coefficient on the populationdummy is positive and significant at the 0.05 level, indicating thatsmall states do tend to be less democratic than large ones; yet its inclu-sion has only a tiny influence on the Oil and Minerals coefficients and leaves them highly significant.
The fourth test looks at whether the apparent effects of Oil and Minerals are caused by cultural or historical impediments to democra-tization that are specific to the Middle East and sub-Saharan Africa,
two regions where these states are most heavily concentrated. I add twodummy variables to the regression, Mideast and SSAfrica, which were
60 See Achen (fn. 56).
8/10/2019 Ross - Does Oil Hinder Democracy
http://slidepdf.com/reader/full/ross-does-oil-hinder-democracy 21/37
D O E S OI L H IND ER D EM O CR ACY ? 345
T ABLE 4 R ESOURCE W EALTH AND DEMOCR A C Y a
(DEPENDENT VARIABLE IS R EGIME)
1 2 3
Regime .255***(.0203)
Oil ---.0333***(.00511)
Minerals ---.0439**(.00802)
Income (log) .947***(.105)
Islam ---.0178***(.00209)
OECD 1.41***(.306)
.209***(.0205) ---.0209***(.00512) ---.0265***(.00718) .789***
(.117)
---.00538(.0033) 1.6***(.31)
.227***(.0203) ---.0138*(.00557) ---.0336***(.00761) .895***
(.112)
---.013***(.00238) 1.39***(.286)
Large States .828* ----- -----(.406)
Mideast ----- ---3.65***(.386)
SSAfrica ----- ---1.62***(.2)
-----
---.998***(.194)
Arabian Peninsula ----- ----- ---3.74*** (.49)
Observations 2183 2183 2183 States Log likelihood
113 ---3133
113 ---3086
113 ---3100
* significant at the 0.05 level; ** significant at the 0.01 level; *** significant at the 0.001 level a All independent and control variables are entered with five-year lags. Standard errors
are in parentheses below the coefficients. Feasible Generalized Least Squares regressions run with Stata 6.0; corrected for first-order autocorrelation using panel-specific process.
Each regression is run with dummy variables for every year (but one) covered by the data.
coded 1 if the states were classified by the World Bank as residing inthese regions and 0 otherwise. While the lagged dependent var iablehelps control for unspecified countr y-level effects-----which mightcrudely be summarized as ‘‘the countr y ’s histor y’’----- Mideast andSSAfrica test for additional region-level effects, or ‘‘the region’s histor y .’’
The results are listed in column 2 of Table 4. The coefficients for
both Mideast and SSAfrica are large, negative, and highly significant. The coefficients on the Oil and Minerals variables are again reduced butremain highly significant. The Islam variable loses significance, due to
its high correlation with the Mideast variable (=.65).

8/10/2019 Ross - Does Oil Hinder Democracy
http://slidepdf.com/reader/full/ross-does-oil-hinder-democracy 22/37
346 WORLD POLI T ICS
For the final test, I use a new dummy, Arabian Peninsula, in place ofthe Mideast dummy; it was coded 1 for the seven states of the ArabianPeninsula (Bahrain, Kuwait, Oman, Saudi Arabia, Qatar, the United
Arab Emirates, and Yemen) and 0 otherwise. Conceivably the Mideastdummy is too broad, since it attempts to capture the effects of residingin a region that is socially and geologically diverse. The antidemocraticeffects of oil might be somewhat more restricted to the Arabian Penin-sula, which is dominated by monarchies, sparsely populated, and en-dowed with spectacular oil wealth. Using Arabian Peninsula instead of Mideast reduces the problem of collinearity with Islam, although Ara-bian Peninsula and Oil remain highly collinear (simple correlation
=.74). Still, while including the Arabian Peninsula dummy reduces themagnitude of the Oil coefficient by about 60 percent, Oil remains sig-nificant at the 0.05 level.
These tests support both the validity and the generality of the oil-impedes-democracy claim. They suggest the following: that a state’s re- liance on either oil or mineral exports tends to make it less democratic;that this effect is not caused by other types of primary exports; that it isnot limited to the Arabian Peninsula, to the Middle East, or to sub-Sa-haran Africa; and that it is not limited to small states. These findings
are generally consistent with the theory of the rentier state. Area specialists might also feel vindicated in noting that in these
tests the most powerful impediments to democracy include the vari-ables Regime
t-5 , Mideast, and Arabian Peninsula, which represent the ac-
cumulation of historical and cultural factors in each country, and in the Arabian Peninsula and Mideast regions, that are not captured by in-come, resource wealth, Islam, or non-Western status. This underscoresthe critical importance of case studies in explaining regime types.
C AUSAL MECHANISMS
To test the three causal mechanisms I add to the basic model a series ofintervening variables, lagged by one year. Adding new variables reducesthe sample size from 2,183 observations to between 2,183 and 426 ob-servations. As the sample shrinks, it becomes increasingly skewed to-
ward states that are relatively wealthy, democratic, and Western,introducing a pronounced sample bias. To minimize this problem, afterrunning each of the following regressions, I run a second regressionusing the same reduced sample, but without the intervening variable. Ithen compare the two regressions. If the intervening variable is valid, itshould be statistically significant, and-----if the Oil and Minerals variables
8/10/2019 Ross - Does Oil Hinder Democracy
http://slidepdf.com/reader/full/ross-does-oil-hinder-democracy 23/37
D O E S OI L H IND ER D EM O CR ACY ? 347
are significant in the reduced sample-----its inclusion should reduce theabsolute values of the Oil and Minerals coefficients. This provides at least a crude test of some of the causal mechanisms.
R ENTIER EFFECT
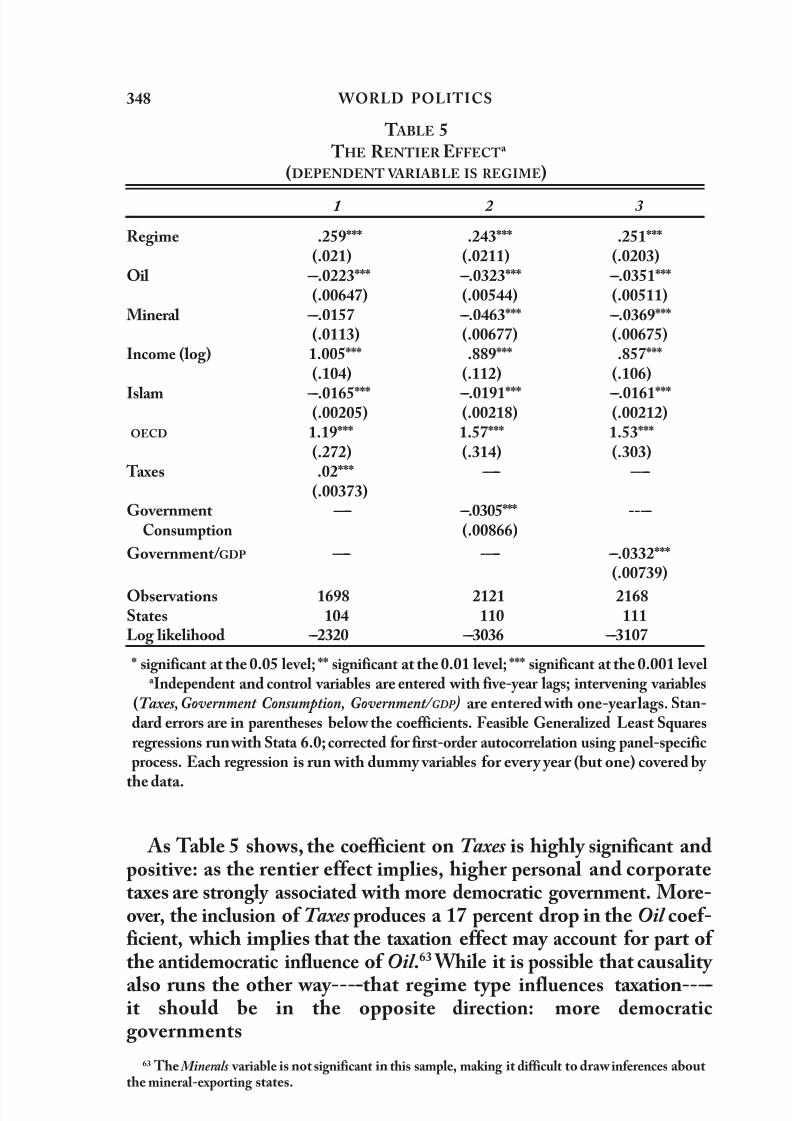
To test the rentier hypothesis, I use three indicators. For the taxationeffect I use the variable Taxes, which is the percentage of governmentrevenue collected through taxes on goods, services, income, profits, andcapital gains. The taxation effect implies that states that fund them-selves through these assorted personal and corporate taxes (and hencehave higher values on the Taxes variable) should be more democratic;
conversely, states that fund themselves through other means (such astrade taxes, parastatals, external grants, and right-of-way fees) should be more authoritarian. The variable is constructed from data collected by the International Monetary Fund and covers 104 of the 113 statesin the basic model.
To test the spending effect I use Government Consumption, whichmeasures government consumption as a percentage of GDP; this in-cludes all current spending for purchases of goods and services (includ-ing wages and salaries) by all levels of government. If the spending effect
is valid, higher levels of government spending should result in less de-mocracy. The data cover 104 states and are compiled by the WorldBank, which in turn collects information from the OECD, national sta-tistical organizations, central banks, and World Bank missions.
The third variable is Government/ GDP , which measures the share ofGDP accounted for by government activity, in 1985 international prices;the data are from Summers and Heston.61 This final indicator is one
way to look for a group-formation effect. Proponents of this effect
imply that as governments increase in size (relative to the domesticeconomy) they are more likely to prevent the formation of civic institu-tions and social groups that are independent from the government, andthat the absence of these groups will hinder a transition to democracy.62
Without good indicators for civic institutions or social groups, this hy-pothesis cannot be tested directly with regression analysis. Still, theGovernment/ GDP variable offers an indirect test: the greater the govern-ment ’s size (as a fraction of GDP), the less likely that independent so-cial groups will form.
61 Robert Summers and Alan Heston, ‘‘Penn World Tables, Version 5.6,’’ http://cansim.epas.utoronto.ca;5680/pwt/pwt.htm/, 1999 (consulted March 1, 2000).
62 Of course, a larger budget may not be the only cause of such government actions, but it is the onlycause that can be linked to resource wealth in an obvious way.
8/10/2019 Ross - Does Oil Hinder Democracy
http://slidepdf.com/reader/full/ross-does-oil-hinder-democracy 24/37
348 WORLD POLI T ICS
T ABLE 5 THE R ENTIER EFFECTa
(DEPENDENT VARIABLE IS R EGIME)
1 2 3
Regime .259***(.021)
Oil ---.0223***(.00647)
Mineral ---.0157(.0113)
Income (log) 1.005***(.104)
Islam ---.0165***(.00205)
OECD 1.19***(.272)
.243***(.0211) ---.0323***(.00544) ---.0463***(.00677) .889***
(.112)
---.0191***(.00218) 1.57***(.314)
.251***(.0203) ---.0351***(.00511) ---.0369***(.00675) .857***
(.106)
---.0161***(.00212) 1.53***(.303)
Taxes .02*** ----- -----(.00373)
Government Consumption
----- ---.0305*** -----(.00866)
Government/GDP ----- ----- ---.0332***(.00739)
Observations 1698 2121 2168 States 104 110 111 Log likelihood ---2320 ---3036 ---3107
* significant at the 0.05 level; ** significant at the 0.01 level; *** significant at the 0.001 levela Independent and control variables are entered with five-year lags; intervening var iables
(Taxes, Government Consumption, Government/ GDP ) are entered with one-year lags. Stan-dard errors are in parentheses below the coefficients. Feasible Generalized Least Squaresregressions run with Stata 6.0; corrected for first-order autocorrelation using panel-specificprocess. Each regression is run with dummy variables for every year (but one) covered by
the data.
As Table 5 shows, the coefficient on Taxes is highly significant andpositive: as the rentier effect implies, higher personal and corporatetaxes are strongly associated with more democratic government. More-over, the inclusion of Taxes produces a 17 percent drop in the Oil coef-ficient, which implies that the taxation effect may account for part ofthe antidemocratic influence of Oil .63 While it is possible that causality
also runs the other way-----that regime type influences taxation-----it should be in the opposite direction: more democraticgovernments
63 The Minerals variable is not significant in this sample, making it difficult to draw inferences aboutthe mineral-exporting states.

8/10/2019 Ross - Does Oil Hinder Democracy
http://slidepdf.com/reader/full/ross-does-oil-hinder-democracy 25/37
D O E S OI L H IND ER D EM O CR ACY ? 349
should be less disposed to fund themselves through personal and cor-porate taxes, given their unpopularity.
The effect of taxes on regime types turns out to be strictly short
term: when Taxes is introduced into the model with a two- or three- year lag, its coefficient quickly drops in size and loses significance. Thisimplies that tax increases have only short-term effects on democracy:people tend to respond to tax hikes right away or not at all.64
The Government Consumption variable is also highly significant inthe hypothesized direction (Table 5, column 2). W hen GovernmentConsumption is included in the model, Oil and Minerals drop slightly, by 7 and 6 percent, respectively. The spending effect appears to last
longer than the taxation effect: the Government Consumption variablehas much the same effect on regime type after three years as it doesafter one.
These results are not likely caused by endogeneity. While there is ev-idence that regime type influences levels of government consumption,it is in the opposite direction found here: democratic governments tendto favor higher levels of social spending than their authoritarian coun-terparts.65
Finally, Government/ GDP is also highly significant with the hypothe-
sized sign: the larger the government, the less movement toward de-mocracy over the following five years. Its inclusion has no effect on theOil variable but produces a 12 percent drop in the Minerals variable(Table 5, column 3).
In short, the results are consistent with all three aspects of the rentiereffect.
R EPRESSION EFFECT
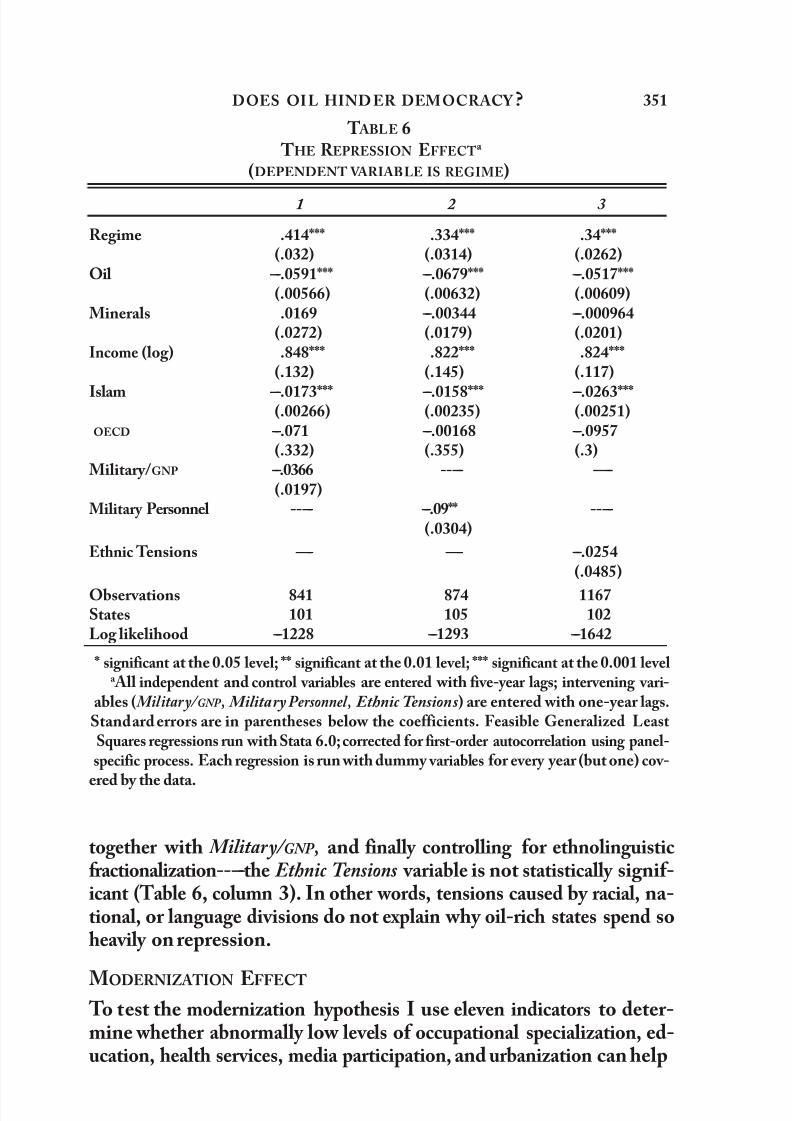
I use two variables to test the hypothesis that resource wealth causesgovernments to arm themselves more heavily against popular pressures. The first is Military/ GNP , which measures the size of the military bud-get as a fraction of GNP. The data were originally collected by the ArmsControl and Disarmament Agency ( ACDA ) of the U.S. government and
64 Note that other studies have found that a go ver nment ’s reliance on personal and corporate taxrevenues is strongly and negatively influenced by per capita income: poor states tend to rely on tradetaxes, rich ones on personal and corporate taxes. See William Easterly and Sergio Rebelo, ‘‘Fiscal Pol-
icy and Economic Growth,’’ Journal of Monetary Economics 32 (December 1993); Howell H. Zee, ‘‘Em-pirics of Cross-Country Tax Revenue Comparisons,’’ World Development 24 (October 1996). Since percapita income is included in the model, the actual effect of Taxes on regime types is probably largerthan the coefficient in this regression suggests.
65 David S. Brown and Wendy Hunter, ‘‘Democracy and Social Spending in Latin America, 1980---92,’’ American Political Science Review 93 (December 1999).
8/10/2019 Ross - Does Oil Hinder Democracy
http://slidepdf.com/reader/full/ross-does-oil-hinder-democracy 26/37
350 WORLD POLI T ICS
cover 101 states between 1985 and 1995.66 Since resource-rich statestend to have government budgets that are atypically large relative to thesize of their economies, this is a better indicator than military spend-
ing as a fraction of government spending. The second variable is Military Personnel, which measures the size of
the military as a fraction of the labor force; it includes some paramili-tary forces ‘‘if those forces resemble regular units in their organization,equipment, training, or mission.’’ The data are also from ACDA and areavailable from 1985 to 1995 for 105 of the states in the database. Un- like the Military/ GNP measure, this indicator helps control for variationsin military wages and the presence of conscription across states.
When Oil, Minerals, and Income are regressed on Military/ GNP di-rectly (with a five-year lag), the behavior of oil exporters and mineralexporters diverges. Oil exports are indeed positively and significantlycorrelated with military spending, as the repression hypothesis suggests;
but mineral exports are negatively and significantly associated withmilitary spending. Neither variable is significantly linked with Military
Personnel. When Military/ GNP is placed in the basic model of regime types, its
coefficient is negative and marginally significant at the 0.10 level; its in-
clusion produces a 6 percent drop in the Oil coefficient (Table 6). The Military Personnel coefficient is negative and highly significant, al-though it paradoxically induces a 7 percent rise in Oil . In both samplesthe Minerals coefficient is not significant and cannot be interpreted.O verall, it appears that oil wealth may be linked to higher levels ofmilitary spending, which in turn tends to impede democracy, as the re-pression effect suggests. But there is no evidence of a similar pattern formineral wealth; nor is there evidence to support the claim that oil or
mineral wealth leads to higher levels of military personnel. Why do oil-rich governments invest as much as they do on theirmilitaries? Is it to repress popular pressures, or is it a response to higher levels of instability? To address this question I use data from the Polit-ical Risk Services Group, a private firm that uses subjective measures togauge investment risks for its clients. It produces a 0---6 measure of Eth-nic Tensions, which measures ‘‘the degree of tension within a country at-tributable to racial, nationality, or language divisions.’’ Scores areavailable for 102 states between 1982 and 1997. Higher values indicate
less ethnic tension. When added to the model-----first separately, then
66 Since the data cover only eleven years, the maximum number of possible observations for these re-gressions drops from 3,752 to 1,642.
8/10/2019 Ross - Does Oil Hinder Democracy
http://slidepdf.com/reader/full/ross-does-oil-hinder-democracy 27/37
D O E S OI L H IND ER D EM O CR ACY ? 351
Ethnic Tensions ----- ----- ---.0254(.0485)
Observations 841 874 1167 States Log likelihood
101 ---1228
105 ---1293
102 ---1642
T ABLE 6 THE R EPRESSION EFFECTa
(DEPENDENT VARIABLE IS R EGIME)
1 2 3
Regime .414***(.032)
Oil ---.0591***(.00566)
Minerals .0169(.0272)
Income (log) .848***(.132)
Islam ---.0173***(.00266)
OECD ---.071(.332)
.334***(.0314) ---.0679***(.00632) ---.00344(.0179) .822***
(.145)
---.0158***(.00235) ---.00168(.355)
.34***(.0262) ---.0517***(.00609) ---.000964(.0201) .824***
(.117)
---.0263***(.00251) ---.0957(.3)
Military/GNP ---.0366 ----- -----(.0197)
Military Personnel ----- ---.09** -----(.0304)
* significant at the 0.05 level; ** significant at the 0.01 level; *** significant at the 0.001 levela All independent and control variables are entered with five-year lags; intervening vari-
ables ( Military/ GNP , Military Personnel, Ethnic Tensions) are entered with one-year lags.Standard errors are in parentheses below the coefficients. Feasible Generalized LeastSquares regressions run with Stata 6.0; corrected for first-order autocorrelation using panel-specific process. Each regression is run with dummy variables for every year (but one) cov-
ered by the data.
together with Military/ GNP , and finally controlling for ethnolinguisticfractionalization-----the Ethnic Tensions variable is not statistically signif-icant (Table 6, column 3). In other words, tensions caused by racial, na-tional, or language divisions do not explain why oil-rich states spend soheavily on repression.
MODERNIZATION EFFECT
To test the modernization hypothesis I use eleven indicators to deter-mine whether abnormally low levels of occupational specialization, ed-ucation, health services, media participation, and urbanization can help

8/10/2019 Ross - Does Oil Hinder Democracy
http://slidepdf.com/reader/full/ross-does-oil-hinder-democracy 28/37
352 WORLD POLI T ICS
explain the dearth of democracy in the resource-rich states. The largenumber of indicators allows me to test both Inglehart’s version of mod-ernization theory and earlier versions described by Lerner, Deutsch,
and Lipset. According to Inglehart, occupational specialization and education
are the key links between economic growth and democracy. To measureoccupational specialization I look at the number of men and women inthe economy’s secondary (industrial) and tertiary (services) sectors as afraction of the men and women in the economically active population.
These data are drawn from the International Labor Organization andcover 76 of the 113 states used in the basic model.
For educational levels, I use figures on the enrollment of men and women in secondar y school as a fraction of the corresponding agegroup in the population at large and figures on college enrollment as afraction of the population. Both data sets are collected by national gov-ernments and assembled by the United Nations Educational, Scientific,and Cultural Organization (UNESCO). Figures on secondary enrollmentare available for forty-eight countries; figures on college enrollment areavailable for ninety-six countries.
Early proponents of modernization theory suggested that improve-
ments in a population’s physical health can also lead to democratiza-tion.67 More recently Inglehart has argued that as a population’s basicnutritional and health needs are satisfied, they will increasingly turnto ‘‘postmater ialist ’’ values, including a desire for self-expression andindividual freedom; this value shift, in turn, will facilitate more dem-ocratic government.68 Earlier scholars measured the quality of a popu- lation’s health by using the number of doctors per capita. Here I use life expectancy at birth, a measure that also accounts for nutrition lev-
els and the distribution of health services across the population. Theunderlying data are compiled by several UN agencies and cover ninetystates.
In Lipset’s classic analysis, the greater a society’s level of ‘‘media par-ticipation,’’ the more likely it is to be democratic.69 Lipset measuredmedia participation using telephones, radios, and newspaper copies percapita. To update these indicators slightly, I measure both the numberof telephone mainlines and televisions per capita. Data on telephonemainlines and televisions are collected by the International Telecom-
67 Daniel Lerner, The Passing of Traditional Society (New York: Free Press, 1958); Deutsch (fn. 38). 68 Inglehart (fn. 1). 69 Lipset (fn. 38).
8/10/2019 Ross - Does Oil Hinder Democracy
http://slidepdf.com/reader/full/ross-does-oil-hinder-democracy 29/37
D O E S OI L H IND ER D EM O CR ACY ? T ABLE 7
THE MODERNIZATION EFFECTa
(DEPENDENT VARIABLE I S R EGIME)
353
1 2 3 4
Regime .529***(.0316)
Oil ---.0182(.0221)
Minerals .146*(.0666)
Income (log) ---.251(.305)
Islam ---.0121(.0082)
OECD .752*(.419)
.462***(.0408) ---.116(.0202) .112
(.0635) .565*
(.271)
---.0154**(.00545) .652
(.432)
.513***(.0336) ---.0187(.0207) .0952
(.0657) ---.408(.343)
---.0232***(.00652) 1.13**(.372)
.604***(.0324) ---.0315(.0234) .115
(.0714) 3.8(.344)
---.000534(.0104) .391
(.419) Men in
Industry .0733***
(.0143) ----- ----- -----
Women in Industry
----- .0814*** ----- -----(.0166)
Men in Services
----- ----- .0685*** -----(.0155)
Women in Ser v ices
----- ----- ----- ---.0185***(.00512)
Observations 626 615 622 629 States 75 75 76 76 Log likelihood ---878 ---772 ---835 ---921
* significant at the 0.05 level; ** significant at the 0.01 level; *** significant at the 0.001 levela All independent and control variables are entered with five-year lags; intervening vari-
ables ( Men in Industry, Women in Industry, Men in Services, Women in Services) are entered with one-year lags. Standard errors are in parentheses below the coefficients. Feasible Gen-
eralized Least Squares regressions run with Stata 6.0; corrected for first-order autocorrela-tion using panel-specific process. Each regression is run with dummy variables for e v er y
year (but one) covered by the data.
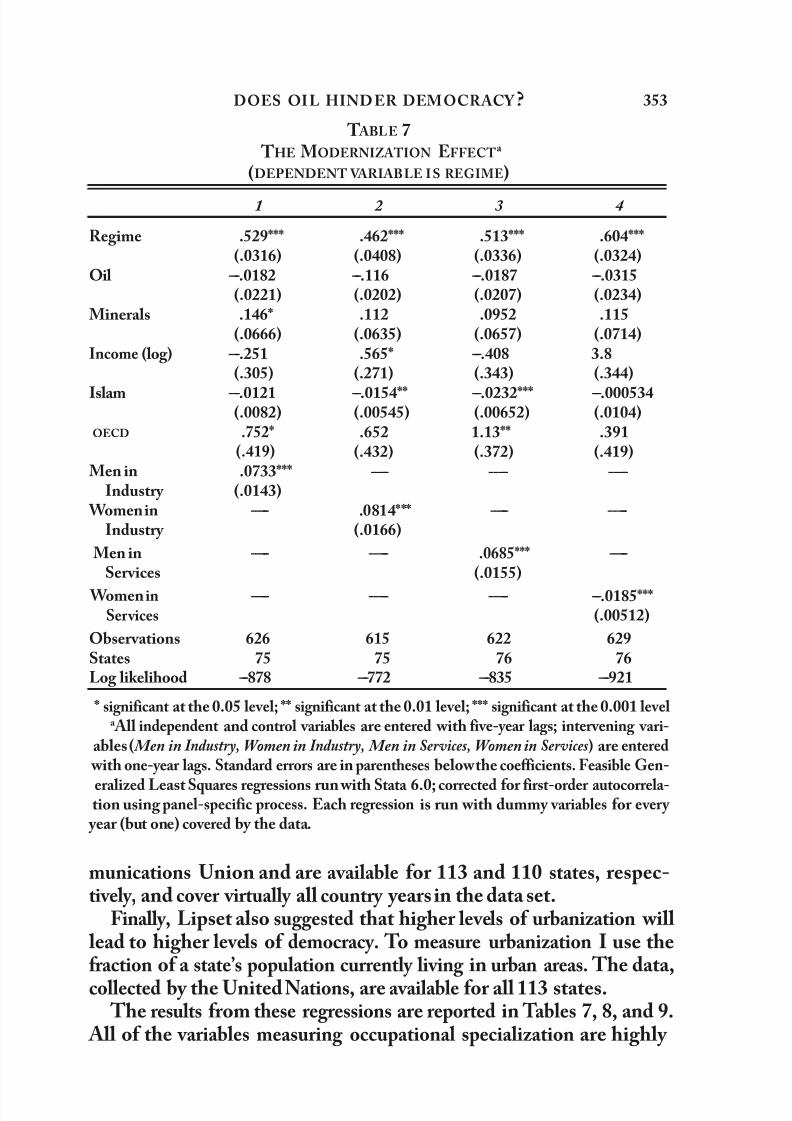
munications Union and are available for 113 and 110 states, respec-tively, and cover virtually all country years in the data set.
Finally, Lipset also suggested that higher levels of urbanization will lead to higher levels of democracy. To measure urbanization I use thefraction of a state’s population currently living in urban areas. The data,
collected by the United Nations, are available for all 113 states. The results from these regressions are reported in Tables 7, 8, and 9.
All of the variables measuring occupational specialization are highly

8/10/2019 Ross - Does Oil Hinder Democracy
http://slidepdf.com/reader/full/ross-does-oil-hinder-democracy 30/37
354 WORLD POLI T ICS
T ABLE 8 THE MODERNIZATION EFFECTa
(DEPENDENT VARIABLE IS R EGIME)
1 2 3
Regime .378***(.0449)
Oil ---.0158(.00966)
Minerals .0251(.0431)
Income (log) .258(.296)
Islam ---.0393***(.00507)
OECD .159(.345)
.378***(.0451) ---.0168(.00952) .0255
(.0433) .364
(.29)
---.0385***(.00479) .187
(.336)
.34***(.0334) ---.033***(.00991) .0517
(.0325) .678***
(.19)
---.0348***(.00407) ---.0759(.436)
Male Secondar y Enr ollment
.004 ----- -----(.00856)
Female Secondar y Enr ollment
----- .000812 -----(.00882)
College Enrollment ----- ----- ---.00289(.0105)
Observations 426 426 688 States 48 48 96 Log likelihood ---566 ---563 ---1109
* significant at the 0.05 level; ** significant at the 0.01 level; *** significant at the 0.001 levela All independent and control variables are entered with five-year lags; intervening var i-
ables ( MaleSecondary Enrollment, Female Secondary Enrollment, College Enrollment ) are en-tered with one-year lags. Standard errors are in parentheses below the coefficients. FeasibleGeneralized Least Squares regressions run with Stata 6.0; corrected for first-order auto-correlation using panel-specific process. Each regression is run with dummy variables for
every year (but one) covered by the data.
significant and positively associated with democracy, as predicted byproponents of modernization theory. The evidence that oil and mineral
wealth influence occupational specialization, however, is somewhat weak.70 The variables measuring education, life expectancy, urbaniza-tion, and televisions per capita are not significant, while the measure of
70
Neither Oil nor Minerals is significantly correlated with democracy in these reduced samples, which makes it hard to be confident about these results. When Oil and Minerals are regressed on eachof the four variables for occupational specialization (with Income and Islam included as control vari-ables), the results are mixed: Oil is negatively correlated with Men in Industry but positively correlated with Women in Industry; Minerals is not significantly correlated with Men in Industry and is negatively, but weakly, linked to Women in Industry.
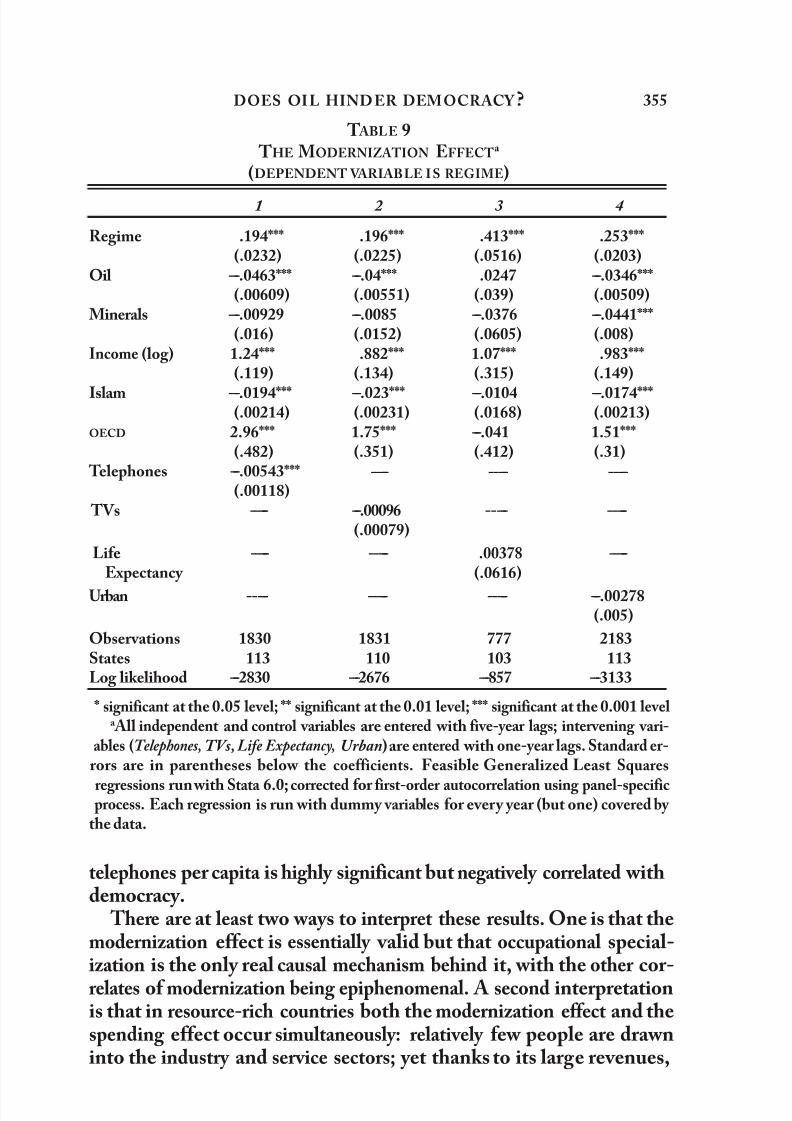
8/10/2019 Ross - Does Oil Hinder Democracy
http://slidepdf.com/reader/full/ross-does-oil-hinder-democracy 31/37
D O E S OI L H IND ER D EM O CR ACY ? T ABLE 9
THE MODERNIZATION EFFECTa
(DEPENDENT VARIABLE I S R EGIME)
355
1 2 3 4
Regime .194***(.0232)
Oil ---.0463***(.00609)
Minerals ---.00929(.016)
Income (log) 1.24***(.119)
Islam ---.0194***(.00214)
OECD 2.96***(.482)
.196***(.0225) ---.04***(.00551) ---.0085(.0152) .882***
(.134)
---.023***(.00231) 1.75***(.351)
.413***(.0516) .0247
(.039) ---.0376(.0605) 1.07***(.315)
---.0104(.0168) ---.041(.412)
.253***(.0203) ---.0346***(.00509) ---.0441***(.008) .983***
(.149)
---.0174***(.00213) 1.51***(.31)
Telephones ---.00543***(.00118)
----- ----- -----
TVs ----- ---.00096 ----- -----(.00079)
Life Expectancy
----- ----- .00378 -----(.0616)
Urban ----- ----- ----- ---.00278(.005)
Observations 1830 1831 777 2183 States 113 110 103 113 Log likelihood ---2830 ---2676 ---857 ---3133
* significant at the 0.05 level; ** significant at the 0.01 level; *** significant at the 0.001 levela All independent and control variables are entered with five-year lags; intervening vari-
ables (Telephones, TVs, Life Expectancy, Urban) are entered with one-year lags. Standard er-rors are in parentheses below the coefficients. Feasible Generalized Least Squares
regressions run with Stata 6.0; corrected for first-order autocorrelation using panel-specificprocess. Each regression is run with dummy variables for every year (but one) covered by
the data.
telephones per capita is highly significant but negatively correlated withdemocracy.
There are at least two ways to interpret these results. One is that themodernization effect is essentially valid but that occupational special-ization is the only real causal mechanism behind it, with the other cor-relates of modernization being epiphenomenal. A second interpretationis that in resource-rich countries both the modernization effect and thespending effect occur simultaneously: relatively few people are drawninto the industry and service sectors; yet thanks to its large revenues,

8/10/2019 Ross - Does Oil Hinder Democracy
http://slidepdf.com/reader/full/ross-does-oil-hinder-democracy 32/37
356 WORLD POLI T ICS
the government can generously subsidize education, health care, andother services. The result is that the public enjoys generous social serv-ices yet is politically hampered by two antidemocratic forces: a lack of
occupational specialization and a government that uses its fiscal powersto dampen dissent.
The results of these tests are at least weakly consistent with each ofthe three causal mechanisms. Collectively, they provide quantitative backing for the rentier effects described by a generation of Mideastspecialists, for the repression effects observed in the case studies above,and for a modified form of the modernization thesis. Still, the causalitytests rely on data that are incomplete and potentially biased, so the re-
sults should be treated as suggestive, not conclusive.
CONCLUSION
This article has four main findings. First, the oil-impedes-democr ac yclaim is both valid and statistically robust; in other words, oil does hurtdemocracy. Moreover, oil does greater damage to democracy in poorstates than in rich ones, and a given rise in oil exports will do more harmin oil-poor states than in oil-rich ones. Hence, oil inhibits democracy
even when exports are relatively small, particularly in poor states. Second, the harmful influence of oil is not restricted to the Middle
East. Oil wealth has probably made democratization harder in states like Indonesia, Malaysia, Mexico, and Nigeria; it may well have thesame affect on the oil-rich states of Central Asia.
The third finding is that nonfuel mineral wealth also impedes de-mocratization. While the major oil exporters are concentrated in theMideast, major mineral exporters are scattered across Africa, Asia, and
the Americas; this group includes many states where progress towarddemocracy has been halting or elusive, including Angola, Chile, theDemocratic Republic of Congo, Cambodia, and Peru.
Each of these findings runs counter to the assumptions of earlierscholars that the antidemocratic effects of oil-----if they existed-----wererestricted to the Middle East, that they influenced only states that werealmost wholly dependent on oil, and that they did not extend to themineral-rich states.
The fourth finding is that there is at least tentative support for three
causal mechanisms that link oil and authoritarianism: a rentier effect,through which governments use low tax rates and high spending todampen pressures for democracy; a repression effect, by which govern-ments build up their internal security forces to ward off democratic

8/10/2019 Ross - Does Oil Hinder Democracy
http://slidepdf.com/reader/full/ross-does-oil-hinder-democracy 33/37
D O E S OI L H IND ER D EM O CR ACY ? 357
pressures; and a modernization effect, in which the failure of the popu lation to move into industrial and service sector jobs renders them les likely to push for democracy. The links between mineral wealth and au-
thoritarianism are more elusive: the mineral exporters appear to sufferfrom a rentier effect but not a repression effect, and there is only weakevidence that they are afflicted by a modernization effect.
Collectively, these findings should help vindicate two very differenttheories of comparative politics: modernization theor y, which afterfalling out of favor in the 1970s and 1980s made a strong comeback inthe 1990s; and the theor y of the rentier state, which has long beenchampioned by Middle East area specialists but overlooked by scholars
of democratization. They also highlight the value of bringing cross-national quantitativestudies into closer contact with area studies. Global studies of democ-racy have generally overlooked the Mideast, a practice that is difficultto justify methodologically (since it arbitrarily truncates the researcher’ssample of states) and one that has contributed to a belief that the Mid-dle East region is sui generis. Of course, the history and culture of theMideast are exceptional: note the enormous coefficient on the Mideastdummy variable in Table 4. But excluding Middle Eastern states from
large-N studies of democracy can only widen the gap between areastudies and the rest of political science. It also deprives mainstream po- litical science of the many insights developed by area studies scholars-----insights that, like the oil-impedes-democracy claim, may turn out tohave general applications.
Finally, these findings have implications for the fate of resource-richstates across the developing world. Many of the world’s most troubledstates have high levels of oil and mineral wealth. Earlier studies have
shown that resource wealth tends to reduce economic growth and to in-crease the likelihood of civil war. This article suggests there is a thirdcomponent to ‘‘resource curse’’: authoritarian rule.
These three effects may interact in pernicious ways, creating a ‘‘re-source trap.’’ Authoritarian governments may be less able to resolve do-mestic conflicts and hence more likely to suffer from civil war. Slowgrowth may make domestic unrest tougher to resolve; civil wars, inturn, wreak economic havoc. There is nothing inevitable about the re-source curse: states like Malaysia, Chile, and Botswana have done rela-
tively well despite their oil and mineral wealth. Yet most others havefound-----like King Midas-----that their resource wealth can be an unex-pected source of grief.

8/10/2019 Ross - Does Oil Hinder Democracy
http://slidepdf.com/reader/full/ross-does-oil-hinder-democracy 34/37
358 WORLD POLI T ICS
A PPENDIX 1: DEFINITION OF V ARIABLES 71
Regime is a 0---10 variable indicating a country’s regime type, with 0 as a
perfect autocracy and 10 a full democracy. It is taken from the Polity 98data set compiled by Gurr and Jaggers, who assign a 0---10 indicator for both level of autocracy and level of democracy.72 Each is a composite ofunderlying variables that measure the way chief executives are re-cruited, whether they gain office through competitive elections,
whether nonelites may obtain executive office, and whether they areconstrained by, and accountable to, other actors. Following Londreganand Poole, I transform these two measures into a single indicator bysubtracting the autocracy measure from the democracy measure and byrescaling the resulting ---10 to 10 scale as a 0 to 10 scale.73 For the sixstates with populations greater than one million for which Gurr and Jaggers offer no indicators (Austria, Cameroon, Democratic Republicof Congo, Libya, Sierra Leone, and Switzerland), I use data from Free-dom House (1972---98) instead, summing their measures for ‘‘politicalrights’’ and ‘‘civil liberties’’ and converting the results to the 0---10 scale.
Log Income is the natural log of real per capita GDP, in current inter-national dollars. Most of the data come from Summers and Heston;
missing values have been imputed using data from the World Bank.74
Oil is the export value of mineral-based fuels as a percentage of GDP.Mineral-based fuels include petroleum, natural gas, and coal, as classi-fied under SITC revision 1, section 3. Following the practice of Sachsand Warner, I corrected the export figures for Singapore and Trinidadto reflect net exports, since both states are transshipment points for rawmaterials extracted in nearby states.75 The values for both states wereset at 0.01.
Minerals is the export value of nonfuel minerals as a percentage ofGDP; it includes all ores and metals classified under SITC revision 1, sec-tions 27, 28, and 68. Following the practice of Sachs and Warner, I cor-rected the export figures for Singapore and Trinidad to reflect netexports, since both states are transshipment points for raw materials ex-tracted in nearby states.76 The values for both states were set at 0.01.
71 Unless otherwise indicated, the data below were derived from World Bank, ‘‘World Development Indicators,’’ CD-ROM ( Washington, D.C.: World Bank, 1999).
72 Gurr and Jaggers (fn. 42) 73 Londregan and Poole (fn. 43).
74 Summers and Heston (fn. 61). 75 Sachs and Warner (fn. 3, 1999). 76 Ibid.
8/10/2019 Ross - Does Oil Hinder Democracy
http://slidepdf.com/reader/full/ross-does-oil-hinder-democracy 35/37
D O E S OI L H IND ER D EM O CR ACY ? 359
Islam is the percentage of the population whose professed religiousaffiliation in 1970 was Muslim.77
OECD is a dummy variable coded 1 for the following states and 0 for
all others: Australia, Austria, Belgium, Canada, Denmark, Finland,France, Germany, Greece, Iceland, Ireland, Italy, Japan, Luxembourg,Netherlands, New Zealand, Nor way, Portugal, Spain, Sweden,Switzerland, United Kingdom, United States.
Agriculture is the export value of all nonfood agricultural raw materi-als, as a percentage of GDP. This includes all commodities classified asfalling in SITC revision 1, section 2 (excluding divisions 22, 27, and 28).
Food is the export value of all edible agricultural commodities, as a
percentage of GDP. This includes all commodities classified as falling inSITC sections 0, 1, and 4, and division 22. Large States is a dummy variable coded 1 for states with populations
over one million at any point between 1971 and 1997, and 0 otherwise. Mideast is a dummy variable coded 1 for the following states and 0
otherwise: Algeria, Bahrain, Egypt, Iran, Iraq, Israel, Jordan, Kuwait,Lebanon, Libya, Morocco, Oman, Qatar, Saudi Arabia, Syria, Tunisia,United Arab Emirates, and Yemen.
SSAfrica is a dummy variable coded 1 for states classified by the World Bank as residing in sub-Saharan Africa and 0 otherwise.
Arabian Peninsula is a dummy variable coded 1 for the states on the Saudi Arabian peninsula (Bahrain, Kuwait, Oman, Saudi Arabia, Qatar, the United Arab Emirates, and Yemen) and 0 otherwise.
Men in Industry and Women in Industry indicate the fraction of the total working population of each gender group working in activities de- fined by the ILO as ‘‘industry.’’ This includes mining and quarrying (in- cluding oil production), manufacturing, electricity, gas and water, and
construction, corresponding to major divisions 2---5 (ISIC revision 2) or tabulation categories C---F (ISIC revision 3). The data are compiled by the World Bank’s Development Data Group using an ILO database cor- responding to table 2a in its Yearbook of Labour Statistics.
Men in Services and Women in Services indicate the fraction of the total working population of each gender group working in activities de- fined by the ILO as ‘‘services.’’ Services include wholesale and retail trade and restaurants and hotels; transport, storage, and communications; fi- nancing, insurance, real estate, and business services; and community, social, and personal services, corresponding to major divisions 6---9 (ISIC
77 David B Barrett, ed., World Christian Encyclopedia (New York: Oxford University Press, 1982).

8/10/2019 Ross - Does Oil Hinder Democracy
http://slidepdf.com/reader/full/ross-does-oil-hinder-democracy 36/37
360 WORLD POLI T ICS
revision 2) or tabulation categories G---P (ISIC revision 3). The data arecompiled by the World Bank’s Development Data Group using an ILO
database corresponding to table 2a in its Yearbook of Labour Statistics.
Male Secondary Enrollment and Female Secondary Enrollment indicatethe fraction of males and females enrolled in secondary school, relativeto their numbers in the population. The data are reported to the UnitedNations Educational, Scientific, and Cultural Organization (UNESCO)
by national education authorities. College Enrollment indicates the fraction of the population enrolled in
college. The data are reported to UNESCO by national education authori-ties.
Life Expectancy indicates the life expectancy at birth of both males andfemales. The underlying figures are from the United Nations Depart-ment of Economic and Social Affairs, Population and Vital Statistics Re-port; demographic and health surveys from national sources; and UnitedNations Children’s Fund (UNICEF ), The State of the W orld ’s Children, 1999.
Urban is the midyear population of areas defined as urban in eachcountry and reported to the United Nations, expressed as a fraction ofthe total population. The data are from from the United Nations, WorldUrbanization Prospects: The 1996 Revision.
Telephones is the number of telephone mainlines (that is, separate lines to a given household or firm) per thousand people. The data arederived from the International Telecommunication Union (ITU), WorldTelecommunication Development Report .
TVs is the number of televisions per thousand people, according toan annual questionnaire sent to member countries by the ITU. The dataare derived from the ITU, World Telecommunication Development Report.
Taxes is the percentage of government revenue raised through taxes
on goods, services, income, profits, and capital gains. The data are col- lected by the IMF . Government Consumption, expressed as a percentage of GDP, includes
‘‘all current expenditures for purchases of goods and services by all lev-els of government, excluding most government enterprises. It also in-cludes capital expenditure on national defense and security.’’ The dataare collected from the OECD and from national statistical organizationsand central banks by visiting and resident World Bank missions; theyare published by the World Bank.
Government/ GDP is the share of GDP accounted for by governmentactivity, in 1985 international prices. The data are from the Penn World
Tables. Military/ GNP measures the size of the military budget as a fraction of

8/10/2019 Ross - Does Oil Hinder Democracy
http://slidepdf.com/reader/full/ross-does-oil-hinder-democracy 37/37
D O E S OI L H IND ER D EM O CR ACY ? 361
GNP. The data cover 1985---95; they were originally collected by the Arms Control and Disarmament Agency ( ACDA ) of the U.S. government.
Military Personnel measures the size of the military as a percentage of the labor force; it includes some paramilitary forces ‘‘if those forces resemble regular units in their organization, equipment, training, or mission.’’ The data are also from ACDA and cover 1985---95.
Ethnic Tensions is a 0---6 interval-level variable that measures ‘‘the de- gree of tension within a country attributable to racial, nationality, or language divisions.’’ The data cover 97 states between 1982 and 1997; the codings are carried out by a private firm, the Political Risk Services Group, and published in their monthly International Country Risk
Guide; they are also available as the IRIS-3 computer database. The monthly data have been changed into annual data by taking the mean of the twelve monthly values.
A PPENDIX 2: SUMMAR Y
OF V AR IABLES
Variable Obs. Mean Std. Dev. Min Max
Regime 3752 4.48 3.79 0 10 Log Income 3316 7.45 1.2 4.53 10.43 Oil 2322 5.5 14.1 0 115.6 Minerals 2865 2.25 5.8 0 55.1 OECD 4528 .163 .369 0 1 Islam 4336 25 36.6 0 99.7 Food 2511 5.73 6.23 0 45.9
Agriculture 2504 1.68 2.88 0 31.6 Men in Industry 814 29.4 12.7 .4 66.9
Women in Industry 798 15.5 8.99 0 50.2
Men in Services 810 39 14.3 5 69.3 Women in Services 813 52 25.6 9 100 Male Secondary 607 57.7 27.9 3 98.6 Female Secondary 607 58 29.9 1.3 98.5 College 1272 16.9 16.9 .1 97.7 Urban 4372 46.1 25 2.24 100 Life Expectancy 1527 62.5 11.7 31.2 79.8
Telephones 3129 106 154 .1 691 TVs 3040 151 169 0 838 Taxes 2325 50.9 18.7 0 101
Govt. Consumption 3538 15.2 6.51 .897 76.2 Government/GDP 2277 23.8 11.9 0 91.2 Military/GNP 1298 4.36 6.64 0 102 Military Personnel 1440 1.84 2.6 0 29.6 Ethnic Tensions 1739 3 791 1 633 0 6


