
Institutional EYE IiAS Comment | 18 February 2016
1 iias.in February 2016
Subscribe to IiAS Research Related Research Royalty flows in Suzuki’s
blood
Paying the price Multinationals Royalty Payments and Minority Shareholders
Royalty runs in MNCs bloodstream
Royalty payments and Minority Shareholders
Write to us [email protected]
Focus
First Reaction
Governance Spotlight
Regulatory Overview
Thematic Research Event Based Research
General
Royalty continues to outpace profits; shareholders must demand a greater say IiAS’ study of the 32 MNCs in the BSE500 shows that in FY15 they paid royalty aggregating Rs. 63 bn or ~21% of their pre-royalty pre-tax profits, to their global parent. While royalty is a legitimate payout, IiAS believes these must be linked to performance: yet, royalty and related payments for these companies increased at twice the rate of the growth in their pre-royalty pre-tax profits over the past five years. IiAS believes that regulations must compel all royalty, like other related party payments be approved by shareholders, pushing companies to explain their basis of charging royalty.
Royalty has been a contentious issue for MNCs set up in India. In FY15, 32 MNCs1 paid out an aggregate Rs. 63 bn, which was almost 21% of their pre-royalty pre-tax profits – a growth of 10% over FY14 levels. MNCs based in India pay royalty because they use brands/technology know-how that have been developed outside India by their global parents and are a result of extensive product research and knowledge. Therefore, royalty is a legitimate payout – but, how much is the right amount? Chart 1: Growth in royalty payments has outpaced sales and profits growth for the 32 MNCs
Our study of the 32 MNCs in the BSE 500 shows that over the past five years, aggregate royalty and related payments for these MNCs increased at a five-year CAGR of ~20% compared to a mere ~7% growth in their pre-royalty pre-tax profits. The steady increase in royalty payouts can be largely attributed to a change in regulations in December 2009 (Refer Annexure A), which liberalized the payment of foreign technology collaborations and royalty fees under the automatic route (including lump sum payments for transfer of technology, payments for the use of trademark and brand name). Maruti, HUL, ABB2, Nestlé2 and Bosch2 have paid out the maximum amount as royalty in the past three years: aggregate royalty payouts of these five companies was Rs. 47.8 bn or ~24% of aggregated pre-royalty pre-tax profits (up from Rs. 43.6 bn in the previous corresponding year). In fact, Maruti’s and ABB’s royalty payouts aggregated over 30% of their pre-royalty pre-tax profits in FY15.
1 See methodology on page 39 for the selection process of these 32 MNCs 2 December year end – refers to data for financial year ended 31 December 2014
FY11 FY12 FY13 FY14 FY15
Sales PBT+Royalty Royalty

Institutional EYE IiAS Comment | 18 February 2016
2 iias.in February 2016
IiAS Royalty Signal 1 B A S F India Ltd.
2 Schneider Electric Infrastructure Ltd.
3 3M India Ltd.
4 Alstom T & D India Ltd.
5 Heidelberg Cement India Ltd.
6 Hitachi Home & Life Solutions (India) Ltd.
7 S K F India Ltd.
8 United Spirits Ltd.
9 A B B India Ltd.
10 Whirlpool of India Ltd.
11 A C C Ltd.
12 Akzo Nobel India Ltd.
13 Alstom India Ltd.
14 Ingersoll-Rand (India) Ltd.
15 Maruti Suzuki India Ltd.
16 Ambuja Cements Ltd.
17 Bosch Ltd.
18 Colgate-Palmolive (India) Ltd.
19 F A G Bearings India Ltd.
20 Gillette India Ltd.
21 Grindwell Norton Ltd.
22 Hindustan Unilever Ltd.
23 Nestlé India Ltd.
24 Cummins India Ltd.
25 Wabco India Ltd.
26 Bata India Ltd.
27 Novartis India Ltd.
28 Castrol India Ltd.
29 Kansai Nerolac Paints Ltd.
30 Timken India Ltd.
31 Glaxosmithkline Consumer Healthcare Ltd.
32 Procter & Gamble Hygiene & Health Care Ltd.
Performance alone should be the benchmark for royalty payments Royalty payments could have been justified had the 32 MNCs in our research outperformed BSE 200 companies with respect to sales growth or earned higher margins. However, this is not the case. The BSE 200 companies have reported better growth and margins (please refer Table 1 and Table 2) than these 32 MNCs in FY15. This begs the question, what are companies paying for if their local competitors are growing faster and earning better margins?
Table 1: BSE 200 vs. 32 MNCs
5 year CAGR (2011-2015) Revenue growth PBT growth
BSE 200 13.5% 8.4%
32 MNC's 12.1% 5.6%
Table 2: BSE 200 vs. 32 MNCs (margins comparison)
PBT Margins (median) 2011 2015
BSE 200 15.3% 12.7%
32 MNC's 13.9% 11.5%
IiAS believes good governance practices require royalty payouts to be considered, and perhaps tempered in case of weak performance. Novartis is the only of the 32 MNCs that reduced royalty by 21%, after its FY15 profits were lower by 20% over the previous year. What will Nestlé Limited (Nestlé India) do? Nestlé terms of royalty include a steady step-up of royalty percentages by 0.2% of sales annually beginning 1 January 2014. The Maggi noodle controversy led to a negative impact of ~Rs.5.0 bn on Nestlé India’s profitability in CY15. Shareholders will know only after the company publishes its 2015 annual report. Royalty Signal To assess the appropriateness of royalty payouts, IiAS has developed the “IiAS Royalty Signal”. The model assesses the appropriateness of royalty payout levels and includes measuring royalty payouts in context of revenues, margins and dividend. Based on the overall score, companies are categorised into three buckets: green, amber and red (please refer to Annexure B for scoring; Annexure C for methodology). Based on the analysis, IiAS finds some similarities in companies categorized within a bucket:
1. Red: These companies have (i) performed weaker than peers in the BSE 200, (ii) have royalty payouts higher than dividends and (iii) royalty has grown faster than revenues and profits.
2. Amber: For most of these companies, (i) dividend payouts have been higher than royalty payouts over the past five years and (ii) royalty continues to outpace the increase in sales and/or profits.
3. Green: All the companies in this category have (i) paid dividends higher than royalty over the past five years, (ii) royalty increasing at a slower pace than sales and profits and (iii) performed better than peers in BSE 200.
We first looked at royalty payments in December 2012 and introduced the royalty signal in 2013 (based on FY13 financial statements). Our updated analysis (based on FY15 financials), shows:
Institutional EYE IiAS Comment | 18 February 2016
3 iias.in February 2016
a. Disproportionate increase in royalty (5 year CAGR) compared to revenues/profits/dividends has led Akzo Nobel, Alstom India and SKF India moving to red bucket (amber last year) and Cummins India to amber (green last year).
b. FAG Bearings and Bosch have improved on their position to amber (red last year) owing higher growth in sales viz-a-viz royalty.
c. Timken India has moved to green (amber last year) as performance outpaced the growth in royalties in FY15.
Detailed company profiles are given in Annexure D. Poor disclosure levels continue to keep a veil on royalty and related payments Companies do not explain the basis of charging royalty. If the terms of royalty are changed, the revised royalty percentages are announced. But how are these arrived at since the actual benefits of future R&D on company’s products cannot be quantified at the time of the agreement? How did the companies establish that these are being paid at arm’s length? Maruti, for example, has flip flopped on royalty payouts a number of times in the past few years in order to accommodate Suzuki’s demands. For instance, they increased royalty payouts to account for the Rupee-Yen exchange rate fluctuations: but why did Maruti’s board cave into absorbing all the exchange losses? Usually royalty expenses are disclosed in the annual report, and not necessarily when the amount is increased. Therefore, shareholders become aware of the actual quantum of payout only after the expense has been incurred. For example, to know if Nestlé India has paid royalty at a higher rate3, shareholders will have to wait till the company publishes its 2015 annual report. Although royalty to the global parent is a related party transaction, under current regulations, such transactions do not need shareholder approval. In order to push companies to explain the basis of their charging royalty and be more considered in their royalty payouts, IiAS believes these payments must be brought under the ambit of shareholder approval. Until then, investors must engage with MNCs in India and actively push them to rationalize royalty payouts. Box 1: Royalty payments do not usually require shareholder approval
d.
3 Nestlé’s terms of royalty include a steady step-up of royalty percentages by 0.2% of sales annually beginning 1 January 2014
Investors must engage with companies to understand the terms and conditions based on which royalty is being paid. Royalty payments, although these are with related parties, are not presented to shareholder for a vote because:
Companies classify these as transactions in the ordinary course of business, and claim that these are being paid at arm’s length pricing: under Companies Act 2013, such transactions do not need shareholder approval.
Since the transaction value is rarely over 10% of revenues or networth, shareholder approval under SEBI’s Listing Obligations and Disclosure Requirements (LODR) Regulations, 2015 is also not required.

Institutional EYE IiAS Comment | 18 February 2016
4 iias.in February 2016
Exhibit 1*: 5 Year CAGR (Royalty vs. Royalty + PBT)
*excludes United Spirits Ltd (5 year CAGR Royalty: 58%; PBT + Royalty: -228%
Maruti
HUL
ABB
Nestlé Bosch
Colgate
GSK Consumer Healthcare
ACC
P&G
Ambuja
3M
Castrol
Alstom T&D
SKF
Cummins
Akzo Nobel
Alstom India
Schneider Electric
Whirlpool
Hitachi
BASF
FAG Bata
Timken
Heidelberg
Wabco
Nerolac
Gillette
Grindwell Norton
Ingersoll Rand
Novartis
-10.0%
10.0%
30.0%
50.0%
70.0%
90.0%
110.0%
-30.0% -20.0% -10.0% 0.0% 10.0% 20.0% 30.0%
Ro
yalt
y
PBT+Royalty

Institutional EYE IiAS Comment | 18 February 2016
5 iias.in February 2016
Annexure A: Regulations In the December of 2009, the government of India, through press note 8, liberalized the payment of foreign
technology collaborations and royalty fees under the automatic route (including lump sum payments for transfer
of technology, payments for the use of trademark and brand name).
The liberalization of the Foreign Technology Agreement Policy was aimed at facilitating inflow of foreign direct
investment and technology transfers into the country. Foreign partners would now no longer have to go through
administrative hoops. Importantly this meant that ‘foreign sponsors’ who earlier required government approval
for charging royalty under the various heads were now free to charge any amount as royalty to their Indian
subsidiaries (refer table 3 below).
Table 3: Restrictions pre and post liberalising royalty payments:
Type of payment
Condition Pre-Press Note 8 (2009 series)
Post-Press Note 8 (2009 series)
Lump sum payments
Under technical collaboration
< US$ 2 million No limit
Royalty payable
Under technical collaboration
8 % on export and 5% on domestic sales
No restrictions - subject to FEMA (Current Account Transactions) Rules, 2000
Royalty payable
For use of trademark and brand name of the foreign collaborator
2% of exports and 1% of domestic sales
No restrictions - subject to FEMA (Current Account Transactions) Rules, 2000
The unintended consequences of waiving restrictions on royalty payments is reflected in the steady increase in
technical know-how, royalty, consultancy fees etc. by foreign partners since 2009, without a commensurate
increase in either sales or margins.

Institutional EYE IiAS Comment | 18 February 2016
6 iias.in February 2016
Annexure B: IiAS Royalty Signal: Snapshot of financial data
Name of the company Score
Peer comparison - No. of years’ company outperformed Benchmark (y-o-y)
Is ‘increase in royalty’ more than growth (5 Year CAGR)
No. of years’ royalty paid was higher
than dividend Growth in revenue
Growth in profits
before tax
PBT margins
Dividend payout
ROCE Total
Income Profits
before tax Dividend
B A S F India Ltd. 0 2 1 0 1 1 Yes Yes Yes 4
Schneider Electric Infrastructure Ltd. 0 0 1 0 1 1 Yes Yes Yes 4
3M India Ltd. 10 0 1 0 0 3 Yes Yes Yes 5
Alstom T & D India Ltd. 10 1 1 0 5 0 Yes Yes Yes 5
Heidelberg Cement India Ltd. 10 2 0 0 0 0 No Yes Yes 5
Hitachi Home & Life Solutions (India) Ltd. 20 3 2 0 3 2 Yes Yes Yes 5
S K F India Ltd. 20 1 2 1 3 5 Yes Yes Yes 3
United Spirits Ltd. 20 1 0 0 0 0 Yes Yes Yes 2
A B B India Ltd. 30 0 3 0 5 0 Yes Yes No 5
Whirlpool of India Ltd. 30 2 1 0 0 5 No No Yes 5
A C C Ltd. 40 1 0 1 5 5 Yes Yes Yes 0
Akzo Nobel India Ltd. 40 2 1 0 5 5 Yes Yes Yes 0
Alstom India Ltd. 40 2 1 2 5 5 Yes Yes Yes 0
Ingersoll-Rand (India) Ltd. 40 2 1 3 5 2 Yes Yes Yes 0
Maruti Suzuki India Ltd. 40 3 3 0 0 5 Yes Yes No 5
Ambuja Cements Ltd. 50 0 1 3 5 5 Yes Yes Yes 0
Bosch Ltd. 50 2 3 2 1 5 No No No 5
Colgate-Palmolive (India) Ltd. 50 2 0 4 5 5 Yes Yes Yes 0
F A G Bearings India Ltd. 50 3 3 2 0 5 No No Yes 5
Gillette India Ltd. 50 4 2 1 5 4 Yes Yes Yes 0
Grindwell Norton Ltd. 50 1 1 2 5 5 No Yes Yes 0
Hindustan Unilever Ltd. 50 2 2 3 5 5 Yes Yes Yes 0
Nestlé India Ltd. 50 1 1 3 5 5 Yes Yes Yes 0
Cummins India Ltd. 60 2 3 3 5 5 Yes Yes Yes 0
Wabco India Ltd. 60 3 1 3 0 5 No No No 3
Bata India Ltd. 70 3 4 2 1 5 No No Yes 0
Novartis India Ltd. 70 0 1 5 4 4 No Yes No 0
Castrol India Ltd. 80 0 2 4 5 5 No No No 0
Kansai Nerolac Paints Ltd. 80 3 2 0 4 5 No No No 0
Timken India Ltd. 80 3 3 1 4 5 No No Yes 1
Glaxosmithkline Consumer Healthcare Ltd. 90 2 3 3 5 5 No No No 0
Procter & Gamble Hygiene & Health Care Ltd. 90 4 4 3 5 5 No No Yes 0 Source: CMIE, IiAS Research, Company Data

Institutional EYE IiAS Comment | 18 February 2016
7 iias.in February 2016
Annexure C: Methodology
In preparing this report IiAS has relied on data provided by CMIE. FY15 Standalone company data has been used for our analysis. For the purpose of analysis, companies with year ending Dec’14, June’15, and Mar’15 have been represented as FY15 Numbers
Figures are annualized wherever necessary to establish comparability.
Identification of MNCs Filtering Royalty Signal
Companies forming part of BSE 500 were evaluated for foreign parent holding.
For the purpose of this analysis, IiAS defines MNCs as those companies having a foreign parent holding more than 25% of its equity.
Some companies (like Motherson Sumi) who have foreign promoter holding more than 25% but the Indian parent exercises significant control over the company have been excluded.
Any government related organisation/Financial institutions have not been considered for the same.
Companies (like Page
Industries) that pay royalty on
account of franchisee
agreements have also not been
considered.
Companies with a royalty
payment of less than Rs. 60 mn
have been excluded.
Companies that have just begun
to pay royalty have been
excluded because these do not
have sufficient track record of
performance after paying out
royalty. Therefore, only those
companies that have paid
royalty in atleast three of the
last five years have been
considered
All metrics under ‘Peer Comparison’ are assigned a weightage of 10 points. This includes (a) Growth in revenue (b) Growth in profits and (c) ROCE, (d) Dividend Payout and (e) Net Margins. If the company outperformed the benchmark index in three years or more in any of the above metrics, it is assigned 10 points for that metric.
Each parameter under ‘increase in royalty’ is assigned a weightage of 10 points. If the company’s 5 year CAGR in total income, PBT and dividends was higher than the increase in royalty, it is assigned 10 points.
If the company’s dividend was higher than royalty payments in three years or more, it is assigned 20 points. Based on the above, companies scoring 80 points and above are green, 40-70 points amber and 40 and below, red.
<40 50-80
>80

Institutional EYE IiAS Comment | 18 February 2016
8 iias.in February 2016
Annexure D: Company Profiles
Note:
For the Company profiles the median used as a benchmark is the median data of the 32 MNCs covered in our
analysis.

Institutional EYE IiAS Comment | 18 February 2016
9 iias.in February 2016
3M India Limited IiAS Royalty Signal
Industry: Diversified Promoter: 3M Company
FY15 Royalty details Financials (Rs. bn)
Key Highlights:
Chart 1: Royalty compared to Median
Chart 2: Royalty vs Net Sales and PBT (Normalised)
Chart 3: Royalty vs Dividend (Rs. bn)
IiAS Royalty Signal
Name of the company
Score
Peer comparison - No. of years’ company outperformed Benchmark (y-o-y)
Is ‘increase in royalty’ more than growth (5 Year CAGR)
No. of years’
royalty paid was
higher than
dividend
Growth in
revenue
Growth in PBT
PBT margins
Dividend payout
ROCE Total
Income PBT Dividend
3M India Ltd. 10 0 1 0 0 3 Yes Yes Yes 5
0.79
0.56
3M Median
Royalty Payout (Rs. bn)
32.40
12.93
3M Median
Royalty as % of (PBT + Royalty)
4.30
2.01
3M Median
Royalty as % of Net Sales
FY11 FY12 FY13 FY14 FY15
Net Sales PBT Royalty
0.43
0.57 0.64
0.72 0.79
FY11 FY12 FY13 FY14 FY15
Royalty related fees Dividend Paid
Nature of transaction Amount (Rs.bn) Support services/ Corporate management fee
0.59
Royalty fee 0.20 Total 0.79
FY13 FY14 FY15 Net Sales 15.74 17.42 18.40 PBT 0.75 0.69 1.64
RED
Note: The company incurred high depreciation and finance costs as the company
invested in research and production facilities. High costs along with weak
macroeconomic environment in the country led to a decrease in bottom line in the
past three years.

Institutional EYE IiAS Comment | 18 February 2016
10 iias.in February 2016
ABB India Ltd IiAS Royalty Signal
Industry: Heavy Electrical Equipment Promoter: ABB Limited
CY14 Royalty details Financials (Rs. bn)
Key Highlights:
Chart 1: Royalty compared to Median
Chart 2: Royalty vs Net Sales and PBT (Normalised)
Chart 3: Royalty vs Dividend (Rs. bn)
IiAS Royalty Signal
Name of the company
Score
Peer comparison - No. of years’ company outperformed Benchmark (y-o-y)
Is ‘increase in royalty’ more than growth (5 Year CAGR)
No. of years’
royalty paid was
higher than
dividend
Growth in
revenue
Growth in PBT
PBT margins
Dividend payout
ROCE Total
Income PBT Dividend
A B B India Ltd. 30 0 3 0 5 0 Yes Yes No 5
4.97
0.56
ABB India Limited Median
Royalty Payout (Rs. bn)
58.3
12.93
ABB India Limited Median
Royalty as % of (PBT + Royalty)
6.43
2.01
ABB India Limited Median
Royalty as % of Net Sales
CY10 CY11 CY12 CY13 CY14
Net Sales PBT Royalty
3.10
3.76
4.43 4.67 4.97
0.49 0.74 0.74 0.74 0.94
CY10 CY11 CY12 CY13 CY14
Royalty related fees Dividend Paid
Nature of transaction Amount (Rs.bn) Royalty, technology and trademark fees
2.66
Expenditure on information technology, management and other services
2.16
Amortised technological know-how fees
0.15
Total 4.97
CY12 CY13 CY14 Net Sales 75.65 77.22 77.33 PBT 2.06 2.72 3.55
RED

Institutional EYE IiAS Comment | 18 February 2016
11 iias.in February 2016
ACC Limited IiAS Royalty Signal
Industry: Cement & Cement Products Promoter: Holcim Limited
CY14 Royalty details Financials (Rs. bn)
Key Highlights:
Chart 1: Royalty compared to Median
Chart 2: Royalty vs Net Sales and PBT (Normalised)
Chart 3: Royalty vs Dividend (Rs. bn)
IiAS Royalty Signal
Name of the company
Score
Peer comparison - No. of years’ company outperformed Benchmark (y-o-y)
Is ‘increase in royalty’ more than growth (5 Year CAGR)
No. of years’
royalty paid was
higher than
dividend
Growth in
revenue
Growth in PBT
PBT margins
Dividend payout
ROCE Total
Income PBT Dividend
A C C Ltd. 40 1 0 1 5 5 Yes Yes Yes 0
1.13
0.56
ACC Limited Median
Royalty Payout (Rs. bn)
9.05
12.93
ACC Limited Median
Royalty as % of (PBT + Royalty)
0.96
2.01
ACC Limited Median
Royalty as % of Net Sales
CY10 CY11 CY12 CY13 CY14
Net Sales PBT Royalty
0.48 0.71 1.00 1.08 1.13
6.686.11
6.55 6.62
7.58
CY10 CY11 CY12 CY13 CY14
Royalty related fees Dividend Paid
Nature of transaction Amount (Rs.bn) Technology and Know-how fees
1.13
Total 1.13
CY12 CY13 CY14 Net Sales 113.58 111.69 117.38 PBT 14.51 12.27 11.35
RED
Institutional EYE IiAS Comment | 18 February 2016
12 iias.in February 2016
Akzo Nobel Limited IiAS Royalty Signal
Industry: Furniture, Furnishings, Paints Promoter: Akzo Nobel NV
FY15 Royalty details Financials (Rs. bn)
Key Highlights:
Chart 1: Royalty compared to Median
Chart 2: Royalty vs Net Sales and PBT (Normalised)
Chart 3: Royalty vs Dividend (Rs.bn)
IiAS Royalty Signal
Name of the company
Score
Peer comparison - No. of years’ company outperformed Benchmark (y-o-y)
Is ‘increase in royalty’ more than growth (5 Year CAGR)
No. of years’
royalty paid was
higher than
dividend
Growth in
revenue
Growth in PBT
PBT margins
Dividend payout
ROCE Total
Income PBT Dividend
Akzo Nobel India Ltd.
40 2 1 0 5 5 Yes Yes Yes 0
0.53
0.56
Akzo Nobel IndiaLimited
Median
Royalty Payout (Rs. bn)
16.26
12.93
Akzo Nobel IndiaLimited
Median
Royalty as % of (PBT + Royalty)
2.16
2.01
Akzo Nobel IndiaLimited
Median
Royalty as % of Net Sales
85.00
135.00
185.00
235.00
100.00
2,100.00
4,100.00
6,100.00
8,100.00
10,100.00
12,100.00
14,100.00
FY11 FY12 FY13 FY14 FY15
Royalty Net Sales PBT
0.00 0.24
0.52 0.47 0.530.77
1.12
4.374.09
1.12
FY11 FY12 FY13 FY14 FY15
Royalty related fees Dividend Paid
Nature of transaction Amount (Rs.bn) Royalty and technical services
0.53
Total 0.53
FY13 FY14 FY15 Net Sales 21.80 23.72 24.70 PBT 2.79 2.03 2.75
RED
Note: The company had paid dividend out of reserves in FY13 and FY14 as special dividend
owing to completion of 60 years since incorporation

Institutional EYE IiAS Comment | 18 February 2016
13 iias.in February 2016
Alstom India Limited IiAS Royalty Signal
Industry: Heavy Electrical Equipment Promoter: ALSTOM S.A.
FY15 Royalty details Financials (Rs. bn)
Key Highlights:
Chart 1: Royalty compared to Median
Chart 2: Royalty vs Net Sales and PBT (Normalised)
Chart 3: Royalty vs Dividend (Rs. bn)
IiAS Royalty Signal
Name of the company
Score
Peer comparison - No. of years’ company outperformed Benchmark (y-o-y)
Is ‘increase in royalty’ more than growth (5 Year CAGR)
No. of years’
royalty paid was
higher than
dividend
Growth in
revenue
Growth in PBT
PBT margins
Dividend payout
ROCE Total
Income PBT Dividend
Alstom India Ltd. 40 2 1 2 5 5 Yes Yes Yes 0
0.49
0.56
ALSTOM India Ltd Median
Royalty Payout (Rs. bn)
15.61
12.93
ALSTOM India Ltd Median
Royalty as % of (PBT + Royalty)
2.32
2.01
ALSTOM India Ltd Median
Royalty as % of Net Sales
FY11 FY12 FY13 FY14 FY15
Net Sales PBT Royalty
0.25
0.41 0.52
0.44 0.49
0.78 0.78 0.78
1.11
0.81
FY11 FY12 FY13 FY14 FY15
Royalty related fees Dividend Paid
Nature of transaction Amount (Rs.bn) Royalty, Technology Know-how Fees
0.49
Total 0.49
FY13 FY14 FY15 Net Sales 27.86 26.05 21.24 PBT 2.82 3.20 2.66
RED

Institutional EYE IiAS Comment | 18 February 2016
14 iias.in February 2016
Alstom T&D India Limited IiAS Royalty Signal
Industry: Electric Utilities Promoter: ALSTOM S.A.
FY15 Royalty details Financials (Rs. bn)
Key Highlights:
Chart 1: Royalty compared to Median
Chart 2: Royalty vs Net Sales and PBT (Normalised)
Chart 3: Royalty vs Dividend (Rs. bn)
* Figures have been annualised
IiAS Royalty Signal
Name of the company
Score
Peer comparison - No. of years’ company outperformed Benchmark (y-o-y)
Is ‘increase in royalty’ more than growth (5 Year CAGR)
No. of years’
royalty paid was
higher than
dividend
Growth in
revenue
Growth in PBT
PBT margins
Dividend payout
ROCE Total
Income PBT Dividend
Alstom T & D India Ltd.
10 1 1 0 5 0 Yes Yes Yes 5
0.70
0.56
Alstom T&D Median
Royalty Payout (Rs. bn)
29.20
12.93
Alstom T&D Median
Royalty as % of (PBT + Royalty)
1.89
2.01
Alstom T&D Median
Royalty as % of Net Sales
FY11 FY12* FY13 FY14 FY15
Net Sales PBT Royalty
0.60
0.45
0.60
0.74 0.70
0.50
0.40
0.50 0.54 0.55
FY11 FY12* FY13 FY14 FY15
Royalty related fees Dividend Paid
Nature of transaction Amount (Rs.bn) Technology Licence Fee and Others
0.39
Trade Mark Fees 0.31 Total 0.70
FY13 FY14 FY15 Net Sales 31.52 35.24 37.11 PBT 1.22 1.77 1.70
RED

Institutional EYE IiAS Comment | 18 February 2016
15 iias.in February 2016
Ambuja Cements Limited IiAS Royalty Signal
Industry: Cement and Cement Products Promoter: Holcim Limited
CY14 Royalty details Financials (Rs. bn)
Key Highlights:
Chart 1: Royalty compared to Median
Chart 2: Royalty vs Net Sales and PBT (Normalised)
Chart 3: Royalty vs Dividend (Rs. bn)
IiAS Royalty Signal
Name of the company
Score
Peer comparison - No. of years’ company outperformed Benchmark (y-o-y)
Is ‘increase in royalty’ more than growth (5 Year CAGR)
No. of years’
royalty paid was
higher than
dividend
Growth in
revenue
Growth in PBT
PBT margins
Dividend payout
ROCE Total
Income PBT Dividend
Ambuja Cements Ltd.
50 0 1 3 5 5 Yes Yes Yes 0
0.97
0.56
Ambuja CementsLimited
Median
Royalty Payout (Rs. bn)
5.16
12.93
Ambuja CementsLimited
Median
Royalty as % of (PBT + Royalty)
0.97
2.01
Ambuja CementsLimited
Median
Royalty as % of Net Sales
CY10 CY11 CY12 CY13 CY14
Net Sales PBT Royalty
0.48 0.59 0.65 0.90 0.97
4.63
5.706.45 6.47
9.21
CY10 CY11 CY12 CY13 CY14
Royalty related fees Dividend Paid
Nature of transaction Amount (Rs.bn) Technology & Know How fees
0.97
Total 0.97
CY12 CY13 CY14 Net Sales 97.30 91.60 99.80 PBT 19.02 15.14 17.83
AMBER

Institutional EYE IiAS Comment | 18 February 2016
16 iias.in February 2016
BASF India Limited IiAS Royalty Signal
Industry: Speciality Chemicals Promoter: BASF SE
FY15 Royalty details Financials (Rs. bn)
Key Highlights:
Chart 1: Royalty compared to Median
Chart 2: Royalty vs Net Sales and PBT (Normalised)
Chart 3: Royalty vs Dividend (Rs. bn)
IiAS Royalty Signal
Name of the company
Score
Peer comparison - No. of years’ company outperformed Benchmark (y-o-y)
Is ‘increase in royalty’ more than growth (5 Year CAGR)
No. of years’
royalty paid was
higher than
dividend
Growth in
revenue
Growth in PBT
PBT margins
Dividend payout
ROCE Total
Income PBT Dividend
B A S F India Ltd. 0 2 1 0 1 1 Yes Yes Yes 4
0.41
0.56
BASF Median
Royalty Payout (Rs. bn)
-160.80
12.93
BASF Median
Royalty as % of (PBT + Royalty)
0.91
2.01
BASF Median
Royalty as % of Net Sales
FY11 FY12 FY13 FY14 FY15
Net Sales PBT Royalty
0.24
0.30 0.33
0.35
0.41 0.40
0.20 0.20 0.20 0.21
FY11 FY12 FY13 FY14 FY15
Royalty related fees Dividend Paid
Nature of transaction Amount (Rs. bn) Royalty and technical Fees 0.41 Total 0.41
FY13 FY14 FY15 Net Sales 37.54 42.35 44.70 PBT 1.69 1.94 (0.66)
RED
Note: The commencement of operations at the company’s Dahej plant led to
higher depreciation, interest and start up related costs. This resulted in losses in
FY15.

Institutional EYE IiAS Comment | 18 February 2016
17 iias.in February 2016
Bata India Limited IiAS Royalty Signal
Industry: Footwear Promoter: Bata (BN) BV
FY15* Royalty details Financials (Rs. bn)
* Figures have been annualised
Key Highlights:
Chart 1: Royalty compared to Median
Chart 2: Royalty vs Net Sales and PBT (Normalised)
Chart 3: Royalty vs Dividend (Rs. bn)
* Figures have been annualised
IiAS Royalty Signal
Name of the company
Score
Peer comparison - No. of years’ company outperformed Benchmark (y-o-y)
Is ‘increase in royalty’ more than growth (5 Year CAGR)
No. of years’
royalty paid was
higher than
dividend
Growth in
revenue
Growth in PBT
PBT margins
Dividend payout
ROCE Total
Income PBT Dividend
Bata India Ltd. 70 3 4 2 1 5 No No Yes 0
0.22
0.56
Bata India Limited Median
Royalty Payout (Rs. bn)
7.79
12.93
Bata IndiaLimited
Median
Royalty as % of (PBT + Royalty)
1.03
2.01
Bata IndiaLimited
Median
Royalty as % of Net Sales
CY10 CY11 CY12 CY13 FY15*
Net Sales PBT Royalty
0.14 0.14 0.160.19
0.22
0.30
0.45 0.450.49
0.39
CY10 CY11 CY12 CY13 FY15*
Royalty related fees Dividend Paid
Nature of transaction Amount (Rs.bn) Technical Collaboration Fee (Global Footwear Services Pte Ltd)
0.21
Royalty (Bata Brands S.a.r.l., Bata Brands SA)
0.11
Total 0.22
CY12 CY13 FY15* Net Sales 18.42 20.65 21.55 PBT 2.53 2.83 2.63
AMBER

Institutional EYE IiAS Comment | 18 February 2016
18 iias.in February 2016
Bosch Limited IiAS Royalty Signal
Industry: Auto Parts & Equipment Promoter: Robert Bosch GmbH
FY15* Royalty details Financials (Rs. bn)
* Figures have been annualised
Key Highlights:
Chart 1: Royalty compared to Median
Chart 2: Royalty vs Net Sales and PBT (Normalised)
Chart 3: Royalty vs Dividend (Rs. bn)
* Figures have been annualised
IiAS Royalty Signal
Name of the company
Score
Peer comparison - No. of years’ company outperformed Benchmark (y-o-y)
Is ‘increase in royalty’ more than growth (5 Year CAGR)
No. of years’
royalty paid was
higher than
dividend
Growth in
revenue
Growth in PBT
PBT margins
Dividend payout
ROCE Total
Income PBT Dividend
Bosch Ltd. 50 2 3 2 1 5 No No No 5
3.63
0.56
Bosch Median
Royalty Payout (Rs. bn)
18.80
12.93
Bosch Median
Royalty as % of (PBT + Royalty)
3.87
2.01
Bosch Median
Royalty as % of Net Sales
CY10 CY11 CY12 CY13 FY15*
Net Sales PBT Royalty
2.67 3.14
3.51 4.10
3.63
1.46
4.93
2.19 2.04 2.57
CY10 CY11 CY12 CY13 FY15*
Royalty related fees Dividend Paid
Nature of transaction Amount (Rs.bn) Royalty and technical service fee
1.49
Professional, consultancy and other charges
2.14
Total 3.63
CY12 CY13 FY15* Net Sales 84.17 85.41 93.93 PBT 13.46 12.57 15.65
AMBER

Institutional EYE IiAS Comment | 18 February 2016
19 iias.in February 2016
Castrol India Limited IiAS Royalty Signal
Industry: Oil Marketing & Distribution Promoter: BP PLC
CY14 Royalty details Financials (Rs. bn)
Key Highlights:
Chart 1: Royalty compared to Median
Chart 2: Royalty vs Net Sales and PBT (Normalised)
Chart 3: Royalty vs Dividend (Rs. bn)
IiAS Royalty Signal
Name of the company
Score
Peer comparison - No. of years’ company outperformed Benchmark (y-o-y)
Is ‘increase in royalty’ more than growth (5 Year CAGR)
No. of years’
royalty paid was
higher than
dividend
Growth in
revenue
Growth in PBT
PBT margins
Dividend payout
ROCE Total
Income PBT Dividend
Castrol India Ltd. 80 0 2 4 5 5 No No No 0
0.73
0.56
Castrol IndiaLimited
Median
Royalty Payout (Rs. bn)
9.15
12.93
Castrol IndiaLimited
Median
Royalty as % of (PBT + Royalty)
2.16
2.01
Castrol IndiaLimited
Median
Royalty as % of Net Sales
CY10 CY11 CY12 CY13 CY14
Net Sales PBT Royalty
0.78 0.73 0.66 0.77 0.73
4.33 4.314.02 4.06
4.40
CY10 CY11 CY12 CY13 CY14
Royalty related fees Dividend Paid
Nature of transaction Amount (Rs.bn) Royalty 0.73 Total 0.73
CY12 CY13 CY14 Net Sales 31.21 31.80 33.92 PBT 6.66 7.62 7.26
GREEN

Institutional EYE IiAS Comment | 18 February 2016
20 iias.in February 2016
Colgate Palmolive (India) Limited IiAS Royalty Signal
Industry: Personal Products Promoter: Colgate-Palmolive Company
FY15 Royalty details Financials (Rs. bn)
Key Highlights:
Chart 1: Royalty compared to Median
Chart 2: Royalty vs Net Sales and PBT (Normalised)
Chart 3: Royalty vs Dividend (Rs. bn)
IiAS Royalty Signal
Name of the company
Score
Peer comparison - No. of years’ company outperformed Benchmark (y-o-y)
Is ‘increase in royalty’ more than growth (5 Year CAGR)
No. of years’
royalty paid was
higher than
dividend
Growth in
revenue
Growth in PBT
PBT margins
Dividend payout
ROCE Total
Income PBT Dividend
Colgate-Palmolive (India) Ltd.
50 2 0 4 5 5 Yes Yes Yes 0
1.88
0.56
Colgate Palmolive Median
Royalty Payout (Rs. bn)
19.40
12.93
Colgate Palmolive Median
Royalty as % of (PBT + Royalty) 4.72
2.01
Colgate Palmolive Median
Royalty as % of Net Sales
FY11 FY12 FY13 FY14 FY15
Net Sales PBT Royalty
0.97 1.21
1.44 1.66
1.88
3.49 3.95
4.43 4.30 3.88
FY11 FY12 FY13 FY14 FY15
Royalty related fees Dividend Paid
Nature of transaction Amount (Rs.bn) Royalty 1.88 Total 1.88
FY13 FY14 FY15 Net Sales 31.64 35.79 39.82 PBT 6.63 7.28 7.80
AMBER

Institutional EYE IiAS Comment | 18 February 2016
21 iias.in February 2016
Cummins India Limited IiAS Royalty Signal
Industry: Industrial Machinery Promoter: Cummins Inc
FY15 Royalty details Financials (Rs. bn)
Key Highlights:
Chart 1: Royalty compared to Median
Chart 2: Royalty vs Net Sales and PBT (Normalised)
Chart 3: Royalty vs Dividend (Rs. bn)
IiAS Royalty Signal
Name of the company
Score
Peer comparison - No. of years’ company outperformed Benchmark (y-o-y)
Is ‘increase in royalty’ more than growth (5 Year CAGR)
No. of years’
royalty paid was
higher than
dividend
Growth in
revenue
Growth in PBT
PBT margins
Dividend payout
ROCE Total
Income PBT Dividend
Cummins India Ltd.
60 2 3 3 5 5 Yes Yes Yes 0
0.63
0.56
Cummins IndiaLimited
Median
Royalty Payout (Rs. bn)
6.28
12.93
Cummins IndiaLimited
Median
Royalty as % of (PBT + Royalty)
1.43
2.01
Cummins IndiaLimited
Median
Royalty as % of Net Sales
FY11 FY12 FY13 FY14 FY15
Net Sales PBT Royalty
0.62 0.65 0.65 0.61 0.63
3.46 3.54
4.21 4.224.62
FY11 FY12 FY13 FY14 FY15
Royalty related fees Dividend Paid
Nature of transaction Amount (Rs.bn) Transfer of Technology, Royalty
0.63
Total 0.63
FY13 FY14 FY15 Net Sales 45.89 39.77 44.06 PBT 10.51 8.18 9.37
AMBER

Institutional EYE IiAS Comment | 18 February 2016
22 iias.in February 2016
FAG Bearings India Limited IiAS Royalty Signal
Industry: Industrial Machinery Promoter: FAG Kugelfischer GmbH
CY14 Royalty details Financials (Rs. bn)
Key Highlights:
Chart 1: Royalty compared to Median
Chart 2: Royalty vs Net Sales and PBT (Normalised)
Chart 3: Royalty vs Dividend (Rs.bn)
IiAS Royalty Signal
Name of the company
Score
Peer comparison - No. of years’ company outperformed Benchmark (y-o-y)
Is ‘increase in royalty’ more than growth (5 Year CAGR)
No. of years’
royalty paid was
higher than
dividend
Growth in
revenue
Growth in PBT
PBT margins
Dividend payout
ROCE Total
Income PBT Dividend
F A G Bearings India Ltd.
50 3 3 2 0 5 No No Yes 5
0.32
0.56
FAG Bearing Median
Royalty Payout (Rs. bn)
12.23
12.93
FAG Bearing Median
Royalty as % of (PBT + Royalty)
2.00
2.01
FAG Bearing Median
Royalty as % of Net Sales
CY10 CY11 CY12 CY13 CY14
Net Sales PBT Royalty
0.20
0.26 0.27 0.28
0.32
0.10
0.19
0.10 0.12
0.15
CY10 CY11 CY12 CY13 CY14
Royalty related fees Dividend Paid
Nature of transaction Amount (Rs.bn) Fees for use of technology/trademark and capitalised technical services
0.26
Charges for SAP/R3 and connectivity
0.07
Total 0.32
CY12 CY13 CY14 Net Sales 14.36 14.20 16.18 PBT 2.33 1.85 2.32
AMBER

Institutional EYE IiAS Comment | 18 February 2016
23 iias.in February 2016
Gillette Limited IiAS Royalty Signal
Industry: Personal Products Promoter: The Procter & Gamble Company
FY15 Royalty details Financials (Rs. bn)
Key Highlights:
Chart 1: Royalty compared to Median
Chart 2: Royalty vs Net Sales and PBT (Normalised)
Chart 3: Royalty vs Dividend (Rs.bn)
IiAS Royalty Signal
Name of the company
Score
Peer comparison - No. of years’ company outperformed Benchmark (y-o-y)
Is ‘increase in royalty’ more than growth (5 Year CAGR)
No. of years’
royalty paid was
higher than
dividend
Growth in
revenue
Growth in PBT
PBT margins
Dividend payout
ROCE Total
Income PBT Dividend
Gillette India Ltd. 50 4 2 1 5 4 Yes Yes Yes 0
0.10
0.56
Gillette IndiaLimited
Median
Royalty Payout (Rs. bn)
3.98
12.93
Gillette IndiaLimited
Median
Royalty as % of (PBT + Royalty)
0.54
2.01
Gillette IndiaLimited
Median
Royalty as % of Net Sales
FY11 FY12 FY13 FY14 FY15
Net Sales PBT Royalty
0.08 0.11 0.13 0.17
0.10
0.57 0.57 0.57 0.57 0.59
FY11 FY12 FY13 FY14 FY15
Royalty related fees Dividend Paid
Nature of transaction Amount (Rs.bn) Royalty 0.10 Total 0.10
FY13 FY14 FY15 Net Sales 14.38 17.46 18.72 PBT 1.38 0.81 2.46
AMBER

Institutional EYE IiAS Comment | 18 February 2016
24 iias.in February 2016
GlaxoSmithKline Consumer Healthcare Limited IiAS Royalty Signal
Industry: Packaged Foods Promoter: GlaxoSmithKline PLC
FY15 Royalty details Financials (Rs. bn)
Key Highlights:
Chart 1: Royalty compared to Median
Chart 2: Royalty vs Net Sales and PBT (Normalised)
Chart 3: Royalty vs Dividend (Rs. bn)
* Figures have been annualised
IiAS Royalty Signal
Name of the company
Score
Peer comparison - No. of years’ company outperformed Benchmark (y-o-y)
Is ‘increase in royalty’ more than growth (5 Year CAGR)
No. of years’
royalty paid was
higher than
dividend
Growth in
revenue
Growth in PBT
PBT margins
Dividend payout
ROCE Total
Income PBT Dividend
Glaxosmithkline Consumer
Healthcare Ltd. 90 2 3 3 5 5 No No No 0
1.44
0.56
GSK ConsumerHealthcare Limited
Median
Royalty Payout (Rs. bn)
13.9
12.93
GSK ConsumerHealthcare Limited
Median
Royalty as % of (PBT + Royalty) 3.33
2.01
GSK ConsumerHealthcare Limited
Median
Royalty as % of Net Sales
CY10 CY11 CY12 FY14* FY15
Net Sales PBT Royalty
0.84 0.96 1.09
1.30 1.44
2.45
1.71
2.20
1.77
2.78
CY10 CY11 CY12 FY14* FY15
Royalty related fees Dividend Paid
Nature of transaction Amount (Rs.bn) Royalty 1.44 Total 1.44
CY12 FY14* FY15 Net Sales 31.88 38.95 43.08 PBT 6.49 8.13 8.89
GREEN

Institutional EYE IiAS Comment | 18 February 2016
25 iias.in February 2016
Grindwell Norton Limited IiAS Royalty Signal
Industry: Other Industrial Products Promoter: Saint-Gobain
FY15 Royalty details Financials (Rs. bn)
Key Highlights:
Chart 1: Royalty compared to Median
Chart 2: Royalty vs Net Sales and PBT (Normalised)
Chart 3: Royalty vs Dividend (Rs. bn)
IiAS Royalty Signal
Name of the company
Score
Peer comparison - No. of years’ company outperformed Benchmark (y-o-y)
Is ‘increase in royalty’ more than growth (5 Year CAGR)
No. of years’
royalty paid was
higher than
dividend
Growth in
revenue
Growth in PBT
PBT margins
Dividend payout
ROCE Total
Income PBT Dividend
Grindwell Norton Ltd.
50 1 1 2 5 5 No Yes Yes 0
0.09
0.56
Grindwell NortonLimited
Median
Royalty Payout (Rs. bn)
5.90
12.93
Grindwell NortonLimited
Median
Royalty as % of (PBT + Royalty)
0.84
2.01
Grindwell NortonLimited
Median
Royalty as % of Net Sales
FY11 FY12 FY13 FY14 FY15
Net Sales PBT Royalty
0.06 0.08 0.07 0.07 0.09
0.390.42 0.42 0.42 0.43
FY11 FY12 FY13 FY14 FY15
Royalty related fees Dividend Paid
Nature of transaction Amount (Rs.bn) Royalty, Trademark Amortisation
0.09
Total 0.09
FY13 FY14 FY15 Net Sales 9.45 9.42 11.10 PBT 1.36 1.20 1.49
AMBER

Institutional EYE IiAS Comment | 18 February 2016
26 iias.in February 2016
Heidelberg Cement Limited IiAS Royalty Signal
Industry: Cement and Cement Products Promoter: Heidelberg Cement AG
FY15* Royalty details Financials (Rs. bn)
* Figures have been annualised
Key Highlights:
Chart 1: Royalty compared to Median
Chart 2: Royalty vs Net Sales and PBT (Normalised)
Chart 3: Royalty vs Dividend (Rs. bn)
* Figures have been annualised
IiAS Royalty Signal
Name of the company
Score
Peer comparison - No. of years’ company outperformed Benchmark (y-o-y)
Is ‘increase in royalty’ more than growth (5 Year CAGR)
No. of years’
royalty paid was
higher than
dividend
Growth in
revenue
Growth in PBT
PBT margins
Dividend payout
ROCE Total
Income PBT Dividend
Heidelberg Cement India Ltd.
10 2 0 0 0 0 No Yes Yes 5
0.17
0.56
Heidelberg Cement Median
Royalty Payout (Rs. bn)
15.07
12.93
Heidelberg Cement Median
Royalty as % of (PBT + Royalty)
1.04
2.01
Heidelberg Cement Median
Royalty as % of Net Sales
CY10 CY11 CY12 CY13 FY15*
Net Sales PBT Royalty
0.14 0.16
0.17 0.17 0.17
0.01
CY10 CY11 CY12 CY13 FY15*
Royalty related fees Dividend Paid
Nature of transaction Amount (Rs.bn) Technical Knowhow Fees 0.17 Total 0.17
CY12 CY13 FY15* Net Sales 11.04 12.09 16.35 PBT 0.46 (0.85) 0.96
RED
Note: Weak macro-economic environment and high capital expenditures lead to a
drop in the profitability of the company in CY13.
Institutional EYE IiAS Comment | 18 February 2016
27 iias.in February 2016
Hindustan Unilever Limited IiAS Royalty Signal
Industry: FMCG Promoter: Unilever PLC
FY15 Royalty details Financials (Rs. bn)
Key Highlights:
Chart 1: Royalty compared to Median
Chart 2: Royalty vs Net Sales and PBT (Normalised)
Chart 3: Royalty vs Dividend (Rs. bn)
IiAS Royalty Signal
Name of the company
Score
Peer comparison - No. of years’ company outperformed Benchmark (y-o-y)
Is ‘increase in royalty’ more than growth (5 Year CAGR)
No. of years’
royalty paid was
higher than
dividend
Growth in
revenue
Growth in PBT
PBT margins
Dividend payout
ROCE Total
Income PBT Dividend
Hindustan Unilever Ltd.
50 2 2 3 5 5 Yes Yes Yes 0
7.38
0.56
HUL Median
Royalty Payout (Rs. bn)
10.66
12.93
HUL Median
Royalty as % of (PBT + Royalty)
2.39
2.01
HUL Median
Royalty as % of Net Sales
FY11 FY12 FY13 FY14 FY15
Net Sales PBT Royalty
2.87 3.11 3.84 5.31 7.38
16.42 18.84
46.56
32.73
38.81
FY11 FY12 FY13 FY14 FY15
Royalty related fees Dividend Paid
Nature of transaction Amount (Rs.bn) Royalty fees (Parent and Subsidiaries)
7.35
Management fees 0.02 Total 7.38
FY13 FY14 FY15 Net Sales 258.10 280.19 308.06 PBT 49.58 50.28 61.87
AMBER
Note: In FY13 HUL gave a special dividend of Rs. 8 per share bringing the total dividend
per share to Rs. 18.5.

Institutional EYE IiAS Comment | 18 February 2016
28 iias.in February 2016
Hitachi Home & Life Solutions (India) Ltd IiAS Royalty Signal
Industry: Consumer Electronics Promoter: Hitachi Appliances Inc.
FY15 Royalty details Financials (Rs. bn)
Key Highlights:
Chart 1: Royalty compared to Median
Chart 2: Royalty vs Net Sales and PBT (Normalised)
Chart 3: Royalty vs Dividend (Rs. bn)
IiAS Royalty Signal
Name of the company
Score
Peer comparison - No. of years’ company outperformed Benchmark (y-o-y)
Is ‘increase in royalty’ more than growth (5 Year CAGR)
No. of years’
royalty paid was
higher than
dividend
Growth in revenue
Growth in PBT
PBT margins
Dividend payout
ROCE Total
Income PBT Dividend
Hitachi Home & Life Solutions
(India) Ltd. 20 3 2 0 3 2 Yes Yes Yes 5
0.42
0.56
Hitachi Median
Royalty Payout (Rs. bn)
29.43
12.93
Hitachi Median
Royalty as % of (PBT + Royalty)
2.68
2.01
Hitachi Median
Royalty as % of Net Sales
FY11 FY12 FY13 FY14 FY15
Net Sales PBT Royalty
0.23 0.25 0.30 0.31
0.42
0.04 0.04 0.05 0.05 0.05
FY11 FY12 FY13 FY14 FY15
Royalty related fees Dividend Paid
Nature of transaction Amount (Rs.bn) Royalty 0.34 Technical Know-how fees amortised
0.08
Total 0.42
FY13 FY14 FY15 Net Sales 9.30 11.00 15.73 PBT 0.21 0.11 1.01
RED
Institutional EYE IiAS Comment | 18 February 2016
29 iias.in February 2016
Ingersoll-Rand (India) Limited IiAS Royalty Signal
Industry: Industrial Machinery Promoter: Ingersoll-Rand PLC
FY15 Royalty details Financials (Rs. bn)
Key Highlights:
Chart 1: Royalty compared to Median
Chart 2: Royalty vs Net Sales and PBT (Normalised)
Chart 3: Royalty vs Dividend (Rs. bn)
IiAS Royalty Signal
Name of the company
Score
Peer comparison - No. of years’ company outperformed Benchmark (y-o-y)
Is ‘increase in royalty’ more than growth (5 Year CAGR)
No. of years’
royalty paid was
higher than
dividend
Growth in
revenue
Growth in PBT
PBT margins
Dividend payout
ROCE Total
Income PBT Dividend
Ingersoll-Rand (India) Ltd.
40 2 1 3 5 2 Yes Yes Yes 0
0.08
0.56
Ingersoll-Rand(India)
Median
Royalty Payout (Rs. bn)
7.26
12.93
Ingersoll-Rand(India)
Median
Royalty as % of (PBT + Royalty)
1.21
2.01
Ingersoll-Rand(India)
Median
Royalty as % of Net Sales
FY11 FY12 FY13 FY14 FY15
Net Sales PBT Royalty
0.07 0.070.13 0.12
0.08
0.22
0.88
0.22 0.22 0.23
FY11 FY12 FY13 FY14 FY15
Royalty related fees Dividend Paid
Nature of transaction Amount (Rs.bn) Management fees 0.08 Total 0.08
FY13 FY14 FY15 Net Sales 5.81 5.79 6.56 PBT 1.11 0.98 1.01
RED

Institutional EYE IiAS Comment | 18 February 2016
30 iias.in February 2016
Kansai Nerolac Paints Limited IiAS Royalty Signal
Industry: Furniture, Furnishing, Paints Promoter: Kansai Paint Company Limited
FY15 Royalty details Financials (Rs. bn)
Key Highlights:
Chart 1: Royalty compared to Median
Chart 2: Royalty vs Net Sales and PBT (Normalised)
Chart 3: Royalty vs Dividend (Rs. bn)
IiAS Royalty Signal
Name of the company
Score
Peer comparison - No. of years’ company outperformed Benchmark (y-o-y)
Is ‘increase in royalty’ more than growth (5 Year CAGR)
No. of years’
royalty paid was
higher than
dividend
Growth in
revenue
Growth in PBT
PBT margins
Dividend payout
ROCE Total
Income PBT Dividend
Kansai Nerolac Paints Ltd.
80 3 2 0 4 5 No No No 0
0.13
0.56
Kansai NerolacPaints Limited
Median
Royalty Payout (Rs. bn)
3.11
12.93
Kansai NerolacPaints Limited
Median
Royalty as % of (PBT + Royalty)
0.36
2.01
Kansai NerolacPaints Limited
Median
Royalty as % of Net Sales
FY11 FY12 FY13 FY14 FY15
Net Sales PBT Royalty
0.12 0.12 0.15 0.15 0.13
0.630.69 0.69 0.69
0.91
FY11 FY12 FY13 FY14 FY15
Royalty related fees Dividend Paid
Nature of transaction Amount (Rs.bn) Royalty and technical fees 0.13 Total 0.13
FY13 FY14 FY15 Net Sales 28.39 31.36 35.32 PBT 4.20 3.07 3.99
GREEN

Institutional EYE IiAS Comment | 18 February 2016
31 iias.in February 2016
Maruti Suzuki Limited IiAS Royalty Signal
Industry: Cars & Utility Vehicles Promoter: Suzuki Motor Corporation
FY15 Royalty details Financials (Rs. bn)
Key Highlights:
Chart 1: Royalty compared to Median
Chart 2: Royalty vs Net Sales and PBT (Normalised)
Chart 3: Royalty vs Dividend (Rs. bn)
IiAS Royalty Signal
Name of the company
Score
Peer comparison - No. of years’ company outperformed Benchmark (y-o-y)
Is ‘increase in royalty’ more than growth (5 Year CAGR)
No. of years’
royalty paid was
higher than
dividend
Growth in
revenue
Growth in PBT
PBT margins
Dividend payout
ROCE Total
Income PBT Dividend
Maruti Suzuki India Ltd.
40 3 3 0 0 5 Yes Yes No 5
27.68
0.56
Maruti Median
Royalty Payout (Rs. bn)
36.20
12.93
Maruti Median
Royalty as % of (PBT + Royalty) 5.69
2.01
Maruti Median
Royalty as % of Net Sales
FY11 FY12 FY13 FY14 FY15
Net Sales PBT Royalty
19.08 18.40
25.44 25.86 27.68
2.52 2.52 2.83 4.24
9.09
FY11 FY12 FY13 FY14 FY15
Total Royalty Dividend Paid
Nature of transaction Amount (Rs.bn) Running Royalty 26.58 Lump sum Royalty Amortised for the year 1.10 Total 27.68
FY13 FY14 FY15 Net Sales 426.13 426.45 486.06 PBT 29.91 36.59 48.68
RED

Institutional EYE IiAS Comment | 18 February 2016
32 iias.in February 2016
Nestlé India Limited IiAS Royalty Signal
Industry: Packaged Foods Promoter: Nestlé S.A
CY14 Royalty details Financials (Rs. bn)
Key Highlights:
Chart 1: Royalty compared to Median
Chart 2: Royalty vs Net Sales and PBT (Normalised)
Chart 3: Royalty vs Dividend (Rs. bn)
IiAS Royalty Signal
Name of the company
Score
Peer comparison - No. of years’ company outperformed Benchmark (y-o-y)
Is ‘increase in royalty’ more than growth (5 Year CAGR)
No. of years’
royalty paid was
higher than
dividend
Growth in
revenue
Growth in PBT
PBT margins
Dividend payout
ROCE Total
Income PBT Dividend
Nestlé India Ltd. 50 1 1 3 5 5 Yes Yes Yes 0
4.16
0.56
Nestlé Median
Royalty Payout (Rs. bn)
19.00
12.93
Nestlé Median
Royalty as % of (PBT + Royalty)
4.24
2.01
Nestlé Median
Royalty as % of Net Sales
CY10 CY11 CY12 CY13 CY14
Net Sales PBT Royalty
2.60 3.17 3.49 3.69
4.16
5.45 5.43 5.43 5.47
7.17
CY10 CY11 CY12 CY13 CY14
Royalty related fees Dividend Paid
Nature of transaction Amount (Rs.bn) General license fees 3.51 Information technology and management information systems fees
0.65
Total 4.16
CY12 CY13 CY14 Net Sales 83.02 90.62 98.06 PBT 15.53 16.78 17.74
AMBER
Institutional EYE IiAS Comment | 18 February 2016
33 iias.in February 2016
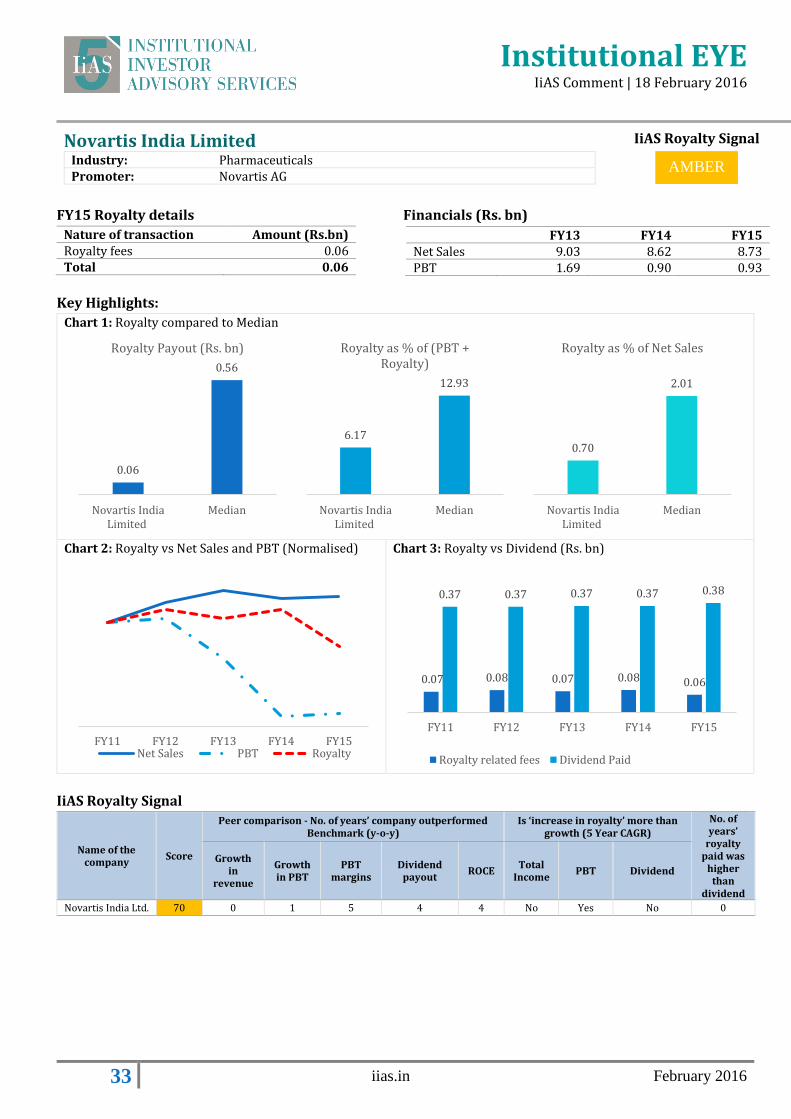
Novartis India Limited IiAS Royalty Signal
Industry: Pharmaceuticals Promoter: Novartis AG
FY15 Royalty details Financials (Rs. bn)
Key Highlights:
Chart 1: Royalty compared to Median
Chart 2: Royalty vs Net Sales and PBT (Normalised)
Chart 3: Royalty vs Dividend (Rs. bn)
IiAS Royalty Signal
Name of the company
Score
Peer comparison - No. of years’ company outperformed Benchmark (y-o-y)
Is ‘increase in royalty’ more than growth (5 Year CAGR)
No. of years’
royalty paid was
higher than
dividend
Growth in
revenue
Growth in PBT
PBT margins
Dividend payout
ROCE Total
Income PBT Dividend
Novartis India Ltd. 70 0 1 5 4 4 No Yes No 0
0.06
0.56
Novartis IndiaLimited
Median
Royalty Payout (Rs. bn)
6.17
12.93
Novartis IndiaLimited
Median
Royalty as % of (PBT + Royalty)
0.70
2.01
Novartis IndiaLimited
Median
Royalty as % of Net Sales
FY11 FY12 FY13 FY14 FY15Net Sales PBT Royalty
0.07 0.08 0.07 0.08 0.06
0.37 0.37 0.37 0.37 0.38
FY11 FY12 FY13 FY14 FY15
Royalty related fees Dividend Paid
Nature of transaction Amount (Rs.bn) Royalty fees 0.06 Total 0.06
FY13 FY14 FY15 Net Sales 9.03 8.62 8.73 PBT 1.69 0.90 0.93
AMBER

Institutional EYE IiAS Comment | 18 February 2016
34 iias.in February 2016
Procter & Gamble Limited IiAS Royalty Signal
Industry: Personal Products Promoter: The Procter & Gamble Company
FY15 Royalty details Financials (Rs. bn)
Key Highlights:
Chart 1: Royalty compared to Median
Chart 2: Royalty vs Net Sales and PBT (Normalised)
Chart 3: Royalty vs Dividend (Rs.bn)
IiAS Royalty Signal
Name of the company
Score
Peer comparison - No. of years’ company outperformed Benchmark (y-o-y)
Is ‘increase in royalty’ more than growth (5 Year CAGR)
No. of years’
royalty paid was
higher than
dividend
Growth in
revenue
Growth in PBT
PBT margins
Dividend payout
ROCE Total
Income PBT Dividend
Procter & Gamble Hygiene & Health
Care Ltd. 90 4 4 3 5 5 No No Yes 0
1.00
0.56
P&G Median
Royalty Payout (Rs. bn)
16.70
12.93
P&G Median
Royalty as % of (PBT + Royalty)
4.30
2.01
P&G Median
Royalty as % of Net Sales
FY11 FY12 FY13 FY14 FY15
Net Sales PBT Royalty
0.52 0.57 0.71
0.85
1.00
0.85 0.85 0.95
1.04 1.18
FY11 FY12 FY13 FY14 FY15
Royalty related fees Dividend Paid
Nature of transaction Amount (Rs.bn) Royalty 1.00 Total 1.00
FY13 FY14 FY15 Net Sales 16.87 20.51 23.32 PBT 2.86 4.60 5.01
GREEN

Institutional EYE IiAS Comment | 18 February 2016
35 iias.in February 2016
SKF Limited IiAS Royalty Signal
Industry: Other Industrial Goods Promoter: AB SKF
CY14 Royalty details Financials (Rs. bn)
Key Highlights:
Chart 1: Royalty compared to Median
Chart 2: Royalty vs Net Sales and PBT (Normalised)
Chart 3: Royalty vs Dividend (Rs. bn)
IiAS Royalty Signal
Name of the company
Score
Peer comparison - No. of years’ company outperformed Benchmark (y-o-y)
Is ‘increase in royalty’ more than growth (5 Year CAGR)
No. of years’
royalty paid was
higher than
dividend
Growth in
revenue
Growth in PBT
PBT margins
Dividend payout
ROCE Total
Income PBT Dividend
S K F India Ltd. 20 1 2 1 3 5 Yes Yes Yes 3
0.66
0.56
SKF India Limited Median
Royalty Payout (Rs. bn)
17.63
12.93
SKF India Limited Median
Royalty as % of (PBT + Royalty) 2.79
2.01
SKF India Limited Median
Royalty as % of Net Sales
CY10 CY11 CY12 CY13 CY14
Net Sales PBT Royalty
0.11 0.14
0.46
0.620.66
0.43 0.46 0.46 0.46
0.55
CY10 CY11 CY12 CY13 CY14
Royalty related fees Dividend Paid
Nature of transaction Amount (Rs.bn) Royalty 0.39 Trade Mark Fees 0.26 Total 0.66
CY12 CY13 CY14 Net Sales 21.85 22.26 23.52 PBT 2.83 2.53 3.06
RED
Note: The company launched a new product in CY12 (SKF BeyondZero) with
technical support from the parent translating into a significant spike in royalty
payouts.

Institutional EYE IiAS Comment | 18 February 2016
36 iias.in February 2016
Schneider Electric Infrastructure Limited IiAS Royalty Signal
Industry: Heavy Electrical Equipment Promoter: Schneider Electric Singapore Pte. Limited
FY15 Royalty details Financials (Rs. bn)
Key Highlights:
Chart 1: Royalty compared to Median
Chart 2: Royalty vs Net Sales and PBT (Normalised)
Chart 3: Royalty vs Dividend (Rs. bn)
IiAS Royalty Signal
Name of the company Score
Peer comparison - No. of years’ company
outperformed Benchmark (y-o-y)
Is ‘increase in royalty’ more
than growth (5 Year CAGR) No. of years’
royalty paid
was higher
than dividend
Growth
in
revenue
Growth
in PBT
PBT
margins
Dividend
payout ROCE
Total
Income PBT Dividend
Schneider Electric Infrastructure Ltd. 0 0 1 0 1 1 Yes Yes Yes 4
0.49
0.56
SchneiderElectric
Median
Royalty Payout (Rs. bn)
154.53
12.93
Schneider Electric Median
Royalty as % of (PBT + Royalty) 3.71
2.01
Schneider Electric Median
Royalty as % of Net Sales
FY12 FY13 FY14 FY15
Net Sales PBT Royalty
0.06
0.250.21
0.49
0.11
FY12 FY13 FY14 FY15
Royalty related fees Dividend Paid
Nature of transaction Amount (Rs. bn) Trademark Fee 0.24 Management Support Fee 0.25 Total 0.49
FY13 FY14 FY15 Net Sales 13.10 12.16 13.10 PBT (0.28) (1.25) (0.17)
RED
Note: The company has been witnessing increasing inventory levels owing to the
weak economic environment. Poor infrastructure offtake impacted the financial
performance of the company.

Institutional EYE IiAS Comment | 18 February 2016
37 iias.in February 2016
Timken India Limited IiAS Royalty Signal
Industry: Industrial Machinery Promoter: The Timken Company
FY15 Royalty details Financials (Rs. bn)
Key Highlights:
Chart 1: Royalty compared to Median
Chart 2: Royalty vs Net Sales and PBT (Normalised)
Chart 3: Royalty vs Dividend (Rs. bn)
* Figures have been annualised.
IiAS Royalty Signal
Name of the company
Score
Peer comparison - No. of years’ company outperformed Benchmark (y-o-y)
Is ‘increase in royalty’ more than growth (5 Year CAGR)
No. of years’
royalty paid was
higher than
dividend
Growth in
revenue
Growth in PBT
PBT margins
Dividend payout
ROCE Total
Income PBT Dividend
Timken India Ltd. 80 3 3 1 4 5 No No Yes 1
0.19
0.56
Timken IndiaLimited
Median
Royalty Payout (Rs. bn)
13.34
12.93
Timken IndiaLimited
Median
Royalty as % of (PBT + Royalty)
2.03
2.01
Timken IndiaLimited
Median
Royalty as % of Net Sales
CY10 FY12* FY13 FY14 FY15
Net Sales PBT Royalty
0.09 0.16 0.16 0.17 0.19
1.18
0.16
0.52
0.25
CY10 FY12* FY13 FY14 FY15
Royalty related fees Dividend Paid
Nature of transaction Amount (Rs.bn) Royalty 0.19 Total 0.19
FY13 FY14 FY15 Net Sales 6.89 7.20 9.29 PBT 0.64 0.66 1.22
GREEN
Note: In FY12 the company paid out a higher interim dividend of Rs. 20 per share on
account of successful operations.

Institutional EYE IiAS Comment | 18 February 2016
38 iias.in February 2016
United Spirits Limited IiAS Royalty Signal
Industry: Breweries & Distilleries Promoter: Diageo PLC
FY15 Royalty details Financials (Rs. bn)
Key Highlights:
Chart 1: Royalty compared to Median
Chart 2: Royalty vs Net Sales and PBT (in Rs. bn)
Chart 3: Royalty vs Dividend (Rs. bn)
IiAS Royalty Signal
Name of the company
Score
Peer comparison - No. of years’ company outperformed Benchmark (y-o-y)
Is ‘increase in royalty’ more than growth (5 Year CAGR)
No. of years’
royalty paid was
higher than
dividend
Growth in
revenue
Growth in PBT
PBT margins
Dividend payout
ROCE Total
Income PBT Dividend
United Spirits Ltd. 20 1 0 0 0 0 Yes Yes Yes 2
0.58
0.56
United SpiritsLimited
Median
Royalty Payout (Rs. bn)
-3.08
12.93
United SpiritsLimited
Median
Royalty as % of (PBT + Royalty)
0.72
2.01
United SpiritsLimited
Median
Royalty as % of Net Sales
84.26 79.52
0.43 0.58
(50.60)
(18.99)
FY14 FY15
Net sales (Rs. bn) Royalty related fees PBT
0.01 - -
0.43
0.58
0.38 0.38 0.38
0.04
FY11 FY12 FY13 FY14 FY15
Royalty related fees Dividend Paid
Nature of transaction Amount (Rs.bn) Trade-mark license fees 0.58 Total 0.58
FY13 FY14 FY15 Net Sales 83.18 84.26 79.52 PBT 3.21 (50.60) (18.99)
RED

Institutional EYE IiAS Comment | 18 February 2016
39 iias.in February 2016
Wabco India Limited IiAS Royalty Signal
Industry: Auto Parts & Equipment Promoter: WABCO Holdings Inc
FY15 Royalty details Financials (Rs. bn)
Key Highlights:
Chart 1: Royalty compared to Median
Chart 2: Royalty vs Net Sales and PBT
Chart 3: Royalty vs Dividend (Rs. bn)
IiAS Royalty Signal
Name of the company
Score
Peer comparison - No. of years’ company outperformed Benchmark (y-o-y)
Is ‘increase in royalty’ more than growth (5 Year CAGR)
No. of years’
royalty paid was
higher than
dividend
Growth in
revenue
Growth in PBT
PBT margins
Dividend payout
ROCE Total
Income PBT Dividend
Wabco India Ltd. 60 3 1 3 0 5 No No No 3
0.14
0.56
Wabco IndiaLimited
Median
Royalty Payout (Rs. bn)
7.47
12.93
Wabco IndiaLimited
Median
Royalty as % of (PBT + Royalty)
1.06
2.01
Wabco IndiaLimited
Median
Royalty as % of Net Sales
FY12 FY13 FY14 FY15
Net Sales PBT Royalty
0.07
0.120.14 0.14
0.11 0.11 0.11 0.11 0.11
FY11 FY12 FY13 FY14 FY15
Royalty related fees Dividend Paid
Nature of transaction Amount (Rs.bn) Royalty fees 0.08 Fees for technical services 0.06 Total 0.14
FY13 FY14 FY15 Net Sales 9.66 11.11 13.48 PBT 1.85 1.61 1.77
AMBER

Institutional EYE IiAS Comment | 18 February 2016
40 iias.in February 2016
Whirlpool of India Limited IiAS Royalty Signal
Industry: Consumer Electronics Promoter: Whirlpool Corporation
FY15 Royalty details Financials (Rs. bn)
Key Highlights:
Chart 1: Royalty compared to Median
Chart 2: Royalty vs Net Sales and PBT (Normalised)
Chart 3: Royalty vs Dividend (Rs.bn)
IiAS Royalty Signal
Name of the company
Score
Peer comparison - No. of years’ company outperformed Benchmark (y-o-y)
Is ‘increase in royalty’ more than growth (5 Year CAGR)
No. of years’
royalty paid was
higher than
dividend
Growth in
revenue
Growth in PBT
PBT margins
Dividend payout
ROCE Total
Income PBT Dividend
Whirlpool of India Ltd.
30 2 1 0 0 5 No No Yes 5
0.43
0.56
Whirlpool Median
Royalty Payout (Rs. bn)
12.53
12.93
Whirlpool Median
Royalty as % of (PBT + Royalty)
1.31
2.01
Whirlpool Median
Royalty as % of Net Sales
FY11 FY12 FY13 FY14 FY15
Net Sales PBT Royalty
0.37 0.36 0.36 0.35
0.43
FY11 FY12 FY13 FY14 FY15
Royalty related fees Dividend Paid
Nature of transaction Amount (Rs.bn) Royalty Fee 0.29 Technical know-how fee 0.14 Total 0.43
FY13 FY14 FY15 Net Sales 27.73 28.35 32.94 PBT 1.79 1.74 3.01
RED

Institutional EYE IiAS Comment | 18 February 2016
41 iias.in February 2016
Disclaimer This document has been prepared by Institutional Investor Advisory Services India Limited (IiAS). The information contained herein is solely from publicly available data, but we do not represent that it is accurate or complete and it should not be relied on as such. IiAS shall not be in any way responsible for any loss or damage that may arise to any person from any inadvertent error in the information contained in this report. This document is provided for assistance only and is not intended to be and must not be taken as the basis for any voting or investment decision. The user assumes the entire risk of any use made of this information. Each recipient of this document should make such investigation as it deems necessary to arrive at an independent evaluation of the individual resolutions referred to in this document (including the merits and risks involved). The discussions or views expressed may not be suitable for all investors. The information given in this document is as of the date of this report and there can be no assurance that future results or events will be consistent with this information. This information is subject to change without any prior notice. IiAS reserves the right to make modifications and alterations to this statement as may be required from time to time. However, IiAS is under no obligation to update or keep the information current. Nevertheless, IiAS is committed to providing independent and transparent recommendation to its client and would be happy to provide any information in response to specific client queries. Neither IiAS nor any of its affiliates, group companies, directors, employees, agents or representatives shall be liable for any damages whether direct, indirect, special or consequential including lost revenue or lost profits that may arise from or in connection with the use of the information. The disclosures of interest statements incorporated in this document are provided solely to enhance the transparency and should not be treated as endorsement of the views expressed in the report.
Confidentiality This information is strictly confidential and is being furnished to you solely for your information. This information should not be reproduced or redistributed or passed on directly or indirectly in any form to any other person or published, copied, in whole or in part, for any purpose. This report is not directed or intended for distribution to, or use by, any person or entity who is a citizen or resident of or located in any locality, state, country or other jurisdiction, where such distribution, publication, availability or use would be contrary to law, regulation or which would subject IiAS to any registration or licensing requirements within such jurisdiction. The distribution of this document in certain jurisdictions may be restricted by law, and persons in whose possession this document comes, should inform themselves about and observe, any such restrictions. The information provided in these reports remains, unless otherwise stated, the copyright of IiAS. All layout, design, original artwork, concepts and other Intellectual Properties, remains the property and copyright of IiAS and may not be used in any form or for any purpose whatsoever by any party without the express written permission of the copyright holders.
IiAS Voting Policy IiAS' voting recommendations are based on a set of guiding principles, which incorporate the basic tenets of the legal framework along with the best practices followed by some of the better governed companies. These policies clearly list out the rationale and evaluation parameters which are taken into consideration while finalizing the recommendations. The detailed IiAS Voting Guidelines are available at www.iias.in/IiAS-voting-guidelines.aspx. The draft report prepared by the analyst is referred to an internal Review and Oversight Committee (ROC), which is responsible for ensuring consistency in voting recommendations, alignment of recommendations to the IiAS’ voting criteria and setting and maintaining quality standards of IiAS’ proxy reports. Details regarding the functioning and composition of the ROC committee are available at www.iias.in. In undertaking its activities, IiAS relies on information available in the public domain i.e. information that is available to public shareholders. However, in order to provide a more meaningful analysis, IiAS, generally seeks clarifications from the subject company. IiAS reserves the right to share the information provided by the subject company in its reports. Further details on IiAS policy on communication with subject companies are available at www.iias.in.
Analyst Certification The research analyst(s) for this report certify/ies that no part of his/her/their compensation was, is or will be, directly or indirectly related to specific recommendations or views expressed in this report. IiAS’ internal policies and control procedures governing the dealing and trading in securities by employees are available at www.iias.in.
Conflict Management IiAS and its research analysts may hold a nominal number of shares in companies IiAS covers (including the subject company), as on the date of this report. A list of IiAS’ shareholding in companies is available at www.iias.in.
However, IiAS, the research analyst(s) responsible for this report, and their associates or relatives, do not have actual/beneficial ownership of one per cent or more securities of the subject company, at the end of the month immediately preceding the date of publication of this report. A list of shareholders of IiAS as of the date of this report is available at www.iias.in. However, the preparation of this report is monitored by an internal Review and Oversight Committee (ROC) of IiAS and is not subject to the control of any company to which such report may relate and which may be a shareholder of IiAS.

Institutional EYE IiAS Comment | 18 February 2016
42 iias.in February 2016
Other Disclosures IiAS further confirms that, save as otherwise set out above or disclosed on IiAS’ website (www.iias.in):
IiAS, the research analyst(s) responsible for this report, and their associates or relatives, do not have any financial interest in the subject company.
IiAS, the research analyst(s) responsible for this report, and their associates or relatives, do not have any other material conflict of interest at the time of publication of this report.
As a proxy advisory firm, IiAS provides subscription, databased and other related services to various Indian and international customers (which could include the subject company). IiAS generally receives between INR 10,000 and INR 25,00,000 for such services from its customers. Other than compensation that it may have received for providing such services to the subject company in the ordinary course, none of IiAS, the research analyst(s) responsible for this report, and their associates or relatives, has received any compensation from the subject company or any third party for this report.
None of IiAS, the research analyst(s) responsible for this report, and their associates or relatives, has received any compensation from the subject company or any third party in the past 12 months in connection with the provision of services of products (including investment banking or merchant banking or brokerage services or any other products and services), or managed or co-managed public offering of securities of the subject company.
The research analyst(s) responsible for this report has not served as an officer, director or employee of the subject company. None of IiAS or the research analyst(s) responsible for this report has been engaged in market making activity for the subject company.

Institutional Investor Advisory Services India Limited (IiAS) is an advisory firm, dedicated to providing participants in the Indian market with independent opinion, research and data on corporate governance issues. IiAS also provides voting recommendations on shareholder resolutions for over 650 companies. To know more about IiAS visit www.iias.in Subscriptions help IiAS stay fiercely independent. To subscribe to IiAS research write to us at [email protected]
Office Institutional Investor Advisory Services 15th Floor, West Wing, P J Tower, Dalal Street, Fort, Mumbai - 400 001 India Contact [email protected] T: +91 22 2272 1570-3 F: +91 22 2272 1574
markets ∩ governance


