Running Head: EVALUATION OF MEASUREMENT
Evaluation of measurement precision with Rasch-type models:
The case of the short Generalized Opinion Leadership Scale
Timo Gnambs and Bernad Batinic
University of Linz
Corresponding author:
Timo Gnambs
Department of Education and Psychology
Johannes Kepler University Linz
Altenberger Strasse 69
4040 Linz, Austria
Email: [email protected]
Published in Personality and Individual Differences, doi:j.paid.2010.08.021
This is the pre-peer reviewed version of the article.
The definitive version is available at sciencedirect.com.

Evaluation of measurement
2
Abstract
Item response theory (IRT) forms a flexible psychometric modeling approach to
construct and evaluate new assessment instruments. This paper demonstrates how to
evaluate the measurement precision of personality scales by assessing their test-retest error
and their convergence across different raters within an IRT framework. The first study (N =
1575) reports on the construction of a new personality scale to assess generalized opinion
leadership by fitting a polytomous Rasch model to the data. Furthermore, in two
independent samples the psychometric properties of the scale are evaluated by applying the
linear partial credit model. In a retest design the amount of transient error, that is, systematic
measurement error specific to a single measurement occasion, is quantified within an IRT
framework (study II, N = 586) as well as the convergence of self-and observer-ratings of the
trait (study III, N = 400).
Keywords: measurement error; item response theory; partial credit model; transient
error; repeated measurement design; opinion leadership
Evaluation of measurement
3
Evaluation of measurement precision with Rasch-type models:
The case of the short Generalized Opinion Leadership Scale
Item response theory (IRT) represents a stringent framework for the construction and
evaluation of new measurement instruments (cf. Reise, Ainsworth, & Haviland, 2005).
Although item response theory is primarily used in large-scale cognitive assessments – for
example for the ongoing PISA studies (Adams, Wu, & Carstensen, 2007) - its potential for
personality research is increasingly acknowledged as well. A growing number of
researchers relies on IRT models when developing new assessment instruments by selecting
high-quality items according to stringent model tests (cf. Ansher, Weatherby, Kang, &
Watson, 2009; Meads & Bentall, 2008). However, specific forms of measurement error (e.g.,
transient error) that are typically used in classical test theory (CTT) to evaluate the
measurement precision of self-report scales are rarely studied with IRT methods. In other
words, while IRT is readily used for the creation of new scales less attention is given to the
evaluation of the measurement qualities of those scales. Hence, the aim of the present article
is twofold: First, a new personality scale, the short generalized opinion leadership scale (S-
GOLS), will be developed by applying a polytomous Rasch-type item response model.
Second, it will be demonstrated how to conduct in-depth psychometric analyses of this new
scale by assessing its test-retest error and its convergence across different raters within an
IRT framework.
Measurement precision of self-report scales
In personality research, different approaches are used to assess an instrument´s
measurement precision. An easy to compute indicator of the average amount of
measurement error in CTT is usually captured by measures of internal consistency that
estimates the mean inter-correlations of an item set. Transient error is another form of
systematic measurement error, which reflects distortions within a respondent specific to a

Evaluation of measurement
4
certain measurement occasion (e.g., due to a current mood). Although it may produce
consistent responses during a single measurement occasion, it results in different responses
across different assessments (Chmielewski & Watson, 2009). A third approach represents
the assessment of self-other agreements. Self-reports frequently provide distorted measures
of the true traits, as they can be affected by, for example, a limited ability for introspection
or deliberate impression management. Hence, some authors (e.g., Hofstee, 1994; Vazire &
Gosling, 2004) argue that it is important to assess the convergence of self-and observer-
ratings of traits, as the combination of both perspectives usually captures true traits more
accurately.
Under CTT, all three forms of measurement precision are routinely evaluated
through various correlational approaches (e.g., Cronbach´s Alpha, test-retest or self-other
correlations). Within IRT, however, authors focus primarily on an instrument´s
measurement error as IRT models generate different standard errors of measurement
depending on an individual´s latent proficiency. In contrast to CTT that measures an
average measurement error across all individuals within a sample IRT models estimate a
proper measurement error for each proficiency level (Reise & Henson, 2003). Other types of
measurement precision, transient error and self-other agreement, are not commonly
analyzed within an IRT framework. However, linear extensions of the ordinary Rasch
model, like the polytomous linear partial credit model (LPCM; Fischer & Ponocny, 1994),
provide a viable approach to these forms of measurement precision as well.
Linear extensions of Rasch-type models
Rasch-type models such as the polytomous partial credit model (PCM; Masters,
1982) pose a logistic relationship between the latent proficiency θv of individual v and the
probability of a response [ ]imh ,0∈ (with mi as the number of response categories minus
one) on item i with mi item-category difficulties βih. The formal representation of the PCM
in the parameterization by Andersen (1995)1 is given in equation 1.
Evaluation of measurement
5
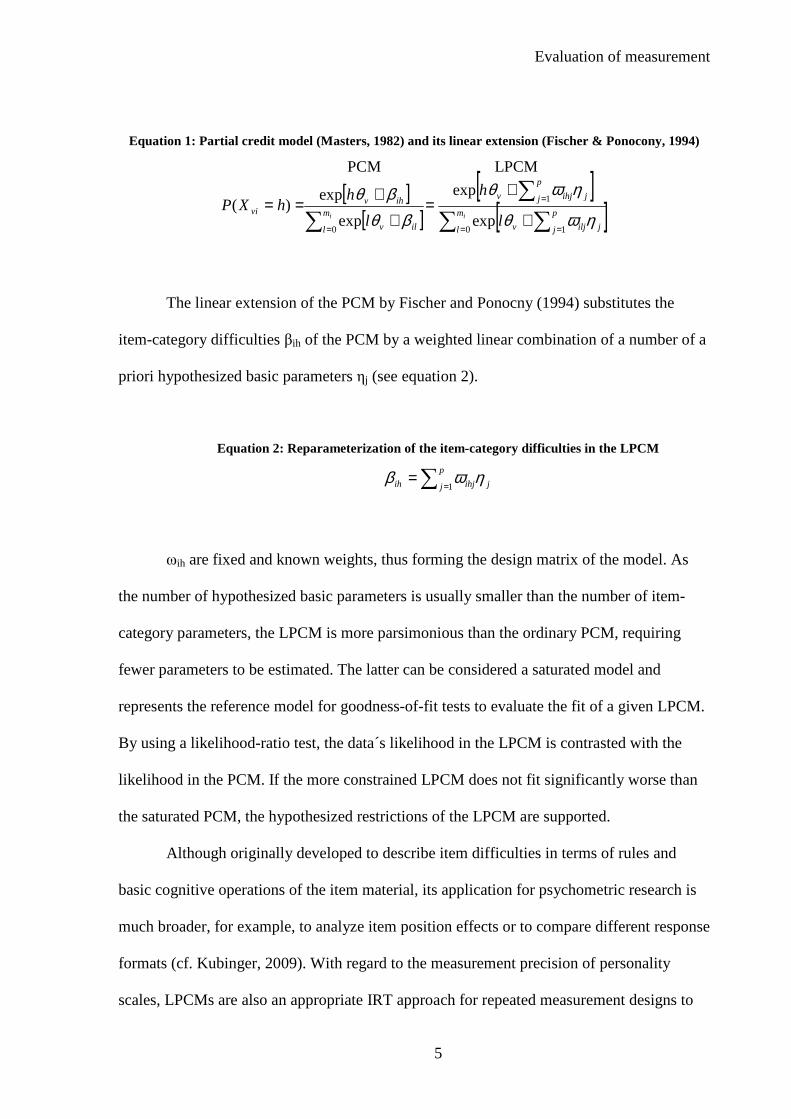
Equation 1: Partial credit model (Masters, 1982) and its linear extension (Fischer & Ponocony, 1994)
[ ][ ]
[ ][ ]∑ ∑
∑
∑ = =
=
=+
+=
+
+==
ii m
l
p
j jiljv
p
j jihjv
m
l ilv
ihvvi
l
h
l
hhXP
0 1
1
0exp
exp
exp
exp)(
LPCMPCM
ηωθ
ηωθ
βθβθ
The linear extension of the PCM by Fischer and Ponocny (1994) substitutes the
item-category difficulties βih of the PCM by a weighted linear combination of a number of a
priori hypothesized basic parameters ηj (see equation 2).
Equation 2: Reparameterization of the item-category difficulties in the LPCM
∑ == p
j jihjih 1ηωβ
ωih are fixed and known weights, thus forming the design matrix of the model. As
the number of hypothesized basic parameters is usually smaller than the number of item-
category parameters, the LPCM is more parsimonious than the ordinary PCM, requiring
fewer parameters to be estimated. The latter can be considered a saturated model and
represents the reference model for goodness-of-fit tests to evaluate the fit of a given LPCM.
By using a likelihood-ratio test, the data´s likelihood in the LPCM is contrasted with the
likelihood in the PCM. If the more constrained LPCM does not fit significantly worse than
the saturated PCM, the hypothesized restrictions of the LPCM are supported.
Although originally developed to describe item difficulties in terms of rules and
basic cognitive operations of the item material, its application for psychometric research is
much broader, for example, to analyze item position effects or to compare different response
formats (cf. Kubinger, 2009). With regard to the measurement precision of personality
scales, LPCMs are also an appropriate IRT approach for repeated measurement designs to

Evaluation of measurement
6
assess the amount of change over one or more measurement occasions. In such models, the
item-category difficulty parameters of the second measurement point can be expressed as a
linear combination of the difficulties at the first measurement point and a change parameter.
If the time period between the two measurements is sufficiently small (Cattell, 1986,
suggests two to eight weeks), this change parameter can be interpreted as the scale´s
transient error. A non-significant change parameter indicates negligible transient error, as
the item-category difficulties are not different from each other at the two measurement
occasions. In case of sufficient theoretical information LPCM designs can address even
more complex hypotheses by modeling different change parameters, i.e. different degrees of
transient error, for different subsets of items (e.g. negatively and positively worded items) or
even different individuals (e.g. men and women). Hence, the LPCM represents a versatile
framework to analyze an instrument´s measurement precision in terms of transient error and
even self-other agreement, when modeling two different informants.
Overview
The identification of exceptionally influential individuals is a central endeavor of
numerous research areas. Social psychology aims at identifying individual differences
shaping group decisions and performance (Vishwanath, 2006), consumer research
incorporates influential consumers as communicators of advertising messages (Shoham &
Ruvio, 2008), and applied diffusion research seeks to propagate the dissemination of
innovations in, for example, health care (Iyengar, Van den Bulte, & Valente, 2010) or
agriculture (Boz & Akbay, 2005). Individuals who informally shape the opinions, attitudes,
and behavior of their peers more frequently and more strongly than others are considered
opinion leaders (Rogers, 2003). Despite its prominence in different domains,
psychometrically sound instruments to assess opinion leadership are still rare. A preliminary
scale to assess generalized opinion leadership (GOL) was proposed by Wiesner (2009).
With 22 items, however, the scale may be considered rather long, especially for applied

Evaluation of measurement
7
contexts such as market or diffusion research. Hence, a subset of items from the GOL scale
is identified that conforms to the partial credit model (study I). Additionally, measurement
precision of the new scale is determined by assessing its transient error with the linear
extension of the PCM in a test-retest design (study II) and, furthermore, by demonstrating
the convergence of self-and observer-ratings (study III).
Study I: Scale construction
Method
Participants and procedure
Participants were interviewed as part of a representative national survey by a
German market research institute. The sample included 727 men and 848 women (N =
1575), ranging in age from 18 to 88 years (M = 46.99, SD = 16.34), with different
educational levels (from high school to university graduates) and employment statuses
(including manual and office workers in public services as well as in the private sector).
| Insert table 1 about here |
Instrument
All participants answered the 22 items of the Generalized Opinion Leadership Scale
(Wiesner, 2009) on a five-point response scale from ”do not agree at all” to ”agree
completely”.
Results
The items for the S-GOLS were identified through an iterative selection process, by
removing critical items one at a time. First, the PCM was estimated for the item set with the
eRm software (Mair & Hatzinger, 2007). Second, model fit was determined for all items as a
whole by statistical as well as graphical methods (cf. Kubinger, 2005). Third, in case of an
improper model fit in the previous step, residual item fit statistics were calculated (Glas &
Evaluation of measurement
8
Verhelst, 1995), and the item with the worst fit, indicated by a significant χ2-statistic, was
removed. These three steps were repeated until the best fitting items were identified and the
resulting item set exhibited a satisfactory model fit. The items of the S-GOLS and their
respective item statistics are summarized in table 1. Model fit of the final scale was
considered acceptable. By partitioning the sample according to three criteria (sex, mean age,
and random split) in two respective groups, three likelihood ratio tests (Andersen, 1973)
were calculated, that did not become significant at a nominal type-I-risk of α = .01 (see table
2). Furthermore, graphical model tests plotting the difficulty parameters of the two
subgroups against each other did not indicate potential misfitting items departing from the
main diagonal. On the item level, the residual-based test statistic proposed by Glas and
Verhelst (1995) did not indicate misfitting items (see table 1). Furthermore, the unweighted
mean square statistic (outfit) indicated close fit of the nine items, with all outfit values
falling within the optimal range of 0.6 to 1.4 (Wright & Linacre, 1994).
| Insert table 2 about here |
An inspection of the difficulty parameters of the item-categories (see table 1),
ranging from -2.72 to 4.56, illustrates that the scale is able to differentiate individuals on a
wide range of trait levels. However, the test information plot (see figure 1), graphing the
area on the θ continuum in which the S-GOLS provides the most information or best
discrimination among test takers, is shifted markedly to the right of the latent continuum,
indicating that the items discriminate better between higher levels of the trait. Thus, the
scale is better in comparing individuals with high levels of opinion leadership than those
with low levels. However, test information declines at the lower and upper trait regions and,
thus, is less suited to discriminate between the more extreme trait levels.

Evaluation of measurement
9
| Insert figure 1 about here |
Study II: Retest precision
Method
Participants and procedure
The sample consisted of N = 560 (353 women) participants from a market research
panel, ranging in age from18 to 76 years (M = 34.14, SD = 11.96), who finished two online
questionnaires identical in content within six weeks.
Instrument
The participants provided two measures of the nine items previously identified as
conforming to the PCM on a five-option response scale.
Results
The test-retest correlation between both measurement occasions was .81. Thus, the
test-retest correlation of the S-GOLS seemed to point to little transient error. However, these
correlations are only of descriptive nature. In contrast, a modeling approach includes
explicit model tests to test the hypothesis that the measure exhibits no transient error. Hence,
the present study applied the LPCM to explicitly model the items´ transient error as a linear
combination of a number of basic parameters. The item-category difficulties of the second
measurement occasion can be conceptualized as the sum of the original item difficulties at
time one and one or more change parameters, in this case representing the amount of
transient error. As a precondition for the application of LPCM designs, the PCM must hold
for all items at both measurement occasions, that is, for 18 items with 72 category
difficulties. If this is the case, this model can be considered a saturated model to which more
constrained LPCMs can be compared. Likelihood-ratio tests (Andersen, 1973) for the
saturated model 0 partitioning the sample according to sex, χ2LR(71) = 69.22, mean age,

Evaluation of measurement
10
χ2LR(71) = 75.77, and random split χ2
LR(71) = 48.78, supported the PCM at an alpha of .01,
χ2.99
(71) = 101.62.
| Insert table 3 about here |
To identify the proper LPCM, a series of competing models with fewer effect
parameters was derived, which eliminate or combine selected effects (see table 3). By
comparing these models to the saturated model 0, the most parsimonious model is identified.
Model 1 strongly restricted the originally 712 effect parameters by modeling one change
parameter only. The 72 difficulty parameters in model 0 were specified as additive
components of the 36 difficulties at time 1 and one change parameter representing the same
amount of change for all difficulties. The corresponding model did not fit worse than model
0, χ2LR(35) = 27.82, p = .80. However, the resulting change parameter, η1 = -.05 [-.12, .02],
was not significantly different from 0. Hence, model 2 removed the change parameter
altogether, assuming no transient error at all. This model did not fit worse than the saturated
model 0 either, χ2LR(36) = 39.99, p = .75. As model 2 represents the most parsimonious
model fitting to the data and requiring the fewest parameters, it is accepted. Hence, for the
S-GOLS transient error seems to be negligible and does not impair the scale considerably.
Study III: Self-other agreement
As the combination of two or more perspectives usually captures true traits more
accurately (Hofstee, 1994; Vaizire & Gosling, 2004), the third study aimed at assessing the
convergence of self-and observer-ratings. In addition, it was predicted that a gender
difference in systematic error, namely a bias toward over- or underestimation of target
influence, would be found. Specifically, it was hypothesized that perceivers would tend to
underestimate the influence of female targets while overestimating the influence of men.
The following rationale is offered for that hypothesis. Research on gender stereotypes

Evaluation of measurement
11
suggests that people more readily associate characteristics related to opinion leadership
(self-confidence, assertiveness, competence, etc.) with men (e.g., Butler & Geis, 1990;
Goldin & Rouse, 2000). Moreover, previous research suggests that a norm of modesty
influences women´s self-presentation (Daubman, Heatherington, & Ahn, 1992), thus
underestimating their real influence. Furthermore, it is proposed that an observer’s gender
moderates the convergence. Cross-cultural research indicates that women are generally
more lenient than men and describe others more favorably on a variety of characteristics
(e.g., more gregarious and more competent) than male raters (McCrae & Terracciano, 2005).
Thus, it is proposed that female and male observers differ in the perceived opinion
leadership of their peers.
Method
Participants and procedure
Participants were N = 400 (255 women) students of different majors (including
economics, psychology, and computer sciences) with a mean age of M = 24.97 years (SD =
6.04), who participated in exchange for partial course credit. The sample provided self-
reports of the S-GOLS. Additionally, peer-ratings on the scale were collected from close
acquaintances (231 women).
Instruments
The sample finished a short questionnaire containing the S-GOLS and additional
items regarding socio-demographic data. For the peers, the items of the S-GOLS were
rephrased to target the person to be evaluated. Apart from that, the self and peer
questionnaire were identical in content. The self-and peer-ratings of the S-GOLS correlated
on average, r = .37, p < .001.
Results
An inspection of the responses for each item indicated that respondents tended to
primarily choose response options 2 through 4, but hardly used the most extreme response

Evaluation of measurement
12
categories. The proportion of the first and last response option for many items fell below
three percent, leading to very low cell counts. As small numbers of responses for extreme
response categories can lead to large standard errors of estimation for item parameters and
additionally raise problems for goodness-of-fit tests (Andersen, 1973), the response options
1 and 2 as well as 4 and 5 were collapsed, resulting in a three-point response scale.
As in study II, a series of LPCMs was derived (see table 3) that modeled the item-
category difficulties of the observer-ratings as a linear combination of the difficulties of the
self-ratings and one or more change parameters. To identify the proper LPCM, in the first
step, again, a saturated model for all items, that is, for 18 items with 36 difficulties, was
estimated (model 0). Likelihood ratio tests (Andersen, 1973) for three partitioning criteria
indicated no model misfit at a nominal type-I risk of α = .01, χ2.99 (35) = 57.34, thus
supporting the PCM for the 18 item set: sex, χ2LR
(35) = 56.18, mean age, χ2LR(35) = 55.24,
and random split, χ2LR(35) = 32.57. Model 1 restricted these parameters in line with the
postulated hypothesis. By cross-classifying the sample according to sex of the respondent
and observer´s sex, four groups were created. The 36 difficulty parameters in model 0 were
then modeled as additive components of the 18 difficulties of the self-ratings and one
change parameter in the four groups. For the four groups, different change parameters were
assumed. The corresponding model did not fit worse than model 0, χ2LR(14) = 6.91, p = .94,
thus corroborating the assumed hypothesis. However, an inspection of the four change
parameters in the four groups pointed to potential simplifications of the model. Firstly, for
male observers, neither the change parameters for females, η1 = .02 [-.17,.21], nor for male
targets, η2 = -.06 [-.30,.18], were significantly different from zero. Secondly, for female
observers, the change parameters for women, η3 = -.38 [-.61,-.14], and men, η4 = -.36 [-.60,-
.13], did not differ significantly, p < .05, from each other, indicating that one change
parameter for both sexes might be sufficient. The corresponding model 2, which
incorporated one change parameter for female and none for male observers, did not fit

Evaluation of measurement
13
worse than model 1, χ2LR(3) = 0.36, p = .95. Finally, to demonstrate the importance of the
change parameter for female observers, model 3 removed the change parameters altogether,
assuming no change at all. This model, however, did fit significantly worse than the
previous model, χ2LR(1) = 47.79, p < .01, thus rejecting the assumption of no change.
As model 2 represents the most parsimonious model, requiring the fewest effect
parameters, it is accepted. Hence, for male observers, the difficulty parameters do not differ
significantly from the corresponding self-reports. Thus, self-reported and perceived opinion
leadership closely match for male observers. Female observers, however, seem to generate a
systematic bias. The change parameter of η1 = -.35 [-.25,-.45] indicates that the difficulty
parameters for female observers are generally lower than the corresponding self-reports,
leading women sooner to endorse the items of the S-GOLS. Compared to the corresponding
self-ratings, female observers tend to systematically overestimate the trait of generalized
opinion leadership.
Overall discussion
As noted by Borsboom (2006, p. 425), in contemporary psychological testing ”one
rarely encounters serious psychometric modeling endeavors”, although appropriate
approaches have been described for years. Instead, many psychologists continue to use
primarily various correlation techniques, but rarely explicate underlying response models
that relate observed scores to the theoretically assumed latent constructs. In this paper, we
used Rasch-type item response models, which specify a logistic function between item
responses and the latent trait, to construct a new personality test, a short form of the
Generalized Opinion Leadership scale (Wiesner, 2009). We demonstrated that a comparably
simple IRT model, the polytomous partial credit model (Masters, 1982), can be validly
fitted to questionnaire data as typically found in personality research.
IRT is not limited to the process of item selection, to create new assessment
instruments, but can effectively be used for in-depth psychometric research by evaluating

Evaluation of measurement
14
various psychometric properties of an assessment instrument in detail. Hence, in study II,
we quantified the amount of transient error of the S-GOLS, a form of systematic
measurement error that can distort single measurements of a construct through temporary
situational influences. By applying a linear extension of the partial credit model to analyze
retest designs, we modeled transient error as a trait change within a short time frame (cf.
Chmielewski & Watson, 2009). This approach is comparable to the assessment of an
instrument´s retest reliability in CTT. Within the IRT framework, however, the analysis of
transient error is not limited to the score level, but potentially could be addressed on the
item level as well. For the S-GOLS, transient error seemed to be a negligible factor that did
not distort the trait estimates considerably. Finally, in the third study, we demonstrated the
convergence of self-and observer-ratings of generalized opinion leadership. By applying the
LPCM, we provided evidence for marked sex differences in perceived opinion leadership.
For male observers, the assessment of GOL closely matched the corresponding self-reports.
Female observers, however, rated the trait systematically higher (as compared to the self-
reports). In line with a general leniency bias reported previously for women (McCrae &
Terracciano, 2005), it can be argued that women generally attribute more favorable
characteristics to their peers and thus attribute higher levels of generalized opinion
leadership to others.
In conclusion, the presented studies demonstrate the viability of item response
theory to evaluate different types of measurement precision of self-report scales, for
example, systematic measurement error or the convergence of traits over different
perspectives, as is frequently done in personality research. We acknowledge that the
application of the ordinary LPCM is subject to rather strict requirements and is only
applicable for an item set conforming to the PCM - an assumption often not tenable for tests
originally constructed according to CTT. For these cases, however, linear logistic models
with relaxed assumptions (Fischer, 1995) represent a flexible IRT approach to conduct

Evaluation of measurement
15
comparable psychometric analysis without the strict unidimensionality requirement
stipulated by the Rasch model.

Evaluation of measurement
16
References
Adams, R. J., Wu, M. L., & Carstensen, C. H. (2007). Application of multivariate Rasch
models in international large-scale educational assessments. In M. von Davier & C.
H. Carstensen (Eds.), Multivariate and mixture distribution Rasch models:
Extensions and applications (p. 217-280). New York: Springer.
Andersen, E. B. (1973). A goodness of fit test for the Rasch model. Psychometrika, 38,
123–140.
Andersen, E. B. (1995). Polytomous Rasch models and their estimation. In G. Fischer & I.
Molenaar (Eds.), Rasch models: Foundations, recent developments, and applications
(p. 271-292). New York: Springer.
Ansher, M., Weatherby, N., Kang, M., & Watson, T. (2009). Rasch calibration of a
unidimensional perfectionism inventory for sport. Psychology of Sport and Exercise,
10, 210-216.
Borsboom, D. (2006). The attack of the psychometricians. Psychometrika, 71, 425–440.
Boz, I., & Akbay, C. (2005). Factors influencing the adoption of maize in Kahramanmaras
province of Turkey. Agricultural Economics, 33, 431–440.
Butler, D., & Geis, F. (1990). Nonverbal affect responses to male and female leaders:
Implications for leadership evaluations. Journal of Personality and Social
Psychology, 58, 48–59.
Cattell, R. B. (1986). The psychometric properties of tests: Consistency, validity, and
efficiency. In R. B. Cattell and R. C. Johnson (Eds.), Functional psychological
testing (pp. 54-78). New York: Brunner/Mazel.
Chmielewski, M., & Watson, D. (2009). What is being assessed and why it matters: The
impact of transient error on trait research. Journal of Personality and Social
Psychology, 97, 186–202.
Evaluation of measurement
17
Daubman, K. A., Heatherington, L., & Ahn, A. (1992). Gender and the self-presentation of
academic achievement. Sex Roles, 27, 187–204.
Fischer, G. H. (1995). Linear logistic models for change. In G. H. Fischer & I. W. Molenaar
(Eds.), Rasch models: Foundations, recent developments, and applications (pp. 157–
180). New York: Springer.
Fischer, G. H., & Ponocny, I. (1994). An extension of the partial credit model with an
application to the measurement of change. Psychometrika, 59, 177–192.
Glas, C. A. W., & Verhelst, N. D. (1995). Tests of fit for polytomous Rasch models. In G. H.
Fischer & I. W. Molenaar (Eds.), Rasch models: Foundations, recent developments,
and applications (pp. 325–352). New York: Springer.
Goldin, C., & Rouse, C. (2000). Orchestrating impartiality: The impact of ”blind”
auditions on female musicians. American Economic Review, 90, 715–741.
Hofstee, W. K. B. (1994). Who should own the definition of personality? European Journal
of Personality, 8, 149-162.
Iynegar, R., Van den Bulte, C., & Valente, T. (2010). Opinion leadership and social
contagion in new product diffusion. Marketing Science.
Kubinger, K. D. (2005). Psychological test calibration using the Rasch model: Some critical
suggestions on traditional approaches. International Journal of Testing, 5, 377–394.
Kubinger, K. D. (2009). Applications of the linear logistic test model in psychometric
research. Educational and Psychological Measurement, 69, 232–244.
Mair, P., & Hatzinger, R. (2007). CML based estimation of extended Rasch models with the
eRm package in R. Psychology Science, 49, 26–43.
Masters, G. (1982). A Rasch model for partial credit scoring. Psychometrika, 47, 149–174.
McCrae, R. R., & Terracciano, A. (2005). Universal features of personality traits from the
observer's perspective: Data from 50 cultures. Journal of Personality and Social
Psychology, 88, 547-561.

Evaluation of measurement
18
Meads, D. M., & Bentall, R. P. (2008). Rasch analysis and item reduction of the hypomanic
personality scale. Personality and Individual Differences, 44, 1772–1783.
Reise, S. P., Ainsworth, A. T., & Haviland, M. G. (2005). Item response theory:
Fundamentals, applications, and promise in psychological research. Current
Directions in Psychological Science, 14, 95–101.
Reise, S. P., & Henson, J. M. (2003). A discussion of modern versus traditional
psychometrics as applied to personality assessment scales. Journal of Personality
Assessment, 81, 93–103.
Rogers, E. M. (2003). Diffusion of innovations. New York: Free Press.
Shoham, A., & Ruvio, A. (2008). Opinion leaders and followers: A replication and
extension. Psychology & Marketing, 25, 280–297.
Vazire, S., & Gosling, S. D. (2004). E-perceptions: Personality impressions based on
personal websites. Journal of Personality and Social Psychology, 87, 123-132.
Vishwanath, A. (2006). The effect of the number of opinion seekers and leaders on
technology attitudes and choices. Human Communication Research, 32, 322–350.
Wiesner, A. (2009). Opinion leadership and social influence in online environments.
Unpublished doctoral dissertation, University of Erlangen-Nurnberg.
Wright, B. D., & Linacre, J. M. (1994). Reasonable mean–square fit values. Rasch
Measurement Transactions, 8, 370.

Evaluation of measurement
19
Footnotes
1 Originally, Masters (1982) defined the PCM in terms of intersection parameters δij
that mark the location on the latent proficiency where the item characteristic curves intersect
as [ ]
[ ]∑ ∑
∑
= =
=
−
−==
im
l
l
j ijv
h
j ijvhXP
0 0
0
)(exp
)(exp)(
δθ
δθ. The reparameterization by Andersen (1995) in
equation 1 is easily derived by substituting ∑ =− h
j ij0δ with βij.
2 Due to normalization requirement, the effect parameter for the first category
difficulty of the first item has to be fixed to 0.

Table 1
Item statistics of the short Generalized Opinion Leadership Scale
Item M SD δ1 δ2 δ3 δ4 Outfit χ2(1575)
1. Among my friends and acquaintances, I often decide which issues are
current.
2.96 1.03 -1.89 .76 1.63 4.14 .91 1435
2. My friends and acquaintances often discuss subjects that I brought up. 3.11 .95 -2.68 .21 1.63 4.10 .95 1502
3. I usually succeed if I want to convince someone about something. 3.26 .92 -2.72 -.31 1.31 4.15 .89 1393
4. It is easy for me to influence other people. 2.96 1.01 -2.02 .70 1.73 4.22 .89 1401
5. I am often the one among my friends and acquaintances who approves
important decisions.
2.77 1.04 -1.50 1.18 2.01 4.26 .86 1354
6. I am often asked to make decisions for friends and acquaintances. 2.80 .99 -1.86 1.06 2.03 4.56 .85 1330
7. People in my social circle frequently act upon my advice. 3.01 .93 -2.57 .38 1.88 4.43 .87 1364
8. I have the impression that I am regarded by my friends and
acquaintances as a good source for tips and advice.
3.15 .96 -2.65 .15 1.51 4.03 .86 1356
9. I often use my persuasive powers during discussions to reach agreements
quickly.
3.07 .97 -2.67 .42 1.66 4.02 .88 1389
Notes. N = 1575. χ2.95(1575) = 1668. δj … Category thresholds, Outfit … Unweighted mean square error, χ2 … Item fit test statistic (Glas &
Verhelst, 1995).

Table 2
Results of Andersen´s likelihood-ratio tests for different partition criteria and samples
Partition criteria
Sex Mean age Random split
Sample N M SD Α χ2 df χ
2 df χ2 df
Study I:
Calibration Sample 1575 3.01 0.72 .89 47.84 35 35.53 35 24.96 35
Study II:
Time 1 560 2.93 0.56 .85 35.13 35 36.19 35 32.32 35
Time 2 560 2.95 0.55 .86 41.17 35 41.38 35 29.05 35
Study III:
Self-ratings 400 2.97 0.50 .78 33.41 17 29.44 17 19.66 17
Observer-ratings 400 3.09 0.53 .82 24.76 17 25.75 17 19.19 17
Notes. χ2.99(35) = 57.34, χ2
.99(17) = 33.41. α … Cronbach´s Alpha; Results for study III are based
upon a three-point response scale.

Evaluation of measurement
22
Table 3
Likelihood-ratio tests for various LPCMs
Change parameters
Model Parameters logL χ2LR df p(χ2
LR) η1 η2 η3 η4
Study II
0 72 8209.80
1 36 8223.71 27.82 35 .80 -.05
2 35 8224.80 29.99 36 .75
Study III
0 35 5316.42
1 21 5319.88 6.91 14 .94 .02 -.06 -.38* -.36*
2 18 5343.06 7.27 17 .98 -.35*
3 17 5343.95 55.06 18 < .001
Notes. logL … Log-likelihood of model, χ2LR … Likelihood ratio test statistic comparing the
model to the saturated model 0, df ... Degree of freedoms, η ... Basic parameter of the model.
Results for study III are based upon a three-point response scale.
* p < .05.

Evaluation of measurement
23
Figure Captions
Figure 1. Test information of the S-GOLS

Evaluation of measurement
24
Figure 1.


