
Running head: PHYSIOLOGICAL SIGNALS PREDICT CYBERSICKNESS 1
Use of physiological signals to predict cybersickness
Mark S. Dennison a, A. Zachary Wisti a, Michael D’Zmura a
a Department of Cognitive Sciences
University of California, Irvine 92627
Irvine, CA, USA
Correspondence:
Mark S. Dennison
2201 Social & Behavioral Sciences Gateway Building
Irvine, CA 92697-5100, USA
Phone: (562) 290 - 9437
E-mail: [email protected]
University of California, Irvine

Physiological signals predict cybersickness 2
Abstract
Cybersickness is a common and unpleasant side effect of virtual reality immersion. We measured
physiological changes that were experienced by seated subjects who interacted with a virtual environment
(VE) while viewing a display monitor or while using a head-mounted display (HMD). Comparing results
for these two conditions let us identify physiological consequences of HMD use. In both viewing
conditions, subjects rated the severity of their symptoms verbally and completed a post-immersion
cybersickness assessment questionnaire. In the HMD viewing condition but not in the display monitor
condition, verbal reports of cybersickness severity increased significantly relative to baseline. Half of the
subjects chose to exit the VE after six minutes of HMD use and reported feeling some nausea at that time.
We found that changes in stomach activity, blinking, and breathing can be used to estimate post-
immersion symptom scores, with R² values reaching as high as 0.75. These results suggest that HMD use
by seated subjects is strongly correlated with the development of cybersickness. Finally, a linear
discriminant analysis shows that physiological measures alone can be used to classify subject data as
belonging to the HMD or monitor viewing condition with an accuracy of 78%.
Keywords: Cybersickness, Virtual Reality, Head-Mounted Display, Autonomic Response,
Multisensory Integration

Physiological signals predict cybersickness 3
1. Introduction
Virtual reality technology lets users feel present in simulated VEs [1]. Modern computer graphics and
sonics provide near instantaneous updates of the audiovisual display in correspondence with rotations of
the viewer’s head and body to create a compelling experience. This technology has proven useful in
training simulations for the military [2], for medical procedures [3], and for the entertainment industry.
A side effect of virtual reality technology that has persisted throughout its existence is visually-
induced motion sickness, often referred to as simulator sickness or cybersickness. Symptoms include
vomiting, nausea, and lightheadedness [1]. Other related physiological changes include facial pallor and
sweating [4]. Research by Cobb and colleaues [5] indicates that within ten minutes of immersion in
virtual reality, 80% of participants show symptoms of cybersickness. Regan and Price [6] found that 60%
of subjects who were immersed in a VE for twenty minutes showed cybersickness symptoms. These
symptoms can last for up to five hours after exiting the VE [7]. While comfort has been increased by
certain improvements in virtual reality technology, like minimizing the lag between head movement and
visual display update and reducing HMD weight [8], sources of discomfort remain. Indeed, recent work
by Davis and colleagues [9] suggests that virtual reality users are more likely to experience cybersickness
as the realism of the environment is increased.
Although motion sickness symptoms are agreed upon [10, 11, 12, 13], a consensus on their
causes has yet to be reached. The notion that sensory mismatch can cause motion sickness is widely
accepted [12,14]. Sensory mismatch occurs when the brain’s predictions about upcoming sensory input
do not match those associated with expectations generated by prior experience. The severity of
cybersickness depends on the degree of sensory mismatch. The visual and vestibular systems are most
frequently responsible for generating sensory mismatches that causes motion sickness. The vestibular
system, which is sometimes referred to as the “sixth sense” [15], serves three main functions: to sense
motion and spatial orientation of the head, to maintain postural stability of the body [16–23], and to
stabilize fixation of the eyes as the head rotates to provide a stable image on the retina [24–27]. Yet the

Physiological signals predict cybersickness 4
visual system processes optic flow to provide estimates of how a person moves through an environment
[28].Thus the common scenario, in which a user remains stationary in reality while experiencing a visual
display that signals egomotion, creates a mismatch and induces sickness. A possible consequence of such
discomfort is that people avoid using virtual reality technology [29]. Cybersickness research is important
for the continued progress of the industry as well as for furthering our understanding of how the brain
integrates information from multiple senses.
Although a user’s subjective report is an easy and direct way to assess cybersickness, self-report
is problematic for two reasons. The first is that it requires the user to shift attention to how their body
feels, which may diminish immersion in the VE. The second reason is that self-report is subjective. In
consequence, responses are difficult to quantify accurately, although established surveys concerning
motion sickness do exist [30,31].
A more objective way to assess cybersickness is to record physiological changes caused by use of
virtual reality technology. Physiological indicators such as heart rate [32], respiration rate [33,34],
galvanic skin response (GSR) [32,35], electrogastrogram (EGG) [36–38], and skin pallor [4] have been
all shown to be related to or predictive of cybersickness.
This paper describes an experiment in which cybersickness is measured while users navigate
about a VE. Subjects viewed a VE using a display monitor or a head-mounted display (HMD). We
hypothesized that cybersickness would be caused by the sensory mismatch that is created when subjects
remain stationary in the real world but move around in the virtual world while wearing an HMD. Verbal
reports of cybersickness were collected alongside continuous records of several physiological measures.
Each subject participated in two VE viewing conditions: viewing the environment using a display
monitor, and viewing the environment using an HMD. By contrasting results found when viewing a
display monitor and those found when using an HMD, we can distinguish effects of arousal caused by
environment interaction from physiological effects associated with HMD use. Results show that
physiological measures differ significantly between display monitor and HMD viewing conditions and
can be used to estimate subjective reports of cybersickness.

Physiological signals predict cybersickness 5
2. Methods
2.1 Virtual Environment
Fig. 1. Screenshot from the level used in the experiment running on the Source Engine.
We chose a modified free-use level [39] running on the Source Engine (Valve Corporation) to be the
environment common to the two conditions: display monitor and HMD. A screenshot of the environment
is shown in Fig. 1. During the display monitor condition, subjects viewed the environment on a Samsung
S27A550H 27in LED display with a refresh rate of 60Hz and a resolution of 1920 x 1280 pixels. Subjects
sat approximately 57 cm away from the display, which provided a field of view of approximately 60° of
visual angle horizontally by 40° vertically. For the HMD condition, subjects wore an Oculus Rift (Oculus
VR, Development Kit 2). The HMD has a resolution of 960 x 1080 pixels per eye with a refresh rate of
75Hz. The field of view is 100° horizontal by 100° vertical; head orientation is sampled at a rate of 1000
samples per second.
2.2 Questionnaires
Subjects started the experiment by completing the Motion Sickness Susceptibility Questionnaire (MSSQ),
which was developed by Golding [40] to assess how susceptible a person is to motion sickness based on
their past experience. It has two subsections. The first, called the MSSQA, concerns childhood experience
of traveling and motion sickness before the age of 12. The second, called the MSSQB, concerns traveling
and motion sickness over the last ten years. The questionnaire asks how often the subject felt sick or
Physiological signals predict cybersickness 6
nauseated during different activities and is scored on a five point scale: 0 never, 1 rarely, 2 sometimes, 3
frequently, and 4 always [30]. The frequency of traveling in different vehicles is also tallied and used for
calculating a final susceptibility score (see [40]).
Subjects also filled out the Simulator Sickness Questionnaire (SSQ) which was developed by
Kennedy and colleagues [41]. The SSQ asks subjects to rate each of 16 symptoms on a 4 point scale: 0
absent, 1 slight, 2 moderate, and 3 severe. These ratings are used to generate scores on three sickness
subscales: Nausea, Oculomotor, and Disorientation. Subjects filled out the SSQ after completing the
display monitor condition and again after completing the HMD condition.
2.3 Procedure
All subjects completed the display monitor viewing condition before the HMD viewing condition. All
rested during a five minute break between conditions. Before recording physiological data, subjects were
shown how to move around the VE using an Xbox controller that was connected to the computer
controlling the VE. Subjects explored the VE freely during display monitor and HMD viewing sessions.
For each of the two conditions, baseline resting data were collected for two minutes while the subject
viewed the display and remained stationary in the VE. Subjects then moved around in the VE for ten
minutes. This period was followed by an additional two minutes devoted to collecting resting data.
Every two minutes, subjects were asked to rate verbally how they felt on a sickness scale: 1 no
symptoms; 2 mild symptoms, but no nausea; 3 mild nausea, and 4 moderate nausea [30]. Subjects were
told that, if at any time they felt too ill to continue, they were to inform the experimenter, who would help
them exit the VE immediately. Subjects who terminated the experiment early for this reason were asked
to rest before leaving the laboratory.
2.4 Physiological Recording
Physiological measures were recorded with a Biopac MP150 (BIOPAC Systems, Inc.). Signals were
recorded using modules for electrocardiogram (ECG), electrogastrogram (EGG), electrooculogram
(EOG), photoplethysmogram via pulse oximeter (PPG), respiratory effort, and galvanic skin response

Physiological signals predict cybersickness 7
(GSR). Each subject’s ECG was recorded using three Ag/AgCl 11mm surface electrodes (EL507,
BIOPAC Systems, Inc.) located approximately one inch below the left and right collarbone and
underneath the right ribcage below the costal margin, respectively. Each subject’s stomach contractions
were measured using EGG. The EGG was recorded using three Ag/AgCl 11mm electrodes located below
the left costal margin, two finger widths underneath the left costal margin, and below the right costal
margin, respectively. EOG was recorded using two Ag/AgCl 11mm electrodes above the left eyebrow and
1cm below the lower eyelid, respectively. Each subject’s pulse was measured using PPG. Recordings
were made at the volar surface of the distal phalanx of the 4th finger of the left hand. Respiratory effort
was measured with a sensor band wrapped around the subject’s chest approximately 5cm below the
armpits. GSR was recorded from two Ag/AgCl 11mm electrodes on the volar surface of the distal
phalanges of the 3rd and 5th fingers of the left hand, respectively. Ag/AgCl electrodes were peel-and-stick
disposable gel electrodes. GSR electrodes used a pre-applied conductive paste. Data were recorded
through the Acknowledge 4 (BIOPAC Systems, Inc.) software package and stored for offline analysis.
2.5 Physiological Analysis
Physiological data were acquired at a rate of 250 samples per second. Data were segmented offline into
seven epochs, each containing 30,000 samples or two minutes of data. These epochs corresponded to the
initial baseline period, ten minutes of VE interaction, and the final rest period, for both conditions.
EGG samples were bandpass filtered from 0.005 to 0.2 Hz to help assess faster-than-normal
stomach contraction activity (tachygastric activity, 4 – 9.5 cycles per minute (cpm)) and slower-than-
normal activity (bradygastric activity, ≤ 2 cpm). The signal was then spectrally decomposed using a Fast
Fourier Transform with a Hamming window to yield a frequency resolution of 0.5 cycles per minute. The
percentages of band power for tachygastric and bradygastric activity were computed by dividing power in
their respective frequency bands by the total power in the .005 to 0.2 Hz band.
The respiration signal was bandpass filtered to preserve energy in the frequency band 0.1 – 1 Hz.
We followed work by Kim and colleagues [32] in using a peak detection algorithm to determine the

Physiological signals predict cybersickness 8
number of breaths taken per minute. The PPG pulse signal was bandpass filtered from 0.1 – 10 Hz and
detrended to remove any piecewise polynomial trend. We also used a peak detection algorithm to identify
PPG peaks; these were used to measure amplitude changes due to vasodilation of the fingertip. The peak
detection algorithm was based on the Matlab function findpeaks and was set to find local peaks within a
sliding window whose length was defined after visual inspection of individual subject data. Because the
respiration signal can create EGG artifacts, the raw breath signal was used to visually remove
contaminated EGG segments. ECG samples were bandpass filtered from 0.5 – 30 Hz to remove non-
cardiac high frequency muscle activity [42]. A peak detection algorithm was used to determine average
beats per minute and the heart rate period. EOG data were bandpass filtered from 0.1 – 5 Hz to smooth
out artifacts from saccadic eye movements. The number of blinks per experiment epoch was computed
using a peak detection algorithm. Skin conductivity was measured in units of microsiemens and averaged
over each experimental epoch. These epochs were normalized by the baseline resting epoch to account for
individual differences in resting skin conductance. Normalization was performed by dividing the data
from all epochs by the data from the baseline epoch. Head rotation information that was provided by the
HMD in quaternion form was transformed into yaw, pitch, and roll measured in degrees. The standard
deviations of these measures were computed to quantify variability in head rotation away from a fixed
position.
2.6 Statistical Methods
We want to know whether there are significant differences in physiological measures found during
display monitor and HMD use and how these differences contribute to cybersickness. Verbal reports of
cybersickness were recorded every two minutes and summary sickness measures were recorded after each
of the two conditions using the SSQ. Physiological data were recorded continuously during both
conditions.
Physiological data were first examined using a 2 X 7 repeated measures ANOVA with display
(monitor or HMD) and time (Rest 2min, 0-2 min, 2-4 min, 4-6 min, 6-8 min, 9-10 min, Rest 2min) as
factors. Only data from the nine subjects who completed the experiment were submitted to the ANOVA.

Physiological signals predict cybersickness 9
Greenhouse-Geisser corrections were implemented when the assumption of sphericity was violated.
Second, we performed stepwise multiple linear regression analysis that used physiological data from 19
subjects to estimate the SSQ cybersickness ratings described in Section 2.1. Regression analysis made use
of normalized physiological data taken from the 2-4 minute epoch in the HMD viewing condition.
Finally, we assessed the reliability of physiological measures by using linear discriminant analysis (LDA)
to train a model to classify data from 18 subjects as originating from the display monitor or HMD
condition. LDA used physiological data taken from the two conditions’ 4-6 minute epochs.
2.7 Participants
Twenty individuals (14 men, 6 women) over the age of 18 participated in the study. None of the
participants reported any vestibular or neurological dysfunction. A modified version of the video game
questionnaire developed by Green and Bavelier [43] was administered to each subject. Questionnaire
results show that each subject in the present experiment had previous experience playing video games.
Informed consent was obtained prior to the experiment in accordance with protocol HS# 2014-1090,
approved by the Institutional Review Board at UC Irvine.
3. Results
In what follows, we first present ANOVA results which show how HMD viewing affects physiological
measures and subjective ratings of cybersickness. Second, we present the results of regression analyses
that were performed to estimate subjective ratings of cybersickness using physiological measures. Finally,
we use classification methods to show that physiological measures alone can be used to determine
whether or not a person was using an HMD in this experiment.
3.1 Comparison of physiological data in display monitor and HMD conditions
Data were aggregated across subjects and the seven experimental epochs. Data from the monitor viewing
and HMD conditions are plotted in gray and black, respectively. Error bars show the standard error of the
mean.

Physiological signals predict cybersickness 10
3.1.1 Verbal Motion Sickness Rating
Fig. 2. Plot of subject averages for verbally-reported sickness rating per epoch. Time epoch varies along the
horizontal axis while motion sickness rating varies along the vertical axis. The data clearly showed reported motion
sickness symptoms increased with time during HMD use compared to monitor viewing. Numeric ratings have verbal
labels described in Section 2.2.
Longer durations of HMD use were associated with reports of greater motion sickness (see Fig. 2). An
ANOVA indicates that there is a main effect of display F(1,7) = 27.323, p = .001, 𝜂𝑝2 = .796, and a main
effect of time epoch, F(6,42) = 13.494, p < .000, 𝜂𝑝2 = .658. A significant interaction effect is also found
between display type and time epoch, F(6,42) = 13.494, p < .000, 𝜂𝑝2 = .658. Follow-up comparisons
among motion sickness ratings reported during HMD use show that all motion sickness ratings during
time segments after the initial 0-2 minute interval are significantly greater than those reported during the
baseline period.
Descriptive statistics show that HMD-wearing subjects, on average, exited the experiment early,
between the 6-8 min and 8-10 min epochs (standard deviation σ = 1.432 min) and reported a mean
sickness rating of 3 (σ = 1.170) at that time. During the HMD condition, one subject chose to exit during
the 2-4 min epoch, five exited during the 4-6 min epoch, five exited during the 6-8 min epoch, and the
remaining nine completed the full ten minutes of VE interaction. These results show that the primary
manipulation worked. No motion sickness whatsoever was experienced by 19 of 20 subjects in the
display monitor viewing condition. Substantial motion sickness was experienced by all subjects as a result
of HMD use.
Physiological signals predict cybersickness 11
3.1.2 Electrogastrogram (EGG)
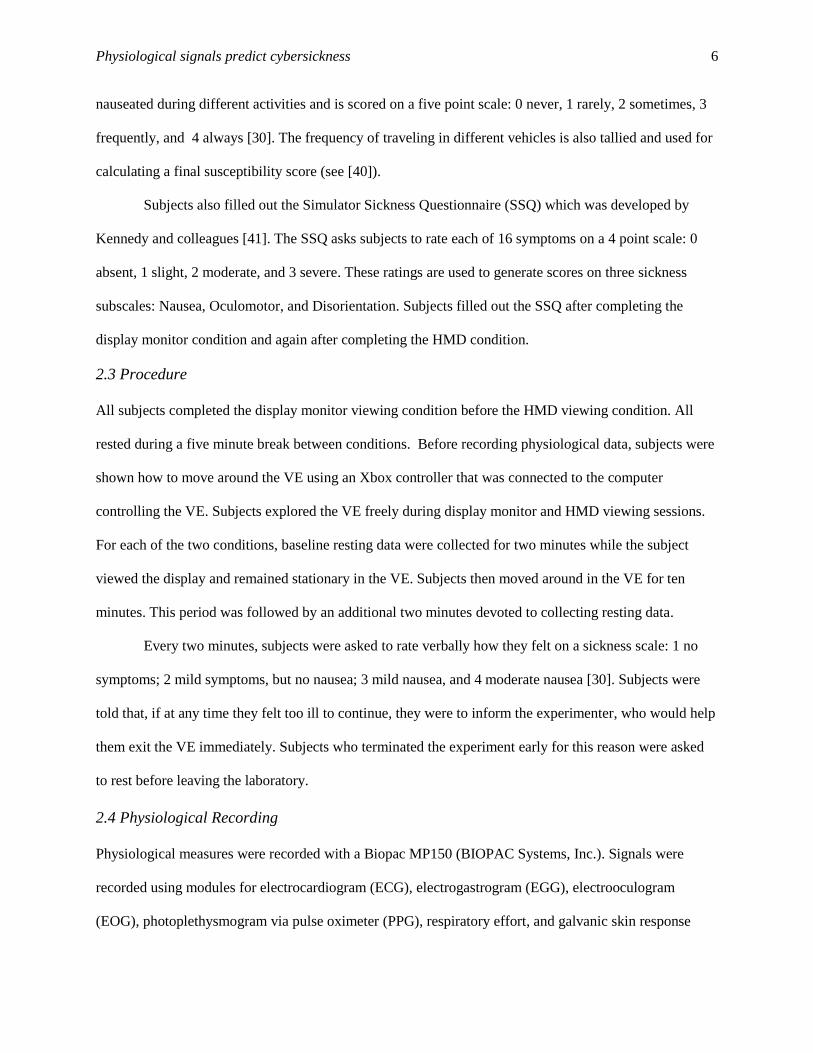
Fig. 3. A. Plot of raw EGG traces from one subject for minute-long periods during the monitor viewing condition
(gray) and the HMD viewing condition (black), respectively B. Power spectra of the data shown in A. C. Normalized
power in the bradygastric (0.5-2Hz) band and in the tachygastric (4.5-9 Hz) band respectively.
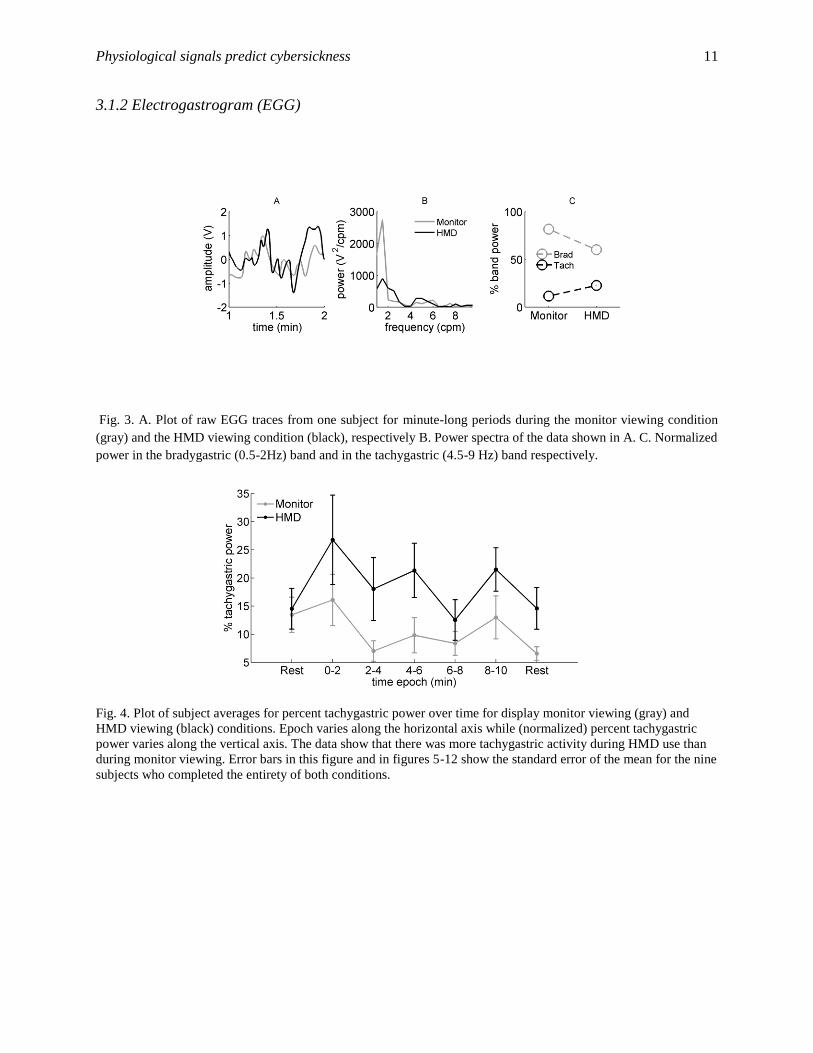
Fig. 4. Plot of subject averages for percent tachygastric power over time for display monitor viewing (gray) and
HMD viewing (black) conditions. Epoch varies along the horizontal axis while (normalized) percent tachygastric
power varies along the vertical axis. The data show that there was more tachygastric activity during HMD use than
during monitor viewing. Error bars in this figure and in figures 5-12 show the standard error of the mean for the nine
subjects who completed the entirety of both conditions.

Physiological signals predict cybersickness 12
Fig. 5. Plot of subject averages for percent bradygastric power over time. Time epoch varies along the horizontal
axis while (normalized) percent bradygastric power varies along the vertical axis. The data show that there was less
bradygastric activity during HMD use than during display monitor viewing.
Studies by Kim and colleagues [32] and Lien and colleagues [44] show that tachygastric band
power increases with motion sickness. Whether bradygastric stomach activity decreases with motion
sickness is less clear [36]. Fig 3 shows for a single subject a raw EGG data trace (Fig 3A), corresponding
power spectra (Fig 3B), and percent band power (Fig 3C). These illustrative data show that there is
somewhat more tachygastric activity and considerably less bradygastric activity in the HMD viewing
condition. Fig 4 shows how tachygastric band power varies with time epoch in display monitor and HMD
viewing conditions. An ANOVA for the tachygastric band data from the nine subjects who completed the
experiment indicates that there is a highly significant main effect of display F(1,7) = 12.235, p = .010, 𝜂𝑝2
= .636. Fig 5 shows how bradygastric band power varies with time epoch in display monitor and HMD
viewing conditions. An ANOVA for the bradygastric band data indicates that there is a highly significant
main effect of display F(1,7) = 14.320, p = .007, 𝜂𝑝2 = .672. We found no effect of time epoch in these
ANOVAs.

Physiological signals predict cybersickness 13
3.1.3 Electrooculogram (EOG)
Fig. 6. Plot of subject averages for number of blinks per time epoch. Time epoch varies along the horizontal axis
while number of blinks varies along the vertical axis. The data show that blinking increased with prolonged HMD
use.
More blinks per epoch are found during HMD use as shown in Fig. 6. An ANOVA indicates that there is
a main effect of display F(1,7) = 7.822, p = .027, 𝜂𝑝2 = .528. There is also a main effect of time epoch
F(6,42) = 5.017, p = .017, 𝜂𝑝2 = .417. A significant interaction effect shows longer HMD use results in
increasing number of blinks per epoch, F(6,42) = 6.019, p < .000, 𝜂𝑝2 = .462.
3.1.4 Galvanic skin response (GSR)
Fig. 7. Plot of subject averages for skin conductivity over. Time epoch varies along the horizontal axis while skin
conductivity (normalized) varies along the vertical axis. The data show skin conductivity increased with time and
suggest that there is less conductivity with HMD use than with monitor viewing.
An ANOVA indicates that there is a main effect of time epoch on skin conductivity F(6,42) = 8.200, p =
.005, 𝜂𝑝2 = .539 as shown in Fig. 7. There is a near significant interaction effect between display type and

Physiological signals predict cybersickness 14
time epoch F(6,42) = 3.587, p = .052, 𝜂𝑝2 = .339. Follow up comparisons find that all proceeding epochs
show increased skin conductivity compared to the initial rest period.
3.1.5 Electrocardiogram (ECG)
Fig. 8. Plot of subject averages for average time between heart beat peaks per epoch. Time epoch varies along the
horizontal axis while the average time between beat peaks varies along the vertical axis. The data showed decreased
time between beats with prolonged game playing and suggest that this duration is shorter during HMD use than
during monitor viewing.
Time between heart beat peaks is less during HMD use as shown in Fig. 8. An ANOVA indicates that
there is a near significant main effect of display F(1,7) = 5.219, p = .056, 𝜂𝑝2 = .427. There is a significant
main effect of time epoch F(6,42) = 5.672, p = .016, 𝜂𝑝2 = .448. Follow up comparisons show that there is
less time between heart beat peaks with longer game playing.
Fig. 9. Plot of subject averages for average heart beats per epoch. The horizontal axis denotes the times of each time
epoch and the vertical axis shows the number of beats per minute. The data showed that number of beats per epoch
increases during HMD viewing.

Physiological signals predict cybersickness 15
There are more beats per minute during HMD use (see Fig. 9). An ANOVA indicates that there is
a main effect of display type F (1,7) = 6.228, p = .041, 𝜂𝑝2 = .471. There is also a main effect of time
epoch F(6,42) = 6.460, p = .000, 𝜂𝑝2 = .480. Follow-up comparisons show that heart rate increases as time
spent in the VE increases.
3.1.6 Respiration
Fig. 10. Plot of subject averages for average breaths per epoch. Time epoch varies along the horizontal axis while
number of breaths varies along the vertical axis. The data showed breathing rate increased during game playing
compared to rest for both HMD use and monitor viewing.
Subjects take more breaths per segment during level interaction than at rest (see Fig. 10). An ANOVA
indicates that there is a main effect of time epoch, F(6,42) = 9.780, p = .000, 𝜂𝑝2 = .583. Follow-up
comparisons show a significant increase in breathing during gameplay and a subsequent decrease to the
baseline level during the final rest period.

Physiological signals predict cybersickness 16
3.1.7 Photoplethysmogram (PPG)
Fig. 11. Plot of subject averages for average pulse amplitude per epoch. Time epoch varies along the horizontal axis
while amplitude varies along the vertical axis. No change in pulse amplitude with time is evident for either viewing
condition.
No significant effects were found for changes in pulse amplitude during level interaction. A plot of
subject-averaged pulse amplitude per epoch for both conditions is shown in Fig. 11.
3.1.8 Head Rotations
Fig. 12. Plot of subject averages for yaw and pitch variation per epoch during HMD viewing. Time epoch varies
along the horizontal axis while standard deviation of head rotation varies along the vertical axis. The data showed
increased yaw and pitch variability during level interaction compared to rest.
Greater yaw and pitch variation occurred during VE navigation with the HMD compared to rest (see Fig.
12). An ANOVA for yaw indicates that there is a significant effect of time epoch F(6,42) = 8.225, p <

Physiological signals predict cybersickness 17
.000, 𝜂𝑝2 = .540. Follow-up comparisons found yaw variation during VE navigation differed significantly
only from that found during the rest period. An ANOVA for pitch indicates that there is a significant
effect of time epoch F(6,42) = 6.200, p < .000, 𝜂𝑝2 = .470. Follow-up comparisons found that yaw
variation during VE navigation differed significantly between the 0-2 min and 2-4 min gaming periods
and for all gaming conditions compared to the rest periods.
Summary ANOVA results are shown in Table 1. These results show clearly that physiological
measures differ significantly between the display monitor viewing and HMD viewing conditions.
Table 1
Summary of ANOVA results for the nine subjects who completed the display monitor viewing and HMD
viewing conditions of the experiment.
Type of Measure Summary of Significant Results
% EGG tachygastric power more activity during HMD viewing
% EGG bradygastric power less activity during HMD viewing
Blinks per epoch greater during HMD use and increased with time
Skin conductivity increased with time compared to baseline
N-N Peak difference less during HMD use and decreased significantly with time
Heart beats per epoch more beats per minute during HMD use
Breaths per epoch more breaths during VE interaction than rest
Sickness rating greater during HMD use and increased with time
Yaw and Pitch variation greater during VE interaction than rest
3.2 Regression Models for Cybersickness and Symptom Subscales
We wanted to see if physiological changes caused by HMD use can be used to estimate sickness scores on
the SSQ. First, we calculated two-tailed Pearson correlation coefficients between physiological measures
during the HMD condition, the MSSQ, and post-condition SSQ scores (see Table 2). The physiological
measures used were the differences between baseline measurements and those taken during the 2-4 min
epoch.
We found significant correlations between bradygastric power and the SSQ scores for
Cybersickness and Disorientation subscales (see Table 2). Significant correlations were also found
between mean blinks and the SSQ Oculomotor subscale score. A highly significant correlation between
childhood susceptibility (MSSQA) and SSQ Oculomotor subscale score was also found. We also found
that childhood motion susceptibility scores (MSSQA) are significantly correlated with the time at which

Physiological signals predict cybersickness 18
subjects exited the VE, r = -.459, p = .042, suggesting that those who report greater childhood
susceptibility to motion sickness succumb to HMD-related cybersickness earlier.
Table 2
Pearson correlations between physiological measures, MSSQ scores, and the SSQ. *p < .05, **p < .001
(two-tailed). Significant correlations were found between bradygastric power and SSQ Disorientation,
and SSQ Cybersickness. Significant correlations were also found between mean blinks and SSQ
Oculomotor scores. A highly significant correlation between childhood susceptibility (MSSQA) and SSQ
Oculomotor score was also found. N = 19.
Measure SSQ Nausea SSQ Oculomotor SSQ Disorientation SSQ Cybersickness
% Tach. Power .260 .001 .390 .277
% Brad. Power -.335 -.402 -.502* -.479*
Mean blinks .243 .497* .110 .309
Mean GSR .195 -.101 .131 .113
Mean Heart Rate
Interval -.05 .105 .082 .041
Mean Beats .092 -.073 .000 .021
Mean Breaths -.242 -.313 -.227 -.299
Mean Pulse Amp -.124 .223 .096 .048
Yaw Variation -.240 .029 -.357 -.245
Pitch Variation -.127 .023 -.241 -.148
Roll Variation .033 .104 -.145 -.011
MSSQA (child) .079 .611** .304 .344
MSSQB (adult) .180 .363 .218 .282
Second, we used regression to determine which physiological changes help to estimate cybersickness
symptom scores on the post-immersion SSQ. Only variables with correlations to SSQ scores that were
greater than 0.2 were submitted to the regression.
3.2.1 SSQ Cybersickness Score
Bradygastric power, number of breaths, and number of blinks showed adequate predictive power for
inclusion in the regression. It was found that increases in cybersickness symptoms can be estimated from
changes in bradygastric stomach activity and breathing. These two variables explained 37.4% (adjusted
R² = .296) of the variance, F(3,18) = 4.786, σest = 23.34, p = .023 (see Table 3).
Table 3
Stepwise Regression of Physiological Measures on SSQ Cybersickness Score. Criterion to enter = 0.2.
Measure β t Std. Error p
Bradygastric Power (%) -.541 -2.700 14.45 .016
Breaths -.385 -1.922 11.95 .073

Physiological signals predict cybersickness 19
3.2.2 SSQ Nausea Subscale Score
Bradygastric activity and number of breaths showed adequate predictive power for inclusion in the
regression. Increases in nausea symptoms were only weakly estimated from changes in bradygastric
stomach activity and breathing; these variables explained 20.1% (adjusted R² = .101) of the variance,
F(2,18) = 2.015, σest = 31.45, p = .116 (see Table 4).
Table 4
Stepwise Regression of Physiological Measures on SSQ Nausea Subscale Score. Criterion to enter = 0.2.
Measure β t Std. Error p
Bradygastric Power (%) -.383 -1.69 19.47 .110
Breaths -.303 -1.337 16.11 .200
3.2.3 SSQ Oculomotor Subscale Score
MSSQA score, blinks, pulse amplitude and number of breaths showed adequate predictive power for
inclusion in the regression. Increases in oculomotor symptoms were estimated from changes in blinking,
pulse amplitude, breathing, and the MSSQ childhood score; these variables explained 74.7% (adjusted R²
= .674) of the variance, F(4,18) = 10.310, σest = 9.79, p = .000 (see Table 5).
Table 5
Stepwise Regression of Physiological Measures on SSQ Oculomotor Subscale Score. Criterion to enter =
0.2.
Measure β t Std. Error p
MSSQA .517 3.802 .109 .002
Blinks .518 3.689 1.438 .002
Pulse Amplitude -.304 -2.209 3.280 .042
Breaths -.277 -2.029 5.007 .062
3.2.4 SSQ Disorientation Subscale Score
Bradygastric power ratio and number of breaths showed adequate predictive power for inclusion in the
regression. Increases in sickness symptoms were estimated from changes in slow wave stomach activity
and breathing; these variables explained 34.9% (adjusted R² = .268) of the variance, F(2,18) = 4.288, σest
= 35.40, p = .032. (see Table 6).
Table 6
Stepwise Regression of Physiological Measures on SSQ Disorientation Subscale Score. Criterion to enter

Physiological signals predict cybersickness 20
= 0.2.
Measure β t Std. Error p
Bradygastric Power (%) -.553 -2.704 21.91 .016
Breaths per epoch -.315 -1.540 18.13 .143
Summary results for the three regression models are shown in Table 7.
Table 7
Summary of variables and performance for regression models used in estimation of SSQ scores. Criterion
to enter = 0.2, N = 19.
SSQ Score Predicted Contributing Variables β Direction R² Adjusted R²
Cybersickness
% Bradygastric activity -
.374 .296 Breaths -
Nausea % Bradygastric activity -
.201 .101 Breaths -
Oculomotor
MSSQA +
.747 .674 Blinks +
Pulse -
Breaths -
Disorientation % Bradygastric activity -
.349 .268 Breaths -
3.3 Linear discriminant analysis (LDA) for subject condition classification
We used LDA to determine whether one can distinguish between display monitor viewing and HMD
viewing using differences in recorded physiological measures. The variables used included only
physiological measures (EGG, GSR, EOG, PPG, ECG, and breathing rate) from the middle epoch (4-6
min); verbal motion sickness rating data were not included.
Cross validation was performed by randomly selecting nine of eighteen total subjects to provide
data for training and using data from the remaining nine for testing. Each subject’s data was grouped
according to condition: monitor or HMD. The model attempted to classify which condition the test set
data belonged to. To examine test-retest reliability of the model, we ran this data selection and
classification process 1000 times. We found that average model performance was 77.8% (σ = 9.290) of
subject data samples classified correctly. These results show that the data from the display monitor and
HMD viewing conditions differ in a manner reliable enough to allow use of data from one group of
subjects to classify data from a different group.

Physiological signals predict cybersickness 21
4. Discussion
The primary aim of this study was to determine whether physiological changes caused by HMD use can
be used to predict cybersickness. It is known that HMD-based navigation of a VE while remaining seated
in the real world can cause cybersickness. This is because the visual information displayed by the HMD
conveys movement which conflicts with the vestibular signals experienced by the seated user
[12,14,38,45,46]. We recorded physiological signals while subjects navigated a VE using either a display
monitor or an HMD. Independent variables included display type (display monitor or HMD) and time of
measurement (epoch). Our dependent variables were physiological measures, verbal sickness reports, and
questionnaire scores.
We found that HMD use is associated with greater tachygastric stomach activity and with less
bradygastric stomach activity. Cheung and Vaitkus found that changes in stomach activity may reflect a
reaction by the autonomic nervous system to an uncomfortable environment [36]. Increased fast-wave
stomach contraction activity during optokinetic drum exposure has been reported previously by Hu and
colleagues [37] and during VE immersion by Kim and colleagues [32]. We found also that changes in
bradygastric stomach activity are negatively related to cybersickness scores on the SSQ. An opposite
result for bradygastric activity was found by Lien and colleagues [44], who studied motion sickness
caused by circular vection. Cheng and Vaitkus did not find this correlation due to within-subject
variability of stomach activity [36].
Subjects blinked more when they wore the HMD; the number of blinks increased with immersion
time. This effect was first reported by Kim and colleagues [32], who suggested that increased blinking
found during VE immersion is correlated with negative mood states as well as with fatigue. Our results
support this suggestion; the blinking behavior found in our study estimates ratings on the SSQ oculomotor
discomfort subscale which has questions concerning fatigue. The display monitor version of the task also
evoked less blinking activity than the HMD condition. Ponder [47] reported that less blinking activity
may be due to decreased eye strain or tension; this suggests that in our experiment the monitor viewing
condition was more comfortable than the HMD condition.

Physiological signals predict cybersickness 22
Although the previous studies by Kim and colleagues [32] and Hu and colleagues [37] reported
that skin conductance increased during navigation in VEs and similar tasks, we believe that the skin
conductance increase found in this study is due simply to increased arousal caused by interaction with the
VE and is not related to cybersickness. GSR increases substantially in both display monitor and HMD
viewing conditions (see Fig. 7). Increased skin conductivity due to increased arousal is well documented
[48,49]. Golding reported that measuring GSR from the forehead may provide a better estimate of
changes due to motion sickness, especially when subjects are sweaty [50]. Unfortunately our current
hardware setup allowed only for measurement of fingertip GSR.
The increased heart rate and decreased time between heart beats during HMD use suggests that
the sympathetic activity of the autonomic nervous system increases in response to an uncomfortable
environment. This effect is in agreement with many similar studies which have used virtual reality
technology [32,37,51,52], although the viability of heart rate changes in cybersickness prediction remains
unclear.
Greater respiratory effort was found for both conditions. This is indicated by increases in the
number of breaths taken per epoch and is thus likely due to increased arousal. An earlier study by Wang
and Perry [53] showed that video game interaction using a display monitor can elicit increased breathing
due to arousal. Denise and colleagues [33] found that controlled breathing during an oscillating motion
sickness task can attenuate the development of motion sickness. Our regression analysis shows that there
is a negative interaction between breathing rate and cybersickness symptom severity (β = -.541, see Table
3). This interaction suggests that individuals who tend to hold their breath during HMD use do not feel as
ill. Learning how to control one’s breathing may prove to be a good way to reduce the onset of
cybersickness. It is important to note that breathing rate alone is not highly correlated with SSQ scores; in
fact, variability in individual subject scores combined with other physiological measures allowed for good
estimation of SSQ scores.
Although more yaw and pitch variation were found to be greater during VE interaction than
during rest, these measures did not provide significant predictive power. Because our VE encouraged

Physiological signals predict cybersickness 23
users to look around actively, this increased variability is not surprising and demonstrates that users were
immersed in the VE.
Many subjects also reported an increase in their upper body temperature and feeling clammy
during the HMD viewing condition. Holmes and colleagues [4] found that changes in facial skin pallor
were associated with motion sickness, and work by Kim [32] and Bertin and colleagues [54] found related
sickness affects coupled with decreases in skin temperature. Yet in these studies skin temperature was
measured only on the fingertips and not the upper body. In our experiment, it may be the case that there
was uncontrolled variability in room temperature. Finally, we found no effect of viewing condition on
plethysmogram measures. One reason may be due to the assumption that subject arterial pressure was
constant throughout the experiment. Online measurement of arterial pressure may provide a better
estimate of cutaneous vascular tone, although others studies have reported PPG changes during virtual
immersion without the use of arterial pressure [32,35].
The experimental design in the present study let us distinguish physiological changes associated
with cybersickness from physiological changes due to arousal. A strength of this design is that we can
compare physiological changes and cybersickness ratings in monitor and HMD viewing conditions for the
same VE. Motion sickness ratings during the display monitor viewing condition show that there is no
motion sickness for 19 of the 20 subjects (see Fig 2). While it is certainly the case that playing a first
person shooter on a flat display can cause motion sickness, as shown by Bos and de Vries [55], we feel it
likely that the clear lack of cybersickness among our subjects while viewing the monitor is due to the
relatively small display size (60° x 40°) and prior gaming experience of our subjects (see Section 2.7). In
contrast, the average motion sickness score among our subjects in the HMD condition was a 3 (some
nausea, see Fig 2). There is a large difference in the cybersickness generated by the two viewing
conditions. We thus have an ideal testbed to determine which physiological measures can be used to
estimate subjective sickness scores.
A weakness in the design of the present study is that the HMD viewing condition always
followed the display monitor viewing condition. This opens up the possibility that measured differences

Physiological signals predict cybersickness 24
are due to condition order effects. While it is certainly true that there are effects of viewing the display
monitor on results found when using the HMD afterwards, we feel that order effects pale in significance
when compared to the large difference in cybersickness experienced in these two conditions. The time
between display monitor and HMD viewing conditions was effectively nine minutes, which can be
insufficient for allowing cybersickness to dissipate [56]. However, Golding and colleagues [57] found
that most subjects recovered from motion sickness after a period of five minutes in an optokinetic
stimulation experiment. Subjective reports in our experiment show that the display monitor viewing
condition did not produce any cybersickness whatsoever, with the exception of a single subject, while the
HMD condition did. In particular, 11 of the 20 subjects dropped out during the HMD viewing condition
because they felt too sick to continue. No subjects dropped out during the display monitor viewing
condition.
Finally, we do not know which aspects of HMD use elicit cybersickness. The cybersickness
found in the HMD condition may be due to vection from a larger field of view, to head movement
compensation from virtual movement, or to some combination of the preceding [1]. Results confirm our
expectation that navigating a VE while using an HMD induces cybersickness, while using a display
monitor does not. Verbal reports of cybersickness severity increase with prolonged HMD use but not
during prolonged viewing of the display monitor. Indeed, half of our subjects dropped out as the HMD
viewing condition progressed. Inclusion of both of these viewing conditions was critical because a study
by Drummond found that, in some individuals, watching a wide screen display can cause simulator
sickness [58]. Our data clearly show that the display monitor used in the present experiment did not
induce simulator sickness so allowing us to distinguish physiological effects due to arousal from those
associated more directly with cybersickness.
5. Conclusion
In summary, the results suggest that changes in physiological measures during use of an HMD to navigate
a VE can be used to estimate cybersickness severity. Discriminant analysis show that physiological data
from display monitor and HMD conditions can be distinguished when using data from half of the subjects

Physiological signals predict cybersickness 25
to classify data from the other half, so confirming that these changes in physiology are related to HMD
use. Changes in stomach activity, blinking behavior, and breathing suggest that the mismatch between
signals from the real and virtual worlds activate the autonomic nervous system as a response to an
uncomfortable situation. It is likely that individual differences in physiological measures and
cybersickness scores may account for lower variance explained by the regression models. This is an
important factor to consider for further research investigating detection of the onset of cybersickness. The
time course of EGG presents a problem for use with online estimation of cybersickness, suggesting the
use of alternative, faster measures such as electroencephalography (EEG). EEG has been used
successfully for cybersickness estimation in prior studies [32,59–63], but results have been mixed. A
combination of neurophysiological and non-physiological measures may be necessary to best estimate the
development of cybersickness during VE immersion.
6. Acknowledgments
Materials cost for this research was supported through internal funds.

Physiological signals predict cybersickness 26
7. Vitae
Mark S. Dennison received the B.A. degree with honors in psychology from the University of
California, Irvine in 2013 and the M.S. degree in cognitive neuroscience from the University of
California, Irvine in 2015. He is currently a graduate student working in the Cognitive NeuroSystems Lab
at UCI towards a Ph.D. in psychology with a concentration in cognitive neuroscience. His research
interests include virtual reality, multisensory integration, attention, and brain- computer interfaces.
A. Zachary Wisti received the B.S. degree with honors in neuroscience from the University of Michigan
in 2010 and a M.S. degree in cognitive neuroscience from the University of California, Irvine in
2014. He is currently a graduate student working in the Cognitive NeuroSystems Lab at UCI towards a
Ph.D. in psychology with a concentration in cognitive neuroscience. His research interests include brain-
computer interfaces, virtual reality, and embodiment.
Michael D'Zmura is a Professor of Cognitive Sciences at the University of California, Irvine. He
received his Ph.D. in psychology from the University of Rochester in 1990. His research interests include
vision, attention, hearing and speech, and virtual reality.

Physiological signals predict cybersickness 27
8. References
[1] J.J. LaViola, A discussion of cybersickness in virtual environments, ACM SIGCHI Bull. 32
(2000) 47–56. doi:10.1145/333329.333344.
[2] D. Wu, C.G. Courtney, B.J. Lance, S.S. Narayanan, M.E. Dawson, K.S. Oie, et al., Optimal
arousal identification and classification for affective computing using physiological signals:
Virtual reality stroop task, IEEE Trans. Affect. Comput. 1 (2010) 109–118. doi:10.1109/T-
AFFC.2010.12.
[3] A. Rizzo, T.D. Parsons, B. Lange, P. Kenny, J.G. Buckwalter, B. Rothbaum, et al., Virtual reality
goes to war: A brief review of the future of military behavioral healthcare, J. Clin. Psychol. Med.
Settings. 18 (2011) 176–187. doi:10.1007/s10880-011-9247-2.
[4] S.R. Holmes, S. King, J.R.R. Stott, S. Clemens, Facial skin pallor increases during motion
sickness, J. Psychophysiol. 16 (2002) 150–157. doi:10.1027//0269-8803.16.3.150.
[5] S.V.G. Cobb, S. Nichols, A. Ramsey, J.R. Wilson, Virtual Reality-Induced Symptoms and Effects
(VRISE), Presence Teleoperators Virtual Environ. 8 (1999) 169–186.
doi:10.1162/105474699566152.
[6] E.C. Regan, K.R. Price, The frequency of occurence and severity of side-effect of immersion
virtual reality, Aviat. Space. Environ. Med. (1994) 527–530. http://psycnet.apa.org/psycinfo/1994-
41790-001 (accessed April 10, 2015).
[7] E. Regan, A. Ramsey, Some side-effects of immersion virtual-reality: the results of four
immersions (Technical Report 94R012), 1994.
[8] N.I. Durlach, A.S. Mavor, Virtual reality: Scientific and technological challenges, National
Academies Press, 1994. doi:10.1016/S0740-8188(96)90047-X.
[9] S. Davis, K. Nesbitt, E. Nalivaiko, Comparing the onset of cybersickness using the Oculus Rift
and two virtual roller coasters, in: Proc. 11th Australas. Conf. Interact. Entertain. (IE 2015), 2015.
http://crpit.com/confpapers/CRPITV167Davis.pdf (accessed April 10, 2015).
[10] K.E. Money, Fifth Symposium on the Role of the Vestibular Organs in Space Exploration, in: 1st
ed., Physiology, 1973. http://hdl.handle.net/2060/19740010641 (accessed December 27, 2014).
[11] M. Treisman, Motion sickness: an evolutionary hypothesis, Science. 197 (1977) 493–495.
doi:10.1126/science.301659.
[12] J.T. Reason, Motion sickness adaptation: a neural mismatch model, J. R. Soc. Med. 71 (1978)
819–829.
http://www.pubmedcentral.nih.gov/articlerender.fcgi?artid=1436193&tool=pmcentrez&rendertype
=abstract.
[13] B.. Yates, A.. Miller, J.. Lucot, Physiological basis and pharmacology of motion sickness: an
update, Brain Res. Bull. 47 (1998) 395–406. doi:10.1016/S0361-9230(98)00092-6.

Physiological signals predict cybersickness 28
[14] J.T. Reason, J.J. Brand, Motion sickness, 7th ed., Academic Press, Oxford, England, 1975.
[15] A.M. Green, D.E. Angelaki, Internal models and neural computation in the vestibular system, Exp.
Brain Res. 200 (2010) 197–222. doi:10.1007/s00221-009-2054-4.
[16] J.T. Inglis, C.L. Shupert, F. Hlavacka, F.B. Horak, Effect of galvanic vestibular stimulation on
human postural responses during support surface translations, J. Neurophysiol. 73 (1995) 896–
901. http://jn.physiology.org/content/73/2/896.abstract (accessed December 27, 2014).
[17] J.H.J. Allum, F. Honegger, Interactions between vestibular and proprioceptive inputs triggering
and modulating human balance-correcting responses differ across muscles, Exp. Brain Res. 121
(1998) 478–494. doi:10.1007/s002210050484.
[18] J.J. Buchanan, F.B. Horak, Vestibular loss disrupts control of head and trunk on a sinusoidally
moving platform, J. Vestib. Res. 11 (2002) 371–389.
http://iospress.metapress.com/index/jjdx20mbmrluga4j.pdf (accessed December 27, 2014).
[19] F.B. Horak, G.M. Earhart, V. Dietz, Postural responses to combinations of head and body
displacements: Vestibular-somatosensory interactions, Exp. Brain Res. 141 (2001) 410–414.
doi:10.1007/s00221-001-0915-6.
[20] I. Cathers, B.L. Day, R.C. Fitzpatrick, Otolith and canal reflexes in human standing, J. Physiol.
563 (2005) 229–234. doi:10.1113/jphysiol.2004.079525.
[21] C. Maurer, T. Mergner, R.J. Peterka, Multisensory control of human upright stance, Exp. Brain
Res. 171 (2006) 231–250. doi:10.1007/s00221-005-0256-y.
[22] P.J. Stapley, L.H. Ting, C. Kuifu, D.G. Everaert, J.M. Macpherson, Bilateral vestibular loss leads
to active destabilization of balance during voluntary head turns in the standing cat, J.
Neurophysiol. 95 (2006) 3783–3797. doi:10.1152/jn.00034.2006.
[23] J.M. Macpherson, D.G. Everaert, P.J. Stapley, L.H. Ting, Bilateral vestibular loss in cats leads to
active destabilization of balance during pitch and roll rotations of the support surface, J.
Neurophysiol. 97 (2007) 4357–4367. doi:10.1152/jn.01338.2006.
[24] D. Angelaki, Eyes on target: what neurons must do for the vestibuloocular reflex during linear
motion, J. Neurophysiol. 92 (2004) 20–35. doi:10.1152/jn.00047.2004.
[25] G.R. Barnes, Visual-vestibular interaction in the control of head and eye movement: the role of
visual feedback and predictive mechanisms, Prog. Neurobiol. 41 (1993) 435–472.
doi:10.1016/0301-0082(93)90026-O.
[26] J.E. Roy, K.E. Cullen, Dissociating self-generated from passively applied head motion: neural
mechanisms in the vestibular nuclei., J. Neurosci. 24 (2004) 2102–11.
doi:10.1523/JNEUROSCI.3988-03.2004.
[27] T. Raphan, B. Cohen, The vestibulo-ocular reflex in three dimensions, Exp. Brain Res. 145 (2002)
1–27. doi:10.1007/s00221-002-1067-z.

Physiological signals predict cybersickness 29
[28] J.J. Gibson, The senses considered as peerceptual systems, xii, Houghton Mifflin, Oxford, 1966.
[29] S. Nichols, Physical Ergonomics Issues of Virtual Environment Use, Appl. Ergon. 30 (1999) 79–
90. http://www.sciencedirect.com/science/article/pii/S0003687098000453 (accessed April 10,
2015).
[30] M. Bagshaw, J.R.R. Stott, The desensitisation of chronically motion sick aircrew in the Royal Air
Force, Aviat. Sp. Environ. Med. (1985).
[31] R. Kennedy, N. Lane, Simulator sickness questionnaire: An enhanced method for quantifying
simulator sickness, Int. J. Aviat. Psychol. (1993).
http://www.tandfonline.com/doi/abs/10.1207/s15327108ijap0303_3 (accessed August 20, 2014).
[32] Y.Y. Kim, H.J. Kim, E.N. Kim, H.D. Ko, H.T. Kim, Characteristic changes in the physiological
components of cybersickness, Psychophysiology. 42 (2005) 616–625. doi:10.1007/s00234-005-
1388-2.
[33] P. Denise, A. Vouriot, H. Normand, J.F. Golding, M. a Gresty, Effect of temporal relationship
between respiration and body motion on motion sickness, Auton. Neurosci. 151 (2009) 142–146.
doi:10.1016/j.autneu.2009.06.007.
[34] N. Sugita, M. Yoshizawa, a. Tanaka, K. Abe, S. Chiba, T. Yambe, et al., Quantitative evaluation
of effects of visually-induced motion sickness based on causal coherence functions between blood
pressure and heart rate, Displays. 29 (2008) 167–175. doi:10.1016/j.displa.2007.09.017.
[35] M. Jäger, N. Gruber, R. Müri, U.P. Mosimann, T. Nef, Manipulations to reduce simulator-related
transient adverse health effects during simulated driving, Med. Biol. Eng. Comput. 52 (2014) 601–
610. doi:10.1007/s11517-014-1162-x.
[36] B. Cheung, P. Vaitkus, Perspectives of electrogastrography and motion sickness, Brain Res. Bull.
47 (1998) 421–431. doi:10.1016/S0361-9230(98)00095-1.
[37] S. Hu, W.F. Grant, R.M. Stern, K.L. Koch, Motion sickness severity and physiological correlates
during repeated exposures to a rotating optokinetic drum, Aviat. Sp. Environ. Med. 62 (1991)
308–314.
[38] C.M. Oman, Motion sickness: a synthesis and evaluation of the sensory conflict theory, Can. J.
Physiol. Pharmacol. 68 (1990) 294–303. doi:10.1139/y90-044.
[39] Riman21, Dirty Apartment, (2014). http://hl2.gamebanana.com/maps/177693.
[40] J.F. Golding, Motion sickness susceptibility questionnaire revised and its relationship to other
forms of sickness, Brain Res. Bull. 47 (1998) 507–516. doi:10.1016/S0361-9230(98)00091-4.
[41] R.S. Kennedy, N.E. Lane, K.S. Berbaum, M.G. Lilienthal, Simulator Sickness Questionnaire: An
Enhanced Method for Quantifying Simulator Sickness, Int. J. Aviat. Psychol. 3 (1993) 203–220.
doi:10.1207/s15327108ijap0303_3.

Physiological signals predict cybersickness 30
[42] C.T. Lin, S.W. Chunag, Y.C. Chen, L.W. Ko, S.F. Liang, T.P. Jung, EEG Effects of Motion
Sickness Induced in a Dynamic Virtual Reality Environment, Proc. IEEE EMBS Conf. (2007)
3872–3875.
[43] C.S. Green, D. Bavelier, Enumeration versus multiple object tracking: the case of action video
game players., Cognition. 101 (2006) 217–45. doi:10.1016/j.cognition.2005.10.004.
[44] H.-C. Lien, W.M. Sun, Y.-H. Chen, H. Kim, W. Hasler, C. Owyang, Effects of ginger on motion
sickness and gastric slow-wave dysrhythmias induced by circular vection, Am. J. Physiol. -
Gastrointest. Liver Physiol. 284 (2003) G481–G489. doi:10.1152/ajpgi.00164.2002.
[45] H. Akiduki, S. Nishiike, H. Watanabe, K. Matsuoka, T. Kubo, N. Takeda, Visual-vestibular
conflict induced by virtual reality in humans, Neurosci. Lett. 340 (2003) 197–200.
doi:10.1016/S0304-3940(03)00098-3.
[46] S. Nishiike, S. Okazaki, H. Watanabe, H. Akizuki, T. Imai, A. Uno, et al., The effect of visual-
vestibulosomatosensory conflict in- duced by virtual reality on postural stability in humans, J.
Med. Investig. 60 (2013) 236–239. doi:10.2152/jmi.60.236.
[47] E. Ponder, W.P. Kennedy, On the act of blinking, Q. J. Exp. Physiol. 18 (1927) 89–110.
doi:10.1113/expphysiol.1927.sp000433.
[48] C.W. Darrow, The galvanic skin reflex (sweating) and blood-pressure as preparatory and
facilitative functions, Psychol. Bull. 33 (1936) 73–94. doi:10.1037/h0051940.
[49] J.D. Montagu, E.M. Coles, Mechanism and measurement of the galvanic skin response, Psychol.
Bull. 65 (1966) 261–279. doi:10.1037/h0023204.
[50] J.F. Golding, Phasic skin conductance activity and motion sickness., Aviat. Space. Environ. Med.
63 (1992) 165–171.
[51] W.E. Chelen, M. Kabrisky, S.K. Rogers, Spectral analysis of the electroencephalographic response
to motion sickness, Aviat. Sp. Environ. Med. 64 (1993) 24–29.
http://europepmc.org/abstract/med/8424736 (accessed January 2, 2015).
[52] S. Ohyama, S. Nishiike, H. Watanabe, K. Matsuoka, H. Akizuki, N. Takeda, et al., Autonomic
responses during motion sickness induced by virtual reality, Auris Nasus Larynx. 34 (2007) 303–
306. doi:10.1016/j.anl.2007.01.002.
[53] X. Wang, A.C. Perry, Metabolic and physiologic responses to video game play in 7- to 10-year-
old boys, Arch. Pediatr. Adolesc. Med. 160 (2006) 411–5. doi:10.1001/archpedi.160.4.411.
[54] R.J. V Bertin, W. Graf, a Guillot, C. Collet, F. Vienne, S. Espié, Optokinetic or simulator sickness:
objective measurement and the rôle of visual-vestibular conflict situations, in: Driv. Simul. Conf.
North Am., 2005: pp. 280–293. https://www.nads-
sc.uiowa.edu/dscna/2005/papers/Objective_Measurement_Simulator_Sickness_Role_Visual.pdf.

Physiological signals predict cybersickness 31
[55] J.E. Bos, S.C. de Vries, M.L. van Emmerik, E.L. Groen, The effect of internal and external fields
of view on visually induced motion sickness., Appl. Ergon. 41 (2010) 516–21.
doi:10.1016/j.apergo.2009.11.007.
[56] J. Barrett, Side effects of virtual environments: A review of the literature, (2004) 1–58.
http://oai.dtic.mil/oai/oai?verb=getRecord&metadataPrefix=html&identifier=ADA426109
(accessed December 31, 2014).
[57] J.F. Golding, S. Arun, E. Wortley, K. Wotton-Hamrioui, S. Cousins, M. a. Gresty, Off-Vertical
Axis Rotation of the Visual Field and Nauseogenicity, Aviat. Space. Environ. Med. 80 (2009)
516–521. doi:10.3357/ASEM.2433.2009.
[58] P.D. Drummond, Triggers of motion sickness in migraine sufferers, Headache. 45 (2005) 653–
656. doi:10.1111/j.1526-4610.2005.05132.x.
[59] J.-R. Park, D.-W. Lim, S.-Y. Lee, H.-W. Lee, M.-H. Choi, S.-C. Chung, Long-term study of
simulator sickness: differences in EEG response due to individual sensitivity., Int. J. Neurosci. 118
(2008) 857–65. doi:10.1080/00207450701239459.
[60] Y.C. Chen, J.R. Duann, S.W. Chuang, C.L. Lin, L.W. Ko, T.P. Jung, et al., Spatial and temporal
EEG dynamics of motion sickness, Neuroimage. 49 (2010) 2862–2870.
doi:10.1016/j.neuroimage.2009.10.005.
[61] C. Wei, L. Ko, S. Chuang, T. Jung, S. Member, C. Lin, Genetic Feature Selection in EEG-Based
Motion Sickness Estimation, in: 2011 Int. Jt. Conf. Neural Networks, IEEE, San Jose, CA, 2011:
pp. 365–369. doi:10.1109/IJCNN.2011.6033244.
[62] L.W. Ko, C.S. Wei, T.P. Jung, C.T. Lin, Estimating the level of motion sickness based on EEG
spectra, Lect. Notes Comput. Sci. (including Subser. Lect. Notes Artif. Intell. Lect. Notes
Bioinformatics). 6780 LNAI (2011) 169–176. doi:10.1007/978-3-642-21852-1_21.
[63] C.T. Lin, S.F. Tsai, L.W. Ko, EEG-based learning system for online motion sickness level
estimation in a dynamic vehicle environment, IEEE Trans. Neural Networks Learn. Syst. 24
(2013) 1689–1700. doi:10.1109/TNNLS.2013.2275003.


