

Disclaimer
The following presentation is being made only to, and is only directed at, persons to whom such presentations may lawfully be communicated (“relevant persons”). Any person who is
not a relevant person should not act or rely on this presentation or its contents. This presentation does not constitute an offering of securities or otherwise constitute an invitation or inducement to any person to underwrite subscribe for or otherwise acquire securities in within the Company. The presentation also contains certain non-GAAP financial information. The Group’s
management believes these measures provide valuable additional information in understanding the performance of the Company’s businesses because they provide measures used by the Company to assess performance. Although these measures are important in the management of the business, they should not be viewed as replacements for, but rather as complementary to, the comparable GAAP measures.
Safaricom, M-PESA and Safaricom/M-PESA logos are trademarks of Safaricom Ltd. Other products and company names mentioned herein maybe the trademarks of their respective owners.
2

Contents
FY 2013 Highlights
FY 2013 Financial Review
Strategic Focus and Guidance
3

FY 2013 Highlights
• Strong commercial and financial performance across all segments and metrics
• Continued investment and innovation in network and services
• Best Network in Kenya program progressing well
• Nationwide metro fibre network build begun
• M-Shwari launched to enable access to micro deposits and loans
• Robust growth in Non-Voice service revenue
• Brand engagement and customer satisfaction continues to increase
• Great progress on our initiatives to transform lives, especially in financial inclusion
4

Delivering on key financial metrics 5
TOTAL REVENUE
VOICE REVENUE
NON-VOICE REVENUE
(SMS, DATA and M-PESA)
EBITDA
NET PROFIT BEFORE TAX
FREE CASH FLOW
PROPOSED DIVIDEND PER SHARE
+16% to Kshs 124.3bn
+13% to Kshs 77.7bn
+29% to Kshs 40.4bn
+31% to Kshs 49.2bn
+47% to Kshs 25.5bn
+55% to Kshs 14.5bn
+41% to Kshs 0.31

Contents
FY 2013 Highlights
FY 2013 Financial Review
Strategic Focus and Guidance
6

Delivering on strategy: Strong financial results
107.00
124.29
FY12 FY13
37.50
49.18
FY12 FY13
9.35
14.51
FY12 FY13
12.63
17.54
FY12 FY13
Total Revenue Kshs. Billion
EBITDA Kshs. Billion
Free Cash Flow Kshs. Billion
Net Income Kshs. Billion
+16.2% +31.2% +55.2% +38.9%
7
Increased usage for all services (Voice, SMS,
data and M-PESA) Increasing ARPUs across Voice, SMS and M-PESA
16% growth in revenue whilst
containing costs growth at 8% Robust EBITDA margin at 39.6% - up 4.5 ppt
Driven by improved EBITDA
and lower financing costs
Positive impact of EBITDA increase whilst holding capex steady

83.96 94.83
107.00
124.29
FY10 FY11 FY12 FY13
FY13 Revenue Kshs. Billion
65%
29%
6% FY12
Voice Non-Voice Devices
62%
33%
5% FY13
16.2%
8
107.00
124.29
FY12 Voice SMS Data M-PESA Devices FY13
8.70
Revenue Growth Kshs. Billion
4.97
2.36
1.83
Revenue Breakdown Kshs. Billion
• 16% growth in total revenue; with growth
across all service revenue streams
• Customer base now 19.4m customers (19.1m in FY 2012) following disconnection of 1.4m customers who did not meet the new customer registration requirements
• Successfully growing usage across all
service revenue streams
(0.57)
Strong revenue growth in the year

9
Service revenues: Growth across all products
0
20
40
60
80
100
120
FY10 FY11 FY12 FY13
64.58 63.5
68.96 77.66
5.19 7.54 7.77
10.13
7.56 11.78
16.87
21.84
2.89
4.54
5.22
6.31
0.08
0.84
1.37
2.11
Fixed data revenue
Mobile broadband revenue
M-PESA revenue
SMS revenue
Voice revenue

10 Lowest retail prices & MTR rate in sub-Saharan Africa
Country Prepay Retail Price per Minute
MTR
Kenya $0.04 $0.02
Angola $0.04
Ghana $0.06 $0.02
Rwanda $0.08 $0.07
Nigeria $0.08 $0.05
Gambia $0.09 $0.03
Uganda $0.10 $0.04
Tanzania $0.10 $0.02
Benin $0.14 $0.12
Namibia $0.14 $0.04
Burundi $0.14 $0.03
Mozambique $0.14 $0.08
Guinea Bissau $0.15
Congo $0.16
South Africa $0.16 $0.04
Country Prepay Retail Price per Minute
MTR
Burkina Faso $0.16 $0.10
Cote D'ivoire $0.17 $0.06
Malawi $0.17 $0.08
Botswana $0.18 $0.04
Central African Republic $0.19
Cameroon $0.19 $0.16
Mali $0.21
Togo $0.23 $0.11
Chad $0.25
Madagascar $0.30
Gabon $0.32 $0.06
Cape Verde $0.34
Lesotho $0.42 $0.06
Liberia $1.71 $0.15
Source: Mobile Africa Tariff Tracker 2013

Voice: Growth momentum sustained
64.58 63.50 68.96
77.66
FY10 FY11 FY12 FY13
Voice Revenue Kshs. Billion
15.79 17.18
19.07 19.42
FY10 FY11 FY12 FY13
Customers Million
12.6%
1.8%
11
• 13% growth in voice revenue
• Promoting brand recognition and customer loyalty o Revitalization of the brand
o Variety of promotions aimed at retention
• Improved distribution
o Airtime distribution across over 250,000
retail outlets
o 32% of airtime top-ups directly through M-PESA
• Our programme to ensure we have the best
network in Kenya has reduced dropped calls
and improved call quality considerably

Strong growth in Non-Voice service revenues
15.72
24.70
31.23
40.39
FY10 FY11 FY12 FY13
Non-Voice Revenue
Kshs. Billion
4% 6% 6% 7%
9% 12%
16% 18%
6% 8% 7% 8%
19%
26% 29% 33%
0%
5%
10%
15%
20%
25%
30%
35%
FY10 FY11 FY12 FY13
Mobile & FixedData M-PESA SMS Total Non-Voice Revenue
Mobile Data/M-PESA/SMS Contribution to Total Revenue
29.3%
12
• Non-Voice revenue grew 29% - now 33% of total
revenue
• Driven by increased customers and increased usage. Revenue growth of: • M-PESA +29%
• SMS +30%
• Mobile data +21%
• Fixed service +54%

M-PESA: Major Non-Voice revenue driver
7.56
11.78
16.87
21.84
FY10 FY11 FY12 FY13
M-PESA Revenue Kshs. Billion
9.48
13.80 14.91
17.11
FY10 FY11 FY12 FY13
M-PESA Customers Million
29.5%
14.8%
13
• 29.5% growth in M-PESA revenue, driven by
• Increase in 30 day active users to 10.5m
• Increase in number of transactions
• Contributes 18% of total revenue
• 26,000 M-PESA agents added in the year; now 65,547 M-PESA agents
• 10% excise duty introduced through the Finance Act of 2012; effective February 2013
Kshs 522bn* payments transacted
between customers within M-PESA
Kshs 444bn*
deposited into
M-PESA via
agents
Kshs 390bn*
withdrawn from
M-PESA via
agents
* Oct. 2012 -Mar. 2013

Data: Customers and usage drive growth
2.98
5.37
6.59
8.42
FY10 FY11 FY12 FY13
Mobile Data & Fixed Service Revenue Kshs. Billion
27.8%
14
• 28% growth in mobile data and fixed service
revenue
• 30 day active mobile data users grew 57% to 7.1m – now 37% of our customer base
• Usage per customer increased by 1%, while price per MB declined by 28%
• 12% increase in fixed data customers to 6,731 • Prices of data enabled handsets and devices
declining
2.64
3.48 4.55
7.13
FY10 FY11 FY12 FY13
30-day active Data Customers Million
56.7%

Sustained ARPU growth
Kshs. Kshs. Kshs. Kshs. Kshs.
Mobile Broadband SMS Voice Service ARPU M-PESA
FY12 FY13
96
117
FY12 FY13
102
90
FY12 FY13
319 337
FY12 FY13
462 507
FY12 FY13
36
44
15
Loyal customer base benefiting from positive promotions
Increased in active customers
Increased
transactions per active customer
Reduced pricing diluted ARPU, but attracted growth in customer
numbers by 57%
New SMS bundles driving usage
10% increase Includes fixed line ARPU of
Kshs 26,584
* Voice, SMS and Service ARPU are calculated based on total customers
* M-PESA and Mobile Broadband ARPUs are calculated based on total M-PESA and Mobile Broadband customers
respectively

FY10 FY11 FY12 FY13
28.5 37.2
43.5 46.3
Direct cost control improves contribution margin FY Direct Costs
Kshs. billion
16
124.29
106.91
(6.70)
(5.37)
(5.31)
(17.40)
(11.48)
FY Direct Costs Breakdown
Kshs. billion
• 6% increase in direct costs , compared to a 16% increase in total revenue
• Contribution margin increased to 62.8%
up 3.4 ppt
• Cost savings in: • Interconnect costs • Acquisition costs • Handset costs • Spectrum management
• Top-up card production costs
* Other costs relate to SIM cards, top-up cards, VAS billing, bad debts
and license fees costs
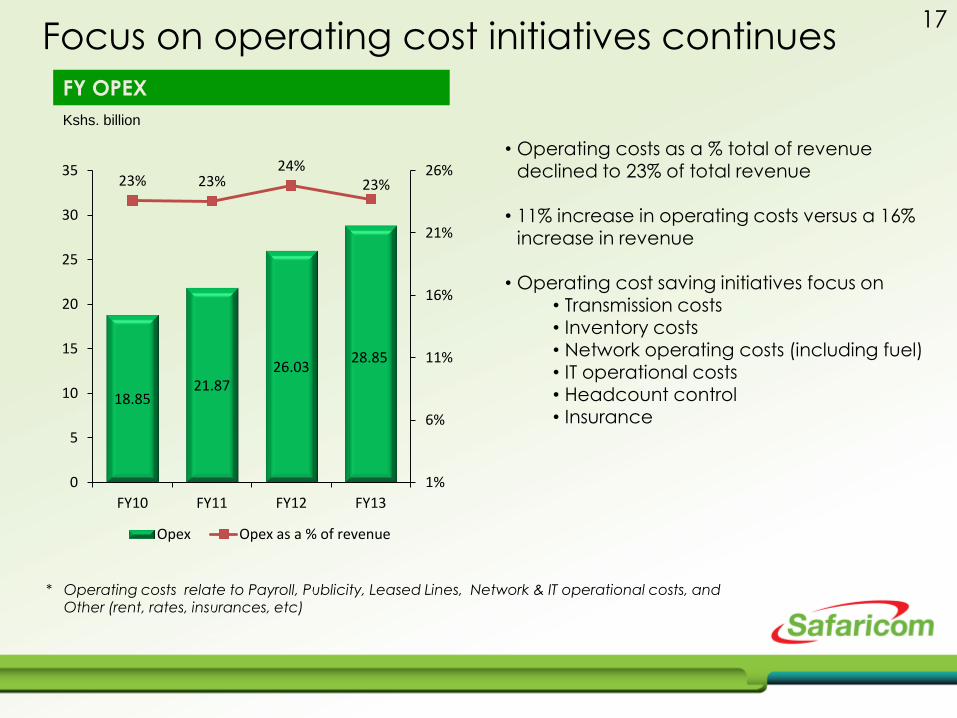
Focus on operating cost initiatives continues
FY OPEX
Kshs. billion
17
• Operating costs as a % total of revenue declined to 23% of total revenue
• 11% increase in operating costs versus a 16%
increase in revenue
• Operating cost saving initiatives focus on • Transmission costs • Inventory costs • Network operating costs (including fuel)
• IT operational costs • Headcount control • Insurance
* Operating costs relate to Payroll, Publicity, Leased Lines, Network & IT operational costs, and Other (rent, rates, insurances, etc)
18.85 21.87
26.03 28.85
23% 23% 24%
23%
1%
6%
11%
16%
21%
26%
0
5
10
15
20
25
30
35
FY10 FY11 FY12 FY13
Opex Opex as a % of revenue

Strong growth in EBITDA
• 31% growth in FY EBITDA to Kshs 49.2bn
• FY EBITDA margin improves 4.5 ppt to 39.6%
• 2nd half EBITDA traditionally stronger, except for FY11 price war
H1/H2 EBITDA
0
5
10
15
20
25
30
H1 FY10 H2 FY10 H1 FY11 H2 FY11 H1 FY12 H2 FY12 H1 FY13 H2 FY13
16.5
20.1 18.8
16.9 14.8
22.7 22.3
26.9
Kshs. Billion
18

Largest & Fastest Network in Kenya
Largest 2G and 3G network:
• 2,905 2G enabled base stations
• 1,604 3G enabled base stations
• 689 3G sites at 21mbps • 155 3G sites at 42mbps
Base Stations CAPEX
FY10 FY11 FY12 FY13
2162
2501 2690
2905
607
1140
1439 1604
140 193 187 203
Total (inc 2G) 3G Wimax
Kshs. Billion
17.44
25.48 25.28 24.88
21%
27%
24%
20%
0%
5%
10%
15%
20%
25%
30%
0
5
10
15
20
25
30
FY10 FY11 FY12 FY13
CAPEX CAPEX Intensity
19
Capital expenditure of Kshs 24.9bn invested in:
• Site roll out • RAN modernization and Radio optimization • Transmission improvements • Energy efficiency

49.18
14.51
EBITDA Interestpaid
Tax paid Capex Workingcapital
Othercapitalmvmts
Free cashflow
(1.45)
(2.44)
(24.88)
(5.98)
0.08
Improved cash generation 20
Kshs. billion
12.00
5.23
(15.00)
8.23
Kshs. billion
FY Free Cash Flow FY Net Debt
• Improved Free Cash Flow from Kshs 9.35bn in
FY12 to Kshs 14.51bn.
• Driven by improved EBITDA and steady capex
* Free Cash Flow excludes Mergers & Acquisitions activity
• Kshs 8bn corporate bond at 12.25%, expires Nov
2014
• Kshs 4bn corporate bond at 7.75%, expires Dec
2015
• Bank borrowing range between 1% and 1.5%
above 91/182 day T-bill rate

Key Financials:
21
FY 12 FY 13 VARIANCE H2 FY12 H2 FY13 VARIANCE
Voice revenue 68.96 77.66 12.6% 37.47 40.24 7.4%
Messaging revenue 7.77 10.13 30.4% 4.12 5.86 42.2%
Mobile data revenue 5.22 6.31 20.9% 2.77 3.34 20.6%
Fixed service revenue 1.37 2.11 54.0% 0.74 1.10 48.6%
M-Pesa revenue 16.87 21.84 29.5% 8.99 11.41 26.9%
Service Revenue 100.19 118.05 17.8% 54.09 61.95 14.5%
Handset revenue 5.94 4.93 -17.0% 2.83 2.50 -11.7%
Acquisition and other revenue 0.87 1.31 50.6% 0.45 0.72 60.0%
Total Revenue 107.00 124.29 16.2% 57.37 65.17 13.6%
Direct costs (43.47) (46.26) -6.4% (21.50) (23.86) -11.0%
Contribution margin 63.53 78.03 22.8% 35.87 41.31 15.2%
Contribution margin % 59.4% 62.8% 3.4% 62.5% 63.4% 0.9%
Operating costs (26.03) (28.85) -10.8% (13.13) (14.42) -9.8%
Operating costs % total revenue 24.3% 23.2% -1.1% 22.9% 22.1% -0.8%
EBITDA 37.50 49.18 31.1% 22.74 26.89 18.2%
EBITDA margin % 35.0% 39.6% 4.5% 39.6% 41.3% 1.6%
Depreciation & amortisation (17.35) (22.08) -27.3% (8.62) (12.17) -41.2%
Net Financing cost (2.78) (1.65) 40.6% (2.14) (0.78) 63.6%
Taxation (4.74) (7.91) -66.9% (3.36) (4.17) -24.1%
Net Income 12.63 17.54 38.9% 8.62 9.77 13.3%
Earnings per share 0.32 0.44 37.5% 0.22 0.25 13.6%
Free Cash Flow 9.35 14.51 55.2% 10.09 9.37 -7.1%
Recommended Dividend 8.80 12.40 40.9%
Dividend per share 0.22 0.31 40.9%

Contents
FY 2013 Highlights
FY 2013 Financial Review
Strategic Focus and Guidance
22

Strategy Overview 23
Our focus for the next 12 months is to:
• Deliver the Best Network in Kenya program
• Grow Mobile and Fixed Data
• Deepen financial inclusion
• Retain and reward our loyal customer base
• Encourage further innovation

24
Deliver the Best Network in Kenya What we have achieved:
• Modernization of 80% of the planned cell sites
complete
• Call drops have reduced by 25%
• Network downtime reduced by 66% to below
20 min per week
Top priority items in pipeline:
• Complete network modernization in 6 key
cities
• Increase population coverage in 2G and 3G
• Fibre rollout to 40% of sites in Nairobi
• Improve on network quality and coverage

25 Grow Mobile and Fixed Data
What we have achieved:
• Increased data customers by 57% to 7.1m
• Increased the number of 3G devices on the
network to 2.3m, of which 1.2m are smartphones
• Introduced Sambaza Internet
• Data bundles purchase via M-PESA
Top priority items in pipeline:
• Lay fibre to our metro base stations
• Keep providing lower priced 3G smartphones
• Encourage developers to create relevant local
content
• Ensure seamless purchase of data bundles

26
Deepen financial inclusion using M-PESA What we have achieved:
• Recruited 26,000 new M-PESA agents in the year
• Increased the 30 day active customer base to 10.5m
• Improved system availability substantially
• Launched M-Shwari, currently 1.2m active customers
Top priority items in pipeline:
• Improved M-PESA system availability
• System redundancy across geography
• Embark on 18 month project to replace existing M-PESA
system
• Grow retail and e-commerce payments

27
Retain market leadership
64.5% 16.9%
8.1% 10.5%
Subscriber market share-Dec 2012
Safaricom Airtel Orange Yu Essar
72.6%
11.7%
9.1% 6.7%
Mobile Data market share-Dec 2012
Safaricom Airtel Orange Yu Essar
77.5%
12.5%
8.6% 1.4%
Voice traffic market share-Dec 2012
Safaricom Airtel Orange Yu Essar
93.7% 4.5%
1.2% 0.6%
SMS market share-Dec 2012
Safaricom Airtel Orange Yu Essar
Source: Communication Commission of Kenya (CCK)

28
Encourage further innovation What we have achieved:
• Launched M-Shwari to provide interest bearing
deposits and micro-loans
• Launched m-health, e-learning and m-agriculture
services
• Launched m-Kopa solar lighting : pay as you go
• Launched the Safaricom AppStar competition to drive
and reward innovations in mobile applications
• Launched a Contacts back-up service

FY 2014 Guidance
Free Cash Flow:
Expected to be in the range of Kshs 15.5 bn to Kshs 17.5bn
29

FY 2013 Highlights
• Strong commercial and financial performance across all segments and metrics
• Continued investment and innovation in network and services
• Best Network in Kenya program progressing well
• Nationwide metro fibre network build begun
• M-Shwari launched to enable access to micro deposits and loans
• Robust growth in non-voice service revenue
• Brand engagement and customer satisfaction continues to increase
• Great progress on our initiatives to transform lives, especially in financial inclusion
30

Q&A


