
SAFARICOM LIMITED
ANNUAL REPORT2O15
wqsqw

01 / HIGHLIGHTS0104 - 05 Performance at a Glance
06 - 9 Chairman’s Statement
10 - 13 CEO’s Statement
16 - 17 What We Do
18 The Value We Create
19 Our Strategic Priorities
20 How We are Managed
22 - 23 Who Governs Us
24 - 25 Who Leads Us
26 - 31 Corporate Governance Statement
32 - 35 Risk Management
/ HIGHLIGHTS
/ BUSINESS REVIEW
81%Mobile phone penetration in Kenya (Communications Authority of Kenya)
Our Coverage
72%2G
27%3G
27%3G
Population
92%2G
69%3G
69%3G
Kenyan landmass
02

1
03
05
75 Directors’ Report
76 Statement of Directors’ Responsibilities
77 Report of The Independent Auditor
78 Consolidated Statement of Comprehensive Income
79 Consolidated Statement of Financial Position
80 Company Statement of Financial Position
81 - 82 Consolidated Statement of Changes in Equity
83 Consolidated Statement of Cash Flows
84 - 132 Notes
133 Shareholding Information
136 -137 Notice of The Annual General Meeting
138 -143 Directors and Senior Leadership Team
144 Corporate Information
145 Proxy Form
/ STRATEGIC REVIEW
/ ADDITIONAL INFORMATION
38 - 40 Delighting Our Customers
41 Democratising Data
42 - 43 Best Network in Kenya
44 - 45 Deepening Financial Inclusion
46 - 47 Partner of Choice for Business
48 - 53 Staying Ahead of the Curve
54 - 55 Growing Youth Appeal
56 - 59 Brand Assets
60 - 67 Social Impact
68 - 71 Sustainability
04 / FINANCIAL REVIEW
01 / HIGHLIGHTS0104 - 05 Performance at a Glance
06 - 9 Chairman’s Statement
10 - 13 CEO’s Statement
16 - 17 What We Do
18 The Value We Create
19 Our Strategic Priorities
20 How We are Managed
22 - 23 Who Governs Us
24 - 25 Who Leads Us
26 - 31 Corporate Governance Statement
32 - 35 Risk Management
/ HIGHLIGHTS
/ BUSINESS REVIEW
81%Mobile phone penetration in Kenya (Communications Authority of Kenya)
Our Coverage
72%2G
27%3G
27%3G
Population
92%2G
69%3G
69%3G
Kenyan landmass
02

SAFARICOM ANNUAL REPORT 20152
01 / HIGHLIGHTS
Kenya’s first and only 4G (LTE)

SAFARICOM ANNUAL REPORT 20152
01 / HIGHLIGHTS
Kenya’s first and only 4G (LTE)
3
HIGHLIGHTS01

01 / HIGHLIGHTS
SAFARICOM ANNUAL REPORT 20154
PERFORMANCE AT A GLANCE01 / HIGHLIGHTS
FY 12
TOTAL REVENUE
FY 13
FY 14
FY 15
0 50 100 150 200
FY 12
VOICE REVENUE
FY 13
FY 14
FY 15
0 20 40 60 80 100
FY 12
M-PESA REVENUE
FY 13
FY 14
FY 15
0 10 20 30 40
FY 12
EBITDA
FY 13
FY 14
FY 15
0 20 40 60 80
FY 12
MOBILE DATA & FIXED SERVICE REVENUE
FY 13
FY 14
FY 15
0 5 10 15 20
FY 12
FREE CASH FLOW
FY 13
FY 14
FY 15
0 5 10 15 20 25 30
107.00
Kshs Billion
Kshs Billion
Kshs Billion Kshs Billion
Kshs Billion Kshs Billion
124.29
144.67
163.36
6.59
8.73
11.88
17.95
9.35
14.51
22.69
27.52
37.50
49.24
60.94
71.19
68.96
77.33
84.37
87.41
16.87
21.84
26.56
32.63
FY 12
MESSAGING REVENUE
FY 13
FY 14
FY 15
0 5 10 15 20Kshs Billion
7.77
10.15
13.62
15.63
FY 12
TOTAL SERVICE REVENUE
FY 13
FY 14
FY 15
0 50 100 150 200Kshs Billion
100.19
118.05
138.36
156.25
5
We continue to deliver the best service to our customers; one that has seen the Company rewarded with strong
commercial and financial performance.
FY 12
DIVIDEND
FY 13
FY 14
FY 15
0 5 10 15 20 25
8.80
12.40
25.64
18.83
FY 12
NUMBER OF BASE STATIONS
0 1000 2000 3000 4000
FY 13
FY 14
FY 15
Wimax
Wimax
Wimax
Wimax
187
203
203
195
FY 12
CUSTOMER NUMBERS
FY 13
FY 14
FY 15
0 5 10 15 20 25
19.07
19.42
21.57
23.35
Kshs Billion
Million
1,439
3G 1,604
3G 1,847
3G 1,943
Total (2G + 3G) 2,690
3G
Total (2G + 3G) 2,905
Total (2G + 3G) 3,140
Total (2G + 3G) 3,382
4G 236

SAFARICOM ANNUAL REPORT 20156
01 / HIGHLIGHTS
The ICT sector realised a growth of 13.4% in 2014. The sector now contributes an estimated 8.4% to the GDP and, with well guided policies, the sector is estimated to attain the Vision 2030 target of contributing 10% to the country’s GDP by 2017.
As the chairman of the Board it gives me great pleasure to take this opportunity
to update you on the performance, the competitive and regulatory
environment and economic factors affecting our business.
In the period under review, we continued with the execution of our strategy
which enabled us to continue to deliver unmatched customer experience
which in turn led to strong results and sustainable shareholder returns.
Kenya’s economy remained fairly stable growing at 5.3%, a slight reduction
compared to 5.7% in 2013. The performance was supported by a reduction in
energy prices and increased government spending on major projects by both
the national and the devolved Governments.
The ICT sector realised a growth of 13.4% in 2014. The sector now contributes
an estimated 8.4% to the GDP and, with well guided policies, the sector is
estimated to attain the Vision 2030 target of contributing 10% to the country’s
GDP by 2017.
There is no doubt that a significant part of this growth is attributable to the
mobile telecommunications sector where Safaricom and other players continue
to contribute substantial gains to the economy.
In the year, interest rates remained stable with the Central Bank of Kenya
maintaining the Central Bank Rate (CBR) at 8.5% and a modest increase in
inflation by 1.2 ppt to 6.9%.
On the foreign currency exchange market, the Kenya shilling weakened against
the dollar, a factor attributable to the declines in dollar inflows mainly from the
tourism sector.
The Board recommended a dividend of 64 cents per share, totalling Kshs 25.64 billion, an increase of 36%. This is once again the largest dividend in Kenyan history.
Our superior capabilities continue to enable us to support our key stakeholders in their endeavour to improve the lives of our customers and the people of Kenya as a whole.
Our commitment to continue transforming lives remains strong and with our strategy in place, we are confident that we shall continue creating value for our shareholders and customers.
CHAIRMAN’S STATEMENT01 / HIGHLIGHTS
7
MR. NICHOLAS NGANGACHAIRMAN
KEY REGULATORY HIGHLIGHTSRenewal of Operating LicenceThe regulatory environment remains an area of
importance to our operations. As noted during our half
year results, our operating licence was renewed in July
last year for a further ten-year period.
Acquisition of Additional SpectrumWe also acquired additional spectrum after concluding
the purchase of Essar Telecom’s assets. This has helped us
continue improving our network coverage and provide
quality services to our customers.
Mobile Termination Rates (MTR)In the same period, there was a reduction in the Mobile
Termination Rates (MTR) from Kshs 1.15 to Kshs 0.99 with
effect from July 2014 in line with glide path that the
Communications Authority of Kenya (CA) prescribed in
2010 that saw the reduction of the MTR from Kshs 4.42 in
2010 to a final rate of Kshs 0.99 in 2014.
National Police Surveillance ProjectSafaricom was contracted by the Government through
the Ministry of Interior and National Coordination to
build the National Police Surveillance, Communication
and Control System that introduces a technology
driven approach to Police work. This will go a long way
in enhancing security and creating a better business
operating environment.
Universal Service Fund (USF)The CA implemented the Universal Service Fund (USF)
and Safaricom is currently paying the Universal Service
Levy as required. Meanwhile, Safaricom and other
operators through the industry lobby groups, Kenya
Telecommunications Network Operators (KTNO) and
Telecommunications Operators Service Providers
(TESPOK), are engaging the CA on various matters with
respect to the operationalisation of the USF.
CORPORATE GOVERNANCEDuring the year there was a change in the composition
of the Board of Directors. Mr. Gianluca Ventura was
appointed to the Board as a non-executive Board
member, replacing Mr. Sunil Sood who resigned during
the year.
I welcome Mr. Gianluca to the Board and wish to sincerely
thank Mr. Sood for his contribution during the year.
LOOKING FORWARDThe financial year under review was a phenomenal year
for Safaricom, having continued to establish ourselves as
a leading telecom operator at the forefront of innovation
and transforming lives.
Telecommunications is becoming ever more present in
more areas of life. We are focused on continuing to lay
the foundation for new growth in all areas of our business,
exploit new opportunities as well as to strengthen and
diversify our existing product portfolio.
With the commitment of our employees, the continued
support of our investors, and the unwavering loyalty of the
millions of our customers, coupled with our understanding
of our customers’ needs, we shall continue to deliver
value to our stakeholders. Our commitment to continue
transforming lives remains strong and with our strategy in
place, we are confident that we shall continue creating
value for our shareholders.

SAFARICOM ANNUAL REPORT 20158
01 / HIGHLIGHTS
TAARIFA YA MWENYEKITI01 / HIGHLIGHTS
Sekta ya Teknolojia ya Habari na Mawasiliano, yaani ICT, ilishuhudia ukuaji wa 13.4% katika mwaka wa 2014. Hivi sasa Sekta hii inachangia 8.4% kwenye Jumla ya Pato la Taifa (GDP), na kukiwa na sera zilizo na mwongozo mzuri, sekta hii inatarajiwa kutimiza malengo ya Ruwaza ya 2030 ya kuweza kuchangia 10% kwenye Jumla ya Pato la Taifa (GDP) kufikia 2017.
Kama Mwenyekiti wa Bodi ya Wakurugenzi, nina furaha kubwa kuchukua fursa
hii kuwaarifu kuhusu matokeo, hali ya ushindani wa kibiashara na kanuni za
udhibiti pamoja na hali ya kiuchumi inayoathiri biashara yetu.
Katika kipindi cha mwaka tunaochambua, tuliendelea kutekeleza mkakati
wetu ambao ulituwezesha kuendelea kutoa huduma toshelevu za kipekee
kwa wateja, jambo ambalo lilichangia upatikanaji wa matokeo bora na faida
kwa wamilikihisa.
Uchumi wa Kenya ulibakia imara na kukua kwa 5.3% katika mwaka wa 2014,
ingawa ulishuka kidogo inapolinganishwa na 5.7% mwaka wa 2013. Matokeo
haya yalisaidiwa na kupungua kwa gharama ya kawi na kuongezeka
kwa matumizi ya serikali katika miradi mikubwa pamoja na miradi mingine
iliyotekelezwa na serikali za ugatuzi.
Sekta ya Teknolojia ya Habari na Mawasiliano ilishuhudia ukuaji wa 13.4% katika
mwaka wa 2014. Sasa inachangia karibu 8.4% kwenye Jumla ya Pato la Taifa
(GDP), na kukiwa na sera zilizo na muongozo mzuri, sekta hii inatarajiwa kutimiza
malengo ya Ruwaza ya 2030 ya kuweza kuchangia 10% kwenye Jumla ya Pato
la Taifa kufikia mwaka wa 2017.
Hakuna shaka kwamba sehemu kubwa ya ukuaji huu ilitoka katika sekta ya
mawasiliano ya simu za rununu ambapo Safaricom na wahusika wengine
wanazidi kutoa mchango mkubwa kwenye uchumi.
Katika mwaka huo tunaochambua, viwango vya riba vilibakia thabiti huku
Benki Kuu ya Kenya ikidumisha viwango vyake (CBR) katika kiwango cha 8.5%
huku mfumko wa bei (inflation) ukiongezeka kidogo kwa 1.2% kufikia 6.9%.
Katika soko la ubadilishanaji pesa za kigeni, shilingi ya Kenya ilidorora dhidi ya
dola ya Marekani, jambo ambalo lilihusishwa na upungufu wa mapato, hasa
kutoka sekta ya utalii.
Bodi ilipendekeza mgao wa faida wa senti 64 kwa kila hisa, ambao ni jumla ya
Kshs 25.64 bilioni, likiwa ni ongezeko la 36% kulinganisha na mwaka ulio pita. Huu
kwa mara nyingine ndio mgao mkubwa zaidi wa faida katika historia ya Kenya.
9
BW. NICHOLAS NGANGAMWENYEKITI
Ushupavu wetu unaendelea kusaidia wadau wetu
muhimu katika juhudi za kuboresha maisha ya wateja
wetu na Wakenya kwa ujumla.
Ari yetu ya kuendelea kuboresha maisha inabakia
imara na tukiwa na mkakati wetu, tuna uhakika
kwamba tutaendelea kuleta thamani kwa wamilikihisa
na wateja wetu.
MASWALA MUHIMU YA KISHERIAKuandikishwa Upya Kwa Leseni ya Kuendeshea BiasharaKanuni za udhibiti zinabakia kuwa na umuhimu mkubwa
katika kuendelesha biashara yetu. Kama ilivyotajwa
katika matokeo ya nusu ya mwaka, muda wa leseni yetu
ya kuendesha biashara uliongezwa Julai mwaka jana
kwa muda mwingine wa miaka kumi.
Ununuzi wa Mipangilio ya Ziada (Spectrum)Vile vile, tuliweza kupata mipangilio ya ziada baada
ya kukamilisha ununuzi wa mtandao wa kampuni ya
Essar Telecom. Hii imetuwesheza kuendelea kuboresaha
kuenea kwa mtandao wetuna kutoa huduma bora kwa
wateja wetu.
Ada ya kuvukisha mazungumzo ya simu za rununu kutoka mtandao mmoja hadi mwingine (Mobile Termination rates Rates)Katika kipindi hicho pia, ada ya kuvukisha mazungumzo
kupitia simu ya rununu kutoka mtandao mmoja hadi
mwingine (MTR) ilipungua kutoka Kshs 1.15 hadi Kshs
0.99 kuanzia Julai 2014 kuambatana na muongozo
wa Mamlaka ya Mawasiliano (CA) wa kuendelea
kupunguza ada za kuvukisha mazungumzo kutoka
mtandao mmoja hadi mwingine (MTRs) kutoka Kshs 4.42
mwaka wa 2010 hadi kufikia ada ya mwisho ya Kshs 0.99
mwaka wa 2014.
Mradi wa Kitaifa wa Upeleleziwa Polisi Safaricom pia ilipata kandarasi ya Serikali kupitia
kwa Wizara ya Mambo ya Ndani na Ushirikiano wa
Kitaifa kuunda Utaratibu wa Udhibiti, Upelelezi na
Mawasiliano ya Polisi ambao unaleta mtazamo
unaozingatia teknolojia katika kazi ya polisi. Mpango huu
unatazamiwa kuboresha zaidi hali ya usalama na kuleta
mazingira bora ya kuendesha biashara.
Hazina Ya Huduma Kwa Wote (USF) Mamlaka ya Mawasiliano (CA) ilianzisha Hazina ya
Huduma kwa Wote (USF) na sasa Safaricom inalipa Ada
ya Huduma Kwa Wote (Universal Service Levy) kama
inavyohitajika. Wakati huo huo, Safaricom na watoaji
huduma wengine kupitia kundi la washawishi katika
sekta hii yaani Kenya Telecommunications Network
Operators (KTNO) , na Wamiliki Mitandao ya Mawasiliano
yaani Telecommunications Operators Service Providers
(TESPOK), wanaendeleza mashauriano na CA kuhusu
masuala mbali mbali yanayohusu utekelezaji wa Hazina
ya Huduma kwa Wote (USF).
USIMAMIZI WA KAMPUNI Katika mwaka huo wa kifedha, kulikuwa na mabadiliko
katika Bodi ya Wakurugenzi. Bw Gianluca Ventura
aliteuliwa kuwa mwanachama asiye-mtendaji
akichukua nafasi ya Bw Sunil Sood ambaye alijiuzulu
mwaka uliopita.
Namkaribisha Bw Gianluca katika bodi na namtolea
shukrani zangu za dhati Bw Sood kwa mchango wake.
MIKAKATI MUHIMUMwaka wa kifedha tunaochambua ulikuwa wa
mafanikio ya kipekee kwa Safaricom, huku tukiendelea
kudhihirisha kuwa sisi ni shirika linaloongoza katika utoaji
huduma za mawasiliano tukiwa mstari wa mbele kwa
ubunifu na kuleta mabadiliko katika maisha ya wakenya
Mawasiliano ya simu yanazidi kutumika katika maeneo
zaidi na katika tabaka mbali mbali za maisha. Tunalenga
kuendelea kujenga msingi wa ukuaji mpya katika
sehemu zote za biashara hii yetu, kutumia fursa mpya
pamoja na kuongeza bidhaa na huduma zetu tunazotoa
kwa sasa.
Kupitia kujitolea kwa wafanyikazi wetu, kendelea
kuungwa mkono na wawekezaji wetu, uaminifu
usiotikisika wa mamilioni ya wateja wetu, pamoja na
kuzidi kuelewa na mahitanji ya wateja wetu, tutaendelea
kuwapa wadau wetu thamani. Jitihada zetu za kujitolea
kuendelea kuboresha maisha ya wakenya bado ni imara
na tukizingatia mkakati wetu tuna matumaini kuwa
tutaendelea kuongezea thamani kwa wamilikihisa wetu.

SAFARICOM ANNUAL REPORT 201510
01 / HIGHLIGHTS
Our 4G network is now available in Nairobi and Mombasa, and we will roll out to another thirteen towns by the end of the financial year. This is a first for Kenya and it will enable our customers to experience superfast home broadband and mobile data offerings.
We continue to strive to deliver the best service to our customers and for that
we have been rewarded with strong commercial and financial performance.
We continue to deliver on our goal to transform lives by providing unmatched
services, improving our network quality and deepening financial inclusion with
the customer uptake of Lipa na M-PESA.
Our 4G network is now available in Nairobi and Mombasa, and we will roll out to
another 13 towns by year end. This is a first for Kenya and will enable our customers
to experience superfast home broadband and mobile data offerings.
In December 2014, the Government of Kenya entrusted Safaricom to build the
National Police Network in Nairobi and Mombasa to help with security. Delivery
of this 4G push-to-talk network and CCTV cameras is progressing well, with phase
one of the project launched on 25th May 2015.
We have grown our total revenue by 13% to Kshs 163.4 billion through focusing
on providing quality services that resulted in double-digit growth across our
non-voice service revenue streams. Voice service revenue, which now stands at
54% of total revenue, grew at 4%. Non-voice service revenue, which accounts
for 42% of total revenue, sustained its growth trajectory with a 27% increase to
Kshs 68.8 billion driven mainly by Data and M-PESA. Devices and other revenue
contributed 4% of total revenue.
According to the Communications Authority of Kenya (CA) December 2014
Statistics report, mobile penetration in Kenya stood at 80.6% with Safaricom
recording the largest subscriber share of 67.4%. Our customer base has grown
by 8% to 23.3 million while the churn rate dropped to 17.3% as a result of efforts
centred on retaining and rewarding our loyal customers.
Voice service revenue grew 4% to Kshs 87.4 billion. This growth was supported by
our loyal customer base attracted by a superior network experience, convenient
airtime distribution and attractive consumer propositions and promotions such as
the ‘Tetemesha’ campaign.
Messaging revenue increased by 15% to Kshs 15.6 billion, which represents 10%
of our total revenue. This was driven by increased usage from affordable SMS
bundles and SMS-based promotions such as ‘Bonyeza Ushinde’.
CEO’S STATEMENT
11
M-PESA, now contributing 20% of total revenue, continues to
be a significant driving factor in our growth. This was driven
by a 14% increase in 30-day active M-PESA customers to
13.9 million as well as an increase in the average number
of transactions per customer. In the year, we expanded our
M-PESA agent outlets by 6% to 85,756, thereby promoting
accessibility of the service to our customers. Since its launch,
the Lipa na M-PESA service has enabled cashless merchant
payments and facilitated trade between businesses and their
customers while improving business efficiency. In March 2015
the service had 49,413 merchants active on a 30-day basis,
who received Kshs 11.6 billion of payments.
Mobile data revenue grew at an impressive 59% driven by
an increased uptake of affordable data bundles and a
21% growth in 30-day active mobile data customers to 11.6
million. By 31 March 2015, we had 4.4 million customers on 3G
enabled devices of which 3.4 million were smartphones. Fixed
data revenue increased by 22% to Kshs 3.1 billion on the back
of 23% growth in fixed data customers.
We continue to focus on our ‘Best Network in Kenya’
programme with Kshs 33.7 billion invested in capital
expenditure during the year, our goal being to provide the
best customer experience through improving our network
quality, capacity and coverage. We have increased the
population coverage of our 3G network to 69%, completed
the modernisation of our 2G network which covers 92% of the
population and have connected 30% of our base stations to
our fibre.
In March 2015, we commissioned another independent test
drive to measure key quality metrics such as dropped calls,
voice quality and data speeds. These tests confirm that our
network is the best in Kenya and delivers world-class data and
voice services.
For another consecutive year, we have delivered robust
results and ensured value for our shareholders supported by
growth across all our revenue streams. This increase in revenue
coupled with cost efficiency has driven the EBITDA margin to
43.6%, a 1.5 ppt improvement.
Free cash flow has increased by 21% to Kshs 27.5 billion as a
result of the strong trading results and positive working capital
movements. The National Police Security Network negatively
impacted free cash flow in the year by Kshs 1.1 billion, and we
expect the negative impact to be Kshs 5.9 billion in FY16.
In light of the strong financial performance in the past year,
the Board recommends a dividend of Kshs 0.64 per share – an
increase of 36%. Pending approval by shareholders,
we will pay out a dividend of Kshs 25.64 billion,
which represents 80% of our net income, for the
year ended 31 March 2015; once again, the largest
dividend in Kenyan history.
ROBERT COLLYMORECEO
STRATEGIC PRIORITIES M-PESA is at the forefront in deepening financial
inclusion in Kenya. In the past year, we have been
commercialising the revolutionary Lipa na M-PESA
service that enables our customers to use their
M-PESA account as a method of payment when
retail shopping. We believe that in March 2015 Lipa
na M-PESA substituted approximately 5% of what
was previously a cash transaction, and our goal is to
accelerate the inroads. This will make a significant
contribution to the lives of our customers and move
Kenya towards a cash-lite economy.
Looking ahead, we will focus our efforts on putting
customers first, delivering relevant products and
operational excellence. Soon, we will complete
the fibre connection of our first 1,000 buildings to
enhance further our hosted PABX, fixed calling,
fixed data, cloud services and managed services
offerings.
In May, we announced the launch of Safaricom’s
home broadband solution, which is a set-top box
that brings the 3G and 4G network into the home
and distributes the superfast connectivity via Wi-Fi
to any existing Wi-Fi enabled devices. As an added
bonus, the set-top box brings Kenyan digital free-
to-air TV channels to the customer’s TV. We will offer
a wider range of relevant content and video-on-
demand in the coming year.
We continue on our ‘Best Network in Kenya’
journey, with a new set of goals to increase our
3G population coverage to 80%, and to roll out
our 4G network to an additional thirteen towns by
December 2015.

SAFARICOM ANNUAL REPORT 201512
Mtandao wetu wa teknologia ya LTE (4G) sasa unapatikana mjini Nairobi na Mombasa, na tutausambaza katika miji mingine 13 ifikapo mwisho wa mwaka. Huu ni wa kwanza hapa Kenya na utawezesha wateja wetu kufurahia mtandao (internet) wa kasi zaidi.
Tunaendelea kujitahidi kutoa huduma bora zaidi kwa wateja wetu na kwa sababu hiyo juhudi zetu zimepata matokeo mazuri ya kifedha. Tunaendelea kufikia lengo letu la kuboresha maisha ya wakenya kwa kutoa huduma za kipekee; kuimarisha ubora wa mtandao wetu; na kuzidi kupanua matumizi ya huduma za kifedha kwa kuongeza wateja wengi kwenye huduma ya kulipia bidhaa na huduma kupitia Mpesa yaani Lipa na M-PESA.
Mtandao wetu wa teknologia ya 4G sasa unapatikana mjini Nairobi na Mombasa, na tutausambaza katika miji mingine 13 ifikapo mwisho wa mwaka. Huu ni wa kwanza hapa Kenya na utawezesha wateja wetu kufaidi kutokana mtandao mpana wa internet wenye kasi zaidi.
Mnamo Desemba 2014, Serikali ya Kenya iliithamini Safaricom kwa kuipa jukumu la kujenga mfumo wa Mtandao wa Kitaifa wa Upelelezi wa Polisi mjini Nairobi na Mombasa ili kusaidia katika kudumisha usalama. Kuwasilishwa kwa mtandao huu wa 4G ‘push-to-talk’ na kamera za CCTV kunaendelea, huku awamu ya kwanza ikizinduliwa tarehe 25 Mei 2015.
Mapato yetu ya jumla ya yameimarika kwa 13% kufikia Kshs 163.4 bilioni kutokana na kutilia mkazo utoaji huduma bora, jambo lililopelekea kupatikana kwa ukuaji maradufu kote katika mapato yatokanayo na huduma zisizo za maongezi. Mapato kutokana na huduma ya maongezi sasa yamefikia 54% ya jumla ya mapato ikiwa ni ukuaji wa 4% huku mapato yanayotokana na huduma zisizo za maongezi zikichangia 42% ya jumla ya mapato, hali ambayo ilidumisha ukuaji wa 27% na kufikia Kshs 68.8 bilioni, ikichangiwa zaidi na huduma za Data na M-PESA. Faida kutokana na uuzaji wa simu za rununu na vifaa ningine na mapato mengine yalichangia 4% ya jumla ya mapato.
Kwa mujibu wa Mamlaka ya Mawasiliano yaani Communications Authority of Kenya (CA), takwimu za Desemba 2014 za ripoti ya uenevu wa matumizi ya simu za mkono hapa Kenya yalifikia 80.6% huku Safaricom ikiwa ndiyo yenye fungu kubwa zaidi la 67.4%.Wateja wetu waliongezeka kwa 8% kufikia 23.3 milioni huku idadi ya wateja wanaoacha mtandao ikipungua hadi 17.3% hii ikitokana na juhudi zilizolenga kuwashikilia na kuwazawadi wateja wetu waaminifu.
Mapato kutokana na huduma za maongezi yaliongezeka kwa 4% kufikia Kshs 87.4 bilioni, ustawi huu ukisaidiwa na wateja wetu waaminifu waliovutiwa na mtandao wetu bora , upatikanaji kwa njia rahisi wa vocha za ada ya mawasiliano (airtime) na maazimio bora ya kuvutia wateja na matoleo ya kuvutia kama ile kampeni ya ‘Tetemesha’.
Mapato kutokana na huduma za kutuma ujumbe mfupi (SMS)yaliongezeka kwa 15% kufikia Kshs 15.6 bilioni, hii ikiwa inawakilisha 10% ya jumla ya mapato. Hii ilitokana na kuongezeka kwa matumizi ya vifurushi vya bei nafuu vya SMS (SMS bundles) na kampeni za mauzo za SMS kama ile ya ‘Bonyeza Ushinde’.
01 / HIGHLIGHTS
TAARIFA YA AFISA MKUU MTENDAJI
13
M-PESA, sasa ikiwa inachangia 20% ya jumla ya mapato, inazidi kuchangia pakubwa ukuaji wetu. Hii ililetwa na ongezeko la 14% la wateja wanaotumia huduma hii kwa mara moja ama zaidi katika muda wa siku 30 ambao walifikia13.9 milioni na pia ongezeko la matumishi ya M-PESA kwa kila mteja kwa wastani . Katika mwaka huo, tulipanua na kuongezea vituo vya maajenti wetu wa M-PESA kufikia 85,756, hivyo basi kutia nguvu upatikanaji wa huduma hii kwa wateja wetu. Tangu kuzinduliwa kwake, huduma ya kulipia bidhaa na huduma yaani Lipa na M-PESA imefanikisha malipo kwa wauzaji yasiyohitaji pesa taslimu na kuwezesha uimarishaji biashara baina ya wafanyibiashara na wateja wao huku ikiboresha ufanisi wa biashara kwa ujumla. Katika mwezi Machi 2015, huduma hii ilikuwa imetimiza idadi ya wafanyibiashara 49,413 watumiaji wa huduma hii mara moja ma zaidi katika siku 30, ambao walipokea Kshs11.6 bilioni za malipo.
Mapato kutokana na huduma za data kupitia simu ya rununu (mobile data) yaliongezeka maridhawa kwa 59% yakichochewa na kuongezeka kwa matumizi ya vifurushi vya bei nafuu vya data (data bundles) na ongezeko la 21% la wateja wanaotumia huduma hii kwa siku moja ama saidi katika muda wa siku 30 ambao walifikia 11.6 milioni.
Kufikia tarehe 31 Machi 2015, tulikuwa na idadi ya wateja 4.4 milioni wa vifaa vilivyowezeshwa kutumia teknolgia ya 3G ambavyo 3.4 milioni vikiwa ni simu za ‘smartphones’. Mapato kutokana na huduma za data zisizotumia simu za rununu (fixed data) pia yaliongezeka kwa 22% na kufikia Kshs 3.1 bilioni ikiwa ni ongezeko la 23% la wateja hao wa huduma za data zisizotumia simu za rununu (Fixed data).
Tunaendelea kutilia mkazo mpango wetu wa Mtandao Bora Zaidi Nchini Kenya (Best Network in Kenya) kukiwa na uwekezaji wa Kshs 33.7 bilioni kwenye matumizi ya kimtaji mwakani, azimio letu ikiwa ni kutoa huduma bora zaidi na toshelevu kwa wateja wetu kupitia uimarishaji wa ubora wa mtandao wetu, ukubwa na uenevu wake. Tumeongeza uenevu wa mtandao wetu wa teknologia ya 3G kwenye idadi kubwa ya watu hadi 69%, tumekamilisha kazi ya kuufanya mtandao wetu wote wa teknojia ya 2G kuwa wa kisasa na ambao sasa umeenea kwa kima cha 92% ya idadi ya watu na tayari tumeunganisha 30% ya vituo vyetu vya musingi (base stations) na nyaya za ‘fibre’.
Katika mwezi Machi 2015 tuliagiza tena uchunguzi huru ili kubaini ubora wa huduma zetu kama vile kukamilika kwa mazungumzo, ubora wa huduma ya maongezi na kasi ya huduma ya data, uchunguzi huu unabaini kuwa mtandao wetu unatoa huduma bora zaidi za data na huduma za sauti hapa Kenya zinazolingana na hadhi ya kimataifa.
Kwa mwaka mwingine mfululizo, tumepata matokeo imara na kuwaletea wanahisa wetu thamani ikisaidiwa na ukuaji uliodhihirika katika vitengo vyetu vyote vya biashara. Ukuaji huu wa mapato, pamoja na matumizi bora ya fedha, ulisukuma juu mapato kabla ya kutoza riba, ushuru na gharama zisizolipiwa kwa pesa taslimu (EBITDA) hadi 43.6%, ikiwa ni imariko la alama 1.5 ppt.
Fedha zilizosalia baada ya matumizi lakini kabla ya kulipa mgao wa hisa (Free cash flow) ziliongezeka kwa 21% hadi kufikia Kshs 27.5 bilioni kutokana na matokeo mazuri ya kibiashara na kuongezeka kwa mtaji wa kufanyia biashara (working capital). Mradi wa Mtandao wa Kitaifa
wa Upelelezi wa Polisi ulipunguza fedha zilizosalia baada ya matumizi lakini kabla ya kulipa mgao wa hisa mwakani kwa Kshs 1.1 bilioni, na tunatarajia upungufu wa Kshs 5.9 bilioni katika mwaka wa kifedha wa 2016.
Kutokana na matokeo haya imara ya kifedha ya mwaka uliopita, Bodi inapendekeza kutolewa kwa mgao wa senti 64 kwa kila hisa, ikiwa ni ongezeko la 36%. Ikisubiriwa idhini ya wamilikihisa, tutalipa mgao wa kiasi cha Kshs 25.64 bilioni, hii ikiwakilisha 80% ya jumla ya faida yetu, ya mwaka uliomalizikia Machi 31, 2015; kwa mara nyingine tena, huu ukiwa mgao mkubwa zaidi
katika historia ya Kenya.
ROBERT COLLYMOREAFISA MKUU MTENDAJI
MIKAKATI MUHIMUHuduma ya M-PESA iko katika mstari wa mbele katika kujumuisha wengi kwenye matumizi ya huduma za kifedha hapa Kenya. Katika mwaka uliopita, tumekuwa tukihamasisha matumizi ya huduma ya Lipa na M-PESA inayowezesha wateja wetu kutumia akaunti zao za M-PESA kama njia ya kulipia huduma na bidhaa. Tunaamini kuwa katika Machi 2015 huduma ya Lipa na M-PESA ilibadilisha takriban 5% ya malipo ya kibiashara yaliyokuwa awali ya pesa taslimu, na lengo letu ni kuharakisha upanuzi zaidi wa huduma hii. Hii itachangia pakubwa katika kubadilisha maisha ya wateja wetu na pia kuipeleka Kenya mbele katika uchumi usiohitaji pesa taslimu kulipia huduma na bidhaa.
Kuendelea mbele, tutatilia mkazo kuweka wateja wetu mbele, kutoa bidhaa zinazofaa na utendaji bora zaidi wa shughuli zetu. Hivi karibuni tutakamilisha uunganishaji wa nyaya za fibre kwenye majumba 1,000 ya kwanza ili kuboresha zaidi uandalizi wetu wa PABX, huduma ya maongezi ya simu zisizo za rununu, huduma za data zisizo za rununu, huduma za ‘cloud’ na usimamizi wa huduma kwa niamba ya wateja wetu (managed services).
Mwezi mei, tulitangaza rasmi uzinduzi wa bidhaa ya Safaricom ya mtandao mpana wa internet majumbani, ambao ni kupitia king’amuzi (set-top box) kinacholeta mtandao wa teknlojia ya 3G na 4G hadi majumbani, na kusambaza kwa uunganishaji wa kasi kupitia Wi-Fi ifaa vyote vilivyoko nyumbani vyenye uwezo wa kutumia Wi-Fi. Kama bahashishi, king’amuzi hiki kinakuja na idhaa za dijitali za runinga za hapa Kenya zinazoonyeshwa bure kwa wateja wetu. Tutatoa huduma zingine nyingi husika na Video kwa wanaohitaji katika mwaka unaokuja.
Tunazidi kuendeleza safari yetu ya kuwa Mtandao Bora zaidi nchini, tukiwa na malengo mapya ya kuongeza idadi ya watu wanaotumia mtandao wetu wa teknolojia ya ya 3G na kuenea hadi 80%, na kusambaza mtandao wetu wa teknolijia ya 4G hadi kufikia miji 13 zaidi ifikapo Desemba 2015.

SAFARICOM ANNUAL REPORT 201514
CHAIRMAN’S STATEMENT01 / HIGHLIGHTS

SAFARICOM ANNUAL REPORT 201514
CHAIRMAN’S STATEMENT01 / HIGHLIGHTS
15
BUSINESSREVIEW
02

NETWORK
SAFARICOM ANNUAL REPORT 201516
WHAT WE DO02 / BUSINESS
REVIEW
We offer our customers unmatched high speed data
connectivity for access to email and internet through fixed and
mobile broadband:
• Mobile data services on modems, handsets and tablets
• Safaricom Live web portal provides a large selection of local content
• Data bundles for both Prepaid and Postpaid customers
• Routers which allow several devices to share a single mobile data connection
Our customer base stands at 23.3 million of which 98% are on Prepaid services.
CUSTOMERS• We provide customers with a range of integrated telecommunication
services, including mobile and fixed voice, SMS, data, internet and M-PESA
• These range of services are provided to both individual and
corporate customersD
ATA
DISTRIBUTION
We offer a wide range of devices such as:
• Mobile handsets, mobile broadband modems, routers,
tablets, and notebooks
• In 2015, we had 4.4 million 3G and 4G-enabled devices
on our network
DEVICES
We have the largest distribution network with the widest reach:
• Airtime: Distributed through our dealers and over 275,000 retailer outlets
• Customers can also top up their airtime through M-PESA
• M-PESA: Agent footprint now stands at 85,756
• Enterprise business: We have a large sales team spread over the 47 counties
selling mobile and fixed voice, data and converged services to businesses
• Retail outlets: We have 42 retail outlets selling airtime, devices and offering
personalised services to our customers
We have 3,382 sites.
• Our network is on 2G, 3G, 4G and Wimax technology
• We cover 92% of the population on 2G and 69% on 3G
• We launched 4G in Nairobi and Mombasa, now with 236 sites.
• We have over 2,010 km of fibre in key metro areas
• Our M-PESA runs on the upgraded (G2) system
• Through our partnership with Vodafone and other partners, we have access to newly released smartphones and low-cost devices
• Customers can also acquire devices through
redemption of Bonga Points and credit facilities

NETWORK
SAFARICOM ANNUAL REPORT 201516
WHAT WE DO02 / BUSINESS
REVIEW
We offer our customers unmatched high speed data
connectivity for access to email and internet through fixed and
mobile broadband:
• Mobile data services on modems, handsets and tablets
• Safaricom Live web portal provides a large selection of local content
• Data bundles for both Prepaid and Postpaid customers
• Routers which allow several devices to share a single mobile data connection
Our customer base stands at 23.3 million of which 98% are on Prepaid services.
CUSTOMERS• We provide customers with a range of integrated telecommunication
services, including mobile and fixed voice, SMS, data, internet and M-PESA
• These range of services are provided to both individual and
corporate customers
DA
TA
DISTRIBUTION
We offer a wide range of devices such as:
• Mobile handsets, mobile broadband modems, routers,
tablets, and notebooks
• In 2015, we had 4.4 million 3G and 4G-enabled devices
on our network
DEVICES
We have the largest distribution network with the widest reach:
• Airtime: Distributed through our dealers and over 275,000 retailer outlets
• Customers can also top up their airtime through M-PESA
• M-PESA: Agent footprint now stands at 85,756
• Enterprise business: We have a large sales team spread over the 47 counties
selling mobile and fixed voice, data and converged services to businesses
• Retail outlets: We have 42 retail outlets selling airtime, devices and offering
personalised services to our customers
We have 3,382 sites.
• Our network is on 2G, 3G, 4G and Wimax technology
• We cover 92% of the population on 2G and 69% on 3G
• We launched 4G in Nairobi and Mombasa, now with 236 sites.
• We have over 2,010 km of fibre in key metro areas
• Our M-PESA runs on the upgraded (G2) system
• Through our partnership with Vodafone and other partners, we have access to newly released smartphones and low-cost devices
• Customers can also acquire devices through
redemption of Bonga Points and credit facilities
We provide other value-added services and converged business solutions:
• Access services such as wireless, fixed line and mobile
solutions, including fibre and leased lines
• Dedicated internet solutions for enterprises and hosted
services, such as data storage, hosting and security solutions
• We heavily engage in corporate social responsibility and
other activities that transform lives
OTHER SERVICES
VO
ICE
17
We offer a variety of messaging services to our customers:
• Basic SMS as well as attractive and discounted SMS bundles
• MMS that enables our customers to send pictures, music and video messages
• Please Call Me, a service that allows customers to request a callback using SMS from another mobile user
• A call back SMS notification for missed calls and alert SMS when an unavailable mobile user becomes available
We offer a wide range of voice pricing plans on Prepaid and Postpaid
options, often bundled with SMS and Data services. Voice services include
national and international roaming services. The unique features of our
voice offering include:
• An emergency top-up credit facility - Okoa Jahazi
• Bonga Points, a customer loyalty programme
• Caller ring back service, Skiza, which is a value-added service
M-PESA is a fast, convenient and affordable way to send and
receive money, and pay for goods and services via mobile phone.
• The service has over 20 mill ion registered customers
served by a network of about 85,756 agents spread
across the country
• Lipa na M-PESA allows for payment of goods and services, now
with 49,413 active merchants receiving payments
• Other services on M-PESA include Paybill, bulk payments, dividend
payments and international money transfer services
• Our customers can save and borrow money through the
M-Shwari and KCB M-PESA products
• They can also access electricity credit through Okoa Stima
We have maintained our record of exceptional growth through
superior commercial performance across our entire service portfolio
M-P
ESA
MESSAGING

01 / HIGHLIGHTS
SAFARICOM ANNUAL REPORT 201518
02 / BUSINESS REVIEW
THE VALUE WE CREATE
REINVESTING IN OUR BUSINESSWe invested Kshs 33.7 billion (2014: Kshs 27.8 billion) in capital expenditure allocated to fibre with over 2,010 km completed in key metro areas, modernisation and upgrade of 2G networks, investment in 3G and 4G networks, new M-PESA platform and information system upgrades. Total sites have increased to 3,382, of which 1,943 are 3G-enabled, giving Safaricom the most extensive coverage in the country.
CONTRIBUTION TO REVENUES OF THE GOVERNMENTThe Group continues to be a major contributor
to the revenues of the Government and remitted
Kshs 54.8 billion (2014: Kshs 47.6 billion) in the year.
The contributions were as follows: value-added tax
- Kshs 12.2 billion; corporate tax - Kshs 20.6 billion;
excise duties - Kshs 17.5 billion; as well as through our
licence fees - Kshs 4.5 billion (2014: Kshs 1.9 billion).
INVESTING IN OUR PEOPLE We distributed Kshs 11.4 billion (2014: Kshs 10.1 billion) to our employees through salaries, short and long-term incentives and contributions to pension funds and medical aid schemes. We also continued to invest in our employees through development and talent programmes.
RETURNS TO OUR INVESTORSOur investors received Kshs 19.9 billion (2014: Kshs 13.9 billion)
of our total value created. We paid dividends of Kshs 18.8
billion (2014: Kshs 12.4 billion) to equity holders and interest of
Kshs 1.1 billion (2014: Kshs 1.5 billion) to debt providers.
CONTRIBUTION TO OUR SUPPLIERSWe distributed Kshs 88.2 billion (2014: Kshs 81.9 billion) to our
providers of goods and services. Some of the key suppliers are
airtime dealers and M-PESA agents who were paid Kshs 22.9
billion (2014: Kshs 20.2 billion).
19
BEST NETWORK IN KENYA• We launched Kenya’s first 4G network in
Nairobi and Mombasa
• We successfully deployed the next
generation (G2) M-PESA system in Kenya
• 2,010 km of metro fibre rolled out to date, with
1,070 (30%) of our base stations connected
• 720 buildings connected to our own fibre
• 100% of our Radio Network now modernised
• Trusted to build the National Police Security
Network with phase 1 having gone live on
25th May 2015
• Our 3G with the highest data speeds
averaging 4.3Mbps and improvements in
call drop rates
STAYING AHEAD OF THE CURVE• Idea Lifecycle Management
Portal: enabling ideas to be
shared internally and externally
• Kshs 90 million venture fund that
will invest in high potential start-
ups using mobile technology
• Okoa Stima: Innovative
product allowing users to take
a loan to purchase Kenya
Power electricity services
(Prepaid & Postpaid) and
repay via M-PESA
• M-Ledger: Launched an
Android based application
which empowers customers
to keep track of their M-PESA
transactions
GROWING MOBILE DATA• Achieved 21% growth in 30-day
active mobile data users to 11.6
million - 50% of our customer base
• Our smartphone users
grew by 98% to 3.4 million
through provision of low-cost
smartphones
• 3G and 4G enabled devices on
our network now at 4.4 million
• Grew active data bundle
users to 4 million
• Achieved 38% increase in
average mobile data usage per
customer
GROWING THE YOUTH SEGMENT• Youth brand equity is now at 79% with
the Youth Net Promoter Score at 57%
• Grew youth subscribers by 1.28 million
• Substantially reduced mobile data
pricing to ensure affordability
• Recruited youth ambassadors to
increase youth subscribers through
initiatives like Activ8
• Initiated youth targeted Bonga offering
and created more products and
propositions for the youth that touched
on data and value-added services
• Engaged the youth through various
activities such as the 7s Rugby Series
and Groove Awards
• Our M-PESA 30-day active customers grew by 14% to 13.9 million users
• We launched International Money Transfer to Vodacom Tanzania
• 30-day active Lipa na M-PESA merchants posted a growth of 105% to 49,413. Payments received by the merchants in March 2015 was Kshs 11.6 billion
• 30-day active M-Shwari customers now at 3 million; deposits at Kshs 5.5 billion and loans of Kshs 2.1 billion
• We launched KCB M-PESA, which closed the year with 1.4 million customers
• We launched Okoa Stima, an emergency loan facility to pay for electricity
DELIGHTING OUR CUSTOMERS• We increased the
number of web self
care service users to
2.7 million
• We introduced flexi
loyalty redemption
and credit facilities for
customers to acquire
smart devices
• Revamped Okoa
Jahazi to make it more
accessible
PARTNER OF CHOICE FOR BUSINESS• We increased penetration of
additional products targeting our
corporate customer base (Fixed
data at 21% and M-PESA at 22%)
• Achieved deeper county
government penetration with
60% of counties using at least one
enterprise solution
• We grew SME active customers by
106% to 64,000 customers
• Fixed voice billing customers grew
by 48% to 605 customers
• Rolled out dedicated SME support
team to boost customer retention
OUR STRATEGIC PRIORITIES
DEEPENING FINANCIAL INCLUSION

SAFARICOM ANNUAL REPORT 201520
ETHICS AND COMPLIANCEWe have an Ethics and Compliance function that ensures conformity with regulations, laws and Safaricom internal policies. We continue to promote the right ethical culture through intensive and interactive ethics awareness initiatives for our staff and other stakeholders. We also collaborate with law enforcement authorities to tackle crime affecting our products and services. This has enhanced the efficiency and effectiveness of investigations involving various types of crimes in the industry.
GOVERNANCEGood governance is integral to business sustainability, integrity and
maintaining investors’ trust in the Company. At Safaricom, we foster a
culture that values and rewards the highest ethical standards at personal
and corporate levels. We make sure that our governance structures
support effective decision making and robust controls. These structures
are informed by changing business requirements as well as local and
international best practice. Our Directors and employees are expected to
act with honesty, integrity and fairness. We also act in accordance with
the laws of Kenya and observe and respect the diverse cultures of the
Kenyan people.
REMUNERATIONOur remuneration policy is aimed at attracting and retaining the best talent and ensuring our executives are compensated in line with their performance. The remuneration is measured against financial performance, delivery of strategy and how faithfully they apply Safaricom’s business principles of speed, simplicity and trust. This process determines:
• The annual bonus awarded to employees
• Share grant programmes for senior management
• The annual pay increase
Good corporate governance is at the core of our efforts to build and sustain the business. Additionally, we promote an ethical culture anchored in ethical management and responsible control. Operationally, we weigh up the risks and rewards while balancing our stakeholders’ interests in fulfilling our obligations.
BOARD
Nomination &Remuneration
Committee
CEO
Finance Strategy &Innovation
ConsumerBusiness
InternalAudit
Resources Technology
RiskManagement
CustomerOperations
EnterpriseBusiness
CorporateAffairs
MarketingFinancialServices
BoardCommittees
BOARD OFDIRECTORS
AuditCommittee
SENIOR LEADERSHIPTEAM
HOW WE ARE MANAGED02 / BUSINESS
REVIEW
2121
Safaricom won the Euromoney Award for the Best
Managed Company in Kenya for the year 2015.
The best managed companies ranking is based on
a survey of market analysts at leading banks and
research firms around the world.
The survey involves respondents nominating the
top three listed companies in each of the following
categories;
• Most convincing and coherent business strategy
• Best system of corporate governance
• Most accessible senior management
• Most transparent financial accounts
• Best for shareholder value
• Most useful and informative website
We believe this award recognises our commitment
of transforming lives and creating value for our
shareholders and customers.
SAFARICOM WINS ‘EUROMONEY BEST MANAGED COMPANIES’ AWARD FOR KENYA

CHAIRMAN’S STATEMENT01 / HIGHLIGHTS
From left to right:
Esther Koimett - Non-Executive Director, alternate to Henry Rotich, Enid Muriuki - Company Secretary, John Tombleson - Executive
Director, alternate to Robert Collymore, John Otty - Non-Executive Director, Nicholas Nganga - Chairman & Non-Executive
Director, Nancy Macharia - Non-Executive Director.
WHO GOVERNS US02 / BUSINESS
REVIEW
SAFARICOM ANNUAL REPORT 201522
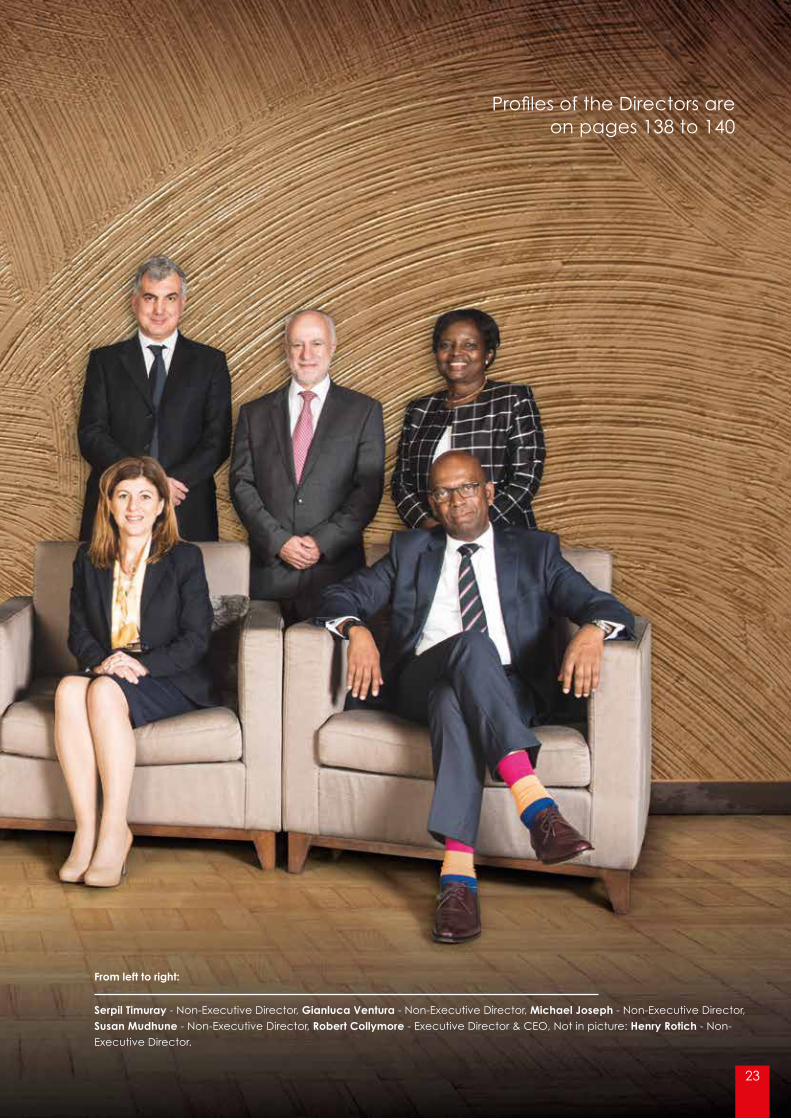
From left to right:
Serpil Timuray - Non-Executive Director, Gianluca Ventura - Non-Executive Director, Michael Joseph - Non-Executive Director,
Susan Mudhune - Non-Executive Director, Robert Collymore - Executive Director & CEO, Not in picture: Henry Rotich - Non-
Executive Director.
23
Profiles of the Directors areon pages 138 to 140

SAFARICOM ANNUAL REPORT 201524
Robert CollymoreChief Executive Officer
Roy MasambaDirector, Resources
Betty MwangiDirector, Financial Services
John TomblesonChief Financial Officer
Nicholas MulilaDirector, Risk Management
Joseph OgutuDirector, Strategy & Innovation
Sylvia MulingeDirector, Consumer Business
Rita OkutheDirector, Enterprise Business
Denish OsodoDirector, Internal Audit
WHO LEADS US02 / BUSINESS
REVIEW
25
Thibaud RerolleDirector, Technology
Jannet AtikaHead, Customer Operations
Steve ChegeDirector, Corporate Affairs
Profiles of the Senior Management Team are on pages 141 to 143
Our objective is to ensure ethical management and
responsible control.

SAFARICOM ANNUAL REPORT 201526
The Safaricom Board of Directors is charged with the responsibility of ensuring the Company is managed in a sound manner that delivers shareholder value within an environment of good corporate governance.
The Board is responsible for reviewing and approving
the business strategic objectives and providing
the necessary leadership and oversight to the
management. In this regard, the Board is a key player
in the Company’s corporate governance system and
is ultimately accountable for the performance of the
business. As part of its obligations to the Company, the
Board commits itself to adopting the principles of good
corporate governance.
BOARD ORGANISATION AND STRUCTUREDuties and responsibilities of the BoardThe Board’s role is to ensure transparent accountability
for the well-being and performance of the Company
on behalf of shareholders and other stakeholders. In
addition, the Board:
• Provides effective leadership in collaboration with the
Executive management team
• Facilitates the setting up of appropriate corporate
governance structures for the management of the
Company’s operations
• Establishes Board committees, policies and procedures
that facilitate the most effective discharge of the
Board’s roles and responsibilities
• Reviews and approves the Company’s annual budget
as proposed by the Executive management team
• Facilitates Board accountability through effective
Board evaluation and succession planning
• Evaluates and approves compensation of the
Company’s Chief Executive Officer
• Reviews the succession plans for the position of
the Chief Executive Officer and the Executive
management team
• Reviews and approves management’s strategic and
business plans. This requires the Board to develop
an in-depth knowledge of the Company’s business,
understanding and questioning the assumptions
upon which such plans are based and reaching an
independent judgment as to the probability that the
plans will be realised
• Reviews and approves the Company’s financial
objectives, plans and actions, including significant
capital allocations and expenditure
• Ensures that the key strategic risks of the Company
are identified and understood, including their ongoing
status, and that the risks are managed effectively and
are regularly monitored
• Ensures that appropriate and effective risk
management and internal control processes are in
place and operating within the Company
• Monitors corporate performance against the strategic
and business plans, including overseeing the operating
results on a regular basis to evaluate whether the
Company is being properly managed
• Upholds ethical behaviour and compliance with
applicable laws and regulations, auditing and
accounting principles, and the Company’s own
governing documents
• Assesses its own effectiveness in fulfilling these and
other Board responsibilities
• Proposes distributions to the shareholders for approval at
the annual general meetings
• Provides leadership and vision that enhances
shareholder value and that will ensure long-term
sustainability and growth of the Company
• Performs other functions as prescribed by law or
assigned to the Board in the Company’s Articles of
Association
CORPORATE GOVERNANCE STATEMENT02 / BUSINESS
REVIEW
27
Activities of the BoardWhile the Board is solely responsible for its agenda, it is
the responsibility of the Chairman and the Company
Secretary, working closely with the Chief Executive
Officer, in coming up with the Annual Board Work Plan
and agenda for Board meetings.
The Board meets at least four times a year and the
meetings are structured to allow for open discussions. All
substantive agenda items have comprehensive briefing
papers, which are circulated at least two weeks prior to
the meeting. The submissions and notification period may
be waived should any urgent and critical matters arise
within the two-week period to the date of the meeting.
Directors attend Board meetings regularly and effectively
participate in conducting the business of the Board.
The senior management team may be invited to attend
the board meetings as may be deemed necessary.
Where directors are unable to attend a meeting, they
are advised on the matters to be discussed and given an
opportunity to make their views known to the Chairman
or the Chief Executive Officer prior to the meeting.
The Non-Executive Directors have a particular
responsibility of ensuring the business strategies proposed
are fully discussed and critically reviewed, as they do
not form part of the executive management team. This
enables the Directors to promote the success of the
Company for the benefit of its shareholders as a whole,
with consideration to, among other matters, the interests
of employees, the fostering of business relationships with
customers, suppliers and others, and the impact of the
Company’s operations on the communities in which it
operates as well as the environment.
The Non-Executive Directors are the custodians of the
governance process, and oversee the operational
performance of the business. To perform these tasks, they
have full and timely access to all relevant information,
with updates provided on governance and regulatory
matters affecting the Company. In addition, Executive
Committee members and other senior executives are
invited, as appropriate, to Board and strategy meetings
to make presentations on their areas of responsibility.
Non-Executive Directors are, on occasion, invited to
attend the senior leadership strategic and operations
review meetings to gain further insight into different
aspects of the business.
Division of responsibilitiesA clear separation of roles has been established
between the Chairman and the Chief Executive Officer.
These roles have been assigned and agreed on by the
Board as captured in the Company’s Board Charter to
ensure that decision making is regulated and unbiased.
The Chairman’s responsibilities include the operation,
leadership and governance of the Board, ensuring its
effectiveness and setting its agenda.
The Chief Executive Officer’s role and responsibilities
include the day-to-day management of the Company’s
business and the implementation of strategy and policies.
Board composition and independenceThe Board of Directors is well constituted to enable its
effective oversight of the executive management. The
number of Directors is appropriate and allows the Board
to have interactive discussions and to make swift and
astute decisions. The Board has two established Board
Committees and has also formed a Special Projects
Committee that meets on an ad hoc basis to address
specific Company matters that may not be within the
ambit of the two established committees.
The constitution of the Company’s Board is dictated by
the Company’s Articles of Association and comprises
nine members of whom, eight are Non-Executive
Directors and one is Executive. Safaricom’s Non-
Executive Directors (including the Chairman) are
expected and required to demonstrate complete
independence in character, judgment and action in
fulfilling their duties.
BOARD EFFECTIVENESSAppointments to the BoardThe Board is responsible for recommending independent
Directors for election by the shareholders at the Annual
General Meetings (AGMs). Nominated Directors
undergo a formal screening process by the Nominations
and Remuneration Committee before being formally
appointed to the Board.
The Committee also considers Director nominees
recommended by shareholders and uses the same
criteria for screening candidates. Between AGMs,
the Board may appoint Directors to serve until the
next AGM. Any such appointment of an independent
Director must be ratified by the shareholders at the AGM
following their appointment.

SAFARICOM ANNUAL REPORT 201528
Independent adviceThe Board recognises that there may be occasions
when one or more Directors considers it necessary to
take independent legal and /or financial advice at the
Company’s expense. There is a documented procedure
to enable them to do so.
Board trainingTo empower the board members to effectively execute
their oversight role, the Company conducts both in-
house and facilitator-led trainings regularly covering
different aspects of the business, governance and
other areas that affect the Company’s business and
the industry. In the last financial year, trainings on the
following were conducted:-
• Building a strong brand
• Financial reports review
We have also developed a comprehensive induction
programme for all new Board members.
Board members meetings and members’ attendance for 2014/15Board Member Position 12th May 2014 15th Sep 2014 4th Nov 2014 6th Mar 2015
Nicholas Nganga Chairman √ √ √ √
Michael Joseph Non-Executive Director √ √ √ √
Susan Mudhune Non-Executive Director √ √ - √
Nancy Macharia Non-Executive Director √ √ √ √
Esther Koimett Alternate Director to Henry Rotich √ √ √ √
Sunil Sood Non-Executive Director √ - √Resigned on
6th March 2015
John Otty Non-Executive Director √ √ √ √
Serpil Timuray Non-Executive Director √ √ √ √
Gianluca Ventura Non-Executive Director - - -Appointed on 6th March 2015
Robert Collymore CEO √ √ √ √
John Tombleson CFO √ √ √ √
Enid Muriuki Company Secretary √ √ √ √
CORPORATE GOVERNANCE STATEMENT02 / BUSINESS
REVIEW
BOARD EFFECTIVENESS (continued)
Board committeesThe Board has established committees to enable it
to carry out its governance roles and responsibilities
effectively and efficiently. The Board currently has
two standing committees, an Audit Committee and a
Nominations & Remuneration Committee, each of which
has formal terms of reference approved by the Board.
The Board is satisfied that the terms of reference for
each of these committees satisfy the requirements of the
Capital Markets Authority and are reviewed on a regular
basis by the Board. The committees are provided with all
necessary resources to enable them to undertake their
duties in an effective manner.
Audit CommitteeThe Audit Committee consists of four Non-Executive
Directors and report to the Board of Directors after the
holding of every Committee meeting. The Chairperson
is an independent and Non-Executive Director. The
constitution of the Committee is well aligned with the
Code of Corporate Governance that has been issued by
the Capital Markets Authority.
The Audit Committee meets four times a year and its
mandate includes:
• Reviewing and assessing the Company’s risk
management process and the adequacy of the overall
control environment
• Reviewing reports on internal audits conducted by the
Director of Internal Audit and ensuring appropriate
action is taken to address any weaknesses identified
• Receiving reports from the Director of Internal Audit,
CFO or Director of Risk Management on any fraud,
whether or not material, that involves management
or other employees who have a significant role in the
Company’s internal controls
29
Audit Committee meetings and members’ attendance for 2014/15MEMBER POSITION 8TH MAY 2014 12TH SEP 2014 3RD NOV 2014 4TH MAR 2015
Susan Mudhune Chairperson √ √ √ √
Esther Koimett Member √ √ - √
Nancy W Macharia Member √ √ √ √
John Otty Member √ √ √ √
Robert Collymore CEO √ √ √ √
John Tombleson CFO √ √ √ √
Enid Muriuki Company Secretary √ √ √ √
Anne Eriksson Representing PwC, External Auditors √ √ √ √
Nomination and Remuneration CommitteeThe Nomination and Remuneration Committee
comprises five members and is mandated to review
the balance and effectiveness of the Board and
remuneration of Directors and senior management as
well as the succession planning at Board and Senior
Management levels. The Committee meets four times a
year and undertakes the following functions:
• Monitoring the size and composition of the Board
• Recommending individuals for nomination as members
of the Board and its committees
• Reviewing all executive appointments, succession and
development plans
• Reviewing and proposing the remuneration structures
for Executive and Non-Executive members of the Board
Nomination and Remuneration Committee meetings and members’ attendance for 2014/15COMMITTEE MEMBER POSITION 8TH MAY 2014 12TH SEP 2014 3RD NOV 2014 4TH MAR 2015
Nicholas Nganga Chairman √ √ √ √
Michael Joseph Member √ √ √ √
Esther Koimett Member √ - - √
Susan Mudhune Member √ √ √ √
Gianluca Ventura Member - - -Appointed on 6th March 2015
Robert Collymore CEO √ √ √ √
Roy Masamba Director, Resources √ √ √ √
Enid Muriuki Company Secretary √ √ √ √
• Reviewing the results of the Company’s key controls
questionnaire and ensure appropriate action is taken
to address any weaknesses identified
• Monitoring compliance with statutory and continuing
listing obligations as stipulated under the Companies’
Act and by the Capital Markets Authority
• Reviewing the financial statements and recommending
their approval to the Board of Directors
• Reviewing and discussing with management and the
external auditor any significant events or transactions
affecting the Company’s financial reporting
• Considering findings from the external and internal
auditors on any material weaknesses in accounting
and financial control systems
• Reviewing the independence, objectivity and
effectiveness of the external auditor, including their
quality control procedure and steps taken to respond
to changes in regulatory and other requirements
• Overseeing the activity and credentials of the
Company’s internal audit division, including the review of
the internal audit charter, code of ethics, plans, resource
requirements, staffing and organisational structure
• Receiving reports on the status of significant audit
findings, recommendations and management’s
responses

SAFARICOM ANNUAL REPORT 201530
CORPORATE GOVERNANCE STATEMENT02 / BUSINESS
REVIEW
BOARD EFFECTIVENESS (continued)Special CommitteesThe Board is authorised by the Company’s Articles of
Association to form ad hoc or special committees to
deal with specific matters for a defined term period. The
Board retains oversight authority over such committees
and can disband them as and when deemed necessary.
Company SecretaryThe Company Secretary’s roles and responsibilities
include:
• Providing a central source of guidance and advice
to the Board, and within the Company, on matters
of statutory and regulatory compliance and good
governance
• Providing the Board as a whole and to Directors
individually with detailed guidance as to how their
responsibilities should be properly discharged in the
best interests of the Company
• Facilitating the induction training for new Directors
and assisting with Directors’ professional development
as required. This includes identifying and facilitating
continuous Board education
• In consultation with the CEO and the Chairman,
ensuring effective flow of information within the Board
and its committees and between senior management
and Non-Executive Directors. This includes the timely
compilation and distribution of Board papers and
minutes, as well as communication of resolutions from
Board meetings
• Ensuring proper development of Board meetings and
providing Directors with clear advice and information
• Guiding the Company in taking the initiative to not only
disclose corporate governance matters as required
by law, but also those of material importance to the
decision making of institutional investors, shareholders,
customers and other stakeholders
• Keeping formal records of Board discussions and
ensuring timely execution of actions agreed
Board of Directors shareholdingDirectors can purchase or sell shares of the Company in the open market. As at 31st March 2015, Board members
shareholding was as follows;
DIRECTOR SHAREHOLDING
Nicholas Nganga 855,100
Robert Collymore 908,000
Michael Joseph 2,357,000
Henry Rotich 2,200
Esther Koimett 517,600
Nancy W Macharia 43,000
31
Ethics Committee Meetings and members attendance for 2014/15COMMITTEE MEMBER POSITION 29TH APR 2014 4TH SEPT 2014 18TH DEC 2014
Robert Collymore - Chairman CEO √ √ √
John Tombleson CFO √ √ -Joseph Ogutu Director, Strategy and Innovation √ √ √
Roy Masamba Director, Resources - √ √
Nicholas Mulila Director, Risk Management √ √ √
Denish Osodo* Director, Internal Audit - √ √
Nzioka Waita Director, Corporate Affairs - - √
Patrick Kinoti - Secretary HOD, Ethics and Compliance √ √ √
*Denish Osodo joined the Committee on 4th September 2014
Ethics CommitteeThe Ethics committee comprises seven members of
the Executive Committee and is chaired by the CEO.
The Committee plays an oversight role on behalf
of the Company with regard to matters of ethics,
integrity and best business practices. The Committee
provides strategic direction to the organisation on
ethics and Integrity, and in particular on matters that
touch on the following;
• Code of Conduct and business practices
• Guidance on enforcement of the provisions of the
Code of Conduct, particularly with regard to
conflict of interest declarations and disclosures
made by employees pursuant to the Code of
Conduct
• Promotion of a culture of ethics and integrity within
the organisation and by business partners
• Ethics advocacies to the wider business community
in Kenya through the United Nations Global
Compact (UNGC)
• Resolution of major ethical dilemma in the
organisation

SAFARICOM ANNUAL REPORT 201532
RISK MANAGEMENT02 / BUSINESS
REVIEW
Risk management is a critical function of Safaricom’s business and is entrenched in our strategy and operations. Our Risk Management division ensures that all risks are managed optimally and oversees overall compliance with the Company policies, good corporate governance and corporate security.
STRATEGIC RISKSRisk assessments at Safaricom are conducted twice in a year in conjunction with the Company’s business units and other stakeholders. This involves the scrutiny and proactive oversight of a number of key elements of Safaricom.
The assessments identify various risks, their chances of occurrence, potential impact and capability of measures set to tackle the risks. Furthermore, planned mitigations are tracked for implementation and reported to the Board
Audit Committee.
CompetitionThe industry has become increasingly competitive
both in terms of service delivery and product offerings.
Safaricom encourages healthy competition since it is
core in ethical business practice.
Statistics from the Communications Authority of Kenya
(CA) quarterly industry report confirms that competition
in Kenya’s telecoms industry is active and healthy as
shown in the table below.
Some of the key highlights from the report include;
• Safaricom has lost ground in 4/8 reported
market parameters
• Airtel has seen declines in 2/8 parameters
• Orange has gained in all parameters
• Safaricom grew total subscribers, including data
customers, and minutes. But lost on subscriber market
share
• Orange had the highest ‘organic growth’ growing
voice minutes by 170% and subscribers by 52% .
We have invested heavily in improving our network
quality and distribution channels to ensure our customers
get the best products in the market. We also seek to
grow and retain our customer base by leveraging on
strategic partnerships within the financial sector in the
effort to continue offering superior and innovative
products that resonate well with our customers.
Industry performance summary: March 2015 versus March 2014
Safaricom Airtel and YU Orange EquitelMar ‘15 Mar ‘14 % Mar ‘15 Mar ‘14 % Mar ‘15 Mar ‘14 % Mar ‘15
Market share by subscribers (%) 67.1 67.8 -1% 20.2 24.2 -17% 10.8 8 35% 1.9
Mobile subscribers (millions) 23.3 21.6 8% 7 7.8 -10% 3.8 2.5 52% 0.7
Market share by Voice minutes (%) 71.7 78.5 -9% 21 18.5 14% 7.1 3.1 129% 0.2
Total minutes (billions) 6.28 6.02 4% 1.84 1.42 30% 0.62 0.23 170% 0.009
SMS market share (%) 91.6 96.4 -5% 6.9 3.1 123% 1.3 0.4 225% 0.1
Total SMS (billions) 6 6 0% 0.45 0.2 125% 0.09 0.03 200%
Mobile Data market share (%) 65 72.1 -10% 18.5 17.6 5% 13 10.3 26% 3.6
Total Mobile Data subscriptions (millions) 12.1 9.6 26% 3.5 2.3 52% 2.5 1.4 79% 0.6
Mar ‘15 *Oct ‘14 % Mar ‘15 Oct ‘14 % Mar ‘15 Oct ‘14 % Mar ‘15
Mobile Money subscribers (millions) 20.6 20.1 2% 3.1 3.2 -3% 0.19 0.19 0% 0.6
Mobile Money market share (%) 76.2 77.3 -1% 11.5 12.3 -7% 7.2 7.3 -1% 2.2
*CA reporting on Mobile Money started in October 2014
33
Regulatory environment The Regulatory environment that Safaricom operates
in is increasingly becoming complex and we made it
an area of focus during the financial year. The nature
of our industry and the types of products and services
that we provide require us to comply with a wide range
of rules and laws, including Licence conditions, sector
Regulations, by-laws and legislation.
While we will comply with all Regulations and applicable
laws, we will continue to build constructive, respectful
and open relationships with all regulators while adopting
a firm approach on issues that we consider may be
detrimental to industry growth.
In December 2014, the CA began a comprehensive
review of the Regulations governing the Information
and Communications Technology (ICT) sector. These
reviews were ongoing at the end of the financial year
under review. These proposed Regulations addresses
Fair Competition, Tariffs, Licensing, Universal Service,
Broadcasting and Consumer Protection.
Safaricom is particularly concerned with the proposed
Fair Competition and Tariff Regulations based on
the draft by CA. In their current format, these two
Regulations seek to remove the test of abuse of
dominance and will automatically punish successful ICT
players with significant market share.
We believe this is inconsistent with international best
practice and Safaricom will continue to engage with
the CA, ICT Ministry and Competition Authority of
Kenya (CAK) to ensure that proper Regulations are
passed. These Regulations need to promote innovation,
investment and ensure customers enjoy the very best
offerings in terms of variety, price and quality through
healthy competition.
Economic growth prospectsKenya has maintained a stable macroeconomic
environment amid challenges coming from a volatile
currency and rising interest rates that continue to
negatively impact on various sectors in the economy.
Monetary policy interventions have in the past eased
these concerns, but as a business we continue to
proactively observe and mitigate these challenges. This
has cushioned our business and customers.
OPERATIONAL RISKSSecuritySecurity is at the core of Safaricom’s day-to-day
operations and is enshrined in our comprehensive
Occupational Safety and Health policy (OSH). Recently,
terrorism related issues have adversely affected the
country and businesses alike. To this end, Safaricom has
invested immensely to ensure staff, critical assets and
other interests are protected at all times. We continue to
work closely with Law Enforcement Authorities to secure
our assets and defend the interest of our customers.
Information securityAt Safaricom, we have in place information security,
preventive and detective measures on all our
platforms. The deployment of these controls is based
and commensurate with the services offered and
information processed. Our ISO 27001 Information
Security certification is an independent confirmation to
our customers that we have implemented appropriate
processes and controls relating to our cloud services,
billing and customer support services to protect the
privacy of their information. Of particular interest are
robust cyber security controls accompanied by a full-
time in-house monitoring, including round the clock
monitoring of our M-PESA system, to safeguard the
services offered to our customers and the nation.
Safaricom complies with the laws regarding protection
of customers’ privacy and consumer data in line with
Article 31 of the Constitution of Kenya and the Kenya
Information and Communications Act. Safaricom also
complies with the customer privacy terms as set in
its operating licence issued by the Communications
Authority of Kenya (CA).
The Company has put in place a Data Protection Policy
in anticipation of the enactment of a Data Protection
law in Kenya, The policy has a Data Privacy Statement
detailing how data in Safaricom’s possession is collected,
used, stored and disposed of, among other things.
Business continuity and crisis managementThe need to guarantee availability of our products and
services at all times is critical to our operations. We have
in place the Business Continuity and Crisis Management
plan, which ensures availability of all Safaricom services
and products in event of disasters or failure of our
systems. The ISO 22301 Business Continuity (covering

SAFARICOM ANNUAL REPORT 201534
RISK MANAGEMENT02 / BUSINESS
REVIEW
Voice, Data, SMS and Cloud services) and ISO 27001
Information Security Management System (covering
Cloud services, Billing services and Customer Support)
certifications of 2014, underscores the proficiency and
relevance of our plan.
To enhance our response capability, Safaricom has a
Crisis Management Team (CMT) that ensures appropriate
disaster responses are implemented and timely
communication circulated within the Company and to
other stakeholders.
Throughout the year, substantial internal audit efforts
were directed towards assurance on significant and
ongoing projects in the Company. This was aimed
at supporting project efficiency, pre-implementation
reviews and data migration assurance.
Ethics and ComplianceBuilding on the foundation set in previous years, we
continued with our ethics plans covering all members of
staff and key business partners.
The following were the key highlights in the year;
• Ethics awareness programme targeting all members of
staff and key business partners
• Training sessions for all our staff and key business partners
• Conflict of interest declaration covering all staff and
the Board members
• Ethics perception survey that is expected to inform our
ethics and integrity programme for the next two years
• Advocacy initiatives through the United Nations
Global Compact (UNGC) local chapter, which aims at
improving the ethics and integrity standards within the
wider business community
• Additional reporting lines to support our whistle-blowing
channels to capture unethical conducts
We have zero tolerance policy on fraud. To boost our
fight against fraud, we have invested in systems that
assist in detecting fraudulent activities and arresting
cases before they affect the Company.
To improve customer experience, we work closely with
the law enforcement authorities to ensure that fraudsters
targeting our customers are arrested and taken to court.
This has led to a drastic reduction in fraudulent activities
targeting our customers.
Whistle-blowingWe have an ethics hotline that is managed by an
independent accredited institution.
Through the hotline, anonymous reports on unethical/
fraudulent behaviour can be made. The hotline reports
are forwarded to Safaricom based on an arrangement
that ensures the information is not sent to the suspected
persons. The individual reports are then channelled
to the following; Director-Risk Management, CEO, or
Chairperson of the Board Audit Committee, depending
on the nature of the breaches.
Whistle blowing statistics are reported to the Ethics
Committee and the Board Audit Committee quarterly.
Staff and business partners are regularly sensitised on the
need to report on unethical business practices and how
to make such reports.
Code of Conduct and EthicsWe have a Company Code of Conduct that governs
ethical conduct of all employees. Employees are taken
through various aspects of the codes every year as part
of the company-wide ethics awareness programme. All
members of staff must commit to abide by the code of
ethics when joining Safaricom.
Responsible market practicesOur Code of Conduct and ecosystem charter offer
guidance on what constitutes acceptable market
practice. All employees and business partners engaged
in selling are regularly sensitised on what constitutes
ethical selling practices. The sales process is regularly
reviewed to confirm its compliance with the requirements
of the code.
We also have a supplier code of ethics to guide conduct
of suppliers while dealing with Safaricom. The code
covers elements such as conflict of interest, health
and safety, labour standards, anti-corruption and
environmental protection. Every two years, Safaricom
performs due diligence on our suppliers to ensure that
they are abiding by the code. We also regularly hold
sessions with our suppliers to ensure that they are aware
of the code.
OPERATIONAL RISKS (continued)
35
INTERNAL AUDITThe Internal Audit division reports directly to the Board. The division provides assurance on the internal control environment and risk management processes of the business, deepens good governance practices and supports the organisation to achieve best in class controls through continuous engagement.
The independence of Internal Audit is enhanced through governance support from the Board Audit Committee to which the function reports.
During the financial year under review, 19 planned audit reviews were conducted to appraise the adequacy, design and operating effectiveness of controls. In
addition, 11 reviews were undertaken at the request of stakeholders.
The audit reviews related to:
• Customer value management
• Procurement
• Cyber security
• Network operations
Significant effort in the year was directed at project assurance on significant Company projects.
Anti-corruption measuresWe have a company-wide framework that guides our risk
monitoring and correction measures. In the year under
review, we engaged in the following anti-corruption
monitoring measures;
Anti-corruption monitoring measures FY13 FY14 FY15
Fraud risk assessments 12 12 7
Fraud reviews 12 13 6
Special request reviews - 3 11
Investigations were conducted where unethical action
was suspected during the year. The investigations covered
various forms of fraud including asset misappropriation,
fraudulent expense claims and corruption cases.
The investigations led to disciplinary action against
any staff involved in misconduct and some cases were
forwarded to the law enforcement authorities, leading
to prosecution.
Anti-corruption corrective measures FY13 FY14 FY15
Fraud cases investigated 49 89 29
Outcomes of investigations:
Disciplinary warnings 8 16 13
Dismissals 55 56 58
Cases reported to law enforcement agencies
28 7 4
It is pleasing to note that the overall number of cases
dropped during the year.
An independent ethics perception survey was
conducted by the Ethics Institute of South Africa in
January 2015. The purpose of the survey was to measure
the ‘ethical climate’ within Safaricom.
We are pleased to report that the survey has become
even more representative with 77% of all Safaricom
employees (3,474) participating in the survey, up from
44% in 2012.
Anti-corruption preventive measures FY13 FY14 FY15
Ethics perception survey (% of total staff)
- - 77%
Ethics and anti-corruption staff training (% of total staff)
60% 94% 94%
High risk departments - 98% 97%
Medium risk departments - 81% 83%
Business partner ethics sessions
• Suppliers - 86 115
• Dealers - - 138
• Agents forums attended - 7 10
Ethics trainingAll members of staff at Safaricom are expected to attend
a training sessions on ethics at least once a year. In the
past two years, we have been able to achieve a 94%
attendance rate. Most of the training was done through
face-to-face sessions and backed by e-learning courses.
The awareness training is tailored to address the specific
ethics risks faced by the attendees. For high corruption-
risk departments, the training focuses on anti-corruption
and bribery.

SAFARICOM ANNUAL REPORT 201536
CHAIRMAN’S STATEMENT01 / HIGHLIGHTS

SAFARICOM ANNUAL REPORT 201536
CHAIRMAN’S STATEMENT01 / HIGHLIGHTS
37
STRATEGICREVIEW
03

SAFARICOM ANNUAL REPORT 201538
OUR OFFERINGGrowing our customer baseOur customer base continues to grow as a result of efforts
centred on retaining and rewarding loyal customers. We
grew our customer base by 8% to 23.3 million. According to
the Communications Authority of Kenya (CA) December
2014 report, we have the largest subscriber share of 67.4%.
VoiceVoice continues to be the largest revenue generator with
Voice service revenue growing 4% to Kshs 87.4 billion, an
increase attributed to 8% growth in our customers, a strong
and convenient Prepay airtime distribution network of over
275,000 retail outlets where our customers can purchase
airtime and 42 retail shops where they get top-ups and
personalised services. Customers can also top up through
M-PESA, which continues to grow with 38% of airtime top-ups
done directly through M-PESA.
Unmatched ExperienceWe increased the number of customers accessing our Web
self-care to 2.7 million and also made our emergency airtime
top-up facility (Okoa Jahazi) more accessible where we
recorded a 32% increase in emergency top-ups.
MessagingOur SMS service revenue registered a double-digit growth
this year and grew by 15% to Kshs15.6 billion on the back
of 8% growth in 30-day active SMS users to 13.35 million,
34% increase in active SMS bundle users to 4.0 million and a
14.1% growth in SMS usage per customer.
Device acquisitionTo enable our customers to acquire smartphones and other
data-enabled devices, we introduced Flexi Bonga loyalty
programme where a customer can pay for a device with
part cash and part Bonga (loyalty points).
We also partnered with financial institutions to provide a
handset financing option for our customers.
4G high speed internetAt Safaricom, we are committed to making available best-
in-class quality of service to our customers. We launched 4G
in Nairobi and Mombasa, enabling our customers to access
and enjoy high speed internet. As part of the transition, any
customer with a 4G-enabled device can access a free 4G-SIM
Card at our retail stores.
Data bundle affordabilityBased on our strategic focus of putting the customer
first, we reduced our data bundle prices with the core
objective of making internet browsing affordable.
DELIGHTING OUR CUSTOMERS03 / STRATEGIC
REVIEW
Our philosophy at Safaricom is to ensure customers delight in our products and services. We have achieved this by continuously offering innovative solutions, best-in-class support, exciting promotions and aiming at exceptional customer experience.
39
RETAILER NETWORKAccess to our products and services by our growing customer base requires an
elaborate retailer network. We closed the year with over 275,000 retailers spread
across the country, offering a wide range of products and services.
ROBUST DISTRIBUTION CHANNELS Safaricom remains focused on the need to ensure accessibility for our customers across the country. Our customer reach has grown significantly over the past year, supported by an expanded dealer network, retailer footprint, M-PESA agents and Safaricom retail shops.
SAFARICOM RETAIL SHOPSShops continue to be strategic
customer touch-points,
providing customer care
services, Safaricom products
and a wide range of ancillary
cellular devices and products.
We closed the financial year
with 42 shops.
DEALER NETWORKSafaricom’s dealer outlets have proven effective in reaching the retail network. This year we undertook various initiatives aimed at ensuring our customers access quality products and services through our dealer network. These initiatives include;
• Dealer support through partnerships with financial institutions where dealers were facilitated to acquire motorbikes through co-payment schemes
• Training of dealer managers and line staff on Branch operations and stock management. The aim was to equip dealers and their staff with management skills and customer service skills
• We have over 60 dealer points that offer personalised service
• Our annual Dealer of the Year Awards (DOYA) which recognises star performers and entrench loyalty
• Facilitation of access to working capital support geared towards ensuring dealers meet customer needs
OUR REACH
M-PESA AGENT NETWORKTo ensure easy access to
M-PESA in line with our strategy
to deepen financial inclusion
and live up to our brand
promise of “transforming lives”,
we grew our M-PESA agent
footprint by 6% to 85,756.
Initiatives rolled out to support
our agents include:-
• Sub-Agent Management:
As requested during our
various M-PESA Agent
Feedback sessions and
consultations with some of
the M-PESA Agents, we have
put together administrative
requirements that would
ensure uniformity and
proper management of the
sub-agents. We have also
provided a standard sub-
agent contract
• M-PESA Agency Credit:
Float financing provided to
M-PESA Agents to assist in
increasing their float levels
• M-PESA Agent Forums:
Regional M-PESA Agent
Principal forums carried
out in all the five regions
where they get a platform to
discuss issues affecting their
business
• Branding of agent stores /outlets
• Regional M-PESA Agent
Awards:
Presented to the top sub-
agents in each of the regions
as a reward for best business
practices and promoting the
brand

SAFARICOM ANNUAL REPORT 201540
CUSTOMER FIRST More than ever before, putting the customer first remains our utmost focus. The thrust is to embed the customer in each of our decisions by having an in-depth understanding of who our customers are and their needs.
PROVIDING UNMATCHED SERVICES Empowering our customers to solve their problems will
not only give them a worry-free lifestyle, but it will also
increase their confidence in our products and services.
Towards this, we have increased the number of our
face-to-face touch-points by empowering more than 60
dealer outlets to handle customer resolutions in addition
to our 42 Retail shops.
Empowering more dealers has gathered momentum
as we build more capacity to match the growing
demand. These initiatives continue to culminate in a
significant reduction in queue waiting time at the shops,
enhancing the best practice in face-to-face customer
service delivery.
MULTIPLE CHANNELS Safaricom has one of the largest state-of-the-art
insourced contact centre facilities in Africa. Our
Voice, SMS, Social Media, Email, Chat and IVR have
been revamped to increase efficiency levels. The IVR
tree was reviewed to make it more customer-friendly
and empowering our customers to solve their issues.
Additionally, we have increased USSD service, making
it an effective tool of solving customer issues at our
touch points.
SERVICE EXCELLENCEOur determination for quality customer service saw
Safaricom maintain its position as Kenya’s most admired
brand, with an overall brand equity score of 86% and
a Net Promoter Score (NPS) of 53%, according to an
internally commissioned research by Milward Brown
and TNS respectively. Additionally, Safaricom scooped,
for the second year running, the coveted Kenya Social
Media Awards (SoMA) in the following categories:
• Best Customer Service on Twitter
• Best Customer Service on Facebook
• Best Social Media Personality for the Safaricom CEO
We continue to set the pace in service excellence, which
is attributable to the right attitude by our staff, exciting
promotions and offers, excellent shop ambience and
professional handling of customers.
Looking ahead
• We will seek to innovate and offer personalised value propositions by empowering our customers to solve their problems through available channels.
• Improve retail queue waiting time and build digital touch points to match international standards.
• Remove call reasons into the call centre, further enhancing customer experience and setting unmatched standards befitting our esteemed customers.
• Robust acquisition of subscribers through empowering of our dealers to fully address customer needs.
03 / STRATEGIC REVIEW
DELIGHTING OUR CUSTOMERS
41
Safaricom has retained its leadership position in the provision of internet access to our customers. With our 3G network covering over 69% of population and the launch of the first ever 4G network in Kenya, we can promise a superior internet experience.
Looking aheadWe aim to:• Increase smartphones, 3G and 4G devices
penetration• Commercialise the Safaricom Home
Broadband proposition “The Big Box”• Nurture and expand partnerships with local
and global content providers
DEMOCRATISING DATA
DELIVERING RELEVANT CONTENTIn our quest to grow the internet browsing culture and
instil it as a habit, we embarked on various campaigns to
drive awareness and usage.
We ran a FREE YouTube campaign that allowed our
customers to watch videos on their mobile phones and
tablets FREE of charge. This campaign resulted in customers
increasingly using their smartphones to enjoy a second
screen experience for entertainment and news.
FIRST-HAND DATA EXPERIENCETo ensure that customers have a first-hand data
experience from Safaricom, we have bundled all devices
sold in our retail channels and in the open market with a
FREE Safaricom data bundle.
We also collaborated with Coca-Cola to make available
FREE data bundles on select Coke bottles with the aim
of growing our customer base of data users. This initiative
aimed at offering non-data users who possess data-
enabled devices, FREE data bundles to access the internet
for a period.
SMARTPHONESTo accelerate smartphone penetration, we were also
able to bring the cost of smartphones to under Kshs 5,000.
These among other efforts have seen our smartphone
users grow in the year by 98% to 3.4 million.
To further drive affordability as we delight our customers,
we partnered with financial institutions to offer device
purchase credit as well as enabling them to purchase by
redeeming their Bonga Points.
SUSTAINED GROWTHWe grew our mobile data revenue by 59% to Kshs 14.8
billion. This was attributed to:
• 21.2% growth in 30-day active mobile data users to 11.6
million – 50% of our customer base
• 3G and 4G-enabled devices in our network now
stand at 4.4 million
• Affordable data bundles that resulted in increased
data users to 4 million
• Increased data usage per customer of 38%

SAFARICOM ANNUAL REPORT 201542
BEST NETWORK IN KENYA03 / STRATEGIC
REVIEW
LEVERAGING ON A WORLD-CLASS NETWORK IN KENYA Our endeavour to deliver a world-class network to our customers saw us invest Kshs 33.7 billion in enhancing the capacity, coverage and the modernisation of our network. This enhances our customer experience in accessing our wide range of services. We have 92% coverage of our population on 2G and 69% on 3G.
2G, 3G and 4G network coverageWe continue to roll out 2G and 3G base stations and
now have 3,382 2G base stations, of which 1,943 are
3G-enabled. 4G has become a reality in Kenya, Safaricom
becoming the first operator to deploy the technology,
with 236 4G base stations in Nairobi and Mombasa.
We also deployed 33 security sites in 13 counties in key
security hotspots.
In the financial year under review, we invested Kshs
33.7 billion in the following capital expenditure projects:
2,010 km of fibre has been laid in key metro areas,
modernisation and upgrade of 2G, investment in 3G and
4G networks, new M-PESA (G2) platform and upgrades of
Information Systems.
Network modernisation and optimisationOur radio network is now 100% modernised. This was
undertaken to achieve the desired level in quality of
service allowing for activation of new features and
capabilities previously unavailable. In the past one
year, over 460 2G base stations have been modernised,
resulting in positive customer sentiments on improved
network experience. This will ensure that service
accessibility is guaranteed during peak hours. We have
also inculcated optimisation cycles driven by drive test
measurement to ensure that we continuously improve the customer experience.
3G enhancement and additional spectrumIncreased uptake of smartphones by our customers and
elevated appetite for data usage have necessitated
additional investments in our 3G infrastructure. This has seen
deployment of UMTS 900, which is an innovative solution
aimed at increasing our 3G capacity, enhancing its indoor
penetration. Additionally, following Essar acquisition, we are
now utilising the additional spectrum to provide the much
needed capacity as well as improve overall voice and
data performance for our customers.
Own fibre projectWe maintained our fibre deployment momentum in the
key metro cities of Nairobi, Mombasa, Kisumu, Nakuru and
Eldoret where we have laid over 2,010 km of fibre to date.
Our enterprise clients are benefiting from our own fibre
deployment through the roll-out of Fibre-to-the-Buildings
(FTTB) with over 720 buildings now connected. This has seen
enterprise clients migrated from leased fibre to our own
fibre, resulting in further cost reductions for Safaricom and
better pricing for our customers. Fibre-to-Homes has seen
seven pilot estates connected reaching 640 homes.
Network stabilityNetwork stability is at the heart of our customer care and
we have now deployed power back-up solutions such
as the high capacity and cyclic batteries to mitigate
power fluctuations. We are working with Kenya Power to
connect our base stations to the national grid with 94%
of our base station locations currently being served by
the grid. Additionally, we have deployed Low Voltage
Automatic Phase Selectors (LV APS) in 13% of our base
stations and deployed the free cooling solution in 12% of
our base station locations. On the data centre front, we
also invested in power redundancy where we now have
three of our data centres on tier 3 level of redundancy
and recently commissioned a new 224-Rack state-of-art
data centre.
M-PESA platform upgrade To provide a more stable and a higher capacity platform,
Safaricom embarked on an ambitious plan to relocate
its M-PESA servers from Germany to Kenya. Following
a rigorous project, the new platform was successfully
deployed in a one-of-its-own-kind delivery in April 2015.
We are already experiencing improved response times in
all M-PESA transactions, minimal delayed transactions and
a more stable system. The new platform will also allow for
faster and flexible deployment of new products.
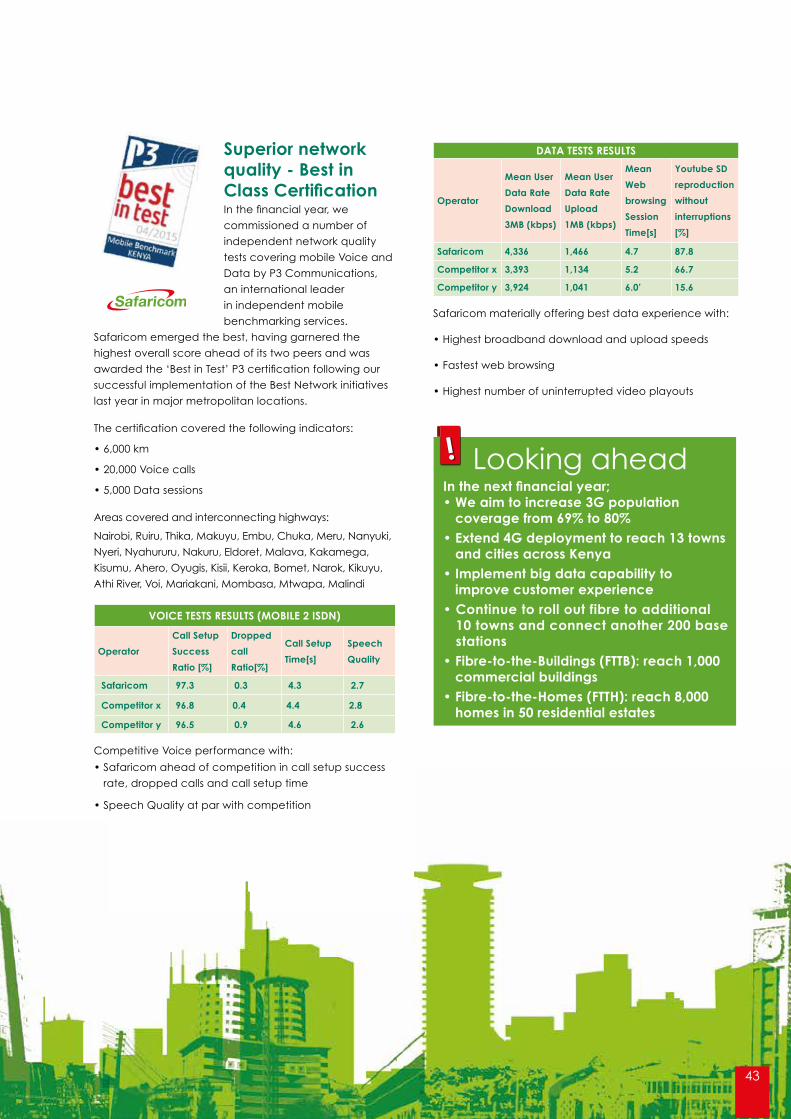
Superior network quality - Best in Class Certification In the financial year, we
commissioned a number of
independent network quality
tests covering mobile Voice and
Data by P3 Communications,
an international leader
in independent mobile
benchmarking services.
Safaricom emerged the best, having garnered the
highest overall score ahead of its two peers and was
awarded the ‘Best in Test’ P3 certification following our
successful implementation of the Best Network initiatives
last year in major metropolitan locations.
The certification covered the following indicators:
• 6,000 km
• 20,000 Voice calls
• 5,000 Data sessions
Areas covered and interconnecting highways:
Nairobi, Ruiru, Thika, Makuyu, Embu, Chuka, Meru, Nanyuki,
Nyeri, Nyahururu, Nakuru, Eldoret, Malava, Kakamega,
Kisumu, Ahero, Oyugis, Kisii, Keroka, Bomet, Narok, Kikuyu,
Athi River, Voi, Mariakani, Mombasa, Mtwapa, Malindi
VOICE TESTS RESULTS (MOBILE 2 ISDN)
Operator
Call Setup
Success
Ratio [%]
Dropped
call
Ratio[%]
Call Setup
Time[s]
Speech
Quality
Safaricom 97.3 0.3 4.3 2.7
Competitor x 96.8 0.4 4.4 2.8
Competitor y 96.5 0.9 4.6 2.6
Competitive Voice performance with:
• Safaricom ahead of competition in call setup success
rate, dropped calls and call setup time
• Speech Quality at par with competition
DATA TESTS RESULTS
Operator
Mean User
Data Rate
Download
3MB (kbps)
Mean User
Data Rate
Upload
1MB (kbps)
Mean
Web
browsing
Session
Time[s]
Youtube SD
reproduction
without
interruptions
[%]
Safaricom 4,336 1,466 4.7 87.8
Competitor x 3,393 1,134 5.2 66.7
Competitor y 3,924 1,041 6.0’ 15.6
Safaricom materially offering best data experience with:
• Highest broadband download and upload speeds
• Fastest web browsing
• Highest number of uninterrupted video playouts
43
Looking aheadIn the next financial year; • We aim to increase 3G population
coverage from 69% to 80% • Extend 4G deployment to reach 13 towns
and cities across Kenya• Implement big data capability to
improve customer experience• Continue to roll out fibre to additional
10 towns and connect another 200 base stations
• Fibre-to-the-Buildings (FTTB): reach 1,000 commercial buildings
• Fibre-to-the-Homes (FTTH): reach 8,000 homes in 50 residential estates

SAFARICOM ANNUAL REPORT 201544
DEEPENING FINANCIAL INCLUSION03 / STRATEGIC
REVIEW

SAFARICOM ANNUAL REPORT 201544
DEEPENING FINANCIAL INCLUSION03 / STRATEGIC
REVIEW
45
Sustained growthThe year witnessed sustained progress in driving financial
inclusion, with M-PESA having registered over 20 million
customers, contributing 20% of our total revenue
highlighting its significance as a key driver of growth. This
performance was driven by a 13.1% increase in 30-day
active M-PESA customers to 13.9 million coupled with
an increase in the average number of transactions per
customer. During the year, M-PESA agent outlets increased
to 85,756 further increasing our reach to customers.
Lipa na M-PESAThis is a payments collection service for corporate
organisations and merchants, which enables
organisations to accept payments via M-PESA and
transfer collected funds to either a bank account or to
the owner’s M-PESA account.
As at the end of the financial year, the service had
49,413 merchants who were active on 30-day basis. They
received payments of Kshs 11.6 billion in March 2015 for
goods and services.
Lipa na M-PESA has grown tremendously and is currently
the largest cashless service in Kenya in terms of number
of transactions, transaction value, number of customers
and active merchants. The service creates value for
both the merchants and their customers with key
benefits including:
• Merchant to merchant settlement
• Unmatched safety, which eliminates the risks
associated with handling and transporting cash
• Reduces losses and eliminates risk associated with
fake currency
• Enhances record keeping with details of every
transaction made readily accessible through statements
• Short and flexible settlement cycles. Most small
businesses want to use the funds collected on the
same day
• Addresses the challenge of high cost of point of
sale terminals
M-ShwariThe growth of M-Shwari has been remarkable. We now
have over 10 million customers on the service who
continue to enjoy savings and borrowing facilities.
M-Shwari Performance
March 2015 March 2014
Active customers 5.8 million 3.6 million
30-day active users 3.0 million 1.8 million
Net deposits 5.5 billion 3.5 billion
Loan balance 2.1 billion 1.2 billion
Non performing loans (%) 2% 3%
KCB M-PESASafaricom and KCB Bank Group launched the KCB
M-PESA account by the close of the financial year. The
service is part of financial inclusion initiatives undertaken
by Safaricom, offering our customers more credit options.
International Money Transfer (IMT)M-PESA registered subscribers enjoy sending and
receiving money from international partners. Safaricom
has partnered directly with Western Union, Money Gram,
Home send Hub, Vodacom Tanzania and MFS Africa Hub
to make this possible.
Looking ahead• Leverage on the new G2 M-PESA system• Drive growth of Lipa Na M-PESA • Drive uptake of saving & loans through
M-Shwari and KCB M-PESA• Grow business-to-business payments• Grow IMT within the region• Improve merchant real-time settlement to
banks on Lipa na M-PESA
Deepening financial inclusion remains at the core of our strategy. With the successful migration of the next generation (G2) M-PESA platform to Kenya, we will continue offering our customers superior and innovative financial services.

SAFARICOM ANNUAL REPORT 201546
ICT has been at the forefront of new innovations offering solutions to critical sectors of the Kenyan economy. Adoption of IT solutions by both Government and private sector businesses has presented Safaricom with low hanging fruit and an opportunity to give services to these customers and grow value to our shareholders.
Market snapshotInformation Communication Technology (ICT), has been
identified as an essential pillar to the achievement of
Vision 2030. Indeed, the Government has been leading
in ensuring the sector drives its economic agenda as
evidenced by our involvement in the National Police
Security Network Project. Adoption of payments by
public and private entities is opening up new business
opportunities in the enterprise segment of the business.
We are witnessing SMEs embracing new ‘M’ and
e-commerce platforms, which have revolutionised
commerce.
Impressive revenue growth Our nationwide reach in both subscriber numbers and
network, coupled with our extensive M-PESA ecosystem
continues to give us more opportunities to be the partner
of choice for Corporates, SMEs, Public Sector Players as
well as NGOs.
Leveraging on our extensive network and innovation,
we recorded full-year revenue for period ending 31st
March 2015 of Kshs 12.84 billion, which is a growth of 26%
compared to the previous year.
Our enterprise business now commands 49% of the
enterprise market share, up from 32% in March 2014. Key
to this growth was more than double-digit percentage
growth in enterprise data to Kshs 5.3 billion, representing
a growth of 26%, business related M-PESA revenue, which
grew by 86% to Kshs 2.8 billion and Voice revenue which
grew by 5% to Kshs 3.8 billion.
Government paymentsWorking with national Government in partnership with
county Government, we entered into a programme to
facilitate Government payments and revenue collection
under the digital payments platform. We now have a
county government penetration with 60% of the counties
using at least one enterprise solution.
Focus on SME segmentWe continued with our special focus on SME Segment
as a pillar of growth and we recorded an impressive
growth of 106% in SME customers to 64,125. This growth
was driven through our flagship SME proposition ‘Zidisha
Biashara’ and Lipa Na M-PESA which is the flagship SME
payment solution of choice.
PARTNER OF CHOICE FOR BUSINESS03 / STRATEGIC
REVIEW
47
Cashless distribution for CorporatesThe solution which works on M-PESA is aimed at increasing
efficiency, reducing cost of cash collection and cash
handling risk. It is being used by distributors of major Fast
Moving Consumer Goods (FMCG) and the fuel industry.
As at March 2015, we had key customers such as EABL,
Unilever, BAT, Nairobi Bottlers, Total, Shell, Oilibya and
Brookside with over 1,500 active distributors, driving Kshs
3.5 billion in volumes per month.
Unified communication platformWith our entrenched unified communication platform,
we launched an enhanced offering for corporates
with a new package dubbed ‘Safaricom ONEConnect
Business’. This product provides high quality fixed Voice
with added channels and dedicated internet. Key
customer benefits include internet and voice-over one
link and value-added services such as ringback tone.
As at the end of March 2015, we had over 400 SME
customers on this proposition.
Looking aheadIn the coming financial year, we will continue to grow our enterprise segment market share by leveraging on our existing capabilities guided by the following;
• Leverage on own fibre in key towns
• Accelerate commercialisation and growth of managed services
• Develop key vertical specific propositions to drive product penetration among corporates
• Drive fixed voice growth, leveraging on Fibre-to-the-Building
• Grow payments for business: retail, utilities, public sector and FMCGs

SAFARICOM ANNUAL REPORT 201548
03 / STRATEGIC REVIEW
STAYING AHEAD OF THE CURVE
Safaricom fosters an innovative culture within the organisation and partners with other innovators. This is paramount in enabling generation of new and exciting innovations that meet and exceed our stakeholders’ and customers’ expectations. Strategic partnerships and alliances
Safaricom M-ledger This is a partnership with Dynamic Data Systems, a
start-up from Safaricom Appwiz 2013. M-Ledger is an
M-PESA financial journal that provides Android phone
users with statements on their M-PESA accounts, search
functionality for Paybill, Bank to M-PESA and Lipa Na
M-PESA merchants. Launched in November 2014, the
application closed the year with over 120,000 users.
Intellectual property protectionSafaricom recognises that good ideas are difficult
to come by and strongly recommend that before
sharing the innovations, innovators protect their ideas
by legal means. Therefore to create more awareness
on intellectual property and how to safeguard ones’
innovations, we have formed a partnership with the
Kenya Industrial Property Institute (KIPI) and the Kenya
Copyright Board (KECOBO).
Additionally, through the innovations team, Safaricom
has carried out roadshows in several institutions
of higher learning including Strathmore, Technical
University of Kenya and the University of Nairobi. In the
coming financial year, we plan to roll out the same to
the remaining institutions in the country.
Safaricom AppstoreThe Safaricom Appstore was launched in June 2013.
Since then, we have increased partnerships with local
developers and organisations to promote applications
that have seen an increased uptake of our local
applications. Partnerships with OLX, Hello Food and Easy
Taxi have promoted locally relevant applications and
seen growth in downloads from Safaricom Appstore with
over one million downloads over the last financial year.
Safaricom Appwiz ChallengeSafaricom Appwiz Challenge runs annually with the aim
of building and nurturing early-stage start-ups in Kenya.
Since its launch in July 2014, the challenge has received
over 300 registrations by the close of the year.
A selection of four winners with solutions leveraging
on social innovation, cloud solutions, youth and
media engagement are awarded.
Currently we are working with start-ups to build and drive
usage of Data, SMS and increase engagement with
the youth. Some of the start-ups include Grand Winner
Magazine Reel with over 100,000 monthly users.
Safaricom Appwiz Challenge runs annually with the aim of building and nurturing early-
stage start-ups in Kenya
49
Safaricom AppstoreThe Safaricom Appstore was launched in June 2013.
Since then, we have increased partnerships with local
developers and organisations to promote applications
that have seen an increased uptake of our local
applications. Partnerships with OLX, Hello Food and Easy
Taxi have promoted locally relevant applications and
seen growth in downloads from Safaricom Appstore with
over one million downloads over the last financial year.
Safaricom Appwiz ChallengeSafaricom Appwiz Challenge runs annually with the aim
of building and nurturing early-stage start-ups in Kenya.
Since its launch in July 2014, the challenge has received
over 300 registrations by the close of the year.
A selection of four winners with solutions leveraging
on social innovation, cloud solutions, youth and
media engagement are awarded.
Currently we are working with start-ups to build and drive
usage of Data, SMS and increase engagement with
the youth. Some of the start-ups include Grand Winner
Magazine Reel with over 100,000 monthly users.
Zindua Café Portal
In January 2015, an innovation portal targeting external
innovators was launched to replace the previous
method of submitting ideas through emails. The launch
was themed around intellectual property: “How to
protect it and monetise it”. This was in conjunction with
the Kenya Industrial Property Institute (KIPI) and the
Kenya Copyright Board (KECOBO).
Design thinking methodology In the year, Safaricom adopted an integrated
engagement approach to innovation that includes
customer engagement, collective idea creation,
product prototyping and testing.
Building and nurturing innovative entrepreneurs: Spark Venture Fund We launched a Kshs 90 million venture capital fund that aims to support the successful growth and development of high potential mobile technology based start-ups in Kenya. The support is in form of capital investment and technical assistance.
TBL Invest was appointed as the fund manager and is responsible for sourcing, assessment, recommendation and management of the investment process. Start-ups will receive funding of between Kshs 6 million – 22 million.
Looking ahead• Continue to engage with internal and
external innovators• Introduce parental control of internet use
for children• Provide Sandbox for more developers to
connect and use SMS and USSD
Okoa Stima Okoa Stima is a partnership with the national electricity
distributor, Kenya Power, to provide micro-credit to
retail consumers allowing them to continue using
electricity services.

SAFARICOM ANNUAL REPORT 201550
EMPLOYER OF CHOICEOur strategy of transforming lives extends to our
employees and this is in line with Safaricom’s strategy
of improving peoples lives and communities. As a
world-class employer of choice, we go to great lengths
to ensure the needs of our workers are well met. We
adopt various best practices to create a friendly work
environment and encourage work-life balance.
Employee welfareThe Company continues to focus on improving
staff welfare;
• We have invested in facilities that make work
experience supportive of our excellent performance.
In the interest of promoting a healthy workforce,
employees have access to fully equipped
gymnasiums. We also have game rooms to unwind
and socialise. Employees who cannot access the
Company-owned gymnasiums due to their work
locations are facilitated to use third party facilities
• We have also revised our maternity leave policy
allowing working mothers maternity leave of four
months, up from three months. This can be accessed
together with the one month annual leave, making
it possible for the working mother to be away for five
consecutive months with full pay. On resuming work,
the mothers are allowed to work half day for
six months
Promoting a healthy lifestyle
At Safaricom, we value and treasure a healthy
workforce that is critical in ensuring the Company’s
performance is not compromised. In the year under
review, the Company facilitated medical camps
for employees in collaboration with medical service
providers. These camps provide employees with
opportunities for medical reviews and check-ups.
People Survey Results
%0 20 40 60 80 100
7975
5559
8181
9394
2014 2015
Employee NetPromoter Score
Manager Index
Response Rate
Engagement Index
People Survey Results
%0 20 40 60 80 100
7376
7268
"#
7063
Trust
Speed
Simplicity
2014 2015
03 / STRATEGIC REVIEW
STAYING AHEAD OF THE CURVE
People Survey ResultsPeople survey in the period under review compared
to the previous years.
Safaricom Way HeroesThere was an overall improvement in speed and simplicity. Trust remained at last year’s level.
• The engagement index measures each
employee’s pride, motivation, overall workplace
rating and intention to stay with Safaricom
• The manager index measures people
management and the aspects of team climate
that are within a manager’s control
• Employee net promoter score (NPS) measures the
overall willingness of employees to recommend
Safaricom’s products and services to other people
People SurveyPeople Survey offers employees a platform to make a
difference in the way the organisation is managed. It is
an additional platform for employees to comment on
issues that concern them and the business as a whole.
It also offers an opportunity for the management to
listen to employees and foster a culture of continuous
improvement.
In the year under review, the survey once again was
completed online and looked at the following trends;
• Feedback from the previous year’s survey
• The organisation climate measured through the
engagement index and the manager index
• Leadership capacity measured by manager index
• Safaricom’s position measured against global high
performing organisations.
51
Peter M Mimano SIMPLICITY (Posthumous)
Martin Gicharu Muiruri TRUST
Garissa Fire Exchange Rescue SPEED
Women In Technology CEO AWARD
National Police Service ProjectTRUST
Customer Care InnovationSIMPLICITY
Teams and individuals are recognised for exhibiting the values of speed, simplicity and trust
SAFARICOM WAY HEROES
We celebrate individuals who are outstanding and
demonstrate the Safaricom Way attributes of Speed,
Simplicity and Trust.
In the coming year, we will raise the bar and start to
showcase our best stories externally by participating in
the global Vodafone Heroes programme.
Clement Miano SIMPLICITY

SAFARICOM ANNUAL REPORT 201552
DIVERSITY AND INCLUSIONThis year, we made a deliberate effort to inculcate the
Safaricom culture within the organisation. We reviewed
what diversity and inclusion meant to customers,
colleagues and communities, taking into account how
Safaricom relates with them. To foster this culture, the
following priorities were reviewed:
• Being reflective of the communities we serve
• Inclusive leadership
• Career development
As a result, we had all staff trained in aspects of diversity,
inclusion and encouraged adoption of these priorities at
the work place.
In the spirit of inclusiveness, our Technology Division
enrolled six intern graduates with impaired hearing and
in the process the organisation reviewed the manner
in which all internal communications and events are
conducted. Currently all our events have a sign language
interpreter with videos now having subtitles.
The table below shows the head count and the gender ratios:
Employee Category FY 2014/15 2014 2015
No. of Employees 4,037 4,192
No. of Contractors 48 59
Total Employees 4,085 4,251
Gender Ratio FY2013/14 FY2014/15
Male: Female 1:1 1:1
Male: Female (Senior
Leadership Team)3:2 2:1
Male: Female (Head of
departments)3:2 2:1
CAPABILITY DEVELOPMENT An organisation’s competitive position hinges on its ability
to perform at a high level in differentiated ways and its
strategic success is enabled by distinctive organisational
capabilities. In today’s dynamic world, we face the
ongoing need to identify and develop new capabilities
to respond to changing customer demands and
competitive threats.
As a major player in the telecommunication market,
Safaricom has been very keen on building capabilities fit
for the current business needs as well as future business
needs. We have delivered value through a two-year
Safaricom People Development Programme, which covers:
• Safaricom employees development training that
targets personal effectiveness for entry-level staff
• Safaricom managers development that targets to offer
management and supervision skills
• Safaricom leader development aimed at senior
leadership
• Talent development programmes for the talent pool
We comply with all training and skills development
legislation in our efforts to drive the best quality training as a
means to transforming our business, industry and country.
In the year under review, we recorded an average
training index of 79% across the business against a target
of 78%, with an average training index of 48.2% for female
employees. This is higher than the training index achieved
last year of 32% . Our average training hours per employee
was 57.8, with our senior leadership team training hours
averaging 54.0.
Safaricom launched and implemented its Career Path
Framework, which has redefined how staff carry out
their competence assessments. Training is now aligned
to both their competence gaps and career paths.
We have a comprehensive training and development
programme to increase the employability and skills of
our staff. We also invest annually in the development of
16 new graduates under the new Safaricom Discover
Programme as well as learnerships to develop a talent
pool for our own business as well as contribute to the
overall regional and continental talent, leadership and
skills pool.
03 / STRATEGIC REVIEW
STAYING AHEAD OF THE CURVE
Looking ahead• Develop the right capabilities to ensure a
continuous transformation towards customer focus
• Build operational excellence, skills, product knowledge and innovation
• Develop talent for future rising stars as well as coaching culture within the organisation
• Implement a virtual Safaricom Academy in 2015, which will be a virtual knowledge centre for both our internal staff and external partners based on expertise
For us, health and safety makes good business sense and investing in it positively enhances our bottom line.
53
HEALTH AND SAFETY AT SAFARICOM
Health and Safety is core and a valued aspect that is deeply
ingrained in Safaricom’s culture.
We are committed to ensuring the health, safety and well-
being of not only our employees, but also that of our clients,
contractors and the general public who may be affected by
our operations.
We believe that all our stakeholders are entitled to an
environment where risks to their health and safety are
properly mitigated.
To us, health and safety makes good business sense and
investing in it positively enhances our bottom line, affording us
cost savings, efficient operations and enhanced employee
and contractor productivity.
Our focus for the year was on embedding our seven Absolute
Rules through the “I Pledge” Campaign.
The Absolute Rules were developed to focus on common
causes of fatalities and serious injury that could arise as a
result of exposure to any of the high risk activities associated
with our business. These are:
• Driving
• Working at height
• Electrical work
• Contractor activities
• Street and underground work
The campaign involved engaging staff to conduct an
honest self-assessment of their behaviour around the
Absolute Rules and aimed at eliciting a commitment to
observing them, not because the Company demands it,
but because they save lives.
The response was overwhelming with a notable increase
in Absolute Rules awareness level across the organisation
from 83% in the last financial year staff survey to 92% in the
current year.

SAFARICOM ANNUAL REPORT 201554
GROWING YOUTH APPEAL03 / STRATEGIC
REVIEW
Youthfulness is a symbol of hope, strength, dynamism and a bright future. At Safaricom, we are cognisant of the fact that the youth will remain a key driver of change in the business. Owing to the youth’s openness to change and innovation, they continue to shape the trends in music, fashion, entertainment and communication gadgets.
Sustained youth appealWe maintained our attractiveness to the youth with our youth brand equity at 79% and the youth Net Promoter Score (NPS) at 57% according to an internally commissioned research by Milward Brown and TNS respectively. To ensure affordability of Data to our youth customers, we reduced our mobile Data prices. These, among other initiatives, enabled us to acquire 1.28 million youth subscribers.
Owing to the dynamic nature of this segment, we maintained our innovativeness in crafting products which resonate with them. We relied heavily on our Data proposition to leverage on the youth preference to
communicate on various social networking sites using targeted campaigns to showcase our product offering. Some of these campaigns include;
• Safaricom games: a recruitment drive to download from our games portal
• Daily bundles meant to stimulate and push our daily bundles uptake
• Twitter campaign which targeted the recruitment of youth and Generation Y (GY) to the Twitter platform
• Safaricom MyTunes and Skiza offering premised on the youth preference for music downloads
• Youth-centric campaigns to push 10Mb bundle
Driving intent to purchase and usageDuring the year, we realised value for the business through effective youth-appealing marketing and advertising initiatives – fresh, creative, relevant and exceptional. We also positioned financial inclusion through youthful communication to drive uptake of products like M-Shwari and Lipa Na M-PESA. Our targeted Communications for Enterprise also had a focus on SMEs and leveraged on brand youthfulness attributes.
55
TARGETED CAMPAIGNSWe engaged in youth-targeted campaigns by
offering value through internet and content
proposition such as;
This is our major youth ambassador programme with a
presence in most towns. The programme has over 4,000
product youth ambassadors who in the financial year,
actively drove below the line activations and usage of
our products among the youth. They actively promoted
the following:
• M-Shwari
• MyTunes
• Bonyeza
• Alternative Customer Care Channels – USSD
and Social Media
The effectiveness of the programme was enhanced
through the Safaricom Activ8 App, especially in providing
information on Safaricom products and services.
A recruitment drive to
download from our games
portal targeting the youth.
To stimulate and push our
daily bundles.
Targeted the youth with
music downloads.
Youth-centric
campaign to push
10Mb bundle.
Targeted to recruit the youth and GY to
the Twitter platform.
Launch of the 4G
‘speed is good’,
especially for the
youth.
Targeted all segments
of our customers.
SAFARICOM GAMES
DAILY BUNDLES
TWITTERCAMPAIGN
SAFARICOMMyTunes
4G
10MB BUNDLE
NEW BUNDLETARIFF
SAFARICOM ACTIV8 CAMPUS YOUTH INFLUENCERS

SAFARICOM ANNUAL REPORT 201556
MUSIC ASSETSGROOVE WITH SAFARICOMAs part of Safaricom’s youth strategy, we
intend to get more engaged in activities
that will be geared towards building
the brand’s active engagement and
connection among the youth, thereby
enhancing Safaricom’s brand equity in this
crucial segment.
To this end, we partnered with the Groove
property which is a renowned, modern,
youthful and hip gospel music property
that attracts Kenya’s most celebrated
and influential gospel musicians and also
appeals to youth aged between 18 and
24 years across the social-cultural and
economic divide especially in the urban
and peri-urban areas.
Groove with Safaricom is an initiative that
seeks to celebrate and grow gospel music
talent in the country while at the same time
allowing us to engage with our customers.
The property has grown in stature and
allows us to reach a vast base of our
customers especially through Skiza.
Overall, it was a very successful property that
engaged over 100,000 people directly.
03 / STRATEGIC REVIEW
BRAND ASSETS
SAFARICOM JAZZ FESTIVALIn February 2014, the first ever Kenyan
Jazz festival was staged at the Safaricom
International Jazz Festival. Over eight local and
international classical Jazz musicians performed
for a week for 250 guests in an intimate setting,
leading up to the large outdoor jazz concert for
more than 5,000 fans at the Ngong Racecourse.
The aim was to bring a never-seen-in-Kenya
Jazz Festival at an affordable cost so that
Kenyans from all walks of life could attend. This
will begin and harness a Jazz culture amongst
our community members.
The 2014 event was very successful with an
opportunity to create a series.
57
In Kenya, most children who play a classical or
orchestral instrument have learnt to do so in school or by
attending music school or taking private lessons. For the
average Kenyan child, learning an instrument is often
a challenge due to cost and the inability to access the
instrument itself.
With this in mind, Safaricom CEO, Robert Collymore,
launched The Safaricom Youth Orchestra in April 2014.
The aim was to create an Orchestra that is world-
class and one that gives every child an opportunity to
showcase their talent.
We have brought together the best tools and resources;
distinguished music directors and tutors, facilities and
music instruments to all the children in the orchestra. The
platform will provide an opportunity for the children to
be nurtured and guided by highly qualified, motivated
and passionate music professionals and to obtain the
skills necessary to become Kenya’s next generation of
professional musicians.
Since May 2014, the orchestra has had more
performances and appearances than a typical standard
orchestra. The year was indeed a great one, with many
positive and promising developments for individual
members as well as collectively as an orchestra. The
success of the orchestra is in great part due to the
overwhelming support from parents, music teachers
and school administrations of the various members of
the orchestra.
The first public appearance was at the 2014 Safaricom
Groove Awards, barely a month after the very first
rehearsal. Many performances followed including at
the 2014 Safaricom Annual General Meeting, a Grand
Orchestra / Safaricom Choir concert and many more.
The orchestra has 65 members aged between 11 and 17
years drawn from all walks of life with more than 60% of
them from underprivileged backgrounds.
Safaricom Youth Orchestra continues to transform
the lives of the children – most of whom have been
able to build their talent and to have a fair chance at
enhancing their skills and talent. This has been made
possible by simply providing the same opportunity for
every child.
SAFARICOM YOUTH ORCHESTRA PROFILE

SAFARICOM ANNUAL REPORT 201558
03 / STRATEGIC REVIEW
BRAND ASSETS
SPORTS ASSETS
SAFARICOM 7s SERIESSafaricom has been a huge supporter of sports in this
country in line with our spirit of transforming lives. One
of the sporting disciplines we have always supported
overwhelmingly is rugby, more specifically the 7s.
Safaricom got involved with 7s Rugby six years ago and
over time we have seen the sport grow significantly
both in terms of the country’s rugby stature and also
the fan base. When it started off, we only had a fan base of 8,000 across the now famous Safaricom Sevens weekend to a whopping 42,000 in the last edition, which was expanded to include five local tournaments in the 7s circuit. Safaricom Sevens is the region’s largest sporting event.
The 7s series has been a success in growing the sport with new talent discovered and incorporated into the new-look 7s team and also significant growth of the fan base.
59
SAFARICOM ATHLETICS SERIESAs part of the Safaricom’s strategy of transforming lives, the organisation
set out to establish a property in partnership with other organisations,
whose aim was not only to transform lives, but also to increase the brand
love within the CORE target segment.
Towards this end, in 2013, Safaricom established the Safaricom Athletics
Series, which is an umbrella property that has merged different races
that Safaricom sponsored in an ad hoc manner. This year, a total of 15
long distance races were supported.
Last year, the series took a different turn and added short distance
races to its agenda, thus supporting three relay edition races under
the Safaricom Relays Edition. This was in addition to 14 races under the
Safaricom long distance races edition.
The Safaricom Athletics Series umbrella has grown and transformed
the lives of various athletes in the country, helping some to reach world
championships levels. To name a few: Dennis Kimetto launched his
athletics career during the Iten Road Run in 2010; Rita Jeptoo launched
her comeback race within the KASS marathon in 2012; and Beryl Wamira
and Simon Cherono broke world records during the Deaflympics Games
in 2013 in Bulgaria through training supported under the 2013 series.
The series has equally seen the growth in numbers of M-Shwari customers
in the year to 37,000 new activations. It has also supported revenue
growth within the Okoa Jahazi and Masaa ya SMS products within the
2014 edition as well as increased the brand equity.
SAFARICOM MARATHONThis is a Safaricom flagship asset which started off as a simple idea in 2000 and has grown into a world-renowned event. The marathon is exceptional in many ways; it combines an unusual fundraising initiative with one of Kenya’s greatest sporting passions - running!
The Safaricom Marathon allows participants from all over the globe to compete in an internationally acclaimed event whilst running through some of Africa’s most breath-taking scenery. As a result, it has developed into one of the country’s major sporting events with a reputation for being one of the 10 “must do” marathons in the world.
The marathon has stimulated and provided substantial financial help to a wide range of beneficiaries throughout Kenya, with a primary focus on northern Kenya. The impact has been huge and the benefits tangible.

SAFARICOM ANNUAL REPORT 201560
SOCIAL IMPACT03 / STRATEGIC
REVIEW
The two foundations work together to transform the lives of Kenyans. Safaricom Foundation invests in small-scale, short-term projects, which create lasting social, economic and environmental transformation, while M-PESA Foundation invests in larger projects through long-term grants in partnership with other organisations.
Both focus on areas of greatest needs while applying holistic but relevant approaches to deliver long-term and sustainable results. Together, the foundations give priority to strategic
partnerships. They work in partnership with national and
county Governments, the Civil Society Sector including
Non Governmental Organisations (NGOs), Community
Based Organisations (CBOs), corporates, corporate
foundations and Kenyan communities to improve the
quality of life. Both foundations are aligned with Kenya’s
Vision 2030, the UN Millennium Development Goals and
the Sustainable Development Goals.
SOCIAL IMPACT03 / STRATEGIC
REVIEW
SAFARICOM AND M-PESA FOUNDATIONS
61
Project Highlights
Kenyatta National Hospital Newborn UnitFounded in 1901, Kenyatta National Hospital (KNH)
has 50 wards, 22 out-patient clinics, 24 theatres (16
specialised) and Accident and Emergency Department.
209 out of the total bed capacity of 1,800 are for the
Private Wing. It has over 6,000 employees. It covers an
area of 45.7 hectares.
As part of the Kenya @50 legacy projects, Safaricom
Foundation granted Kshs 50 million in the last financial
year towards the rehabilitation and equipping of the
Newborn Unit.
The Kenyatta National Hospital’s Newborn Unit caters
for at least 100 babies per day. However, the neonatal
deaths at the facility have remained high over the years
due to poor infrastructure. The Foundation renovated the
unit and purchased the following medical equipment:
three NCPAP Machines (Pressure machine that provides
continuous positive airway to pre-term babies to open
their lungs), four oxygen blenders, one blood gas
analyser, one ultrasound machine, three resuscitators,
one neonatal ventilator, three cardiac monitors and four
syringe pumps.
Following the refurbishment and equipping of the
Newborn Unit, the facility can now offer better neonatal
services which are aimed at reducing neonatal and child
deaths. The unit was handed over by Her Excellency the
first Lady of Kenya, Margaret Kenyatta.
In 2013, Kenya was position 33 globally in under five
deaths in the Save the Children 15th Annual State of
the World’s Mother Report. The commonest cause of
neonatal deaths was said to be severe infections followed
by asphyxia, which is a severe deficiency of oxygen to the
body. Pre-term births and congenital anomalies followed.
SAFARICOM FOUNDATION Safaricom Foundation is the Corporate Social Responsibility arm of Safaricom and is funded by Safaricom Limited and Vodafone Group Foundation.
Safaricom Foundation unveils its new three-year strategyWith a footprint in all of Kenya’s 47 counties, and
a strong history of partnerships dating back to its
inception in 2003, the Safaricom Foundation has
worked with Speed, Simplicity and Trust to implement
over 1,000 community projects, impacting over three
million people, through the thematic areas of Health,
Education, Environmental Conservation, Economic
Empowerment, Water, Disaster Relief, and Arts & Culture.
During the year, the Foundation marked an important
milestone when it unveiled a three-year strategy aimed
at enabling the Foundation to maximise its impact and
transform the lives of Kenyan communities.
The three-year strategy which runs from April 2014 to
March 2017 will build on the strong history of results and
partnerships, and will contribute towards Vision 2030 and
the Sustainable Development Goals. It will also leverage
the power of innovation and technology to drive our
projects forward and offer a blend of grants, equity and
ultra-low cost loans to our partners.
The strategy spells out the areas Safaricom Foundation
will focus on for the next three years. It also outlines nine
strategic directions in which the Foundation intends to
make a significant contribution. These are: -
• Scale up the development and use of mobile
technology for development
• Increase access to equitable and innovative
educational opportunities
• Improve the health status of Kenyans and
economically empower young people
• Preserve and protect the environment
• Increase access to water in water-insecure counties
• Preserve, protect and enhance Kenya’s arts and culture
• Reduce suffering, disease and death due to disasters
and complex emergencies
• Develop as an effective corporate foundation
recognised as a leader in its field
The newborn unit can now offer better neonatal services which are
aimed at reducing neonatal and child deaths

SAFARICOM ANNUAL REPORT 201562
03 / STRATEGIC REVIEW
SOCIAL IMPACT
Mathari National Referral and Teaching HospitalMathari Hospital is a specialised National
Referral, Training and Research Public
Institution in mental health and the only
public health facility that solely caters for
patients suffering from mental disorders
in Kenya. It has a capacity of 700
in-patients and serves in excess of 60,000
outpatients annually. It is estimated that
at any given time, 10% of adults are
experiencing a current mental disorder
and that 25% will develop one at some
point in their lifetime.
Again, in partnership with the Kenya @50
Secretariat, the Mathari Hospital project
involved renovation of three wards; two
male and one female ward, purchase
of 100 beds and office furniture, fixing
the sewer system as well as upgrading of
laundry facilities at the hospital.
The renovation was geared towards
improved quality of life for the patients,
a recognition that a healthy mind is
the basis of relationships, productivity
and happiness. To deny mental health
patients treatment and compassion,
for any reason, sentences them to a
life of isolation, unemployment and
endless sorrow. The project was officially
handed over by H.E. Uhuru Kenyatta,
the President of the Republic of Kenya,
who promised an additional Kshs 50
million to renovate three other wards.
Hatua Likoni The Likoni Community Library is a community resource centre equipped
with over 6,000 books, nine reading tables, 100 seats and nine computers.
It offers the residents free access to books and a quiet study environment
seven days a week, from 9am to 8pm on weekdays and 10am to 5pm on
weekends. Safaricom Foundation supported the library to build shelves
and purchase primary and secondary school curriculum-based books at
a cost of Kshs 500,000. This aimed at supporting local students who cannot
afford textbooks.
Since launching the new curriculum books, the number of library users
increased from an average of 2,226 monthly to 6,614 users monthly.
The majority of the users are primary and secondary school students,
particularly those in Class Eight and Form Four. Students come from 108
schools. Some of the beneficiaries had the following to say;
“My name is Mary Awino. I go to Lake Star Academy and I am in Class Six.
I have been using the library for the past three years to read, study and to
complete my school homework. I am glad I have been able to complete
my homework, something which would have been impossible since I do
not have school course books at home. After school I come to the library
every day from 6pm to 8pm. I would like to urge the library to keep it up
and also add more books for Kiswahili and Insha. I also like the junior fiction
books; they have helped me to improve my English grammar.”
- Mary Awino, Class 6 - Lake Star Academy
“I am a parent of Tabitha Aswan, a Form Four student at Mwasere Girl’s
Secondary School. I would like to appreciate the library for offering our
kids a conducive environment for studies. I like the course and revision
books and I have personally come to the library and verified that indeed
we have good books. This will go a long way to motivate our young
ones as everything they need for studies is available in the library. The
homework helpers programme has also relieved parents of school work
questions, most of which we can no longer respond to as we left school
decades ago.”
- Lillian Ayango Adero, Parent
Safaricom Foundation commemorates Kenya’s Golden AnniversaryThe Safaricom Foundation commemorated the Golden Anniversary of Kenya’s independence by supporting two legacy projects at a cost of Kshs 100 million. The two projects were part of eight projects identified by the Kenya @50 Secretariat which are now hallmarks of the country’s Jubilee year.
Project Highlights (continued)
63
The M-PESA Foundation was established to promote
education, health and environmental conservation and
other social welfare initiatives in Kenya. The Foundation is
funded by interest earned on the profits of M-PESA.
During the year the M-PESA Foundation funded and
implemented the following projects:
• Construction of an ultra-modern library at Starehe Girls Centre
• Completion of Phase I of the Health Enablement Learning
platform to enhance training and upskilling of community
health workers in partnership with AMREF and Accenture
• Completion of Phase I of the Samburu Maternal and
Child Health Project in partnership with PharmAccess
Foundation and AMREF
• Completion of the fencing of 43.3 km at the Mau Eburu
Forest in Nakuru County
• The Integrated Food Security project in Kwale that
entails reconstruction of the Nyalani dam, economic
empowerment of the Kinango community and
improvement of health, hygiene and nutrition outcomes,
a partnership with Kenya Red Cross Society
During the year the following programmes were initiated;
• Commencement of the construction of the M-PESA
Academy that will deliver world-class Kenyan education
based on the KCSE system
• Phase II of the Health Enablement Learning platform
to enhance training and upskilling of community
health workers in Kenya; in partnership with AMREF and
Accenture
M-PESA FOUNDATIONRegistered in 2010 as an independent development charitable trust, the M-PESA Foundation invests in innovative large scale programmes in health, environmental conservation, education and integrated water projects. During the year, the M-PESA Foundation also celebrated its five-year anniversary.
M-PESA Foundation celebrates five years of doing moreThe Foundation commemorated five years since inception. Under the theme ‘Five Years of Doing More’, it took stock of the investments in the Kenyan community and resulting long-lasting and impactful transformation.
The M-PESA Foundation AcademyOnce completed, the M-PESA Foundation Academy will be a state-of-the-art, national, mixed boarding high school providing world-class Kenyan education based on the KCSE curriculum. Driven by leadership, entrepreneurship, technology and innovation, the Academy will serve talented but economically disadvantaged students with demonstrable leadership potential. The vision of the academy is to develop transformational leaders through innovative approaches to education. It will strive to be the top leadership development institution in the region that will attract exceptional, motivated and talented students. The first batch of students will be admitted in January 2016.
• Phase II of the Samburu Maternal and Child Health
Project to improve child and maternal health
outcomes in the entire county
M-PESA Foundation strengthens partnerships with corporate foundations and trusts During the year, in partnership with Department
for International Development (DFID), the M-PESA
Foundation brought together corporate Foundations
and Trusts in Kenya to explore opportunities for
greater impact in the different areas where they
work. Two meetings were held to improve synergies
and partnerships for greater and sustainable impact.

CASE STUDY
The fruit and flavour of Mau EburuAt independence in 1963, the Mau was one forest,
representing more than 40% of Kenya’s entire
forest cover. The Mau Eburu is one of the 22 blocks
measuring 8,715.3 hectares that was gazetted in
1932 as a national reserve.
When the Kenya Forest Service (KFS) mapped
the Reserve in 2009, it was estimated that 2,031
hectares of it had been degraded. This was through
extensive illegal activities like cedar logging,
charcoal burning, uncontrolled grazing as well as
increased human settlement.
This is Joseph Lengetu’s story. A member of the
Ndorobo community, part of the larger Ogiek
ethnic group. Lengetu and his family lived off the
forest lands. When the KFS surveyors arrived from
Nairobi, it was found that Lengetu and his kinsmen
had encroached the Mau Eburu.
“There was a time that you could stand here on
top of Ngobobo and all you would see was smoke
cloud. People cut down the trees to sell the wood
and make charcoal. We forgot that we were the
protectors of the forest”, laments Lengetu.
Driven to protect this important heritage, the Rhino
Ark Charitable Trust made a formal commitment
in December 2010 to fence the Mau Eburu’s 50 km
long perimeter. The M-PESA Foundation provided
a grant of Kshs 155 million for the fencing project,
the first of its kind in the Mau Complex. By ensuring
the full participation and involvement of people like
Lengetu, the 50 km fence has been completed.
“From the water tower, I can see the fruits of our
labour. The trees are growing and the animals are
safe. Our children are learning about conservation
and they have been asking us a lot of questions.
We have also become scouts for the Kenya Forest
Service and inform them of any illegal activity
happening in the forest”, says Lengetu.
“But they have also shown us how to store the
honey. We have also been introduced to markets
outside Eburu and we are earning money from
selling honey. Today we sell a kilo of filtered high
quality honey for Kshs 600”, he adds.
64
03 / STRATEGIC REVIEW
SAFARICOM ANNUAL REPORT 2015
SOCIAL IMPACT
65
THE 47 IN 1 PROJECT This is a corporate social responsibility initiative of
the Safaricom Technology division staff launched in
September 2014. The Division targeted to build one
computer lab in a public primary school in each of the
47 counties in Kenya, hence the 47 in 1 Project.
The division aims to reinforce community and the
public sector’s efforts to uplift education standards
and realise Safaricom’s vision of Transforming Lives. The
goal is ‘Equipping our Primary Schools with Technology
for Learning’, to enhance teaching at the school
community level, through a co-creation process with
students and their teachers.
To see the project to completion, the team came up
with creative milestone ‘checkpoints’ that create a
competitive yet productive team spirit amongst the more
than 680 members of the technology family for engaging
a primary school community in all the 47 counties, and
maintaining a sustained momentum to realise the goal.
The 47 groups were made up of 14 members from our
staff in any division and from our supplier ecosystem
who are equally passionate about transforming lives.
To enhance the chances of achieving the intended
results, the key stakeholders in each community are
identified and involved right from inception through
implementation. Their values and aspirations are
incorporated every step of the way.
Each of the 47 projects began by with making an initial
appearance to a school in the target community,
establishing the purpose for this project, and
encouraging them to narrate to the team their best
moments in the history of their school and the reasons
they are proud of the community. Together, the team
identifies the community values and what it will take to
realise these values, without forgetting what Safaricom
members value in transforming lives.
The cost of a solar-powered fully kitted container plus
installation costs is approximately Kshs 1.6 million, hence
the total amount to be raised, including logistical and
administrative activities and the support community
engagement came to Kshs 85 million. The energy-
efficient, solar-powered computer lab consists of 11
computers aimed at 10 pupil stations and one teacher
server station, networked and running on free software,
and is housed in a semi-permanent structure like a 40
foot container like pre-fabricated building.
Funds are being raised by each of the 47 teams at the
county level with a target of a minimum of Kshs 800,000
per county team. This has to be raised before the lab
implementation can begin to encourage community
ownership for sustainability. The other half is being raised
through corporate partnerships offering lab co-branding
sponsorship levels at the county level. As at the close of
the financial year, Kshs 68 million had been raised and the
first lab will be launched in August 2015 in Kiambu County.

SAFARICOM ANNUAL REPORT 201566
The Consumer Business Unit (CBU) is involved in a project dubbed Neema Children’s Project which targeted to transform two homes i.e Children’s Garden in Kawangware and Angel’s Centre for Abandoned Children in Dagoreti.
The CBU team came up with innovative ways to raise the funds and the main ones were:
•Car wash event
• Staff fundraising initiative
• Staff contributions through payroll
• Sale of T-Shirts
• Food donations
• Providing labour in the
construction of the dining sets
So far these activities have raised Kshs 5.1 million to support the above needs.
Fundraising will continue to cover the balance of Kshs 4 million to ensure the construction project is ongoing.
03 / STRATEGIC REVIEW
SOCIAL IMPACT
ANGEL’S CENTREThis centre caters for young abandoned children. It is run by a young lady, Wamaitha. The kids in the home are aged from 2 or 3 days to 4 years. The home also facilitates adoptions and so far has successfully facilitated the adoption of 11 children.
By the time CBU team came on board, the centre was home to 19 children.
The immediate needs in the centre were rent, food, milk, medical expenses and school fees, storage facilities and the children’s play area.
The team achieved the following at the Angel Centre: rehabilitation of the home, provision of children’s playground, additional storage for foodstuff and paid one year rent for the home, all at a cost of Kshs 1 million.
CHILDREN’S GARDENThe home is run by Mr Moses and his wife and has over 150 children on the property. There are both primary and secondary school going students. Among these are students who are soon completing Form four studies.
To raise some income, the home has a small farm for vegetables, a greenhouse, cows, rabbits and a cooking area that is also hired out.
At the time the CBU team came on board, the immediate needs of the home were: a secondary school block of four streams, a boys’ dormitory and a toilet block,
kitchen and dining restoration, food supplies and school books.
On the Children’s Garden, the team delivered new dining hall table seats as well as rehabilitation of the cooking equipment. The next project is construction of the boys’ dormitory which is scheduled to begin soon.
These initiatives have yielded exciting results by providing CBU team a forum to give back to the society either in kind or in cash. The cohesion and the productivity of the CBU team members is also expected to improve as they learn to work together.
NEEMA CHIDREN’S PROJECT
SOCIAL INNOVATION
67
mAGRICULTURE
Fertiliser E-SubsidyThrough competitive bidding, the Ministry of Agriculture,
Livestock and Fisheries (MoALF) awarded Safaricom
a consultancy for system development and capacity
building in December 2014.
The objective of the e-input subsidy management system
is to improve the disbursement of fertiliser subsidies to
smallholder farmers in Kenya.
This product will provide improved security, transparency
and efficiency over pre-existing manual systems in use
at the MoALF. Improved access to quality assured input
supplies will increase yields and productivity. The MoALF
aims to provide the service to between 3 million and
5 million Small Holder Farmers (SHF). This product will
change the lives of many Kenyans.
The solution uses different communication channels
like Mobile Originating (MO) and Mobile Terminating
(MT) SMS, USSD, M-PESA (B2C), web and other mobile
based applications. Interaction by users of the E-Voucher
System (farmers and agro dealers) is not specific to any
communication channel, for example agro dealers can
verify and redeem an e-voucher using a public USSD
service or a native or web-based mobile application.
The E-Subsidy Management System is delivered by linking
several ‘loosely coupled’ modules to a central database
to deliver an end-to-end solution.

SAFARICOM ANNUAL REPORT 201568
For us, sustainability continues to evolve and reflects our conviction that it is a journey, not a destination. From a strategic perspective, sustainability remains a symbol of our common commitment to our shared future, a positive principle that unites us as we recognise our responsibility to help shape that future.
We are convinced that continuously adding value to
the lives of our stakeholders through our technology,
products and services will go a long way in uplifting
the communities, corporates and individuals within
our ecosystem. We aspire to use our products
and services to transform lives and contribute to
sustainable living throughout Kenya. Based on this
fundamental aspiration, our vision sets out how we
use our ability to deliver connectivity and innovative
services to improve the quality of life and livelihoods
of the people we reach. Central to achieving this
vision is our commitment to managing our operations
responsibly and ethically. The following table defines our
sustainability framework.
SUSTAINABILITY03 / STRATEGIC REVIEW
OUR BUSINESS: What we do and why, how we do it, and the value we have created.
OUR MATERIAL MATTERS: The impacts and opportunities of greatest concern and significance to us.
Network quality Innovation Governance, risk and regulation Environmental impact
Our network is core to our
business. It allows us to
differentiate ourselves in a
competitive market and is
the medium through which
we transform lives.
Innovation is central to
achieving our strategic
objectives, retaining our
competitive edge and
ensuring that we continue
to grow.
Upholding the highest standards
of corporate governance and
acting in an ethical fashion is not
only our key responsibility as a
good corporate citizen, but also
makes business sense.
We understand that we
have an impact on the
environment and that
we have a responsibility
to mitigate our negative
environmental impacts.
OUR STAKEHOLDERS: The individuals, communities and organisations that are most affected by, or most likely to influence, our business.
Customers Employees Business partners Shareholders Society Regulators Media
Safaricom Participation in the United Nations Global Compact (UNGC) Safaricom is an active participant in the United Nations
Global Compact (UNGC), which is a strategic policy
initiative for businesses that are committed to aligning
their operations and strategies with ten universally
accepted principles in the areas of human rights, labour,
environment and anti-corruption. Our CEO, Robert
Collymore, has been recently re-appointed board
member of the UNGC. Beyond his mandate of strategic
guidance and promotion of the UN Global Compact,
he is also engaged as a member of the Anti-Corruption
Working Group that is advancing principle 10 to improve
on the ease of doing business globally; he is also a
member of the Africa Strategy team that is working
specifically to make sustainability and responsible
business relevant to Africa and has been increasingly
called upon as a thought leader and thought shaper
in the field of sustainability and responsible business –
setting a tone for honest and open dialogue.
United Nations Global Compact has achieved a number
of milestones in the last financial year, which include
initiatives in partnership with other members of the
network, development of the code of ethics for business
in Kenya, facilitation of multi-stakeholder dialogues
and partnerships to advance business sustainability,
knowledge development and best practice sharing,
capacity development of companies to enhance
sustainability performance, increasing private sector
sustainability knowledge and capacity to implement the
ten principles, and mobilising Kenya private sector voice
to the post-2015 development agenda.
ENVIRONMENTAL IMPACTManagement approachAt Safaricom, we recognise that environmental
considerations are not separate from our core business,
but an integral part of our overall business strategy.
Our approach is guided by our Environmental Policy,
which has been approved by Safaricom CEO and the
Executive Committee. Our response to this material
matter is primarily managed through:
• Energy consumption targets (of electricity, diesel
and water)
• Carbon footprint objectives (our greenhouse gas
emissions)
• E-waste collection and recycling targets
• Environmental Impact Assessments (of new
infrastructural developments)
• Environmental Audits (of existing infrastructure)
The Corporate Responsibility Department (CRD)
is responsible for managing the environmental
performance at Safaricom. The department falls within
the Corporate Affairs Division (CAD)and the Director is a
member of the Executive Committee.
69
We are the first telecommunications company in East Africa to attain
ISO 14001 certification
OUR ENVIRONMENTAL CONSIDERATIONS
Certification One of our major commitments last year was to achieve ISO 14001 certification for our Environmental Management System
(EMS) and we are pleased to report that this important milestone was achieved. The international ISO 14001 standard sets
out the criteria for an effective EMS and achieving full ISO 14001- certification provides our stakeholders with assurance that
our environmental impact is being measured and reported upon methodically and accurately.
Reporting on performance Auditing our network as part of our monitoring and evaluation of our environmental impact, we continued to undertake
Environmental Impact Assessments (EIAs) of our infrastructural developments, such as new Base Transceiver Stations (BTS)
and fibre optic networks, and Environmental Audits (EAs) of our existing infrastructure as required by National Environment
Management Authority (NEMA).
Managing our emissionsThe current scientific consensus is that global carbon emissions need to be reduced by 80% by 2050 to avoid catastrophic climate change and we are committed to being a responsible corporate citizen and visibly monitoring, reporting and reducing our carbon footprint to help meet this target.
E-waste campaign raises awarenessWe are delighted to report that more than 50 tonnes of E-waste (discarded
electrical or electronic devices and appliances) was collected during the year.
The dramatic increase in waste collected in comparison to last financial year was
as a result of a successful awareness campaign and collection road shows during
the year.
Improving water and waste management in our facilitiesOne of our objectives is to make our facilities as environmentally friendly and efficient as possible. During the year, we
commissioned an independent assessment of the water footprint and carried out an internal audit of the solid waste
streams of our main facilities: Safaricom House (our headquarters); the Jambo Contact Centre (JCC); and the Safaricom
Care Centre (SCC).
80% Percentage of
global carbon emissions that need to be reduced by 2050

SAFARICOM ANNUAL REPORT 201570
CASE STUDY
Managing our Energy Demands The availability of our network remains a critical necessity and we are pleased to report that our energy failure rate (power failures as a percentage of total failures) dramatically dropped during the year. Additionally, we met our target of reducing energy costs per site by 10% this year and continued to deploy a range of energy availability and efficiency initiatives throughout the network. Our assessment of managing our energy demands is evaluated from two perspectives: improving energy availability and
improving energy efficiency.
Improving energy availabilityThe excellent accomplishment of reducing our energy failure rate by 30% is as a result of a combination of initiatives, including our ongoing work with Kenya Power, investments in backup solutions such as deep cycle batteries and alternative energy sources. We also invested heavily in power redundancy at our data centres during the year, three of which have now achieved the highest level possible in the region, tier 3. The following table describes the mix of energy sources used throughout our network and it tracks the progress of our key energy availability-related initiatives, which are
described in detail after the table.
SUSTAINABILITY03 / STRATEGIC REVIEW
Network energy sources by site (total at year-end) FY13 FY14 FY15
KPLC* and genset 2,466 2,566 2,763
KPLC* (No generator) 297 303 323
24/7 diesel generator 79 17 41
Power cube (energy efficient generator) 34 79 91
Diesel generator/battery hybrid solution 6 13 11
Solar/wind hybrid solution 55 65 56**
Solar 12 12 36
Improving energy efficiencyAs our network continues to grow in size and sophistication, achieving energy efficiency will become even more important. Our vision is to create a powerful, streamlined network with minimal amounts of energy to meet demands of a growing array of services. Reflecting on our energy efficiency performance, 2015 is a year of maintaining the momentum achieved in 2014 and we are pleased to have achieved our target of reducing energy
costs per site by 10%.
Initiatives for improving energy efficiency One of our ongoing programmes is to replace our standard diesel generators with power cubes. These are extremely efficient hybrid energy systems in which all the power components are in one enclosure. The components (generator, fuel tank, DC power system, batteries and controller) are all factory-integrated to reduce generator runtime, human interference, prolong battery life, reduce fuel theft and enable remote monitoring. We converted a further 12 sites during the year, bringing the total to 91. We are also replacing our standard generators with newer, more efficient units.
We also rolled out the next phase of our Low-voltage Auto Phase Selectors (APS) initiative and a further 303 units were installed during the year, bringing the total number
of units to 478 across the network. These units allow our sites to utilise grid power at voltages as low as 110V, which reduces the instances and lengths of time for which our generators have to run considerably.
Another initiative that we continued with during the year was the installation of free cooling units. These units reduce the cooling energy requirement at sites by exchanging the warm air inside with colder air from outside. As most of our sites are in areas of moderate temperatures, it has been possible to achieve significant savings with these units, especially at night. We installed a further 235 units during the year, increasing the total number of operational units to 640.
One of our goals this year was to create an energy baseline for the network, which we can use to benchmark ourselves against other operators and to create our SMART energy management programme. Although this process has yet to be completed, we successfully audited the sites targeted for the year in June (large sites with average energy consumption levels of 15,000 kWh or higher), which represents approximately 30% of all sites and 60% of all energy consumed. The next step is to audit a sample of the remaining smaller sites and then create our energy baseline. We plan to complete this process and publish our first energy baseline in the coming year.
* Kenya Power and Lighting Company (National grid supply)** The reduction in hybrid sites is based on some of the wind sites not being functional. We will look at the business case (costs) to return functionality otherwise we
will convert these sites into solar.
71
Energy consumption
FY 15 98,018
FY 15 6,166,942
FY 14 113,800
Electricity (MWh)
Diesel (Litres)
FY 14 6,833,590
185
Environmental ImpactAssessments:
EnvironmentalAudits:
349E-waste collected:
50 tonnes
Scope 1 emissions
FY 14 FY 15
34,341 tCO2e
Scope 2 emissions 37,387 tCO2e
Scope 3 emissions 3,634 t
24,298 tCO2e
32,202 tCO2e
4,952 tCO2eCO2e
Totalcarbonfootprint
75,362 tCO2e 60,452 tCO2e
Carbon Footprint:Environmental performance
Solar and wind energy solutions deployed:
24 SITES
Power cubes (efficient hybrid energy systems) deployed:
12 SITES
Free cooling units installed:
235 SITES
Low-voltage Auto Phase Selectors (LV APS) deployed:
303 SITES
Deep cycle batteries installed:
300 SITES
Alternative energy solutions implemented
during 2015
Scope 1 emissions
Includes diesel consumed in our generators, the fuel
used in our fleet vehicles and the fugitive emissions
associated with our air-conditioning systems,
Scope 2 emissions
Includes indirect emissions associated with our
consumption of purchased electricity, and
Scope 3 emissions
Includes other indirect sources, such as air travel and
taxi hire.

SAFARICOM ANNUAL REPORT 201572
CHAIRMAN’S STATEMENT01 / HIGHLIGHTS

SAFARICOM ANNUAL REPORT 201572
CHAIRMAN’S STATEMENT01 / HIGHLIGHTS
73
FINANCIALREVIEW
04

SAFARICOM ANNUAL REPORT 201574
Directors’ report
Statement of Directors’ responsibilities
Report of the independent auditor
Financial Statements:
Consolidated statement of comprehensive income
Consolidated statement of financial position
Company statement of financial position
Consolidated statement of changes in equity
Company statement of changes in equity
Consolidated statement of cash flows
Notes to the consolidated financial statements
Shareholding information
Additional Information:
Notice of the Annual General Meeting
Directors and Senior Leadership Team
Corporate Information
Proxy Form
TABLE OF CONTENTS
75
76
77
78
79
80
81
82
83
84-132
133
136-137
138 -143
144
145
75
DIRECTORS’ REPORTFOR THE YEAR ENDED 31 MARCH 2015
The Directors submit their report together with the audited financial statements for the year ended 31 March 2015, which disclose the state of affairs of Safaricom Limited (“the Company”) and its subsidiaries (together, “the Group”).
PRINCIPAL ACTIVITIES
The principal activities of the Group are provision of telecommunication services, providing a comprehensive range of integrated telecommunication services, including mobile and fixed Voice, SMS, Data, Internet and M-PESA.
RESULTS AND DIVIDEND
The net profit for the year of Shs 31,871,303,000 (2014: Shs 23,017,540,000) has been added to retained earnings. No interim dividend was paid during the year (2014: nil). The Directors recommend the approval of a final dividend of Shs 25,641,874,000 (2014: Shs 18,830,751,000).
DIRECTORS
The Directors who held office during the year and to the date of this report were:
N Nganga Chairman
R Collymore Managing Director and Chief Executive Officer
N Macharia
S Mudhune
M Joseph
J Otty
H Rotich
S Timuray
G Ventura (Appointed 6 March 2015)
J Tombleson (Alternate to R Collymore)
E Koimett (Alternate to H Rotich)
S Sood (Resigned 6 March 2015)
AUDITOR
The Company’s auditor, PricewaterhouseCoopers, continues in office in accordance with section 159(2) of the Kenyan Companies Act.
By order of the Board
Mrs Enid Muriuki
SECRETARY
6 May 2015

SAFARICOM ANNUAL REPORT 201576
The Kenyan Companies Act requires the Directors to prepare financial statements for each financial year which give a true and fair view of the state of affairs of the Group and Company as at the end of the financial year and of its profit or loss for that year. It also requires the Directors to ensure that the Group and Company keep proper accounting records that disclose, with reasonable accuracy, the financial position of the Company. The Directors are also responsible for safeguarding the assets of the Company.
The Directors accept responsibility for the preparation and fair presentation of financial statements that are free from material misstatements whether due to fraud or error. They also accept responsibility for:
(i) Designing, implementing and maintaining internal control as they determine necessary to enable the preparation of financial statements that are free from material misstatements, whether due to fraud or error:
(ii) Selecting and applying appropriate accounting policies; and
(iii) Making accounting estimates and judgments that are reasonable in the circumstances.
The Directors are of the opinion that the financial statements give a true and fair view of the financial position of the Group and Company as at 31 March 2015 and of the Group and Company’s financial performance and cash flows for the year then ended in accordance with International Financial Reporting Standards and the requirements of the Kenyan Companies Act.
Nothing has come to the attention of the Directors to indicate that the Group will not remain a going concern for at least the next twelve months from the date of this statement.
Approved by the Board of Directors on 6 May 2015 and signed on its behalf by:
Nicholas Nganga Robert Collymore
Chairman and Managing Director Non-executive Director and Chief Executive Officer
STATEMENT OF DIRECTORS’ RESPONSIBILITIESFOR THE YEAR ENDED 31 MARCH 2015
77
Report on the consolidated financial statementsWe have audited the accompanying consolidated financial statements of Safaricom Limited (the Company) and its subsidiaries (together, the Group), as set out on pages 78 to 133. These financial statements comprise the consolidated statement of financial position at 31 March 2015, and the consolidated statement of comprehensive income, consolidated statement of changes in equity and the consolidated statement of cash flows for the year then ended, together with the statement of financial position of the Company standing alone as at 31 March 2015 and the statement of changes in equity of the Company for the year then ended, and a summary of significant accounting policies and other explanatory information.
Directors’ responsibility for the financial statements
The Directors are responsible for the preparation and fair presentation of these financial statements in accordance with International Financial Reporting Standards and with the requirements of the Kenyan Companies Act and for such internal control, as the Directors determine necessary to enable the preparation of financial statements that are free from material misstatements, whether due to fraud or error.
Auditor’s responsibility
Our responsibility is to express an opinion on the financial statements based on our audit. We conducted our audit in accordance with International Standards on Auditing. Those standards require that we comply with ethical requirements and plan and perform our audit to obtain reasonable assurance about whether the financial statements are free from material misstatement.
An audit involves performing procedures to obtain audit evidence about the amounts and disclosures in the financial statements. The procedures selected depend on the auditor’s judgment, including the assessment of the risks of material misstatement of the financial statements, whether due to fraud or error. In making those risk assessments, the auditor considers internal control relevant to the Company’s preparation and fair presentation of the financial statements in order to design audit procedures that are appropriate in the circumstances, but not for the purpose of expressing an opinion on the effectiveness of
the Company’s internal control. An audit also includes evaluating the appropriateness of accounting policies used and the reasonableness of accounting estimates made by the Directors, as well as evaluating the overall presentation of the financial statements.
We believe that the audit evidence we have obtained is sufficient and appropriate to provide a basis for our opinion.
Opinion
In our opinion the accompanying financial statements give a true and fair view of the state of the financial affairs of the Group and of the Company at 31 March 2015 and of the financial performance and cash flows of the Group for the year then ended in accordance with International Financial Reporting Standards and the Kenyan Companies Act.
Report on other legal requirementsAs required by the Kenyan Companies Act we report to you, based on our audit, that:
i) we have obtained all the information and explanations which to the best of our knowledge and belief were necessary for the purposes of our audit;
ii) in our opinion, proper books of account have been kept by the Company, so far as appears from our examination of those books; and
iii) the Company’s statement of financial position and statement of comprehensive income are in agreement with the books of account.
The engagement partner responsible for the audit resulting in this independent auditor’s report is FCPA Anne Eriksson – P/772.
Certified Public Accountants
Nairobi
6 May 2015
REPORT OF THE INDEPENDENT AUDITORTO THE MEMBERS OF SAFARICOM LIMITED

SAFARICOM ANNUAL REPORT 201578
Year ended 31 March
Notes 2015 Shs’000
2014Shs’000
Revenue 5 163,364,121 144,672,477
Other income 6 575,604 126,625
Direct costs 7 (a) (56,708,576) (51,963,714)
Other expenses 7 (b) (36,039,990) (31,892,090)
Earnings before interest, taxes, depreciation and amortisation (EBITDA) 71,191,159 60,943,298
Depreciation of property, plant and equipment 17 (21,850,707) (21,281,441)
Impairment of property, plant and equipment 17 (2,849,518) (4,083,905)
Amortisation – Licences 18 (542,902) (153,890)
Amortisation – Indefeasible Rights of Use 20 (327,032) (267,995)
Operating profit 45,621,000 35,156,067
Finance costs 8 (1,347,720) (1,882,358)
Finance income 8 1,772,589 1,695,412
Share of (loss) / profit of associate 19 (b) (4,041) 15,309
Asset purchase gain 30 107,717 -
Profit before income tax 46,149,545 34,984,430
Income tax expense 11 (14,278,242) (11,966,89)
Profit for the year (of which Shs 31,751,249,000 (2014: Shs 22,852,333,000) has been dealt within the accounts of the Company)
31,871,303 23,017,540
Other comprehensive income for the year, net of tax - -
Total comprehensive income for the year 31,871,303 23,017,540
Profit and total comprehensive income attributable to:
Owners of parent 31,871,303 23,017,540
Non-controlling interest - -
31,871,303 23,017,540
Earnings per share
- Basic and diluted (Shs per share) 12 0.80 0.57
CONSOLIDATED STATEMENT OF COMPREHENSIVE INCOMEFOR THE YEAR ENDED 31 MARCH 2015
79
At 31 March
Equity attributable to owners Notes 2015Shs’000
2014Shs’000
Share capital 13 2,003,271 2,003,271
Share premium 13 2,200,040 2,200,040
Retained earnings 74,431,346 68,201,917
Proposed dividend 14 25,641,874 18,830,751
Total equity 104,276,531 91,235,979
Non-current liabilities
Borrowings 15 490,762 5,102,380
Total non-current liabilities 490,762 5,102,380
Total equity and non-current liabilities 104,767,293 96,338,359
Non-current assets
Deferred income tax 16 (a) 1,666,417 2,750,879
Property, plant and equipment 17 (a) 107,756,919 97,710,542
Intangible assets – Licences 18 (a) 9,863,260 726,422
Intangible assets – Goodwill 18 (a) 219,151 219,151
Investment in associate 19 (b) 11,819 15,860
Indefeasible Rights of Use 20 (a) 4,848,505 4,855,097
Prepaid operating lease rentals 22 1,002 1,527
124,367,073 106,279,478
Current assets
Inventories 21 8,258,601 2,955,967
Receivables and prepayments 23 10,301,643 7,746,617
Cash and cash equivalents 24 14,030,309 17,618,884
32,590,553 28,321,468
Current liabilities
Payables and accrued expenses 25 41,423,899 29,473,060
Current income tax 617,216 1,276,527
Borrowings 15 10,149,218 7,513,000
52,190,333 38,262,587
Net current liabilities (19,599,780) (9,941,119)
104,767,293 96,338,359
The financial statements on pages 78 to 133 were approved for issue by the Board of Directors on 6 May 2015 and signed on its behalf by:
Director Director Nicholas Nganga Robert Collymore
CONSOLIDATED STATEMENT OF FINANCIAL POSITIONFOR THE YEAR ENDED 31 MARCH 2015

SAFARICOM ANNUAL REPORT 201580
At 31 March
Equity attributable to owners Notes 2015Shs’000
2014Shs’000
Equity
Share capital 13 2,003,271 2,003,271
Share premium 13 2,200,040 2,200,040
Retained earnings 75,584,707 69,475,332
Proposed dividend 14 25,641,874 18,830,751
Total equity 105,429,892 92,509,394
Non-current liabilities
Borrowings 15 490,762 5,102,380
Total non-current liabilities 490,762 5,102,380
Total equity and non-current liabilities 105,920,654 97,611,774
Non-current assets
Deferred income tax 16 (b) 1,653,376 2,737,839
Property, plant and equipment 17 (b) 107,724,849 97,618,163
Intangible assets – Licences 18 (b) 9,852,858 714,931
Investment in subsidiaries 19 (a) 837,341 745,891
Investment in associate 19 (b) 11,819 15,860
Indefeasible Rights of Use 20 (b) 4,757,055 4,855,097
Prepaid operating lease rentals 22 1,002 1,527
Loan to related party 27 (x) 633,408 707,906
125,471,708 107,397,214
Current assets
Inventories 21 8,258,601 2,955,967
Receivables and prepayments 23 10,101,896 7,709,309
Cash and cash equivalents 24 13,996,400 17,585,006
32,356,897 28,250,282
Current liabilities
Payables and accrued expenses 25 41,141,067 29,245,744
Current income tax 617,666 1,276,978
Borrowings 15 10,149,218 7,513,000
51,907,951 38,035,722
Net current liabilities (19,551,054) (9,785,440)
105,920,654 97,611,774
The financial statements on pages 78 to 133 were approved for issue by the Board of Directors on 6 May 2015 and signed on its behalf by:
Director Director Nicholas Nganga Robert Collymore
COMPANY STATEMENT OF FINANCIAL POSITIONFOR THE YEAR ENDED 31 MARCH 2015
81
Notes Attributable to owners of the Company
Sharecapital
Sharepremium
Retained earnings
Proposeddividends
Non- controlling
interestTotal
equity
Shs’000 Shs’000 Shs’000 Shs’000 Shs’000 Shs’000
Year ended 31 March 2014
At start of year 2,000,000 1,850,000 64,015,128 12,400,000 - 80,265,128
Profit and total comprehensive income for the year
- - 23,017,540 - - 23,017,540
Issue of new shares 13 3,271 350,040 - - - 353,311
Transactions with owners:
Dividends:
- Final for 2013 - - - (12,400,000) - (12,400,000)
- Proposed final for 2014 14 - - (18,830,751) 18,830,751 - -
- - (18,830,751) 6,430,751 - (12,400,000)
At end of year 2,003,271 2,200,040 68,201,917 18,830,751 - 91,235,979
Year ended 31 March 2015
At start of year 2,003,271 2,200,040 68,201,917 18,830,751 - 91,235,979
Profit and total comprehensive income for the year
- - 31,871,303 - 31,871,303
Transactions with owners:
Dividends:
- Final for 2014 14 - - - (18,830,751) - (18,830,751)
- Proposed final for 2015 14 - - (25,641,874) 25,641,874 - -
- - (25,641,874) 6,811,123 - (18,830,751)
At end of year 2,003,271 2,200,040 74,431,346 25,641,874 - 104,276,531
The notes on pages 84 to 132are an integral part of these consolidated financial statements.
CONSOLIDATED STATEMENT OF CHANGES IN EQUITYFOR THE YEAR ENDED 31 MARCH 2015

SAFARICOM ANNUAL REPORT 201582 SAFARICOM ANNUAL REPORT 201582
Notes Share capitalShs’000 Shs’000
Sharepremium
Shs’000
Retained earnings
Shs’000
Proposeddividends
Shs’000
Totalequity
Shs’000
Year ended 31 March 2014
At start of year 2,000,000 1,850,000 65,453,750 12,400,000 81,703,750
Profit and total comprehensive income for the year - - 22,852,333 - 22,852,333
Issue of new shares 13 3,271 350,040 - - 353,311
Transactions with owners:
Dividends:
- Final for 2013 - - - (12,400,000) (12,400,000)
- Proposed final for 2014 14 - - (18,830,751) 18,830,751 -
- - (18,830,751) 6,430,751 (12,400,000)
At end of year 2,003,271 2,200,040 69,475,332 18,830,751 92,509,394
Year ended 31 March 2015
At start of year 2,003,271 2,200,040 69,475,332 18,830,751 92,509,394
Profit and total comprehensive income for the year - - 31,751,249 - 31,751,249
Transactions with owners:
Dividends:
- Final for 2014 14 - - - (18,830,751) (18,830,751)
- Proposed final for 2015 14 - - (25,641,874) 25,641,874 -
- - (25,641,874) 6,811,123 (18,830,751)
At end of year 2,003,271 2,200,040 75,584,707 25,641,874 105,429,892
The notes on pages 84 to 132 are an integral part of these consolidated financial statements.
COMPANY STATEMENT OF CHANGES IN EQUITYFOR THE YEAR ENDED 31 MARCH 2015
83
Year ended 31 March
Notes 2015Shs’000
2014Shs’000
Cash flows from operating activities
Cash generated from operations 26 74,636,662 62,913,283
Interest received 8 1,292,085 1,140,069
Interest paid 8 (1,073,091) (1,494,836)
Income tax paid (13,853,092) (11,425,327)
Net cash generated from operating activities 61,002,564 51,133,189
Cash flows from investing activities
Purchase of property, plant and equipment 17 (a) (33,866,124) (27,780,723)
Acquisition of licences 18 (9,692,259) -
Investment in Indefeasible Rights of Use 20 (228,990) (1,116,411)
Proceeds from disposal of property, plant and equipment 93,835 45,725
Acquisition of a subsidiary 19 (a) (91,450) -
Acquisition of additional equity in associate 19 (b) - (551)
Net cash used in investing activities (43,784,988) (28,851,960)
Cash flows from financing activities
Proceeds from issue of shares 13 - 353,311
Dividends paid 14 (18,830,751) (12,400,000)
Proceeds from long-term borrowings 15 5,914,152 615,380
Repayments on long-term borrowings 15 (7,889,552) (8,227,958)
Net cash used in financing activities (20,806,151) (19,659,267)
Net (decrease)/ increase in cash and cash equivalents (3,588,575) 2,621,962
Movement in cash and cash equivalents
At start of year 17,618,884 14,996,922
(Decrease)/ increase (3,588,575) 2,621,962
At end of year 24 14,030,309 17,618,884
The notes on pages 84 to 132 are an integral part of these consolidated financial statements.
CONSOLIDATED STATEMENT OF CASH FLOWSFOR THE YEAR ENDED 31 MARCH 2015

SAFARICOM ANNUAL REPORT 201584
1 General information Safaricom Limited is incorporated in Kenya under the Companies Act as a public limited liability company, and is domiciled
in Kenya.
The address of the registered office of the Company is:
L.R. No. 13263 Safaricom House, Waiyaki Way P.O Box 66827-00800 NAIROBI
The Company’s shares are listed on the Nairobi Securities Exchange.
For Kenyan Companies Act reporting purposes, the balance sheet is represented by the statement of financial position and the profit and loss account by the statement of comprehensive income in these financial statements.
2 Summary of significant accounting policies The principal accounting policies adopted in the preparation of these financial statements are set out below. These
policies have been consistently applied to all periods presented, unless otherwise stated.
(a) Basis of preparation
The consolidated financial statements have been prepared in compliance with International Financial Reporting Standards (IFRS). The measurement basis applied is the historical cost basis, except where otherwise stated in the accounting policies below. The financial statements are presented in Kenya Shillings (Shs), rounded to the nearest thousands, except where otherwise stated.
The preparation of the financial statements in conformity with IFRS requires the use of certain critical accounting estimates. It also requires the directors to exercise its judgment in the process of applying the Group’s accounting policies.
The areas involving a higher degree of judgment or complexity, or where assumptions and estimates are significant to the financial statements are disclosed in Note 3.
(i) New and amended standards adopted by the Group
The following standards have been adopted by the Group for the first time for the financial year beginning on or after 1 April 2014, management has assessed them and none has had a material impact on these consolidated financial statements.
Amendment to IAS 32, ‘Financial instruments: Presentation’ on offsetting financial assets and financial liabilities. This amendment clarifies that the right of set-off must not be contingent on a future event. It must also be legally enforceable for all counterparties in the normal course of business, as well as in the event of default, insolvency or bankruptcy. The amendment also considers settlement mechanisms.
Amendments to IAS 36, ‘Impairment of assets’, on the recoverable amount disclosures for non-financial assets. This amendment removed certain disclosures of the recoverable amount of cash-generating units (CGUs) which had been included in IAS 36 by the issue of IFRS 13.
Amendment to IAS 39, ‘Financial instruments: Recognition and measurement’ on the novation of derivatives and the continuation of hedge accounting. This amendment considers legislative changes to ‘over-the-counter’ derivatives and the establishment of central counterparties. Under IAS 39 novation of derivatives to central counterparties would result in discontinuance of hedge accounting. The amendment provides relief from discontinuing hedge accounting when novation of a hedging instrument meets specified criteria.
IFRIC 21, ‘Levies’, sets out the accounting for an obligation to pay a levy if that liability is within the scope of IAS 37 ‘Provisions’. The interpretation addresses what the obligating event is that gives rise to pay a levy and when a liability should be recognised.
NOTES
85
2 Summary of significant accounting policies (continued) (a) Basis of preparation (continued)
(i) New and amended standards adopted by the Group (continued)
Other standards, amendments and interpretations which are effective for the financial year beginning on 1 April 2014 are not material to the Group.
(ii) New standards and interpretations not yet adopted
A number of new standards and amendments to standards and interpretations are effective for annual periods beginning after 1 April 2014, and have not been applied in preparing these financial statement. None of these is expected to have a significant effect on the financial statements of the Group, except the following set out below:
IFRS 9, ‘Financial instruments’, addresses the classification, measurement and recognition of financial assets and financial liabilities. The complete version of IFRS 9 was issued in July 2014. It replaces the guidance in IAS 39 that relates to the classification and measurement of financial instruments. IFRS 9 retains but simplifies the mixed measurement model and establishes three primary measurement categories for financial assets: amortised cost, fair value through OCI and fair value through SOCI. The basis of classification depends on the entity’s business model and the contractual cash flow characteristics of the financial asset. Investments in equity instruments are required to be measured at fair value through profit or loss with the irrevocable option at inception to present changes in fair value in OCI not recycling. There is now a new expected credit losses model that replaces the incurred loss impairment model used in IAS 39.
For financial liabilities there were no changes to classification and measurement except for the recognition of changes in own credit risk in other comprehensive income, for liabilities designated at fair value through profit or loss. IFRS 9 relaxes the requirements for hedge effectiveness by replacing the bright line hedge effectiveness tests. It requires an economic relationship between the hedged item and hedging instrument and for the ‘hedged ratio’ to be the same as the one management actually use for risk management purposes. Contemporaneous documentation is still required but is different to that currently prepared under IAS 39. The standard is effective for accounting periods beginning on or after 1 January 2018. Early adoption is permitted. The Group is yet to assess IFRS 9’s full impact.
IFRS 15, ‘Revenue from contracts with customers’ deals with revenue recognition and establishes principles for reporting useful information to users of financial statements about the nature, amount, timing and uncertainty of revenue and cash flows arising from an entity’s contracts with customers. Revenue is recognised when a customer obtains control of a good or service and thus has the ability to direct the use and obtain the benefits from the good or service. The standard replaces IAS 18 ‘Revenue’ and IAS 11 ‘Construction contracts’ and related interpretations. The standard is effective for annual periods beginning on or after 1 January 2017 and earlier application is permitted. The Group is assessing the impact of IFRS 15.
There are no other IFRSs or IFRIC interpretations that are not yet effective that would be expected to have a material impact on the Group.
(b) Consolidation
(i) Subsidiaries
Subsidiaries are all entities (including structured and special purpose entities) over which the Group has control. The Group controls an entity when the Group is exposed to, or has rights to, variable returns from its involvement with the entity and has the ability to affect those returns through its power over the entity. Subsidiaries are fully consolidated from the date on which control is transferred to the Group. They are deconsolidated from the date that control ceases.
The Group applies the acquisition method of accounting to account for business combinations. The consideration transferred for the acquisition of a subsidiary is the fair values of the assets transferred, the liabilities incurred to the former owners of the acquiree and the equity interests issued by the Group. The consideration transferred includes the fair value of any asset or liability resulting from a contingent consideration arrangement. Identifiable assets acquired and liabilities and contingent liabilities assumed in a business combination are measured initially at their fair values at the acquisition date. The Group recognises any non-controlling interest in the acquiree on an acquisition-by-acquisition basis, either at fair value or at the non-controlling interest’s proportionate share of the recognised amounts of acquiree’s identifiable net assets.
NOTES (Continued)

SAFARICOM ANNUAL REPORT 201586
2 Summary of significant accounting policies (continued)
(b) Consolidation (continued)
(i) Subsidiaries (continued)
If the business combination is achieved in stages, the acquisition date carrying value of the acquirer’s previously held equity interest in the acquiree is re-measured to fair value at the acquisition date; any gains or losses arising from such re-measurement are recognised in profit or loss.
Acquisition-related costs are expensed as incurred.
Any contingent consideration to be transferred by the Group is recognised at fair value at the acquisition date. Subsequent changes to the fair value of the contingent consideration that is deemed to be an asset or liability is recognised in accordance with IAS 39 either in profit or loss or as a change to other comprehensive income. Contingent consideration that is classified as equity is not re-measured, and its subsequent settlement is accounted for within equity.
The excess of the consideration transferred, the amount of any non-controlling interest in the acquiree and the acquisition-date fair value of any previous equity interest in the acquiree over the fair value of the identifiable net assets acquired is recorded as goodwill. If the total of consideration transferred, non-controlling interest recognised and previously held interest measured is less than the fair value of the net assets of the subsidiary acquired in the case of a bargain purchase, the difference is recognised directly in the statement profit or loss.
Inter-company transactions, balances and unrealised gains on transactions between Group companies are eliminated. Unrealised losses are also eliminated. When necessary amounts reported by subsidiaries have been adjusted to conform with the Group’s accounting policies. Changes in ownership interests in subsidiaries without change of control Transactions with non-controlling interests that do not result in loss of control are accounted for as equity transactions – that is, as transactions with the owners in their capacity as owners. The difference between fair value of any consideration paid and the relevant share acquired of the carrying value of net assets of the subsidiary is recorded in equity. Gains or losses on disposals to non-controlling interest are also recorded in equity.
(iii) Disposal of subsidiaries
When the Group ceases to have control, any retained interest in the entity is re-measured to its fair value at the date when control is lost, with the change in carrying amount recognised in profit or loss. The fair value is the initial carrying amount for the purposes of subsequently accounting for the retained interest as an associate, joint venture or financial asset. In addition, any amounts previously recognised in other comprehensive income in respect of that entity are accounted for as if the Group had directly disposed of the related assets or liabilities. This may mean that amounts previously recognised in other comprehensive income are reclassified to profit or loss.
(iv) Associates
Associates are all entities over which the Group has significant influence but not control, generally accompanying a shareholding of between 20% and 50% of the voting rights. Investments in associates are accounted for by the equity method of accounting. Under the equity method, the investments are initially recognised at cost, and the carrying amount is increased or decreased to recognise the investor’s share of the profit or loss of the investee after the date of acquisition. The Group’s investment in associates includes goodwill (net of any accumulated impairment loss) identified on acquisition.
If the ownership interest in an associate is reduced but significant influence is retained, only a proportionate share of the amounts previously recognised in other comprehensive income is reclassified to profit or loss as appropriate.
The Group’s share of its associates’ post-acquisition profits or losses is recognised in the statement of comprehensive income, and its share of post-acquisition movements in reserves is recognised in other comprehensive income. The cumulative post-acquisition movements are adjusted against the carrying amount of the investment. When the Group’s share of losses in an associate equals or exceeds its interest in the associate, including any other unsecured receivables, the Group does not recognise further losses, unless it has incurred obligations or made payments on behalf of the associate.
The Group determines at each reporting date whether there is any objective evidence that the investment in the associate is impaired. If this is the case, the Group calculates the amount of impairment as the difference between the recoverable amount of the associate and its carrying value and recognises the amount adjacent to ‘share of profit/(loss) of associate’ in the statement of comprehensive income.
NOTES (Continued)
87
2 Summary of significant accounting policies (continued)
(b) Consolidation (continued)
(iv) Associates (continued)
Profits and losses resulting from upstream and downstream transactions between the Group and its associates are recognised in the Group’s financial statements only to the extent of unrelated investor’s interests in the associates. Unrealised losses are eliminated unless the transaction provides evidence of an impairment of the asset transferred. Accounting policies of associates have been changed where necessary to ensure consistency with the policies adopted by the Group. Dilution gains and losses arising from investments in associates are recognised in the statement of profit or loss.
(v) Separate financial statements
In the separate financial statements, investments in subsidiaries and associates are accounted for at cost less impairment. Cost is adjusted to reflect changes in consideration arising from contingent consideration amendments. Cost also includes direct attributable costs of investment.
(c) Foreign currency translation
(i) Functional and presentation currency
Items included in the financial statements of each of the Group’s entities are measured using the currency of the primary economic environment in which the entity operates (‘the functional currency’). The financial statements are presented in Kenya Shillings (Shs), which is the Group’s presentation currency.
(ii) Transactions and balances
Foreign currency transactions are translated into the functional currency using the exchange rates prevailing at the dates of the transactions or valuation where items are re-measured. Foreign exchange gains and losses resulting from the settlement of such transactions and from the translation at year-end exchange rates of monetary assets and liabilities denominated in foreign currencies are recognised in profit or loss, except when deferred in other comprehensive income as qualifying cash flow hedges and qualifying net investment hedges. Foreign exchange gains and losses that relate to borrowings and cash and cash equivalents are presented in profit or loss within ‘finance income or costs’. All other foreign exchange gains and losses are presented in profit or loss within ‘other income’ or ‘other expenses’.
Changes in the fair value of monetary securities denominated in foreign currency classified as available for sale are analysed between translation differences resulting from changes in the amortised cost of the security and other changes in the carrying amount of the security. Translation differences related to changes in amortised cost are recognised in profit or loss, and other changes in carrying amount are recognised in other comprehensive income.
Translation differences on non-monetary financial assets, such as equities classified as available-for-sale financial assets, are included in other comprehensive income and cumulated in ‘available-for-sale financial assets reserve’.
(d) Segment reporting
Operating segments are reported in a manner consistent with the internal reporting provided to the chief operating decision-maker. The chief operating decision-maker, who is responsible for allocating resources and assessing performance of the operating segments, has been identified as the Senior Leadership Team (SLT) that makes strategic decisions.
The SLT consider the Group to be comprised of one operating segment. The financial statements are presented on the basis that risks and rates of return are related to this one reportable segment.
(e) Revenue recognition
Revenue represents the fair value of the consideration received or receivable for sales of goods and services, and is stated net of value-added tax (VAT), excise duty, rebates and discounts. The Group’s principal business is the provision of telecommunication services. The business is transforming itself to a Total Telecommunication Solution provider. Airtime can be bought as scratch cards or PINless top ups through dealers and own-retail centres spread across the country. Customers can also buy airtime through M-PESA, emergency top up and direct top up for bulk purchases. Income from sale of the airtime is deferred and recognised as revenue on usage. Customers can use airtime to make voice calls, send SMS and browse the internet.
NOTES (Continued)

SAFARICOM ANNUAL REPORT 201588
2 Summary of significant accounting policies (continued)
(e) Revenue recognition (continued)
(i) Voice and SMS revenue
The Safaricom Limited headline Voice tariff is called Uwezo and Advantage PostPay at on-net rate of Shs 4 during the day and Shs 2 from 10pm to 8am and Shs 4 off-net applicable to PrePay and PostPay customers respectively. Other PostPay tariff plans are available for subscribers who opt to pay their bills at the end of the month. Corporate customers, depending on their usage, also qualify for further discounts. Revenue from voice customers on both Prepay and Postpay plan is recognised on usage.
The Group has signed interconnect agreements with both local and foreign partners. This allows customers from either network to originate or terminate calls to each other’s network. Revenue is earned and recognised when partners’ calls are terminated to the Groups’ network.
The Group has roaming agreements with roaming partners that enable customers to make and receive calls when travelling around the world. The agreed charges differ per partner. When visitors roam on Safaricom network, revenue is earned by billing the visiting customers’ network while revenue from Safaricom customers is earned from customer billing for voice, SMS and data usage while roaming on other networks. Revenue is recognised on billing.
Customers can send messages for Shs 1 on both on-net and off-net. There are also attractive SMS bundles which offer an effective price per SMS lower than Shs 1. Revenue from SMS service is recognised on usage.
(ii) Data revenue
Mobile data has a wide range of propositions available based of customers’ requirements. These include daily bundles, 7 day, 30 day, 90 day bundles and time based billing. Revenue arising from the different service plans and tariffs are recognised as and when the service is used by the customer.
Fixed data services allow customers internet connectivity. Revenue is based on the bandwidth and speed contracted by the customer. Revenue is recognised at the end of every month based on a standard monthly charge.
(iii) M-PESA revenue
M-PESA is a mobile phone service allowing customers to deposit, transfer and withdraw money or pay for goods and services (Lipa na M-PESA) using a mobile phone. Kenya was the first country in the world to use this service, which is operated under licence from Vodafone. M-PESA is available to all Safaricom Limited subscribers (PrePay and PostPay). Registration is free and available at any M-PESA agent countrywide. The M-PESA application is installed on the SIM card and works on all makes of handsets. Revenue from this service is earned largely from transfer and withdrawal transactions performed by customers. A tariff that is graduated depending on the funds being transacted is applied on all transactions which are cumulatively reported as M-PESA transaction commission revenue.
To further drive financial inclusion Safaricom is currently running two bank services; M-Shwari and KCB M-PESA.
M-Shwari is essentially a bank service in partnership with Commercial Bank of Africa (CBA) that allows M-PESA customers to save, earn interest and borrow money using their mobile phones. M-Shwari customers can save as little as Shs 1 (USD 0.011) and get loans from as little as Shs 100 (USD 1.083). This has enabled more subscribers to get access to mobile banking services that they did not have before. M-Shwari has no application forms, no ledger fees, no limits on the frequency of withdrawal, no minimum operating balance and no charges for moving money from M-PESA to M-Shwari and vice versa. M-Shwari lock box product enables customers to make fixed deposit savings at a higher interest rate.
In the year, the Group in partnership with Kenya Commercial Bank (KCB) launched KCB M-PESA service. This service allows customers to borrow money using their mobile phones.
Revenue from these services is earned from the fee charged at the point of loan disbursement and this is shared between Safaricom Limited and the banks.
Mobile phone handsets, starter packs and other accessories are sold through dealers and own-retail centres spread across the country. These are recognised as revenue in the period in which the Group delivers products to the customer.
NOTES (Continued)
89
2 Summary of significant accounting policies (continued)
(e) Revenue recognition (continued)
(iii) M-PESA revenue (continued)
The customer has accepted the products and collectability of the related receivables is reasonably assured. Starter packs consist of a SIM card and information brochures. Handsets have no right of return and revenue is recognised on sale, however, income from sale of SIM cards is deferred and recognised as revenue when the customer activates the line through initial top up.
(iv) Loyalty programme
A loyalty programme, ‘Bonga’, was introduced in January 2007 to both prepay and postpay subscribers. In this scheme, subscribers earn one Bonga point for every Shs 10 spent on voice calls, short messages service (SMS), data and M-PESA services. These points can be redeemed for free airtime, SMS or merchandise such as phones, modems and tablets.
Management defers revenue for every point accumulated and recognises the revenue relating to the point earned only on redemption. The position as at 31 March 2015 was that 77% (2014: 84%) of the points redeemed in the year were for non-merchandise items (voice minutes, data bytes and SMS) while 23% (2014: 16%) was redeemed for merchandise items.
(v) Construction contracts
The Group has construction contract for the construction of a national secure communication network and surveillance system for the national police service. A construction contract is a contract specifically negotiated for the construction of an asset or a combination of assets that are closely interrelated or interdependent in terms of their design, technology, and functions, or their ultimate purpose or use.
The contract has a construction and management service elements. Construction costs incurred are accumulated under inventory work in progress until when they are billed. Revenue from construction is recognised progressively on a percentage of completion basis under other income. Revenue from the managed service of the infrastructure is recognised when delivered on a pro rata basis. Costs relating to the managed service are recognised under other expenses as incurred. Costs incurred in the year in connection with future managed services are presented under inventories as work in progress.
(vi) Others
Other revenue/income is recognised appropriately in the Statement of Comprehensive Income when earned. Interest income is recognised using the effective interest method.
(f) Property, plant and equipment
All categories of property, plant and equipment are initially recorded at cost and subsequently depreciated. Historical cost includes expenditure that is directly attributable to the acquisition of the items.
Subsequent costs are included in the asset’s carrying amount or recognised as a separate asset, as appropriate, only when it is probable that future economic benefits associated with the item will flow to the Group and the cost of the item can be measured reliably. All other repairs and maintenance are charged to the statement of comprehensive income during the financial period in which they are incurred.
Depreciation is calculated using the straight line method to write down the cost of each asset to its residual value over its estimated useful life as follows:
Network infrastructure 3 - 10 years
Equipment and motor vehicles 3 - 5 years
Fibre 25 years
Leasehold improvements Shorter of life of lease or useful life of the asset
Network maintenance spares 3 – 10 years
NOTES (Continued)

SAFARICOM ANNUAL REPORT 201590
2 Summary of significant accounting policies (continued)
(f) Property, plant and equipment (continued)
Effective 31 March 2015, the Group adopted amendment to IAS 16 “Property, Plant and Equipment” that clarifies that items such as spare parts, standby equipment and servicing equipment shall be recognised as property, plant and equipment when they meet the definition of property, plant and equipment.
The Group transferred network maintenance spares supporting the network previously classified under inventory to property, plant and equipment. See additional details under Note 17.
The Group capitalises staff costs directly attributable to construction of network infrastructure that meet the recognition criteria of IAS 16.
The assets’ residual values and useful lives are reviewed, and adjusted if appropriate, at each period end. An asset’s carrying amount is written down immediately to its recoverable amount if the asset’s carrying amount is greater than its estimated recoverable amount.
Property, plant and equipment are reviewed for impairment whenever events or changes in circumstances indicate that the carrying amount may not be recoverable. An impairment loss is recognised for the amount by which the asset’s carrying amount exceeds its recoverable amount. The recoverable amount is the higher of an asset’s fair value less costs to sell and value in use.
Property, plant and equipment acquired in exchange for non-monetary assets or a combination of monetary and non-monetary assets are measured at fair value of the new asset. If the fair value cannot be determined reliably, then the exchanged asset is measured at the carrying amount of the asset given up.
For the purposes of assessing impairment, assets are grouped at the lowest levels for which there are separately identifiable cash flows (cash-generating units).
Gains and losses on disposal of property, plant and equipment are determined by comparing proceeds with their carrying amounts and are taken into account in determining profit for the period.
(g) Intangible assets
(i) Goodwill
Goodwill represents the excess of the aggregate of the fair value of compensation transferred, the acquisition date fair value of any previously held interest and any non-controlling interest over fair value of assets and liabilities acquired.
Goodwill on acquisitions of subsidiaries is included in intangible assets. Goodwill on acquisitions of associates is included in investment in associates.
Goodwill is tested annually for impairment and carried at cost less accumulated impairment losses. Impairment losses on goodwill are not reversed. Gains and losses on disposal of an entity include the carrying amount of goodwill relating to the entity sold. Any negative goodwill arising from an acquisition is credited to the statement of comprehensive income.
Goodwill is allocated to cash-generating units for the purpose of impairment testing. The allocation is made to those cash-generating units or groups of cash-generating units that are expected to benefit from the business combination in which the goodwill arose identified according to operating segment.
(ii) Licences
Separately acquired trademarks and licences are shown at historical cost. Licences acquired in a business combination are recognised at fair value at the acquisition date. Licences that have a finite useful life and are carried at cost less accumulated amortisation. Amortisation is calculated using the straight-line method to allocate the cost of trademarks and licences over their estimated useful lives of 10 to 15 years.
A telecommunication licence is a requirement of the Communications Authority of Kenya (CA) for mobile telephone companies. The licence is renewable for an additional period upon its expiry.
NOTES (Continued)
91
2 Summary of significant accounting policies (continued) (g) Intangible assets (continued)
(ii) Licences (continued)
Telecommunication licence fees are capitalised at cost and amortised over the period of the licence on a straight-line basis from commencement of the service of the network.
Currently, the Group has the following licences:
Safaricom Limited is licenced under the Unified Licence Framework which means it possesses;
• Network Facilities Provider licence Tier 1 (NFP) licence
• Applications Services Provider (ASP) licence
• Content Service Provider (CSP) licence
• International Gateway Systems and service (IGSS) licence
• Spectrum licence 2G (900, 1800 MHz) licence
• Spectrum licence 3G (2100 MHz) licence
These licences were initially issued in June 1999 for a 15 year term ending 30 June 2014. The licences were further renewed by CA for a period of 10 years and expire in June 2024. The 3G licence will expire in June 2022.
In December 2014 Safaricom acquired additional spectrum that had previously been assigned to Essar Telecom Kenya Limited (which exited the market). The Communications Authority amended Safaricom’s existing Spectrum Licence to add the acquired spectrum (2x10MHz in 1800MHz band and 2x7.5MHz in the 900MHZ band) for a licence period of 10 years to expire in June 2024.
Licence fees are amortised on a straight line basis over the life of licence. There are annual network licence fees associated to these licences which are expensed each year.
The following licences are also in place:
• Local Loop Operator Licence (LLO) issued to Comtec Training and Management Services Limited in March 2006
• Internet Service Provider (ISP) issued to Flexible Bandwidth Limited in March 2006
• Digital Carrier Network Operation (DCNO) issued to Comtec Integration Systems Limited in March 2006
• Public Data Communications Network Operator Licence (PDCNO) transferred to Safaricom Limited in September 2011 (held by PacketStream Data Networks Limited from July 2005)
• Public Data Network Operators Licence (PDNO) transferred to Safaricom Limited in September 2011 (held by IGO Wireless Limited from July 2005); and Content Service Provider (CSP) and Application Service Provider Licence (ASP) issued to Instaconnect Limited in 30 April 2009
• Additional LLO and DCNO Licences are held under One Communications Limited, a WIMAX service provider, since 31 August 2008
Network licences are reviewed for impairment whenever events or changes in circumstances indicate that the carrying amount may not be recoverable. An impairment loss is recognised for the amount by which the asset’s carrying amount exceeds its recoverable amount.
NOTES (Continued)

SAFARICOM ANNUAL REPORT 201592
2 Summary of significant accounting policies (continued) (h) Derivative financial instruments
Derivatives, which comprise solely of forward foreign exchange contracts, are initially recognised at fair value on the date the derivative contract is entered into and are subsequently re-measured at their fair value. The derivatives do not qualify for hedge accounting. Changes in the fair value of derivatives are recognised immediately in profit or loss. These derivatives are trading derivatives and are classified as a current asset or liability. Currently there are no derivatives held by the Group.
(i) Impairment of non-financial assets
Assets that have an indefinite useful life are not subject to amortisation and are tested annually for impairment. Assets that are subject to amortisation are reviewed for impairment whenever events or changes in circumstances indicate that the carrying amount may not be recoverable. An impairment loss is recognised for the amount by which the asset’s carrying amount exceeds its recoverable amount. The recoverable amount is the higher of an asset’s fair value less costs to sell and value in use. For the purposes of assessing impairment, assets are grouped at the lowest levels for which there are separately identifiable cash flows (cash-generating units). Non-financial assets other than goodwill that suffered impairment are reviewed for possible reversal of the impairment at each reporting date.
(j) Accounting for leases
Leases in which a significant portion of the risks and rewards of ownership are retained by the lessor are classified as operating leases. Payments made under operating leases are charged to the statement of comprehensive income on a straight-line basis over the period of the lease.
(k) Financial assets
(i) Classification
The Group and Company classify financial assets in the following categories: at fair value through profit or loss, loans and receivables, and available-for-sale. The classification depends on the purpose for which the financial assets were acquired. The Directors determine the classification of the financial assets at initial recognition.
Financial assets at fair value through profit or loss
Financial assets at fair value through profit or loss are financial assets held for trading. A financial asset is classified in this category if acquired principally for the purpose of selling in the short-term. Derivatives are also categorised as held for trading. Assets in this category are classified as current assets if expected to be realised within 12 months; otherwise, they are classified as non-current.
Loans and Receivables
Loans and receivables are non-derivative financial assets with fixed or determinable payments that are not quoted in an active market. They are included in current assets, except for maturities greater than 12 months after the end of the reporting period. These are classified as non-current assets.
Available-for-sale financial assets
Available-for-sale financial assets are non-derivatives that are either designated in this category or not classified in any of the other categories. They are included in non-current assets unless the investment matures or the Directors intend to dispose of the investment within 12 months of the end of the reporting period.
(ii) Recognition and measurement
Regular purchases and sales of financial assets are recognised on the trade date, which is the date on which the entity commits to purchase or sell the asset. Investments are initially recognised at fair value, plus transaction costs for all financial assets not carried at fair value through profit or loss. Financial assets, carried at fair value through profit or loss, are initially recognised at fair value, and transaction costs are expensed.
Financial assets are derecognised when the rights to receive cash flows from the investments have expired or have been transferred and the entity has transferred substantially all risks and rewards of ownership.
Available-for-sale financial assets and financial assets at fair value through profit or loss are subsequently carried at fair value. Loans and receivables are carried at amortised cost using the effective interest method.
NOTES (Continued)
93
2 Summary of significant accounting policies (continued)
(k) Financial assets (continued)
(iii) Offsetting financial instruments
Financial assets and liabilities are offset and the net amount reported in the statement of financial position when there is a legally enforceable right to offset the recognised amounts and there is an intention to settle on a net basis or realise the asset and settle the liability simultaneously.
(iv) Impairment of financial assets
Assets carried at amortised cost
The Group and Company assess at the end of each reporting period whether there is objective evidence that a financial asset or group of financial assets is impaired. A financial asset or a group of financial assets is impaired and impairment losses are incurred only if there is objective evidence of impairment as a result of one or more events that occurred after the initial recognition of the asset (a ‘loss event’) and that loss event (or events) has an impact on the estimated future cash flows of the financial asset or group of financial assets that can be reliably estimated.
Evidence of impairment may include indications that the debtors or a group of debtors is experiencing significant financial difficulty, default or delinquency in interest or principal payments, the probability that they will enter bankruptcy or other financial reorganisation, and where observable data indicate that there is a measurable decrease in the estimated future cash flows, such as changes in arrears or economic conditions that correlate with defaults.
Assets classified as available-for-sale
The Group and Company assess at the end of each reporting period whether there is objective evidence that a financial asset or a group of financial assets is impaired. In the case of equity investments classified as available-for-sale, a significant or prolonged decline in the fair value of the security below its cost is also evidence that the assets are impaired. If any such evidence exists for available-for-sale financial assets, the cumulative loss – measured as the difference between the acquisition cost and the current fair value, less any impairment loss on that financial asset previously recognised in profit or loss – is removed from equity and recognised in profit or loss. Impairment losses recognised in profit or loss on equity instruments are not reversed through profit or loss.
Gains and losses arising from changes in the fair value of the ‘financial assets at fair value through profit or loss’ category are included in profit or loss in the period in which they arise. Dividend income from financial assets at fair value through profit or loss is recognised in profit or loss as part of other income when the entity’s right to receive payments is established.
(l) Indefeasible Right of Use (IRU)
The Group enters into long-term service contracts under which it purchases lit capacity from fibre networks. The purchase involves making prepayments to acquire Indefeasible Right of Use (IRU) for a fixed period of time. The prepayment is amortised and recognised in the statement of comprehensive income on a straight-line basis over the life of the contract.
In the year, the Group also acquired rights to use sites for which lease agreements with respective landlords are with East Africa Tower Company Limited (EATCL). The rights will be amortised over the period in which the lease agreements remain between EATCL and the landlords. On expiry, the lease agreements will be transferred to Safaricom.
IRU Contract period
TEAMS 20 years
KPLC 20 years
SEACOM 20 years
TATA 15 years
ETISALAT 15 years
EATCL Dependent on individual lease period
NOTES (Continued)

SAFARICOM ANNUAL REPORT 201594
2 Summary of significant accounting policies (continued) (m) Inventories
Inventories are stated at the lower of cost and net realisable value. Cost is determined by the weighted average method. The cost of inventories comprises purchase price and other incidental costs. Net realisable value is the estimate of the selling price and other incidental costs.
Provisions for saleable inventories are made based on aged listing for items older than 180 days and damaged stocks.
(n) Trade and other receivables
Trade receivables are amounts due from customers for merchandise sold or services performed in the ordinary course of business. If collection is expected in one year or less (or in the normal operating cycle of the business if longer), they are a classified as current assets. If not, they are presented as non-current assets.
Receivables are recognised initially at fair value and subsequently measured at amortised cost using the effective interest method, less provision for impairment. A provision for impairment of receivables is established when there is objective evidence that the Group will not be able to collect all the amounts due according to the original terms of receivables. The amount of the provision is the carrying amount of all balances in each class of debt older than;
Postpay, corporate, roaming and corporate debt 91 days
Collocation and fibre debt 61 days
Interconnect and premium rate service debt 31 days
Emergency Top-Up debt (ETU) 5 days
Others Specific customer terms
(o) Trade and other payables
Trade payables are obligations to pay for goods or services that have been acquired in the ordinary course of business from suppliers. Accounts payable are classified as current liabilities if payment is due within one year or less (or in the normal operating cycle of the business if longer). If not, they are presented as non-current liabilities.
Payables are recognised initially at fair value and subsequently measured at amortised cost using the effective interest method.
Deferred revenue is accounted for as described under Note 2 (e).
(p) Share capital
Ordinary shares are classified as ‘share capital’ in equity. Any premium received over and above the par value (Shs 0.05) of the shares is classified as ‘share premium’ in equity
Ordinary shares represent the residual economic value of a company. They carry rights to distribution of profits through dividends, to the surplus assets of a company on a winding up and to votes at general meetings of the Company.
There are no differences in the voting rights of the ordinary shares held by the shareholders of the Company.
Non-participating preference shares have the right to preference in the payment of the paid up par value in the event of liquidation of the Company and may be redeemed at any time by the Board of Directors of the Company subject to the provisions of the Kenyan Companies Act.
Where any group company purchases the Company’s equity share capital (treasury shares), the consideration paid, including any directly attributable incremental costs is deducted from equity attributable to the Company’s equity holders until the shares are cancelled or reissued. Where such ordinary shares are subsequently reissued, any consideration received, net of any directly attributable incremental transaction costs and the related income tax effects, is included in equity attributable to the Company’s equity holders
(q) Cash and cash equivalents
Cash and cash equivalents include cash in hand, deposits held at call with banks, other short term highly liquid investments with original maturities of three months or less, and bank overdrafts. Bank overdrafts are shown within borrowings in current liabilities on the statement of financial position.
NOTES (Continued)
95
2 Summary of significant accounting policies (continued) (r) Employee benefits
(i) Retirement benefit obligations
The Group and Company have defined contribution plan for its employees. The Group and Company and all its employees also contribute to the National Social Security Fund, which is a defined contribution scheme.
A defined contribution plan is a pension plan under which the Group pays fixed contributions into a separate entity. The Group has no legal or constructive obligations to pay further contributions if the fund does not hold sufficient assets to pay all employees the benefits relating to employee service in the current and prior periods. A defined benefit plan is a pension plan that is not a defined contribution plan.
For defined contribution plans, the Group and Company pay contributions to publicly or privately administered plans on a mandatory, contractual or voluntary basis. The entity has no further payment obligations once the contributions have been paid. The contributions are recognised as an employee benefit expense when they are due.
(ii) Termination benefits
Termination benefits are payable when employment is terminated by the Group before the normal retirement date, or whenever an employee accepts voluntary redundancy in exchange for these benefits. The Group recognises termination benefits at the earlier of the following dates: (a) when the Group can no longer withdraw the offer of those benefits; and (b) when the entity recognises costs for a restructuring that is within the scope of IAS 37 and involves the payment of termination benefits. In the case of an offer made to encourage voluntary redundancy, the termination benefits are measured based on the number of employees expected to accept the offer. Benefits falling due more than 12 months after the end of the reporting period are discounted to their present value.
(s) Share-based payments
The Group operates an Employee Performance Share Award Plan (EPSAP) under which senior management and other qualifying staff are entitled to receive a predetermined number of shares at a predetermined price, subject to fulfilment of the vesting conditions.
The process of EPSAP includes the Group purchasing shares from the market prorata to vesting period and then issuing the same to eligible employees after a 3-year vesting period at no cost. The shares are purchased through a trust and held by the same until the end of the vesting period. The cost of purchase is charged to the Statement of Comprehensive Income.
Until 26 February 2014, the Group had an Employee Share Ownership Plan (ESOP) under which, subject to the vesting conditions, eligible employees were entitled to acquire units in a separately administered Trust, each unit in the trust representing one share in the Company. The direct cost to the Group of fulfilling its obligations under the above schemes was charged to the statement profit or loss when incurred.
The cost of issued share options was recognised in the statement of profit or loss over the vesting period, measured at the fair value of the option. On allocation of shares to the trust, appropriate adjustments are made to increase share capital and the corresponding adjustments were made to the trust account. On vesting, the trust allocated the shares to the eligible individuals with adjustments made to the ESOP liability.
When the options were exercised, the entity issued new shares. The proceeds received net of any directly attributable transaction costs were credited to share capital (nominal value) and share premium when the options are exercised.
(t) Current and deferred income tax
The tax expense for the period comprises current and deferred tax. Tax is recognised in the statement of profit or loss, except to the extent that it relates to items recognised in other comprehensive income or directly in equity. In this case, the tax is also recognised in other comprehensive income or directly in equity, respectively.
The current income tax charge is calculated on the basis of the tax laws enacted or substantively enacted at the balance sheet date. Management periodically evaluates positions taken in tax returns with respect to situations in which applicable tax regulation is subject to interpretation. It establishes provisions where appropriate on the basis of amounts expected to be paid to the tax authorities.
NOTES (Continued)

SAFARICOM ANNUAL REPORT 201596
2 Summary of significant accounting policies (continued) (t) Current and deferred income tax (continued)
Deferred income tax is recognised on temporary differences arising between the tax bases of assets and liabilities and their carrying amounts in the consolidated financial statements. However, deferred tax liabilities are not recognised if they arise from the initial recognition of goodwill; deferred income tax is not accounted for if it arises from initial recognition of an asset or liability in a transaction other than a business combination that at the time of the transaction affects neither accounting nor taxable profit or loss. Deferred income tax is determined using tax rates (and laws) that have been enacted or substantively enacted by the balance sheet date and are expected to apply when the related deferred income tax asset is realised or the deferred income tax liability is settled.
Deferred income tax assets are recognised only to the extent that it is probable that future taxable profit will be available against which the temporary differences can be utilised.
Deferred income tax liabilities are provided on taxable temporary differences arising from investments in subsidiaries and associates, except for deferred income tax liability where the timing of the reversal of the temporary difference is controlled by the Group and it is probable that the temporary difference will not reverse in the foreseeable future. Generally the Group is unable to control the reversal of the temporary difference for associates except where there is an agreement in place that gives the Group the ability to control the reversal of the temporary difference not recognised.
Deferred income tax assets are recognised on deductible temporary differences arising from investments in subsidiaries and associates only to the extent that it is probable the temporary difference will reverse in the future and there is sufficient taxable profit available against which the temporary difference can be utilised.
Deferred income tax assets and liabilities are offset when there is a legally enforceable right to offset current tax assets against current tax liabilities and when the deferred income taxes assets and liabilities relate to income tax levied by the same taxation authority on either the same taxable entity or different taxable entities where there is an intention to settle the balances on a net basis.
(u) Borrowings
Borrowings are recognised initially at fair value including transaction costs and subsequently stated at amortised cost using the effective interest method. Any differences between proceeds (net of transaction costs) and the redemption value is recognised in the statement of comprehensive income over the period of the borrowings.
Fees paid on the establishment of loan facilities are recognised as transaction costs of the loan to the extent that it is probable that some or all of the facility will be drawn down. In this case, the fee is deferred until the draw-down occurs. To the extent there is no evidence that it is probable that some or all of the facility will be drawn down, the fee is capitalised as a pre-payment for liquidity services and amortised over the period of the facility to which it relates.
Borrowings are classified as current liabilities unless the Group has an unconditional right to defer settlement of the liability for at least 12 months after year end.
(v) Dividend distribution
Dividends payable to the Company’s shareholders are recognised as a liability in the Group’s financial statements in the period in which the dividends are approved by the Company’s shareholders. Proposed dividends are shown as a separate component of equity until declared.
(w) Provisions
Provisions are recognised when: the Group has a present legal or constructive obligation as a result of past events; it is probable that an outflow of resources will be required to settle the obligation; and the amount has been reliably estimated. Provisions are not recognised for future operating losses.
Provisions are measured at the present value of the expenditures expected to be required to settle the obligation using a pre-tax rate that reflects current market assessments of the time value of money and the risks specific to the obligation. The increase in the provision due to passage of time is recognised as interest expense.
(x) Comparatives
Where necessary, comparatives have been adjusted to conform to changes in presentation in the current period.
NOTES (Continued)
97
3 Critical accounting estimates and judgments (x) Comparatives (continued)
Estimates and judgments are continually evaluated and are based on historical experience and other factors, including experience of future events that are believed to be reasonable under the circumstances.
(i) Critical accounting estimates and assumptions
The Group makes estimates and assumptions concerning the future. The resulting accounting estimates will, by definition, seldom equal the related actual results. The estimates and assumptions that have a significant risk of causing a material adjustment to the carrying amounts of assets and liabilities within the next financial year are addressed below.
Impairment of goodwill
The Group tests annually whether goodwill has suffered any impairment, in accordance with the accounting policy stated in Note 2 (g). The recoverable amounts of cash-generating units have been determined based on value-in-use calculations. The carrying amount of the goodwill and the key assumptions made are set out in Note 18.
Income taxes
Significant judgment is required in determining the Group’s provision for income taxes. There are many transactions and calculations for which the ultimate tax determination is uncertain during the ordinary course of business. The Group recognises liabilities for anticipated tax audit issues based on estimates of whether additional taxes will be due. Where the final tax outcome of these matters is different from the amounts that were initially recorded, such differences will impact the income tax and deferred tax provisions in the period in which such determination is made.
Property, plant and equipment
Critical estimates are made by management in determining depreciation rates for property, plant and equipment. The rates used are set out in Note 2 (f) above.
Valuation of Bonga Points
Bonga Points are valued based on fair value which is determined by historical redemption information. The length of historical period used to determine the fair value is set by management and is based on previous redemptions rates on airtime or merchandise.
Fair valuation of assets acquired from business combination
Management used internal technical experts in determining the fair value of assets and liabilities acquired from Essar Telecom Kenya Limited. The fair value of assets acquired are set out in Note 30.
(ii) Critical judgments in applying the entity’s accounting policies
In the process of applying the Group’s accounting policies, management has made judgments in determining:
• the classification of financial assets and leases
• whether assets are impaired
(iii) Critical judgment on going concern
The Group’s current liabilities exceed its current assets by Shs 19,599,780,000 (2014: Shs 9,941,119,000) at the statement of financial position date.
This net current liability position is expected to remain in the near future. A significant portion of creditors relate to network infrastructure investments rather than on-going trading, hence net working capital is typically a negative amount. This is due to payment terms for capital creditors being longer than receivables and inventory turnover period owing to longer project implementation period.
Other significant portion of current liabilities relates to deferred income on both airtime and the loyalty points programme (Bonga Points). Airtime is deferred when sold and loyalty points are deferred when awarded and are recognised as income on usage of airtime and redemption of the loyalty points respectively. See details of the amounts under note 25.
NOTES (Continued)

SAFARICOM ANNUAL REPORT 201598
4 Financial risk management The Group’s activities expose it to a variety of financial risks, market risk (including foreign exchange risk, interest rate risk,
and price risk), credit risk and liquidity risk.
Financial risk management is carried out by the treasury section in finance division under policies approved by the Board of Directors. The treasury section identifies, evaluates and hedges financial risks. The Board provides written principles for overall risk management, as well as written policies covering specific areas such as foreign exchange risk, interest rate risk, credit risk, use of derivative and non-derivative financial instruments and investing excess liquidity.
Loans and receivables have been disclosed at their carrying values. Financial liabilities have been carried at amortised cost.
Market risk
(i) Foreign exchange risk
The Group is exposed to foreign exchange risk arising from various currency exposures, primarily, with respect to the US dollar, SDR and the Euro. Foreign exchange risk arises from future commercial transactions and recognised assets and liabilities.
The Group manages foreign exchange risk arising from future commercial transactions and recognised assets and liabilities using spot and forward contracts, but has not designated any derivative instruments as hedging instruments. Foreign exchange risk arises when future commercial transactions or recognised assets or liabilities are denominated in a currency that is not the entity’s functional currency.
At 31 March 2015, if the Shilling had weakened/strengthened by 10% against the US dollar with all other variables held constant, consolidated post tax profit for the year would have been Shs 221 million (2014: Shs 130 million) higher/lower, mainly as a result of US dollar denominated cash and bank balances, receivables and payables.
Profit is more sensitive to movement in Shs/US dollar exchange rates in 2015 than 2014 because of the increased amount of US dollar-denominated creditor balances.
At 31 March 2015, if the Shilling had weakened/strengthened further by 10% against the Euro with all other variables held constant, consolidated post tax profit for the year would have been Shs 43 million (2014: Shs 75 million) lower/higher, mainly as a result of Euro denominated cash and bank balances.
(ii) Price risk
The Group does not hold investments or securities that would be subject to price risk. The Group is not exposed to commodity price risk.
(iii) Interest rate risk
Interest rate risk arises from long-term and bank borrowings. Borrowings issued at variable rates expose the Group and Company to cash flow interest rate risk which is partially offset by cash held at variable rates. To manage interest rate risk the Group ensures that a portion of its borrowings are fixed rate borrowings. The Group and Company regularly monitor financing options available to ensure optimum interest rates are obtained.
At 31 March 2015, an increase/decrease of 100 basis points (2014: 100 basis points) would have resulted in a decrease/increase in consolidated post tax profit of Shs 136 million (2014: Shs 163 million), as a result of higher/lower interest charges/income on variable rate borrowings and cash balances.
Credit risk
Credit risk is managed on a Group basis. Credit risk arises from deposits with banks as well as trade and other receivables. The Group has no significant concentrations of credit risk. Derivative financial instruments and bank deposits are re-valued at closing rates at the end of the period.
For banks and financial institutions, only reputable well established financial institutions are used. Category 1 is made up of counter-parties with international credit ratings; Category 2 are counter-parties who are subsidiaries of parents with international credit ratings; Category 3 counter-parties have local credit ratings or are not rated but are classified as large by the Central Bank of Kenya.
NOTES (Continued)
99
4 Financial risk management (continued) Credit risk (continued)
Cash at bank and short term bank deposits
Group Company
2015Shs’000
2014Shs’000
2015Shs’000
2014Shs’000
Category 1 4,135,918 3,643,005 4,135,918 3,643,005
Category 2 4,125,954 6,255,295 4,105,267 6,234,601
Category 3 5,763,641 7,715,397 5,750,418 7,702,214
Others 4,796 4,818 4,797 4,818
14,030,309 17,618,515 13,996,400 17,584,638
Trade and other receivables
For trade and other receivables, depending on the type of customer, the Group credit controller or head of consumer sales assesses the credit quality of each customer, taking into account its financial position, past experience and other factors, including information from credit reference bureau. Individual risk limits are set based on internal or external ratings in accordance with limits set by management. The utilisation of credit limits is regularly monitored.
Dealers comprise the largest distribution network for the Group. Dealers operate either on a cash basis or on credit following successful application of the credit facility. All credit limits are supported by a bank guarantee.
Postpay debtors have a 15-day credit period after which individual customers must pay within 10 days after due date, while business accounts have up to 30 days. Postpay debtors comprise of individuals as well as corporate customers. The auto-bar feature ensures that once the limit has been reached the customer account is barred. This minimises the credit risk associated with these customers.
The Group currently has 531 (2014: 495) signed international roaming agreements in place. The roaming strategy targets countries which historically have had the most visitors to Kenya, including UK, Italy, Spain, Sweden, South Africa, and Kenya’s neighbouring countries. Roaming partners have entered into an agreement with the Group to terminate their calls on the Group’s network for visitors travelling into Kenya. Amounts due from the roaming partners are settled within 60 days unless a dispute arises. Disputes are handled by Synverse, a roaming clearing house.
The Group has also signed interconnect agreements with partners to terminate calls to and from other networks on the Group’s network. Amounts due from interconnect partners are settled within 30 days of invoice unless a dispute arises. Disputes are handled in the first instance by the Regulatory Department of the Group. The Group’s maximum exposure to credit risk is approximated by the carrying amounts.
The Group has an elaborate aging system for monitoring its receivables. Dealers’ transactions and credit positions are closely monitored. All fully performing balances are within 90 days. The other categories are past due. Collateral is held for bulk of the trade receivables in the form of bank guarantees and deposits. None of the above assets are either past due or impaired except for the following amounts in trade receivables.
Group Company
2015Shs’000
2014Shs’000
2015Shs’000
2014Shs’000
Past due but not impaired:
- by up to 30 days 259,553 436,039 259,553 436,039
- by more than 30 days 94,884 300,308 7,836 279,126
Total past due but not impaired 354,437 736,347 267,389 715,165
Receivables individually determined to be impaired 1,031,454 1,074,966 1,018,298 1,061,463
NOTES (Continued)

SAFARICOM ANNUAL REPORT 2015100
4 Financial risk management (continued) Credit risk (continued)
Trade and other receivables (continued)
(a) Group Neither past due nor
impairedShs’000
Past due but not impaired
Shs’000Impaired
Shs’000Total
Shs’000
At 31 March 2015
Dealers 165,154 267,389 2,928 435,471
Postpay 1,275,196 - 457,008 1,732,204
Roaming and interconnect 1,352,552 - 208,127 1,560,679
Amounts due from related parties 1,765,228 - 33,268 1,798,496
Other receivables 1,753,276 87,048 330,123 2,170,447
Total 6,311,406 354,437 1,031,454 7,697,297
At 31 March 2014
Dealers 940,761 138,827 - 1,079,588
Postpay 762,279 198,556 252,795 1,213,630
Roaming and interconnect 591,336 83,829 380,533 1,055,698
Amounts due from related parties 1,519,267 13,436 15,375 1,548,078
Other receivables 1,384,918 293,954 426,263 2,105,135
Total 5,198,561 728,602 1,074,966 7,002,129
(b) Company
At 31 March 2015
Dealers 165,154 267,389 2,928 435,471
Postpay 1,275,196 - 457,008 1,732,204
Roaming and interconnect 1,352,552 - 208,127 1,560,679
Amounts due from related parties 1,972,940 - 33,268 2,006,208
Other receivables 1,465,892 - 316,967 1,782,858
Loan to related parties 633,408 - - 633,408
Total 6,865,142 267,389 1,018,298 8,150,828
NOTES (Continued)
101
4 Financial risk management (continued) Credit risk (continued)
Trade and other receivables (continued)
(b) Company (continued) Neither past due nor
impairedShs’000
Past due but not impaired
Shs’000Impaired
Shs’000Total
Shs’000
At 31 March 2014
Dealers 940,761 138,827 - 1,079,588
Postpay 762,279 198,556 252,795 1,213,630
Roaming and interconnect 591,336 83,829 380,533 1,055,698
Amounts due from related parties 1,740,430 13,436 15,375 1,769,241
Other receivables 1,157,845 293,953 412,760 1,864,558
Loan to related parties 707,906 - - 707,906
Total 5,900,557 728,601 1,061,463 7,690,621
Dealers’ debt is fully secured by bank guarantees. The Group has bank guarantees of Shs 492 million and Shs 1,179 million
as at March 2015 and March 2014 respectively, which can be enforced in the event of default. Customers under the
‘past due but not impaired’ category continue paying their debts as they trade. The default rate is low. The credit control
department is actively following the debts that are overdue but not impaired.
The balances that are impaired have been fully provided for. However, external debt collectors as well as the Group legal department are following up on the impaired balances.
In determination of the impaired balances above, management considered the age of the debt and financial position of the debtor.
Liquidity risk
Cash flow forecasting is performed in the operating entities of the Group and aggregated by Group finance. Group finance monitors rolling forecasts of the Group’s liquidity requirements to ensure it has sufficient cash to meet its operational needs.
Such forecasting takes into consideration the entity’s debt financing plans, covenant compliance, compliance with internal statement of financial position ratio targets. Surplus cash held by the entity, over and above the amounts required for working capital management are invested in interest bearing current accounts and, fixed deposit accounts and marketable securities.
The Group’s approach when managing liquidity is to ensure, as far as possible, that it will always have sufficient liquidity to meet its liabilities when due, without incurring unacceptable losses or risking damage to the Group’s reputation.
Prudent liquidity risk management includes maintaining sufficient cash, and the availability of funding from an adequate amount of committed credit facilities. Due to the dynamic nature of the underlying businesses, Treasury section maintains flexibility in funding by maintaining availability under committed credit lines. Liquidity position is monitored through daily cash position as well as monthly cash forecast that monitors debt structure and expected cash position.
The table below analyses the Group’s and the Company’s financial liabilities that will be settled on a net basis into relevant maturity groupings based on the remaining period at the statement of financial position date to the contractual maturity date. The amounts disclosed in the table below are the contractual undiscounted cash flows. Balances due within 12 months equal their carrying balances, as the impact of discounting is not significant.
NOTES (Continued)

SAFARICOM ANNUAL REPORT 2015102
4 Financial risk management (continued)
Liquidity risk (continued)
(a) GroupLess than 1 year
Shs’000
Between 1 and 2 years
Shs’000
Between 2 and 5 years
Shs’000Total
Shs’000
At 31 March 2015:
- borrowings 6,082,030 512,605 - 6,594,635
- corporate bonds 4,753,690 - - 4,753,690
- trade and other payables 34,530,264 - - 34,530,264
Total financial liabilities 45,365,984 512,605 - 45,878,589
At 31 March 2014:
- borrowings 48,320 663,699 - 712,019
- corporate bonds 8,480,612 4,753,763 - 13,234,375
- trade and other payables 23,493,266 - - 23,493,266
Total financial liabilities 32,022,198 5,417,462 - 37,439,660
(b) Company
At 31 March 2015:
- borrowings 6,082,030 512,605 - 6,594,635
- corporate bonds 4,753,690 - - 4,753,690
- trade and other payables 34,247,432 - - 34,247,432
Total financial liabilities 45,083,152 512,605 - 45,595,757
At 31 March 2014:
- borrowings 48,320 663,699 - 712,019
- corporate bonds 8,480,612 4,753,763 - 13,234,375
- trade and other payables 23,265,949 - - 23,265,949
Total financial liabilities 31,794,881 5,417,462 - 37,212,343
Guarantees amounting to Shs 406 million (2014: Shs 88 million) have been issued against credit cards for use of senior staff and to various customers for services provided by the Company as detailed under Note 28.
Excluded from the trade and other payables is deferred revenues arising from unused airtime and unredeemed Bonga points under Loyalty Management System (LMS) amounting to Shs 5,393 million (2014: Shs 5,778 million) which are not expected to result into cash outflow in the normal course of business as detailed in Note 25.
NOTES (Continued)
103
4 Financial risk management (continued) Capital management
The Group’s objectives when managing capital are to safeguard its ability to continue as a going concern in order to provide returns for shareholders and to maintain an optimal capital structure to reduce the cost of capital. In order to maintain or adjust the capital structure, the Company may adjust the amount of dividends paid to shareholders.
The Company has a dividend policy that permits dividends to be paid if the Board of Directors finds that the payments are sustainable, after taking into account the sufficiency of distributable reserves and liquidity in order to ensure the Company’s operational needs and/or business growth are not limited by the unavailability of funds, as well as the Company’s known contingencies and compliance with any funding facility covenants.
The first priority of the Company will be to maintain sufficient distributable reserves and liquidity to ensure that operational needs and/or business growth are not limited by the unavailability of funds and also that facilities are available to cover all known contingencies. Additionally, any dividends will only be declared and paid where allowable under any covenants included in any funding facilities.
Subject to this, the Company intends to operate a progressive distribution policy based on what it believes to be sustainable levels of dividend payments.
Whenever possible, it will be the Company’s intention to, at least, maintain annual dividend payments at the level declared in the previous year. However, with respect to the initial dividend payment under the current policy, such dividends will not necessarily be at the level declared in the previous years, past dividend payments should not be taken as an indication of future payments.
The Company’s focus is to minimise funds tied up in working capital, whilst ensuring that the Company has sufficient financial ability to meet its liabilities as and when they fall due. The Company monitors capital on the basis of the gearing ratio. This ratio is calculated as net debt divided by total capital. Net debt is calculated as total borrowings less cash and cash equivalents. Total capital is calculated as equity plus net debt. The strategy is to maintain gearing at low levels as demonstrated by the position below for the year ended 31 March 2015.
Group Company
2015Shs’000
2014Shs’000
2015Shs’000
2014Shs’000
Total borrowings 10,639,980 12,615,380 10,639,980 12,615,380
Less: cash and cash equivalents (14,030,309) (17,618,884) (13,996,400) (17,585,006)
Net cash (3,390,329) (5,003,504) (3,356,420) (4,969,626)
Total equity 104,276,531 91,235,979 105,429,892 92,509,394
Total capital 100,886,202 86,232,475 102,073,472 87,539,768
Gearing ratio - - - -
Fair value estimation
Financial instruments measured at fair value are measured using the following levels of fair value measurement
hierarchy:
• Quoted prices (unadjusted) in active markets for identical assets or liabilities (level 1).
• Inputs other than quoted prices included within level 1 that are observable for the asset or liability, either directly (that is, as prices) or indirectly (that is, derived from prices) (level 2).
• Inputs for the asset or liability that are not based on observable market data (that is, unobservable inputs)
(level 3).
NOTES (Continued)

SAFARICOM ANNUAL REPORT 2015104
4 Financial risk management (continued)
Fair value estimation (continued)
The fair value of financial instruments traded in active markets is based on quoted market prices at the reporting date.
A market is regarded as active if quoted prices are readily and regularly available from an exchange, dealer, broker,
industry group, pricing service, or regulatory agency, and those prices represent actual and regularly occurring market
transactions on an arm’s length basis. The quoted market price used for financial assets held by the Group is the current
bid price. These instruments are included in level 1. Instruments included in level 1 comprise primarily NSE equity investments
classified as trading securities or available-for-sale.
The fair value of financial instruments that are not traded in an active market (for example, over-the-counter derivatives)
is determined by using valuation techniques. These valuation techniques maximise the use of observable market data
where it is available and rely as little as possible on entity specific estimates. If all significant inputs required to fair value an
instrument are observable, the instrument is included in level 2.
If one or more of the significant inputs is not based on observable market data, the instrument is included in level 3.
Specific valuation techniques used to value financial instruments include:
• Quoted market prices or dealer quotes for similar instruments.
• The fair value of interest rate swaps is calculated as the present value of the estimated future cash flows based on observable yield curves.
• The fair value of forward foreign exchange contracts is determined using forward exchange rates at the reporting date, with the resulting value discounted back to present value.
• Other techniques, such as discounted cash flow analysis, are used to determine fair value for the remaining financial
instruments.
5 Segment information Operating segments are reported in a manner consistent with the internal reporting provided to the chief operating
decision-maker (CODM). The CODM, who is responsible for allocating resources and assessing performance of the
operating segments, has been identified as the executive committee that makes strategic decisions.
Management has determined the operating segment based on the reports reviewed by the Senior Leadership Team (SLT)
for the purpose of allocating resources and assessing performance.
The SLT considers the business as one operating segment for purpose of financial performance. However, revenue targets
are split between the three business units namely Consumer, Enterprise and Financial services units. Currently the SLT reviews
the results of the segment on a monthly basis in a formal session where the Chief Financial Officer takes the SLT through all
the activities and their impact on the results of the segment.
The reason for looking at the business as one segment is because of the interrelated nature of the products and services
on offer as well as their dependence on the network infrastructure. Total profitability is discussed and action plans agreed
where necessary to improve performance. Other than revenue, there is no other discrete financial information relating to
the revenue streams that the CODM looks at.
The reportable operating segment derives its revenue from the provision of telecommunication services to its customers.
The SLT assesses the performance of the operating segment from revenue to net income. The total revenue, direct costs, trading
contribution, operating expenses, interest and foreign exchange gain and losses, tax and net income are reviewed.
Further key performance indicators are also reviewed; for instance, number of subscribers, minutes of use, originating
minutes, terminating minutes, average revenue per user, average revenue per minute, number of sites, data usage, etc.
are also reviewed monthly. Impacts of new financial policies are also explained to the SLT.
The Group’s interest-bearing liabilities are equal to the segment liabilities and are managed by the treasury function.
NOTES (Continued)
105
5 Segment information (continued)
The segment information provided to the SLT for the reportable segment for the years ended 31 March 2015 and 2014 is
as follows:
31 March2015
Shs’000
31 March2014
Shs’000
Total equity and non-current liabilities 104,767,293 96,338,359
Non-current assets 124,367,073 106,279,478
Current assets 32,590,553 28,321,468
Current liabilities 52,190,333 38,262,587
Net current liabilities (19,599,780) (9,941,119)
104,767,293 96,338,359
The amounts reported with respect to total assets and total liabilities are measured in a manner consistent with these financial statements.
Reportable segment assets are equal to total assets hence no reconciliation is required.
Revenue from subscribers is derived from the sale of airtime, handsets, accessories, M-PESA commissions and data products through the dealer network, direct top-up via M-PESA or through the Company’s 40 retail outlets across the country.
Breakdown of the revenue from all services is as follows:
Analysis of revenue by category2015
Shs’ 0002014
Shs’ 000
Voice revenue 87,406,168 84,368,191
Messaging revenue 15,632,926 13,619,377
Mobile Data revenue 14,823,188 9,313,532
Fixed service revenue 3,128,042 2,570,901
M-PESA revenue 32,625,688 26,561,297
Other service revenue 2,630,619 1,927,365
Total service revenue 156,246,631 138,360,663
Handset revenue 5,670,727 4,947,057
Acquisition and other revenue 1,446,763 1,364,757
Total Revenue 163,364,121 144,672,477
The Company and its subsidiaries are domiciled in Kenya. A high percentage of the Group’s revenue is
attributable to Kenya and all its non-current assets are located in Kenya.
Total revenue increased by 13% to Shs 163.4 billion through focusing on providing quality services, which has resulted in double digit growth across our non-voice service revenue streams.
NOTES (Continued)

SAFARICOM ANNUAL REPORT 2015106
5 Segment information (continued)
Voice service revenue which now stands at 54% of total revenue grew at 4% while non-voice service revenue which accounts for 42% of total revenue, realised a growth of 28% increase to Shs 68.8 billion driven mainly by M-PESA, Messaging, Data and Other Service Revenues. Devices and other revenue contribute 4% of total revenue.
M-PESA, now contributing 20% of total revenue, continues to be a significant driving force for growth. This was driven by a 14% increase in 30-day active M-PESA customers to 13.9 million as well as an increase in the average number of transactions per customer. The M-PESA agent outlets foot print was expanded to 85,756 with the key aim of promoting accessibility of the service to our customers.
Since its launch, the Lipa na M-PESA service has enabled cashless merchant payments and facilitated trade between businesses and their customers while improving business efficiency. In March 2015 the service had 49,413 merchants active on a 30-day basis, who received Shs 11.6 billion of payments.
Mobile Data revenue continues to register impressive growth and increased by 59% driven by a 21% growth in 30 day active mobile Data customers to 11.6 million with 4.3 million customers on 3G enabled devices of which 3.4 million are smartphone users.
Fixed service revenue increased by 22% to Shs 3.1 billion on the back of 23% growth in fixed data customers.
6 Other income Group
2015Shs’000
2014Shs’000
Gain on disposal of property, plant and equipment 83,549 44,492
Miscellaneous income 492,055 82,133
575,604 126,625
7 (a) Direct costsGroup
2015Shs’000
2014Shs’000
M-PESA commissions 12,284,482 10,684,973
Airtime commissions 10,627,538 9,562,518
Licence fees (spectrum, M-PESA and link leases) 8,035,527 7,961,745
Interconnect and roaming costs 7,035,439 6,462,237
Handset costs 6,593,263 5,395,430
Customer acquisition and retention 5,162,649 5,362,188
Value Added Services costs (Voice and SMS) 5,695,945 5,570,244
Other direct costs 1,273,733 964,379
56,708,576 51,963,714
NOTES (Continued)
107
7 (b) Other expensesGroup
2015Shs’000
2014Shs’000
Repairs and maintenance expenditure on property, plant and equipment 191,590 127,875
Operating lease rentals - buildings 750,489 604,024
Operating lease rentals - sites 1,084,596 954,094
Warehousing costs 235,606 213,802
Employee benefits expense (Note 9) 11,436,245 10,089,811
Auditor’s remuneration 39,194 34,834
Sales and advertising 5,407,949 4,523,811
Consultancy including legal fees 735,415 412,791
Site and facilities costs 10,387,188 9,257,598
Travel and accommodation 606,677 528,801
Computer maintenance 1,052,223 1,141,052
Office upkeep 618,424 522,520
Bad debts 201,552 142,742
Net foreign exchange losses, other than on borrowings and cash and cash equivalents 80,530 190,896
Other operating expenses 3,212,312 3,147,439
36,039,990 31,892,090
8 Net finance costsGroup
2015Shs’000
2014Shs’000
Finance costs:
Interest expense 1,073,091 1,494,836
Foreign exchange losses on cash and borrowings 274,629 387,522
1,347,720 1,882,358
Finance income:
Interest income (1,292,085) (1,140,069)
Foreign exchange gain on cash and borrowings (480,504) (555,343)
(1,772,589) (1,695,412)
Net finance (income)/costs (424,869) 186,945
NOTES (Continued)

SAFARICOM ANNUAL REPORT 2015108
9 Employee benefits expenseGroup
2015Shs’000
2014Shs’000
The following items are included within employee benefits expense:
Salaries and wages 6,911,984 6,072,059
Employee Performance Share Award Plan (EPSAP) 328,790 390,432
Retirement benefits costs:
- Defined contribution scheme 413,246 333,482
- National Social Security Fund 9,629 8,798
7,663,649 6,804,771
10 Employee share option (a) Employee Share Ownership Plan
The Group set up an Employee Share Ownership Plan (ESOP) in March 2010 where 101 million shares were allotted. Subject to vesting conditions, eligible employees were entitled to purchase units in a separately administered trust, each unit in the trust representing one share in the Company.
A total of 66,976,000 of the initially granted options vested on 26 February 2013. Of these options, nil, (2014: 65,428,000) were exercised by 26 February 2014 when the exercise period lapsed.
Shares representing the exercised options were issued from the Company’s authorised unissued share capital. The proceeds received were credited to share capital (nominal value) and share premium.
To be eligible for the scheme one must have been a permanent employee of the Company who had completed probation period or had been confirmed.
(b) Employee Perfomance Share Award Plan
On 1 July 2011, the Group implemented an Employee Perfomance Share Award Plan (outright grant) where shares are allocated to qualifying staff based on performance ratings achieved in the previous year’s performance appraisal process. Under the outright grant scheme, shares are purchased from the market and then transferred to eligible staff at no cost after a three-year vesting period. The shares are purchased and held by a trust until the end of the vesting period.
During the year 21.8 million shares were bought by the Trust, at a cost of Shs 313 million. Additionally, 24.9 million shares historically valued at Shs 194.7 million (2014: Nil) vested and were exercised by eligible staff.
The Trust currently holds 43.78 million shares at a total cost of Shs 564.58 million (2014: 46.8 million shares at a cost of Shs 446.3 million).
The scheme is a ‘cash-settled share based scheme’ as described in IFRS 2, Share based payments as the Company provides money to a trust to purchase shares which will be distributed to the entitled employees on the vesting date.
11 Income tax expenseGroup
2015Shs’000
2014Shs’000
Current income tax 13,193,780 12,164,104
Deferred income tax (Note 16) 1,084,462 (197,214)
Income tax expense 14,278,242 11,966,890
NOTES (Continued)
109
11 Income tax expense (continued) The tax on the Group’s profit before income tax differs from the theoretical amount that would arise using the applicable
income tax rate as follows:
Group
2015Shs’000
2014Shs’000
Profit before income tax 46,149,545 34,984,430
Tax calculated at the applicable income tax rate of 30% (2014: 30%) 13,844,864 10,495,329
Tax effect of:
Income not subject to tax (41,055) (6,237)
Expenses not deductible for tax purposes 504,065 440,218
Over provision of deferred tax in prior year (1,230) (59,419)
(Over) / under provision of current tax in prior years (28,402) 1,096,999
Income tax expense 14,278,242 11,966,890
12 Earnings per share Basic earnings per share are calculated by dividing the profit attributable to equity holders of the Company by the
weighted average number of ordinary shares in issue during the year.
2015 2014
Profit attributable to equity holders of the Company (Shs thousands) 31,871,303 23,017,530
Weighted average number of ordinary shares in issue (thousands) 40,065,428 40,065,428
Basic earnings per share (Shs) 0.80 0.57
Diluted earnings per share (Shs) 0.80 0.57
13 Share capital and share premium
Number of shares
(Thousands)Ordinary shares
Shs’000
Share premium
Shs’000Total
Shs’000
At 1 April 2013 40,000,000 2,000,000 1,850,000 3,850,000
New shares issued for the employee share option scheme 65,428 3,271 350,040 353,311
At 31 March 2014 and March 2015 40,065,428 2,003,271 2,200,040 4,203,311
The total authorised number of ordinary shares is 119,999,999,600 with a par value of Shs 0.05 per share.
The total number of non-voting non-participating redeemable preference shares is 5 with a par value of Shs 4 per share. These shares have the right to preference in the payment of the paid up par value in the event of liquidation of the Company and may be redeemed at any time by the Board of the Company subject to the provisions of the Kenyan Companies Act.
NOTES (Continued)

SAFARICOM ANNUAL REPORT 2015110
13 Share capital and share premium (continued) The additional shares relates to the Employee Share Option Plan. See details of this plan in Note 10.
The issued share capital comprises 40,065,428,000 (2014: 40,065,428,000) ordinary shares with a par value of Shs 0.05 each and 5 non-voting non-participating redeemable preference shares of Shs 4 each. All issued shares are fully paid.
14 Dividend per share No interim dividend was paid during the year (2014: Nil). At the annual general meeting to be held on 3 September
2015, a final dividend in respect of the year ended 31 March 2015 of Shs 0.64 (2014: Shs 0.47) per share amounting to a
total of Shs 25,641,874,000 (2014: Shs 18,830,751,000) is to be proposed.
Payment of dividends is subject to withholding tax at a rate of either 5% or 10% depending on the residence of the
respective shareholders.
15 Borrowings The Group has a five-year corporate bond of Shs 12,000,000,000 issued as a medium term note in two tranches and in
fixed and floating rate portions.
Tranche 1 which matured and was fully settled in November 2014 had a fixed portion of Shs 7,049,600,000 at a fixed rate of 12.25% and a floating portion of Shs 463,400,000 at a floating rate of 182-day treasury bill rate plus 1.85% margin.
Tranche 2 which matures in December 2015 has a fixed portion of Shs 4,287,000,000 at a fixed rate of 7.75% and a floating portion of Shs 200,000,000 at a floating rate of 182-day treasury bill rate plus 1.85% margin.
The Group has a two-year term loan facility with CfC Stanbic Bank Limited for a maximum of Shs 2,124,050,000 (USD 23 Million) for purchases of assets. The Group made a cumulative draw-down of Shs 1,729,531,879 by 31 March 2015. The outstanding loan balance at the close of the year was Shs 1,352,980,401. Interest on this facility is paid quarterly at the rate of 1.0% below the 91-day treasury bill rate.
The Group has two short term facilities totalling Shs 4,800,000,000 with a maturity date of December 2015; made up of Shs 2,400,000,000 held with Commercial Bank of Africa at an interest rate of 0.45% above the 91-day treasury bill rate payable quarterly and Shs 2,400,000,000 held with National Industrial Credit (NIC) bank at the rate of 0.3% above the 91-day treasury bill payable monthly.
The carrying amounts of the Corporate bond and the bank borrowings approximate to their fair value. None of the borrowings was in default at any time during the year.
Borrowings are made up as follows:
Group Company
2015Shs’000
2014Shs’000
2015Shs’000
2014Shs’000
Non-current:
Bank borrowings 490,762 615,380 490,762 615,380
Corporate bond - 4,487,000 - 4,487,000
490,762 5,102,380 490,762 5,102,380
NOTES (Continued)
111
Group Company
Current: 2015Shs’000
2014Shs’000
2015Shs’000
2014Shs’000
Bank borrowings 5,662,218 - 5,662,218 -
Corporate bond 4,487,000 7,513,000 4,487,000 7,513,000
10,149,218 7,513,000 10,149,218 7,513,000
Total borrowings 10,639,980 12,615,380 10,639,980 12,615,380
Movement in the borrowings
Opening balance 12,615,380 20,227,958 12,615,380 20,227,958
Borrowings 5,914,152 615,380 5,914,152 615,380
Repayments (7,889,552) (8,227,958) (7,889,552) (8,227,958)
10,639,980 12,615,380 10,639,980 12,615,380
16 Deferred income tax (a) Group
The analysis of deferred tax assets and deferred tax liabilities is as follows:
Group
2015Shs ‘000
2014Shs ‘000
Deferred tax assets:
– At start of year (2,750,879) (1,883,369)
– Credit to statement of comprehensive income (Note 11) 1,084,462 (867,580)
(1,666,417) (2,750,949)
Deferred tax liabilities:
– Deferred tax liability to be recovered within 12 months - 70
(1,666,417) (2,750,879)
Deferred income tax is calculated using the enacted income tax rate of 30% (2014: 30%).
At start of year (2,750,879) (2,553,665)
Credit to statement of comprehensive income (Note 11) 1,084,462 (197,214)
At end of year (1,666,417) (2,750,879)
Consolidated deferred income tax assets and liabilities and deferred income tax charge / (credit) in the statement of comprehensive income (SOCI) are attributable to the following items:
NOTES (Continued)
15 Borrowings (continued)

SAFARICOM ANNUAL REPORT 2015112
16 Deferred income tax (continued)
Year ended 31 March 20151.4.2014Shs’000
Charged/(credited)
to SOCIShs’000
31.03.2015Shs’000
Deferred income tax liabilities
Unrealised exchange gains 70 3,289 3,359
Deferred income tax assets
Property, plant and equipment (1,716,879) 1,250,801 (466,078)
Unrealised exchange loss (31,033) 13,826 (17,207)
Provisions (989,997) (183,454) (1,173,451)
Arising from fair value adjustment on acquisition of subsidiary (13,040) - (13,040)
(2,750,949) 1,081,173 (1,669,776)
Net deferred income tax asset (2,750,879) 1,084,462 (1,666,417)
Year ended 31 March 20141.4.2013Shs’000
Charged/(credited)
to SOCIShs’000
31.03.2014Shs’000
Deferred income tax liabilities
Unrealised exchange gains 79,266 (79,196) 70
Deferred income tax assets
Property, plant and equipment (1,863,706) 146,827 (1,716,879)
Unrealised exchange loss (252,096) 221,063 (31,033)
Provisions (504,089) (485,908) (989,997)
Arising from fair value adjustment on acquisition of subsidiary (13,040) - (13,040)
(2,632,931) (118,018) (2,750,949)
Net deferred income tax asset (2,553,665) (197,214) (2,750,879)
An amount of Shs 168 million (2014: Shs 204 million) worth of deferred tax assets relating to One Communications Limited has not been recognised in the financial statements. Although the Directors are confident that taxable profits will be realised in One Communications Limited within the foreseeable future, the amounts are time-barred and are awaiting an extension of the statutory utilisation period from the Kenya Revenue Authority.
NOTES (Continued)
113
16 Deferred income tax (continued) (b) Company
Company deferred income tax assets and liabilities are attributable to the following items:
Company2015
Shs’0002014
Shs’000
Deferred income tax liabilities
Unrealised exchange gains 3,359 70
Total deferred income tax liabilities 3,359 70
Deferred income tax assets
Property, plant and equipment: (466,078) (1,716,879)
Unrealised exchange loss (17,206) (31,033)
Provisions (1,173,451) (989,997)
Total deferred income tax assets (1,656,735) (2,737,909)
Net deferred income tax asset (1,653,376) (2,737,839)
In the opinion of the Directors, the deferred income tax balances are expected to be recoverable against
future profits.
NOTES (Continued)

SAFARICOM ANNUAL REPORT 2015114
17
Pro
pe
rty,
pla
nt a
nd e
qui
pm
ent
(a)
Gro
upN
etw
ork
in
frast
ruc
ture
Shs’
000
Ca
pita
l wo
rk
in p
rog
ress
(C
WIP
)*Sh
s’00
0
Lea
seho
ld
imp
rove
me
nts
Shs’
000
Ve
hic
les
&
eq
uip
me
ntSh
s’00
0Fi
bre
Shs’
000
Tota
lSh
s’00
0
At 3
1 M
arc
h 20
13
Co
st
161,
695,
370
13,8
31,1
773,
869,
419
18,6
46,1
98-
198,
042,
164
Ac
cu
mu
late
d d
ep
rec
iatio
n(8
7,11
7,47
0)-
(2,6
66,1
76)
(12,
962,
120)
-(1
02,7
45,7
66)
Ne
t b
oo
k a
mo
un
t74
,577
,900
13,8
31,1
771,
203,
243
5,68
4,07
8-
95,2
96,3
98
Ye
ar e
nde
d 3
1 M
arc
h 20
14
Op
en
ing
ne
t b
oo
k a
mo
un
t74
,577
,900
13,8
31,1
771,
203,
243
5,68
4,07
8-
95,2
96,3
98
Ad
diti
on
s-
27,7
80,7
23-
--
27,7
80,7
23
Reclassification
6,36
0-
--
(6,3
60)
-
Tra
nsf
ers
fro
m C
WIP
17,9
61,0
30(2
6,75
7,77
2)45
5,10
03,
888,
857
4,45
2,78
8-
Disp
osa
l(5
3)-
-(5
1,47
4)-
(51,
527)
De
pre
cia
tion
ch
arg
e(1
7,12
7,73
0)-
(454
,642
)(3
,655
,158
)(4
3,91
1)(2
1,28
1,44
1)
Imp
airm
en
t o
f ass
ets
***
(4,0
83,9
05)
--
--
(4,0
83,9
05)
De
pre
cia
tion
on
disp
osa
l53
--
50,2
41-
50,2
94
Clo
sing
ne
t b
oo
k a
mo
un
t
71,3
33,6
5214
,854
,128
1,20
3,70
15,
916,
544
4,40
2,51
797
,710
,542
At 3
1 M
arc
h 20
14
Co
st
179,
656,
346
14,8
54,1
284,
324,
520
22,4
83,5
804,
452,
788
225,
771,
362
Ac
cu
mu
late
d d
ep
rec
iatio
n(1
08,3
22,6
94)
-(3
,120
,819
)(1
6,56
7,03
6)(5
0,27
1)(1
28,0
60,8
20)
Ne
t b
oo
k a
mo
un
t71
,333
,652
14,8
54,1
281,
203,
701
5,91
6,54
44,
402,
517
97,7
10,5
42
NOTES (Continued)
115
17
Pro
pe
rty,
pla
nt a
nd e
qui
pm
ent
(c
ont
inue
d)
(b)
Gro
up (
co
ntin
ued
)N
etw
ork
in
frast
ruc
ture
Ca
pita
l wo
rk in
p
rog
ress
(C
WIP
)*
Ne
two
rk
ma
inte
nanc
e
spa
res*
*Le
ase
hold
im
pro
vem
ent
sV
ehi
cle
s &
e
qui
pm
ent
Fib
reTo
tal
Shs’
000
Shs’
000
Shs’
000
Shs’
000
Shs’
000
Shs’
000
Shs’
000
Ye
ar e
nde
d 3
1 M
arc
h 20
15
Op
en
ing
ne
t b
oo
k a
mo
un
t71
,333
,652
14,8
54,1
28-
1,20
3,70
15,
916,
544
4,40
2,51
797
,710
,542
Tra
nsf
ers
fro
m in
ven
tory
(N
ote
21)
--
890,
763
--
-89
0,76
3
Ad
diti
on
s-
32,8
12,6
34-
--
-32
,812
,634
Ac
qu
ired
in a
bu
sine
ss c
om
bin
atio
n
(No
te 3
0)-
1,03
6,71
4-
-16
,776
-1,
053,
490
Tra
nsf
ers
49,8
66-
-58
3 (
50,4
49)
--
Tra
nsf
ers
fro
m C
WIP
15,7
00,2
16(2
5,79
3,53
1)
32,1
3528
4,37
2 6
,170
,096
3,
606,
712
-
Disp
osa
l(1
1,57
0)-
-(6
9,50
0)(4
18,1
98)
-(4
99,2
68)
De
pre
cia
tion
ch
arg
e(1
6,57
2,94
6)-
(179
,847
)(3
59,2
72)
(4,4
78,2
11)
(260
,431
)(2
1,85
0,70
7)
Imp
airm
en
t o
f ass
ets
***
(2,5
82,1
22)
-(2
67,3
96)
--
-(2
,849
,518
)
De
pre
cia
tion
o
n d
ispo
sal
5,13
0-
-68
,344
415,
509
-48
8,98
3
Clo
sing
ne
t b
oo
k a
mo
un
t
67,9
22,2
2622
,909
,945
475,
655
1,12
8,22
87,
572,
067
7,74
8,79
810
7,75
6,91
9
At 3
1 M
arc
h 20
15
Co
st
195,
344,
992
22,9
09,9
4592
2,89
84,
539,
392
28,2
52,2
548,
059,
500
260,
028,
981
Ac
cu
mu
late
d d
ep
rec
iatio
n(1
27,4
22,7
66)
-(4
47,2
43)
(3,4
11,1
64)
(20,
680,
187)
(310
,702
)(1
52,2
72,0
62)
Ne
t b
oo
k a
mo
un
t67
,922
,226
22,9
09,9
4547
5,65
51,
128,
228
7,57
2,06
77,
748,
798
107,
756,
919
NOTES (Continued)

SAFARICOM ANNUAL REPORT 2015116
17
Pro
pe
rty,
pla
nt a
nd e
qui
pm
ent
(c
ont
inue
d)
(a)
Co
mp
any
Ne
two
rkin
frast
ruc
ture
Shs’
000
Ca
pita
l w
ork
in
pro
gre
ss(C
WIP
)*
Shs’
000
Lea
seho
ldim
pro
vem
ent
sSh
s’00
0
Ve
hic
les
&
eq
uip
me
ntSh
s’00
0Fi
bre
Shs’
000
Tota
lSh
s’00
0
At 3
1 M
arc
h 20
13
Co
st
161,
551,
669
13,8
09,1
783,
869,
418
18,5
63,4
47-
197,
793,
712
Ac
cu
mu
late
d d
ep
rec
iatio
n(8
7,04
1,02
9)-
(2,6
66,1
74)
(12,
903,
298)
-(1
02,6
10,5
01)
Ne
t b
oo
k a
mo
un
t74
,510
,640
13,8
09,1
781,
203,
244
5,66
0,14
9-
95,1
83,2
11
Ye
ar e
nde
d 3
1 M
arc
h 20
14
Op
en
ing
ne
t b
oo
k a
mo
un
t74
,510
,640
13,8
09,1
781,
203,
244
5,66
0,14
9-
95,1
83,2
11
Ad
diti
on
s-
27,7
80,7
23-
--
27,7
80,7
23
Reclassification
6,36
0-
--
(6,3
60)
-
Tra
nsf
er f
rom
CW
IP17
,961
,027
(26,
757,
772)
455,
100
3,88
8,85
74,
452,
788
-
Disp
osa
l(5
3)-
-(5
1,47
4)-
(51,
527)
De
pre
cia
tion
ch
arg
e(1
7,11
5,22
5)-
(454
,642
)(3
,646
,855
)(4
3,91
1)(2
1,26
0,63
3)
Imp
airm
en
t o
f ass
ets
***
(4,0
83,9
05)
--
--
(4,0
83,9
05)
De
pre
cia
tion
on
disp
osa
ls53
--
50,2
41-
50,2
94
Clo
sing
ne
t b
oo
k a
mo
un
t
71,2
78,8
9714
,832
,129
1,20
3,70
25,
900,
918
4,40
2,51
7 97
,618
,163
At 3
1 M
arc
h 20
14
Co
st
179,
519,
003
14,8
32,1
294,
324,
518
22,4
00,8
304,
446,
428
225,
522,
908
Ac
cu
mu
late
d d
ep
rec
iatio
n(1
08,2
40,1
06)
-(3
,120
,816
)(1
6,49
9,91
2)(4
3,91
1)(1
27,9
04,7
45)
Ne
t b
oo
k a
mo
un
t71
,278
,897
14,8
32,1
291,
203,
702
5,90
0,91
84,
402,
517
97,6
18,1
63
NOTES (Continued)
117
17
Pro
pe
rty,
pla
nt a
nd e
qui
pm
ent
(c
ont
inue
d)
(b)
Co
mp
any
(c
ont
inue
d)
Ne
two
rk
infra
stru
ctu
re
Ca
pita
l wo
rk
in p
rog
ress
(C
WIP
)*
Ne
two
rk
ma
inte
nanc
e
spa
res*
*Le
ase
hold
im
pro
vem
ent
sV
ehi
cle
s &
e
qui
pm
ent
Fib
reTo
tal
Ye
ar e
nde
d 3
1 M
arc
h 20
15
Op
en
ing
ne
t b
oo
k a
mo
un
t71
,278
,897
14,8
32,1
29-
1,20
3,70
25,
900,
918
4,40
2,51
797
,618
,163
Tra
nsf
er f
rom
Inve
nto
ry (
No
te 2
1)89
0,76
3-
--
890,
763
Ad
diti
on
s-
32,8
12,6
34-
--
-32
,812
,634
Ac
qu
ired
in a
b
usin
ess
co
mb
ina
tion
(N
ote
30)
-1,
036,
714
--
16,7
76-
1,05
3,49
0
Re
cla
ssifi
ca
tion
49
,865
--
583
(50,
448)
--
Tra
nsf
er f
rom
CW
IP15
,700
,216
(25,
771,
533)
32
,135
284,
372
6,14
8,09
8 3,
606,
712
-
Disp
osa
l(1
1,57
0)-
-(6
9,50
0)(4
18,1
99)
-(4
99,2
69)
De
pre
cia
tion
ch
arg
e(1
6,53
2,87
8)-
(179
,846
)(3
59,2
72)
(4,4
57,9
69)
(260
,431
)(2
1,79
0,39
6)
Imp
airm
en
t o
f ass
ets
***
(2,5
82,1
22)
-(2
67,3
97)
--
-(2
,849
,519
)
De
pre
cia
tion
on
disp
osa
ls5,
130
--
68,3
4241
5,51
1-
488,
983
Clo
sing
ne
t b
oo
k a
mo
un
t
67,9
07,5
3822
,909
,944
475,
655
1,12
8,22
77,
554,
687
7,74
8,79
810
7,72
4,84
9
At 3
1 M
arc
h 20
15
Co
st
195,
207,
649
22,9
09,9
4492
2,89
84,
539,
390
28,1
47,5
058,
053,
140
259,
780,
526
Ac
cu
mu
late
d d
ep
rec
iatio
n(1
27,3
00,1
11)
-(4
47,2
43)
(3,4
11,1
63)
(20,
592,
818)
(304
,342
)(1
52,0
55,6
77)
Ne
t b
oo
k a
mo
un
t67
,907
,538
22,9
09,9
4447
5,65
51,
128,
227
7,55
4,68
77,
748,
798
107,
724,
849
* C
ap
ital w
ork
ing
-in-p
rog
ress
larg
ely
re
late
s to
se
lf-c
on
stru
cte
d a
sse
ts n
ot
yet
co
mp
lete
d. T
he
se m
ost
ly in
clu
de
ne
two
rk in
fra
stru
ctu
re a
nd
fib
re t
ha
t h
ad
no
t b
ee
n b
rou
gh
t in
to u
se a
t ye
ar e
nd
.
** T
he
Gro
up
tra
nsf
err
ed
ne
two
rk m
ain
ten
an
ce
sp
are
s su
pp
ort
ing
the
ne
two
rk p
revi
ou
sly c
arr
ied
as
inve
nto
ry fr
om
inve
nto
ry to
pro
pe
rty,
pla
nt a
nd
eq
uip
me
nt i
n a
cc
ord
an
ce
w
ith IA
S 16
. Sh
s 16
1.6
mill
ion
be
ing
de
pre
cia
tion
rela
ting
to
pre
vio
us
yea
rs h
as
be
en
ac
co
un
ted
for i
n t
he
cu
rre
nt
yea
r as
the
am
ou
nt
is n
ot
sign
ific
an
t to
wa
rra
nt
a p
rior y
ea
r a
dju
stm
en
t. R
esu
ltan
tly n
o t
hird
ba
lan
ce
sh
ee
t h
as
be
en
pre
sen
ted
.
***
Imp
airm
en
ts a
mo
un
ting
to
Sh
s 2,
850
mill
ion
(20
14: S
hs
4,08
4 m
illio
n),
be
ing
th
e c
arr
yin
g v
alu
e o
f th
e a
sse
ts id
en
tifie
d a
s im
pa
ired
as
a re
sult
of t
he
on
go
ing
mo
de
rnisa
tion
p
rog
ram
me
pro
mp
ted
by
evo
lutio
n o
f te
ch
no
log
y, h
ave
be
en
inc
lud
ed
in t
he
co
nso
lida
ted
sta
tem
en
t o
f co
mp
reh
en
sive
inc
om
e.
NOTES (Continued)

SAFARICOM ANNUAL REPORT 2015118
18 Intangible assets(a) Group Goodwill Licence fees Total
Year ended 31 March 2014
Opening net book amount 219,151 1,422,011 1,641,162
Amortisation charge for the year* - (695,589) (695,589)
Closing net book amount 219,151 726,422 945,573
At 31 March 2014
Cost 219,151 6,772,768 6,991,919
Accumulated amortisation - (6,046,346) (6,046,346)
Net book amount 219,151 726,422 945,573
Year ended 31 March 2015
Opening net book amount 219,151 726,422 945,573
Additions - 2,894,630 2,894,630
Acquired in a business combination - 6,797,629 6,797,629
Amortisation charge for the year* - (555,421) (555,421)
Closing net book amount 219,151 9,863,260 10,082,411
At 31 March 2015
Cost 219,151 16,465,833 16,684,984
Accumulated amortisation - (6,602,573) (6,602,573)
Net book amount 219,151 9,863,260 10,082,411
The goodwill arose on acquisition of One Communications Limited. At the time of acquisition, the five-year plan reflected positive future cash flows which when discounted resulted in the net present value (NPV) exceeding the goodwill recognised.
Impairment tests for goodwill
Goodwill is allocated to the Group’s CGU identified according to operating segment level.
On an annual basis, the goodwill is tested for impairment. Goodwill is monitored by the management at the operating segment level. For the purposes of assessment of impairment of goodwill, One Communications business is viewed as an operating segment.
In assessing impairment of the goodwill, management have reviewed the five-year business plans of One Communications Limited and further discounted the cash flows for the same period to determine if the net present value exceeds the investment held in the books at year end. Revenue growth rates of 1% (2014: 5%) in the first year followed by 2% (2014: 3%) in the second and 2% (2014: 2.5%) for the third and fourth and 2% (2014: 2%) for the fifth year had been used. A discount rate of 9.63% (2014: 9.85%), being the Company’s cost of capital has been used.
The recoverable amount calculated based on value in use exceeded carrying value by Shs 118 million. A fall in the average annual revenue growth rate of 3% or a rise in discount rate of 6.1% would remove the remaining headroom.
From the assessment carried out at the end of the year, no impairment charge was accounted for as at 31 March 2015 (2014: Nil).
NOTES (Continued)
119
18 Intangible assets (continued)(b) Company Licence fees
2015 2014
Shs’000 Shs’000
Opening net book amount 714,931 1,409,334
Additions 2,894,630 -
Acquired in a business combination 6,797,629 -
Amortisation charge* (554,332) (694,403)
Closing net book amount 9,852,858 714,931
Cost 16,443,568 6,751,309
Accumulated amortisation and impairment (6,590,710) (6,036,378)
Net book amount 9,852,858 714,931
* In the years 2015 and 2014, the Group received credit notes from the Communications Authority of Kenya (CA) being rebates on 3G licence fees net of related costs. The credit notes amounting to Shs 12 million (2014: Shs 542 million) have been netted off against the period’s licences amortisation charge of Shs 555 million (2014: Shs 696 million). As a result, the net licence amortisation charge amount of Shs 543 million (2014: Shs 154 million) is presented in the Statement of Comprehensive Income.
NOTES (Continued)

SAFARICOM ANNUAL REPORT 2015120
19 Investments (a) Investment in subsidiaries
All subsidiaries are unlisted and have the same year end as the Company. The investments relate to cost of shares held in the subsidiaries.
Company
2015 2014
Shs’000 Shs’000
At start of year 745,891 745,891
Additional investment: East Africa Tower Company Limited 91,450 -
At end of year 837,341 745,891
The Company’s interest in its subsidiaries, all of which are incorporated in Kenya and are unlisted was as follows:
Company
Year end % interest 2015 2014
Held Shs’000 Shs’000
One Communications Limited and its subsidiaries (Comtec Training Management Service Limited; Comtec Integrations System Limited; and Flexible Bandwidth Service Limited) 31 March 100 741,941 741,941
Packet Stream Data Networks Limited 31 March 100 - -
IGO Wireless Limited 31 March 100 - -
Instaconnect Limited 31 March 100 3,950 3,950
East Africa Tower Company Limited 31 March 100 91,450 -
837,341 745,891
The investments in subsidiaries are carried at cost. These investments were assessed for impairment indicators as required as at 31 March 2015 and the Directors concluded that the investments are not impaired.
(b) Investment in associate
Group and Company
The movement in investment in associate is as follows: 2015 2014
Shs’000 Shs’000
At start of year 15,860 -
Share of profit (before tax) – before 10% acquisition in 2014 - 3,814
Acquisition of additional 10% shareholding - 551
Share of (loss) / profit (before tax) – after 10% acquisition (4,041 11,495
At end of year 11,819 15,860
NOTES (Continued)
121
19 Investments (continued) (b) Investment in associate (continued)
The investment in associate at 31 March 2015 represents the investment of 32.5% of the ordinary shares of The East African Marines Systems Limited (TEAMS). TEAMS is a private company and there is no quoted market price available for its shares. TEAMS’s place of business and country of incorporation is Kenya. There are no contingent liabilities relating to the Group’s interest in the associate.
TEAMS has a 30 June year end and derives its revenues from the provision of submarine fibre optic cable system. The fluctuation of the results of the associate is not expected to have a significant impact on the results of the Group. As such, the unaudited nine months results for the associate have been incorporated to the Group’s financial statements as at 31 March 2015.
Set out below are the summarised financial information for TEAMS as at 31 March 2015 which is accounted for using the
equity method;
Summarised statement of financial position 2015Shs’000
2014Shs’000
Current
Cash and cash equivalents 519,561 108,042
Other current assets (excluding cash) 28,977 264,318
Total current assets 548,538 372,360
Other current liabilities (including trade payables) (173,410) (342,572)
Total current liabilities (173,410) (342,572)
Non-current Assets 80,565 35,086
Liabilities (429,676) -
Net assets 26,017 64,874
Summarised statement of comprehensive income
Revenue 220,740 382,270
Depreciation (148) (906)
Other expenses (219,987) (339,158)
Profit before tax 605 42,206
Income tax expense - (12,662)
Post tax profit 605 29,544
The information above reflects the amounts presented in the financial statements of the associate (and not Safaricom Limited’s share of those amounts) adjusted for differences in accounting policies between the Group and the associates.
NOTES (Continued)

SAFARICOM ANNUAL REPORT 2015122
20 Indefeasible Rights of Use (IRUs)
(a) Group TEAMSShs’000
SEACOMShs’000
KPLCShs’000
ETISALATShs’000
TATAShs’000
EATCLShs’000
TotalShs’000
Year ended 31 March 2014
Opening net book amount 1,864,843 1,164,949 713,912 98,978 163,999 - 4,006,681
Additions 986,812 129,599 - - - - 1,116,411
Amortisation charge (136,360) (71,129) (40,825) (7,419) (12,262) - (267,995)
Closing net book amount 2,715,295 1,223,419 673,087 91,559 151,737 - 4,855,097
At 31 March 2014
Cost 3,049,467 1,531,226 816,494 111,280 183,914 - 5,692,381
Accumulated amortisation (334,172) (307,807) (143,407) (19,721) (32,177) - (837,284)
Net book value 2,715,295 1,223,419 673,087 91,559 151,737 - 4,855,097
Year ended 31 March 2015
Opening net book amount 2,715,295 1,223,419 673,087 91,559 151,737 - 4,855,097
Additions 203,545 3,627 21,818 - - - 228,990
Acquired in a business combination
- - - - - 91,450 91,450
Amortisation charge (157,679) (76,728) (72,946) (7,419) (12,260) - (327,032)
Closing net book amount
2,761,161 1,150,318 621,959 84,140 139,477 91,450 4,848,505
At 31 March 2015
Cost 3,253,011 1,534,853 838,312 111,280 183,914 91,450 6,012,820
Accumulated amortisation (491,850) (384,535) (216,353) (27,140) (44,437) - (1,164,315)
Net book value 2,761,161 1,150,318 621,959 84,140 139,477 91,450 4,848,505
NOTES (Continued)
123
20 Indefeasible Rights of Use (IRUs) (continued)
(b) Company TEAMSShs’000
SEACOMShs’000
KPLCShs’000
ETISALATShs’000
TATAShs’000
TotalShs’000
Opening net book amount 1,864,843 1,164,949 713,912 98,978 163,999 4,006,681
Additions 986,812 129,599 - - - 1,116,411
Amortisation charge (136,360) (71,129) (40,825) (7,419) (12,262) (267,995)
Closing net book amount 2,715,295 1,223,419 673,087 91,559 151,737 4,855,097
At 31 March 2014
Cost 3,049,467 1,531,226 816,494 111,280 183,914 5,692,381
Accumulated amortisation (334,172) (307,807) (143,407) (19,721) (32,177) (837,284)
Net book value 2,715,295 1,223,419 673,087 91,559 151,737 4,855,097
Year ended 31 March 2015
Opening net book amount 2,715,295 1,223,419 673,087 91,559 151,737 4,855,097
Additions 203,545 3,627 21,818 - - 228,990
Amortisation charge (157,679) (76,728) (72,946) (7,419) (12,260) (327,032)
Closing net book amount 2,761,161 1,150,318 621,959 84,140 139,477 4,757,055
At 31 March 2015
Cost 3,253,011 1,534,853 838,312 111,280 183,914 5,921,370
Accumulated amortisation (491,850) (384,535) (216,353) (27,140) (44,437) (1,164,315)
Net book value 2,761,161 1,150,318 621,959 84,140 139,477 4,757,055
NOTES (Continued)

SAFARICOM ANNUAL REPORT 2015124
21 Inventories – Group and Company 2015 2014
Shs’000 Shs’000
Network spare parts 1,065,857 1,722,904
Transfer to property, plant and equipment (890,763) -
Less: Provision for impairment losses (175,094) (832,141)
- 890,763
Handsets and accessories 808,072 1,902,532
Scratch cards 78,114 68,730
Starter packs 121,856 234,531
Stationery and other stocks 3,261 6,116
Less: Provision for impairment / obsolesce losses (11,488) (146,705)
999,815 2,065,204
Inventory work in progress 7,258,786 -
8,258,601 2,955,967
The cost of inventories recognised as an expense and included in the direct costs amounted to Shs 10,262 million (2014: Shs 8,579 million).
Inventory work in progress represents cost incurred on the ongoing construction of a secure communication network for the national police service. The total construction cost is estimated to be Shs 14,905 million.
22 Prepaid operating lease rentals – Group and Company Prepaid operating lease rentals relate to payments made in advance for the rental of sites on which the Company’s
equipment is located. The analysis of prepaid operating lease rentals is as follows:
2015 2014
Shs’000 Shs’000
At start of year 301,082 259,401
Additions 902,604 676,279
Amortisation charge for the year (760,122) (634,598)
At end of year 443,564 301,082
Current portion reflected in prepayments (442,562) (299,555)
Non-current portion 1,002 1,527
NOTES (Continued)
125
23 Trade and other receivablesGroup Company
2015Shs’000
2014Shs’000
2015Shs’000
2014Shs’000
Current:
Trade receivables 4,726,111 3,668,991 4,523,099 3,541,902
Less: Provision for impairment losses (985,030) (632,968) (985,030) (633,328)
3,741,081 3,036,023 3,538,069 2,908,574
Receivable from related parties (Note 27 (viii)) 1,798,49 1,548,078 2,006,2080 1,769,241
Less: Provision for impairment losses (33,268 (15,375 ) (33,268) (15,375)
1,765,228 1,532,703 1,972,940 1,753,866
Prepayments 2,562,660 1,819,456 2,542,789 1,788,059
Acquired in a business combination 41,685 - 41,685 -
Other receivables 2,204,145 1,785,058 2,006,413 1,671,570
Less: Provision for impairment losses (13,156) (426,623) - (412,760)
2,190,989 1,358,435 2,006,413 1,258,810
10,301,643 7,746,617 10,101,896 7,709,309
Movements on the provision for impairment of trade receivables are as follows:
Group Company
2015Shs’000
2014Shs’000
2015Shs’000
2014Shs’000
At start of year 1,074,966 1,686,207 1,061,463 1,672,704
Provisions made in the year: – trade and other receivables 318,442 317,515 318,442 317,515
– related parties 17,893 5,378 17,893 5,378
Release prior year provisions (83,508) (180,151) (83,508) (180,151)
Receivables written off during the year as uncollectible (296,339) (753,983) (295,992) (753,983)
1,031,454 1,074,966 1,018,298 1,061,463
The carrying amounts of the above receivables approximate their fair values.
NOTES (Continued)

SAFARICOM ANNUAL REPORT 2015126
24 Cash and cash equivalents Cash and cash equivalents comprise the following for the purpose of the statement of cash flows:
Group Company
2015 2014 2015 2014
Shs’000 Shs’000 Shs’000 Shs’000
Cash at bank and in hand 12,030,309 9,701,197 11,996,400 9,667,318
Short term bank deposits 2,000,000 7,917,687 2,000,000 7,917,688
14,030,309 17,618,884 13,996,400 17,585,006
25 Trade and other payablesTrade payables 5,168,700 4,402,955 4,977,891 4,135,697
Amounts due to related companies (Note 27(ix)) 1,296,946 1,243,068 1,468,092 1,343,854
Accrued liabilities
- Network infrastructure 15,111,622 5,664,994 15,110,677 5,662,170
- Customer loyalty credits 2,995,093 3,496,324 2,995,093 3,496,324
- Deferred revenue 2,398,208 2,282,136 2,398,208 2,282,136
- Inventory 821,918 1,003,934 821,918 1,003,934
- Other expenses 8,622,868 7,758,176 8,416,127 7,619,344
Other payables 5,008,544 3,621,473 4,953,061 3,702,285
Current portion 41,423,899 29,473,060 41,141,067 29,245,744
All customer loyalty credits (Bonga Points) which form a separate component of the sales transaction are reported as
deferred revenue and forms part of accrued liabilities.
The accrued liability relating to customer loyalty credits of Shs 2,995 million (2014: Shs 3,496 million) is expected to be
recognised into revenue as customers redeem their points.
Deferred revenue Shs 2,398 million (2014: Shs 2,282 million) relates mainly to unused airtime which will be recognised as
revenue upon customer usage and un-earned fibre revenue recognised over the lease period.
The carrying amounts of the current trade payables and accrued expenses approximate to their fair values.
NOTES (Continued)
127
26 Cash generated from operationsReconciliation of profit before income tax to cash generated from operations:
Group
2015Shs’000
2014Shs’000
Profit before income tax 46,149,545 34,984,430
Adjustments for:
Interest income (Note 8) (1,292,085) (1,140,069)
Interest expense (Note 8) 1,073,091 1,494,836
Transfer of inventory to property, plant and equipment (Note 17) (890,763) -
Depreciation on property, plant and equipment (Note 17) 21,850,707 21,281,441
Impairment charge on property, plant and equipment (Note 17) 2,849,518 4,083,905
Amortisation of intangible assets (Note 18) 555,421 695,589
Share of loss / (profit) from associate (Note 19 (b)) 4,041 (15,309)
Amortisation of IRUs (Note 20) 327,032 267,995
Movement in non-current prepaid operating lease rentals (Note 22) 525 700
Profit on sale of property, plant and equipment (83,549) (44,491)
Changes in working capital
- receivables and prepayments (2,555,026) (378,191)
- inventories (5,302,634) (721,673)
- payables and accrued expenses 11,950,839 1,647,738
Cash generated from operations 74,636,662 62,913,283
27 Related party transactions Vodafone Kenya Limited incorporated in Kenya, whose ultimate parent is Vodafone Group Plc, incorporated in the
United Kingdom, is the largest single shareholder of the Company. There are other companies in the Vodafone Group that are related to the Company through common shareholdings or common directorships
The following arrangements exist and form the basis of various transactions within the Group.
(a) The Company has roaming agreements with Vodafone affiliated companies in many countries around the world including the UK.
(b) The Company operates the M-PESA business on a licence basis. M-PESA is an innovative mobile payment solution that enables users to complete money transfer transactions pay for goods and services by use of mobile phone for which the Company earns a commission which is based on the amounts transacted. The Company also uses the M-PESA platform to sell airtime to M-PESA account holders as well as run the M-Shwari and KCB M-PESA product as detailed out in note 2(e).
The Vodafone Sales and Services Limited (VSSL), which owns the M-PESA solution, has entered into a Managed Services Agreement with the Company under which VSSL agrees to provide the M-PESA solution to the Company against which a licence fee is due quarterly.
NOTES (Continued)

SAFARICOM ANNUAL REPORT 2015128
27 Related party transactions (continued) The licence fee is based on either the higher of the number of active subscribers multiplied by a service fee rate which
is graduated depending on the number of subscribers (the service fee rate reduces with increase in number of active subscribers) or 10% of M-PESA revenues and is capped at 25% of the revenue for that quarter with a floor of 10% of revenue per quarter. The fee is payable quarterly.
M-PESA Holding Company Limited acts as the trustee for M-PESA customers and holds all funds from the M-PESA business in trust to ensure that those funds are safeguarded at all times.
(c) The Company has signed an agreement with Vodafone Sales and Services Limited, a company incorporated in England. The agreement is effective from 1 April 2011 to 31 March 2014, renewable every year. Under the agreement, Safaricom Limited will have access to Vodafone’s global price book and supply chain resources for purposes of procurement, terminals management, Vodafone technical expertise, best practice systems and processes, Vodafone knowledge bank, benchmarking reports, Vodafone Global Enterprise customers to increase revenues, Vodafone business assurance and the business and consumer products and marketing support.
The participation fee is fixed at an annual amount equal to six million Euros (EUR 6,000,000).
(d) The Company has employees who are seconded from Vodafone Group Services Limited (VGSL), UK. The payroll cost for the secondees is managed by VGSL UK and recharged to the Group for payment on a monthly basis.
The following relationships exist within the Group:
Related parties Held by Percentage of interest heldas at 31 March
2015 2014
Ultimate holding parent
Vodafone Group Plc
Domestic holding company
Vodafone Kenya Limited Vodafone Group Plc 40% 40%
Subsidiaries
One Communications Limited Safaricom Limited 100% 100%
Instaconnect Limited Safaricom Limited 100% 100%
Packet Stream Data Networks Limited Safaricom Limited 100% 100%
Safaricom Money Transfer Services Limited
Safaricom Limited 100% -
East Africa Tower Company Limited Safaricom Limited 100% -
IGO Wireless Limited Safaricom Limited 100% 100%
Flexible Bandwidth Services Limited One Communications Limited 100% 100%
Comtec Training and Management Services Limited
One Communications Limited 100% 100%
Comtec Integration Systems Limited One Communications Limited 100% 100%
Associate
The East African Marines Systems Limited (TEAMS)
Safaricom Limited 32.5% 32.5%
NOTES (Continued)
129
27 Related party transactions (continued)
The following transactions were carried out with related parties:
i) Sale of goods and services
Group
2015 2014
Shs’000 Shs’000
Vodafone (UK) Limited 53,338 78,478
Vodacom Tanzania Limited 118,248 155,984
Other Vodafone affiliates 63,895 90,262
M-PESA Holding Company Limited 32,625,688 26,493,408
32,861,169 26,818,132
ii) Purchase of goods and services
Group
2015Shs’000
2014Shs’000
Vodafone Sales and Services Limited 4,620,199 4,194,671
Vodafone Group Services Limited 584,223 463,096
Vodafone (UK) Limited 27,109 42,004
Other Vodafone affiliates 46,507 98,223
Vodacom Tanzania Limited 414,783 368,008
5,692,821 5,166,002
iii) Directors’ remuneration
Fees for services as director 16,585 14,125
Other emoluments 267,683 211,799
Emoluments in relation to past service - -
Total remuneration of directors of the Company 284,268 225,924
iv) Key management compensation
Salaries and other short-term employment benefits 709,769 542,227
Employee Performance Share Award Plan 63,563 50,097
Pension contribution 12,608 12,392
Termination benefits - 13,377
785,940 618,093
Key management are those persons having authority and responsibility for planning, directing and controlling the activities of the entity, directly or indirectly, including any Director (whether executive or otherwise) of the entity.
NOTES (Continued)

SAFARICOM ANNUAL REPORT 2015130
27 Related party transactions (continued) v) Loans from shareholders
There are no loans from shareholders outstanding at 31 March 2015 and 31 March 2014
vi) Loans to Directors of the Company
There are no loans to Directors of the Company at 31 March 2015 and 31 March 2014.
vii) Donations to Safaricom Foundation
Donations made during the year amounted to Shs 335 million (2014: Shs 302 million).
viii) Outstanding receivable balances arising from sale of goods/services
Group Company
2015 2014 2015 2014
Current: Shs’000 Shs’000 Shs’000 Shs’000
Vodafone (UK) Limited 3,791 49,309 3,791 49,309
Vodafone Group Enterprises 30,536 76,843 30,536 76,843
M-PESA Holding Company Limited 1,727,288 1,379,749 1,727,288 1,379,749
Other Vodafone affiliates 32,017 28,811 32,017 28,811
Vodacom Tanzania 4,864 13,366 4,864 13,366
One Communications Limited - - 120,664 134,115
Packet Stream Data Networks Limited - - 76,642 76,642
IGO Wireless Limited - - 10,406 10,406
1,798,496 1,548,078 2,006,208 1,769,241
Non-current:
Loan to One Communications Limited - - 633,408 707,906
1,798,496 1,548,078 2,639,616 2,477,147
ix) Outstanding payable balances arising from purchases of goods/services
Group Company
2015Shs’000
2014Shs’000
2015Shs’000
2014Shs’000
Vodafone Sales and Services Limited 1,226,854 1,027,138 1,226,854 1,027,138
Vodafone Group Services Limited 56,333 104,353 56,333 104,353
Vodafone (UK) Limited - 3,420 - 3,420
Other Vodafone affiliates 7,378 43,527 7,378 43,527
Vodacom Tanzania 6,381 64,630 6,381 64,630
One Communications Limited - - 168,674 98,314
IGO Wireless Limited - - 2,472 2,472
1,296,946 1,243,068 1,468,092 1,343,854
The receivables arise mainly from trading, are unsecured and bear no interest. A provision of Shs 33.2 million (2014: Shs 15.4 million) (Note 23) is held against receivables from related parties. The payables to related parties arise mainly from purchase transactions. The payables bear no interest. Settlement of obligations between related parties is done
in cash.
NOTES (Continued)
131
27 Related party transactions (continued)
(x) Loan to related party
Non-current: Group Company
2015Shs’000
2014Shs’000
2015Shs’000
2014Shs’000
Loan to related party - - 633,408 707,906
The loan to related party is a loan made by the Company to its subsidiary company, One Communication Limited
at an interest rate based on 91 days treasury bill rate plus 100 basis points. The repayment date is based on future
profit expected from One Communications Limited but has no fixed repayment terms. During the year, Shs 74.5 million
(2014: Shs 142.1 million) was repaid. The fair value of the loan approximates its carrying amount.
28 Contingent liabilities The Group has contingent liabilities in respect of legal claims arising in the ordinary course of business.
At 31 March 2015, a guarantee of Shs 25,000,000 (2014: Shs 20,000,000) had been given to Barclays Bank of Kenya
against credit cards for the use of senior staff during travel and a guarantee of Shs 381,375,171 (2014: Shs 67,853,424)
to various suppliers for goods and services regularly provided to the Company.
The Company has outstanding matters with the Kenya Revenue Authority (KRA).
The Directors have assessed the status of the contingent liabilities and as a result do not anticipate any material liabilities that may have an impact on these financial statements.
29 Commitments Capital commitments
Capital expenditure contracted for at the statement of financial position date but not recognised in the financial statements is as follows:
Group Company
2015Shs’000
2014Shs’000
2015Shs’000
2014Shs’000
Property, plant and equipment 11,019,446 6,799,338 11,019,446 6,799,338
Operating lease commitments
Not later than 1 year 1,023,680 890,325 1,023,680 890,325
Between 1 year and 5 years 2,803,301 3,192,480 2,803,301 3,192,480
Later than 5 years 2,030,991 1,717,608 2,030,991 1,717,608
5,857,972 5,800,413 5,857,972 5,800,413
NOTES (Continued)

SAFARICOM ANNUAL REPORT 2015132
29 Commitments (continued)
Operating lease commitments (continued)
Operating lease commitments relate to contracted leases for facilities and site rentals at the statement of financial
position date. The lease terms are between 6 years and 20 years, and the majority of the lease agreements are
renewable at the end of the lease period at market rates.
30 Business combination On 22 December 2014 Safaricom Limited completed its part of the transaction of acquisition of assets related to Essar
Telecom Kenya Limited (ETKL) business in exchange for a total cash consideration of Shs 7,539 million. The acquired business consists of ETKL Wireless network spectrum, passive network equipment, computer equipment, office fixtures and fittings and a 100% owned subsidiary, East Africa Tower Company Limited (EATCL). This was executed through three different agreements; direct asset transfer agreement, share purchase agreement and hive down agreement.
The acquisition is expected to bring synergy for Safaricom Limited and improve the quality of service offered to customers.
Safaricom Limited is currently going through the final stages of working capital adjustment settlement with respect to the acquisition. This is, however, not expected to have a material impact on the transaction. The fair value (same as the gross contractual amount) of other receivables was Shs 189.6 million. The entire amount is recoverable.
Acquisition-related costs of Shs 19.2 million have been charged to other expenses in the Statement of comprehensive income for the year ended 31 March 2015.
The amount of gain on asset purchase arising on acquisition was Shs 107.7 million after netting off Shs 442.0 million decommissioning costs. This was as a result of the fair value of the assets exceeding the consideration paid. The table below summarises the fair value of assets acquired:
AssetFair Value
Shs ‘000
Licences (spectrum) (Note 18) 6,797,629
Network equipment (Note 17) 1,033,200
Computer equipment (Note 17) 13,623
Office equipment (Note 17) 2,695
Furniture & fittings (Note 17) 458
Leasehold improvements (Note 17) 3,514
Investment in EATCL (Note 19) 91,450
Total 8,088,751
As at 31 March 2015, the consolidated statement of comprehensive income includes revenue contributed by the ETKL assets but due to the nature of Safaricom business, revenues generated from individual assets cannot be economically
identified.
......000......
NOTES (Continued)
133
Principal shareholders
The 10 largest shareholdings in the Company (ordinary shares only) and the respective number of shares held as at 31 March 2015 are as follows:
Name of shareholder Number of shares
1 VODAFONE KENYA LIMITED 16,000,000,000
2 CABINET SECRETARY TO THE TREASURY 14,022,572,580
3 STANDARD CHARTERED NOMINEES A/C KE002112 428,426,200
4 STANDARD CHARTERED NOMINEES NON-RESIDENT AC 9069 281,403,969
5 STANDARD CHARTERED NOMINEES NON-RESIDENT AC 9835 255,387,460
6 STANDARD CHARTERED NOMINEES NON RESIDENT A/C 9318 210,199,740
7 STANDARD CHARTERED NOMINEES NON RESIDENT A/C KE205311 194,585,700
8 STANDARD CHARTERED NOMINEES A/C KE11916 187,600,961
9 STANDARD CHARTERED NOMINEES NON-RESIDENT A/C KE10085 182,542,500
10 STANDARD CHARTERED NOMINEES NON-RESIDENT A/C 9853 120,805,419
11 OTHERS 8,181,903,471
Total 40,065,428,000
Distribution of shareholders
Numberof shareholders
Number of shares
% Share- holding
1 to 1000 397,215 240,505,106 0.60%
1001– 10,000 200,039 577,195,340 1.44%
10,001 – 100,000 23,954 599,442,629 1.50%
100,001 – 1,000,000 2,066 551,771,670 1.38%
1,000,001 – 10,000,000 428 1,440,655,863 3.60%
10,000,001 – 100,000,000 161 4,439,317,605 11.08%
100,000,001 – 1,000,000,000 11 2,193,967,207 5.48%
1,000,000,001 – 100,000,000,000 2 30,022,572,580 74.92%
Total 623,876 40,065,428,000 100.00%
SHAREHOLDINGINFORMATION

SAFARICOM ANNUAL REPORT 2015134

SAFARICOM ANNUAL REPORT 2015134 135
ADDITIONALINFORMATION
05

SAFARICOM ANNUAL REPORT 2015136
SAFARICOM LIMITED
TO ALL SHAREHOLDERS
NOTICE is hereby given that the Annual General Meeting of Safaricom Limited for the year 2015 will be held in the Indoor
Arena, Safaricom Kasarani Stadium, Thika Road, Nairobi on Thursday, 3 September 2015 at 11.00 am to conduct the
following business:
1. To receive, consider and adopt the audited Financial Statements for the year ended 31 March 2015 together with the
Chairman’s, Directors’ and Auditors’ reports thereon.
2. To approve a first and final dividend of Kshs 0.64 per share for the Financial Year ended 31 March 2015 as
recommended by the Directors. The dividend will be payable on or before 2 December 2015 to the Shareholders on
the Register of Members as at the close of business on 3 September 2015.
3. To note that in accordance with the provisions of Articles 90 and 91 of the Company’s Articles of Association, Mrs Susan
Mudhune retires at this meeting and, being eligible, offers herself for re-election.
4. To note that Messrs PricewaterhouseCoopers continue in office as Auditors by virtue of Section 159 (2) of the
Companies Act (Cap 486) and to authorise the Directors to fix the Auditors’ remuneration for the ensuing financial year.
5. Any other business of which due notice has been given.
BY ORDER OF THE BOARD
ENID MURIUKI (MRS)
SECRETARY
Date: 31 July 2015
NOTICE OF THE ANNUAL GENERAL MEETING06 / ADDITIONAL
INFO
137
NOTES
NOTICE OF THE ANNUAL GENERAL MEETING (continued)
(i) A member entitled to attend and vote at this meeting
is entitled to appoint a proxy to attend and vote in
his stead and a proxy need not be a member of the
Company. A form of proxy may be obtained from
the Company’s website (www.safaricom.co.ke) or at
Safaricom House, Waiyaki Way, Westlands, Nairobi, or
from any of the Safaricom Shops countrywide.
(ii) In the case of a member being a corporate, the
proxy form must be completed under its common
seal or under the hand of an officer or attorney duly
authorised in writing.
(iii) All proxy forms should be sent by post to Image
Registrars, PO Box 9287, 00100 Nairobi. Alternatively,
duly signed proxy forms can be scanned and
emailed to [email protected] in PDF format. Proxy
forms must be in the hands of the Secretary not later
than 48 hours before the time of holding the meeting.
(iv) In accordance with Article 145 of the Company’s
Articles of Association, a copy of the entire Annual
Report and Accounts may be viewed on and
obtained from the Company’s website (www.
safaricom.co.ke) or from the Registered Office of
the Company i.e. Safaricom House, Waiyaki Way,
Westlands, Nairobi. An abridged version of the
Financial Statements for year ended 31 March 2015
has been published with this notice.
(v) Registration of members and proxies attending
the Annual General Meeting will commence at
7.00 am on 3 September 2015. Production of a
National Identity Card, a passport, a current Central
Depository Statement of Account for shares held
in the Company or other acceptable means of
identification will be required.
(vi) The preferred method of paying dividends which are
below Kshs 70,000 is through M-PESA. Shareholders
who wish to receive their dividend through M-PESA
and who have not registered for this mode of
payment should contact Image Registrars on:
Tel: +254 20 2230330 / +254 20 2212065 /
+254 20 2246449
Mobile: +254 724 699 667 / +254 735 565 666 /
+254 770 052 116
Email: [email protected]
Or contact Safaricom Limited’s Investor Relations
Team on: Tel: +254 427 4233 / 3725 / 4746
Mobile: +254 722 004 233 / 3725 / 4746
Email: [email protected]
(vii) Transport will be provided to Shareholders on the
day of the meeting from the Kenyatta International
Convention Centre (KICC) parking bay to the
Safaricom Kasarani Stadium from 7.00 am to 10.00
am and back to KICC parking bay after the close of
the meeting.

SAFARICOM ANNUAL REPORT 2015138
BOARD OF DIRECTORS
Mr. Nicholas NgangaChairman & Non-Executive DirectorMr. Nganga (76) joined the Board of Safaricom Ltd on
6 May, 2004 and was elected Chairman on 16 January,
2007. He holds a BA Degree from Makerere University
and served as Permanent Secretary in the Ministries of
Finance, Foreign Affairs and Health.
Mr. Nganga has been involved extensively in the tea
industry and was Chairman of the Tea Board of Kenya.
He is the former Chairman of the National Bank of Kenya.
Currently, he is the Chairman of G4S Security, Car &
General Kenya and is a member of the Board of
Kakuzi Limited.
Mr. Robert CollymoreExecutive Director and CEOBob Collymore (57) has been the CEO of Safaricom
Limited since 1 November 2010. Prior to joining Safaricom,
Bob was the Chief Officer for Corporate Affairs in
Vodacom Group responsible for the Group’s Corporate
Communication, Ethics and Compliance, Legal, External
Relationships and Corporate Social Responsibility.
He also held the position of Vodafone’s Governance
Director for Africa and was responsible for developing
and driving Vodafone’s strategy for its investments in
Africa. This position saw him represent Vodafone as
a key direct foreign investor in a number of African
countries. Bob has more than 30 years of commercial
experience working in senior executive roles in the
telecommunications sector.
He also sits on the Board of Acumen, Vision 2030 Board, is
a trustee in the National Road Safety Trust and Chairman
of the TEAMS Board. Bob was recently re-appointed as a
Board Member on the United Nations Global Compact
Board.
Mr. Michael JosephNon-Executive DirectorMichael Joseph (69) joined the Board on 8 September
2008. Michael is employed by Vodafone Group Services
Limited as the Director of Mobile Money. He is also
Vodafone’s Strategic Advisor and sits in the board of
Vodacom Group South Africa, Vodacom Tanzania,
Vodacom Mozambique, Vodacom DRC and Safaricom
Limited in Kenya.
Michael was the CEO of Safaricom Limited from July
2000 when the Company was re-launched as a joint
venture between Vodafone UK and Telkom Kenya. He
retired in November 2010. During his tenure, he steered
the Company from a subscriber base of less than
20,000 to over 17 million subscribers. This phenomenal
growth straddling nearly a decade was motored by
the launch of many innovative products and services
such as M-PESA. Today, Safaricom is one of the leading
companies in East Africa and one of the most profitable
in the region.
He has extensive international experience in Company
start-ups, the implementation and operation of large
wireless and wire-line networks, including operations in
Hungary, Spain, Brazil, Peru, Argentina, Korea, the USA,
Australia and the Middle East.
Mr. Joseph, a U.S. citizen, has a BSc (cum laude) in
Electrical Engineering from the University of Cape Town
and is a member of the I.E.E.E. and I.E.E. (U.K.). He also
has an Honorary Doctorate Degree (Doctor of Letters)
from Africa Nazarene University, bestowed to him in
recognition of his contribution to the growth of Safaricom
from very humble beginnings to become one of the most
innovative, influential and profitable companies in the
East African region.
DIRECTORS AND SENIOR LEADERSHIP TEAM06 / ADDITIONAL
INFO
139
Esther KoimettNon-Executive Director and Alternate to Henry RotichEsther Koimett (58) joined the Board of Safaricom on 24
May 2005. She previously served on the Board between
11 April, 2001 and 5 September, 2002. She holds Bachelor
of Commerce and MBA degrees from the University of
Nairobi and is currently the Investment Secretary in the
Treasury. Esther has also served as Permanent Secretary
in the Ministry of Tourism and Information and Managing
Director, Kenya Post Office Savings Bank.
Nancy Wambaire Macharia Non-Executive DirectorMs Nancy Wambaire Macharia (49) joined the Board of
Safaricom on 16th, January 2007. She is a member of the
Board Audit Committee. Ms. Macharia joined JKUAT in
2004 as a lecturer and was appointed Deputy Director,
the School of Computing and Information Technology
between 2005 and 2013. She is a recognised research
consultant and educator in Design and Implementation
of Interactive Computer Systems, Information Systems
Security, Innovation and Technology Transfer for
Business Development, and Usability Engineering. Most
of her research activities centre on Social, Mobile and
Emerging Media and aligning IT and Business strategy.
Nancy is a member of the Computer Society of Kenya,
Public Relations Society of Kenya, Faraja Society and
the Kenya Institute of Directors. Nancy holds a Master’s
Degree in Computer Based Information Systems from
Sunderland University (UK) with her research area being
User Centred Design for Multi-user Database. Nancy also
has a Post Graduate Diploma in Project Management
from Catholic University of Eastern Africa and her
research was titled: The Influence of Women Participation
in the Success or Failure of IT projects.
Nancy is completing her PhD in Social and Mobile Media
Risk Management Strategies.
Ms Susan Mudhune, Non-Executive DirectorSusan Mudhune (65) holds a BA degree with Education
Option and MBA from the University of Nairobi. She is
a Fellow of Institute of Bankers and Kenya Institute of
Management. Susan is a Director at Eveready East
Africa, Pan Africa Insurance Holding and Centre for
Corporate Governance. She is a trustee of Management
University of Africa and Kenya Girl Guide Association.
John OttyNon-Executive DirectorJohn (50) is the Vodafone Regional Finance Director for
Africa, Middle East and Asia Pacific. He joined Vodafone in
December 1992 and has held a number of senior executive
positions in Vodafone including that of Group Technology,
Financial Director, interim CFO of Vodafone India and
Vodafone PLC Group Internal Audit Director. He was
appointed to the Safaricom Limited Board in August 2013.
Henry RotichNon-Executive DirectorMr. Henry K. Rotich (45) is the Cabinet Secretary for
National Treasury in Kenya. Prior to this appointment, Mr
Rotich was the Head of Macroeconomics at the Treasury,
Ministry of Finance since March 2006. In this position, he
was involved in formulation of macroeconomic policies
that ensured an affordable and sustainable path of
public spending aimed at achieving the Government’s
development priorities. He was also involved in
preparation of key budget documents, including the
Budget Statements, as well as providing strategic
coordination of structural reforms in the area of fiscal and
financial sector.
Prior to joining the Ministry of Finance, Mr. Rotich worked
at the Research Department of the Central Bank of
Kenya since 1994. Between 2001- 2004, he was attached
to the International Monetary Fund (IMF) local office in
Nairobi to work as an economist.
Mr. Rotich was also a director on several Boards of State
Corporations, including: Insurance Regulatory Board;
Industrial Development Bank; Communications Authority
of Kenya; and Kenya Bureau of Statistics.
Mr. Rotich holds a Master’s Degree in Public
Administration (MPA) from the Harvard Kennedy School,
Harvard University.
He also holds Master’s Degree in Economics and
Bachelor’s Degree in Economics (First Class Honours),
both from the University of Nairobi.
Gıanluca VenturaNon-Executive DirectorGianluca Ventura (48) has held the role of Vodafone
Group’s Human Resources Director Africa, Middle East
and Asia Pacific since October 2013.
Ventura held the roles of HR Director of Vodafone
Southern Europe since 2012 and of HR and Organisation
Director of Vodafone Italy since 2008. He joined Vodafone
in 2003 as Head of HR Technology and became Director
of the Vodafone Group’s Technology Department in 2006,
based in Newbury. Previously, he worked in L’Oreal, where
he held the role of Italy HR Director.
Graduated in Bocconi University in Milan, Ventura has a
CEMS Master’s Degree from Esade in Barcelona.
He joined the Board of Safaricom in March 2015.

SAFARICOM ANNUAL REPORT 2015140
Serpil Timuray Non-Executive DirectorSerpil Timuray (45) was appointed Executive Committee
Member of Vodafone Group and Regional CEO of
Africa, Middle East, Asia, Pacific in January, 2014. Prior
to this role, she was CEO of Vodafone Turkey since
January 2009.
Serpil has since September 2012 served as a Non-
Executive Board Member of Vodacom Group, a leading
African telecoms group headquartered in South Africa.
She was appointed to the boards of Vodafone India,
Vodafone Hutchison Australia, Safaricom Kenya in
November 2013 and Vodafone Qatar in June 2014. Serpil
was appointed as an independent director to the Board
of Danone in the AGM on 29 April, 2015. She also sits on
the Board of Trustees at Koc University, Turkey.
Serpil joined Vodafone as Chief Executive of Vodafone
Turkey in January 2009. She was previously General
Manager of Danone Turkey from 2002-2008. She began
her career in 1991 in marketing at Procter & Gamble
where she was later appointed to the Executive
Committee of Procter & Gamble Turkey.
Timuray was ranked 15th of the ‘International Most
Powerful Women’ by Forbes in 2014, 79th among the
‘World’s 125 Women of Impact’ by Newsweek in 2013
and selected as a ‘Young Global Leader’ by World
Economic Forum in 2009. She was elected as ‘The
Professional of the Year’ in Turkey for 2013, 2011 and
2010 by the Turkish Economist. She was also ranked 1st
among ‘The Most Powerful Woman CEO of Turkey’ by the
Turkish Economist magazine in 2014, 3rd among ‘The 30
Most Powerful Businesswomen in Turkey’ by the Capital
magazine in 2014, and 6th among ‘The Most Powerful
Business Women of Turkey’ in 2015.
A graduate of Bogazici University Business Administration,
she is married and a mother of one child.
John Tombleson Executive Director and Chief Finance OfficerJohn Tombleson (52) joined Safaricom as the Finance
Director in November 2011 from Vodafone Qatar, where
he held the roles of Acting Chief Executive Officer and
Chief Financial Officer. He is an original member of the
Qatar start-up team which was founded in 2008 and has
built a population market share of 48% within two years.
John first joined Vodafone in New Zealand in 2003 and
has since held senior financial roles in both mobile and
fixed telecommunications operations. He was previously
a Board member of Vodafone Qatar and Vodafone Fiji.
Prior to joining Vodafone, John was a management
consultant with clients across a variety of industries. John
has a Bachelor of Management Studies, with majors in
marketing and accounting.
Enid MuriukiCompany SecretaryEnid Muriuki (40) is a Certified Public Secretary with over
15 years of industry and consulting experience in matters
of corporate governance and statutory compliance.
She is a holder of a Bachelor of Science Degree from
Jomo Kenyatta University of Agriculture and Technology
and a Diploma in Business Management from Kenya
Institute of Management.
She is a Certified Public Secretary and a member of the
Institute of Certified Public Secretaries of Kenya.
DIRECTORS AND SENIOR LEADERSHIP TEAM06 / ADDITIONAL
INFO
141
Robert CollymoreChief Executive Officer (See profile on page 138)
John Tombleson Chief Finance Officer (See profile on page 140)
Sylvia Mulinge Director, Consumer BusinessSylvia is responsible for Consumer Business, which includes
dealers, M-PESA agents management and retail sales in
Safaricom’s 43 shops spread across the country. She is also
charged with consumer propositions and growing internet
and data content.
She joined Safaricom 9½ years ago and previously worked
as General Manager - Enterprise Business where she steered
the unit to its current status as the preferred partner of
choice for Kenyan businesses. Sylvia was also instrumental
in expanding Safaricom’s retail shop footprint and played a
critical role in converting them into viable profit centres.
Previously she worked for over five years at Unilever
both in Kenya and South Africa, gaining immense and
diverse experience in customer development, innovation
management, trade marketing, field sales as well as brand
management.
As a member of the Safaricom Sustainability Team, she
successfully led an initiative to embed sustainability in the
organisation and is spearheading an ambitious plan to
recruit additional members for the United Nations Global
Compact office in Kenya. In addition, she is an active
member of Make A Difference (MAD) and sits on the Board
of The Partnership for Maternal Newborn & Child Health
(PMNCH), a global health initiative hosted by the World
Health Organisation in Geneva. Sylvia was named one of
Kenya’s Top 40 Women Under 40 in 2014 and is passionate
about developing women leaders across the region. In this
respect, she is Executive Sponsor of the Safaricom Women
In Technology (WIT) initiative.
She holds a BA (Hons) of Science Degree from the University
of Nairobi and is pursuing an Executive MBA through the
University of Cape Town in South Africa.
Roy Masamba Director, ResourcesRoy joined Safaricom in November 2012. He is a Human
Resources executive with over 20 years international
experience gained working in various countries in Europe,
U.S.A., Africa & Middle East. Before joining Safaricom, Roy
worked with Vodafone Group for three years, having joined
them in December 2009. He was Regional HR executive for
Central Europe, Africa, Middle East & Asia Pacific before
taking up the role of Vice President, Human Resources for
Verizon Vodafone Enterprise Services. These roles were based
in London.
Additionally, Roy has headed the Human Resource function
in other multi-national companies including Zain Group and
British American Tobacco.
He started his career as an electrical engineer after
graduating from University of Zimbabwe with a BSc (Hons) in
Electrical Engineering. Thereafter, he moved into Operations
Management and Human Resources.
Roy has an MBA in General Management from Cranfield
School of Management (2005) in the United Kingdom.
Nicholas MulilaDirector, Risk ManagementNicholas is responsible for Risk Management functions of
the Company, including Enterprise Risk Management, Ethics
and Compliance, Revenue Assurance, Security and Anti-
Money Laundering.
He joined Safaricom in 2001 and rose through the ranks
to become a member of Senior Leadership Team. He has
held the positions of Senior Management Accountant and
Principal Business Planning and Forecasting Accountant
in the finance division, Head of Corporate Strategy
and Planning, Head of Commercial Planning/Pricing
Department, Executive Business Analyst and Programme
Management Officer.
Prior to joining Safaricom, Mulila worked for General Motors
(EA) and Eastern Produce (K) Ltd, where he held various
positions in finance.
Mr. Mulila holds a Bachelor of Commerce Degree
(Accounting Option) and a Master of Business
Administration Degree in Strategy from the University of
Nairobi. He is a Professional Accountant and Certified
Secretary and a member of the Institute of Certified Public
Accountants of Kenya (ICPAK) and the Institute of Certified
Public Secretaries of Kenya (ICPSK). He is a member of ASIS
(American Society for Industrial Security) International.
SENIOR LEADERSHIP TEAM

SAFARICOM ANNUAL REPORT 2015142
Rita OkutheDirector, Enterprise Business UnitRita joined Safaricom in August 2009 as Head of Consumer
Segments and later held the role of Director, Marketing
until she was appointed the General Manager for
Enterprise Business in March 2015.
Prior to joining Safaricom, she held several marketing
roles, including Head of Marketing at MTN Uganda. She
has several years work experience in advertising and
brand management and has successfully managed
brands at all stages; from infancy to maturity in both
monopolistic and highly competitive environments.
In 2014, Rita was nominated as one of the 50 global
CMOs to watch in the telecoms sector. She is one of
just 12 women around the world who have received
this accolade awarded by Global Telecoms Business
magazine. The 50 were chosen as a result of their
commitment to innovation in their fields and their ability
to communicate the role of operators and vendors in the
ever changing telecoms sector. She was recognised for
her role in crafting specialised marketing campaigns that
bring ‘Transforming Lives’ vision to life.
Rita has a Bachelor’s Degree in Economics and a Masters
of Science in Marketing.
Joseph OgutuDirector, Strategy & InnovationJoseph Ogutu joined Safaricom as Chief Corporate
Affairs Officer in May 2005 from Telkom Kenya where he
was the Principal Assistant to the Managing Director and
Chief Strategy & Regulatory Officer. He then served as
Chief Human Resource Officer from 2008 before taking
on the role of Director, Resources Division in the March
2011 Company reorganisation.
In October 2012, Mr. Ogutu was appointed as the Director,
Strategy & Innovation Division, where he works closely with
the CEO in formulating strategic direction for the business,
focusing on developing Safaricom’s position as an industry
leader on driving innovation in products & services.
He also serves as the Chairman of Safaricom Foundation
and sits on the Board of TEAMS Limited.
Mr. Ogutu has had a dynamic career in the
telecommunications industry, spanning more than 25
years, of which the last 12 have been at Executive
Committee level. During this period, he was actively
involved in the reform of the sector including the drafting
of the Postal and Telecommunication Policy Paper
that led to the restructuring of the defunct Kenya Posts
and Telecommunications Corporation and subsequent
establishment of Communications Commision of Kenya
(CCK), Telkom Kenya and Postal Corporation of Kenya.
He has also been involved in the establishment of the
institutional framework for the Eastern Africa Submarine
Cable System (Eassy).
Mr. Ogutu is a graduate of Economics from the University
of Nairobi.
Denish OsodoDirector, Internal AuditDenish joined Safaricom in October 2013. He is
responsible for providing Assurance over the Company’s
risk management, controls and governance processes.
He previously worked at PricewaterhouseCoopers (PwC)
for several years, offering audit and business advisory
services to companies in different industries during his
stints in Kenya and United Kingdom offices. He left PwC
as a Director in the Risk Assurance Services team focusing
on the provision of Internal Audit and Business Controls
Advisory Services to large businesses in the African
continent.
Denish graduated with a Bachelor of Commerce from
the University of Nairobi and is a practising member of the
Institute of Certified Public Accountants of Kenya (ICPAK).
Thibaud RerolleDirector, TechnologyThibaud joined Safaricom in January 2012. Previously he
was the Chief Technology Officer at Orange Dominicana
in the Dominican Republic.
He has a wealth of experience having worked in senior
management positions in France Telecom Group for
17 years in roles that covered Networks, Management,
International Assignments and Customer Services,
spanning six countries in Europe and South America.
Thibaud has a Bachelor of Sciences Degree in
Telecommunications Engineering with a specialisation
in Networks from the prestigious Telecom ParisTech
(ENST) and has also attended Prytanée National Militaire
Prepatory School in France.
Thibaud is fluent in six languages.
DIRECTORS AND SENIOR LEADERSHIP TEAM06 / ADDITIONAL
INFO
143
Betty MwangiDirector, Financial ServicesBetty joined Safaricom in December 2007 as Head of
New Products Division comprising M-PESA business and
GSMA projects. She was promoted to Chief Officer New
Products Division in October 2008 with the additional
responsibility for Safaricom’s Value Added Service.
She currently oversees the strategic growth, profitability
and development of M-PESA, the globally acclaimed
mobile money transfer service.
Ms. Mwangi has over 17 years experience in
the telecommunications industry. Prior to joining
Safaricom, she was Chief Marketing Officer at
Afsat Communications Ltd. She also worked with
GlaxoSmithKline for five years in various management
positions and was responsible for the East African
business and interoperability for Africa and Middle East.
In June 2010, she was featured by MCI (Mobile
Communications International) as one of the top 10 most
influential women in mobile globally and in August 2011
and 2013, she was recognised as one of the Top 20 most
powerful African Women in ICT by the IT News Africa.
In December 2011, Ms. Mwangi was recognised for her
contribution to Kenya’s Information Communications
Technology (ICT) sector by His Excellency, the then
President of Kenya, Hon. Mwai Kibaki who awarded her
the prestigious State Honours of the Moran of the Order
of the Burning Spear (MBS).
She holds a B. Eng. (Hons) in Electrical and Electronic
Engineering from the Victoria University of Manchester
and also has an MBA from the University of Leicester -
both in the UK. She is also a Chartered Marketer and a
member of the Chartered Institute of Marketing (CIM).
Stephen ChegeDirector, Corporate AffairsWith a deep background in Regulatory and Legal affairs,
Mr. Chege is responsible for the Corporate Affairs Division
which provides strategic support functions to Safaricom’s
operations. These functions include the Regulatory and
Public Policy, Legal and Secretarial Services; Corporate
Responsibility (incorporating the Safaricom and M-PESA
Foundations as well as Sustainability Reporting); and the
Corporate Communications functions.
Mr. Chege has a wealth of telecommunications
professional experience spanning over 14 years in
various organisations, including Vodafone Group UK. He
first joined Safaricom in 2006 as In-House Counsel, rising
over the years to hold the position of Senior Manager,
Public Policy & Market Regulation until 2011 when he
was appointed Head of Regulatory & Public Policy. In
April 2015, he became the Director, Corporate Affairs.
An advocate of the High Court of Kenya, Mr. Chege
holds a Masters in Law (LL.M) in International Trade and
Investment Law from the University of Nairobi and a
Bachelor of Laws Degree (LL.B) from the same university.
He is a Certified Public Secretary and a Trustee of the
Safaricom Foundation, where he nurtures his ambition to
provide access to education for young, disadvantaged
children. Mr. Chege is currently a member of the
Taskforce established under the Kenyan ICT Ministry to
develop the Policy Framework and Critical Infrastructure
Bill for the protection of critical ICT infrastructure.
Jannet Atika
Head, Customer OperationsJannet is currently the Head of Customer Operations.
She has over 21 years of experience working in the
telecommunication sector in various fields such as Public
Relations, Sales, Marketing and Customer Service.
She joined Safaricom in November 2000 as a Retail Shop
Manager and has held various roles, including Care
Centre Operations Manager, Senior Manager - Retail
Rollout & Support and Head of Department - Retail
Channels. Prior to joining Safaricom, Jannet was the
Head of Sales, Marketing and Public Relations at Gilgil
Telecommunication, then a subsidiary of Telkom Kenya.
Jannet has implemented various initiatives that have
brought significant improvements in both retail and
customer care operations.
She holds a Masters of Business Administration Degree in
Strategy from the University of Nairobi and a Bachelor of
Arts Degree in Economics and Sociology from Egerton
University. Jannet is an alumna of Strathmore Business
School (SBS) where she undertook a Program for
Management Development (PMD) and an Advanced
Management Development Program (AMP).

SAFARICOM ANNUAL REPORT 2015144
REGISTERED OFFICESafaricom House
Waiyaki Way, Westlands
P.O. Box 66827, 00800 Nairobi
Telephone: +254 20 427 4524/4260
Website: www.safaricom.co.ke
INVESTOR RELATIONSSafaricom House
Waiyaki Way, Westlands
P.O. Box 66827, 00800 Nairobi
Telephone: +254 20 427 4524/3725/4746
Email: [email protected]
Website: www.safaricom.co.ke
REGISTRARSImage Registrars Limited
5th Floor, Barclays Plaza
Loita Street
P.O. Box 9287, 00100 Nairobi
Telephone: +254 20 2230330/2212065/2246449
Email: [email protected]
Website: www.image.co.ke
AUDITORSPricewaterhouseCoopers
PwC Tower
Waiyaki Way, Westlands
P O Box 43963, 00100 Nairobi
Tel: +254 (20) 285 5000
Fax: +254 (20) 285 5001
Email: [email protected]
COMPANY SECRETARYMrs Enid Muriuki
Livingstone Associates, Deloitte Place
Waiyaki Way, Westlands
P O Box 43963, 00100 Nairobi
Tel: +254 719 039 000 / +254 (20) 4230 000
CORPORATE INFORMATION06 / ADDITIONAL
INFO
145
PROXY FORM
I/We
Of
Being a member of the above Company, hereby appoint:
Of
Failing whom, the Chairman of the Meeting, as my/our proxy, to vote for me/us and on my/our behalf at the Annual
General Meeting of the Company to be held on Thursday 3 September 2015 and at any adjournment thereof.
As witness my/our hand this day of 2015.
Signed
Signed
NOTE:
1. A member entitled to attend and vote is entitled to appoint one or more proxies to attend and vote in his stead and a
proxy need not be a member of the Company.
2. In the case of a member being a limited company this form must be completed under its Common Seal or under the
hand of an office or attorney duly authorised in writing.
3. Proxies must be in the hands of the Secretary not later than 48 hours before the time of holding the meeting. All proxies
should be sent by Post to Image Registrars of P O Box 9287, 00100 Nairobi. Alternatively, duly signed proxies can be
scanned and emailed to [email protected] in PDF format.

SAFARICOM ANNUAL REPORT 2015146
NOTES

SAFARICOM ANNUAL REPORT 2015146
NOTES

Transforming Lives
WWW.SAFARICOM.CO.KE


