
San Francisco International Airport2011 Environmental Sustainability Report
© Nic Lehoux Photography and Gensler
Table of Contents
1. SFO Profile 5
2. Green Buildings and Facilities 21
3. Climate Change 33
4. Energy Conservation and Renewable Energy 43
5. Air Quality 55
6. Noise Abatement 67
7. Water Conservation and Water Quality Enhancement 79
8. Natural Resources Management 85
9. Solid and Hazardous Waste Management 93
10. Employee Wellness 103
Appendix: SFO by the Numbers 109
Cover Photos: SFO’s Terminal 2 renovation project became the first airport terminal in the U.S. to receive LEED® Gold certification from the U.S. Green Building Council (USGBC). The building’s green design features include [Clockwise]:
1. energy-efficient lighting
2. paperless ticketing throughout the terminal, adding convenience and saving trees
3. abundant natural light and art installations from local artists
4. “hydration stations”, which allow travelers to refill reusable water bottles post-security
5. LEED Gold Certification Plaque, awarded by the USGBC to recognize the building’s sustainability performance
December 2011 l Prepared for the San Francisco International Airport Commission by (www.vhb.com)
1
A Message from the Director John L. Martin
San Francisco International Airport’s 2011 environmental sustainability report provides information on our recent initiatives to reduce the environmental impacts of our overall activities. A number of these accomplishments advance elements of our new five-year strategic plan, which defines our near-term goals and objectives. In particular, we are proud of the numerous “firsts” in which SFO has led the aviation industry. These “firsts” are consistent with our overall aspiration for the future, and our vision, in “Reaching for No. 1.”
Since our last Environmental Sustainability Report in 2007, SFO has continued to lead the industry by trying out new ideas and new technologies to reduce our greenhouse gas (GHG) emissions, improve our energy efficiency, reduce water use and waste generation, and conserve our natural resources. Some of our recent actions include:
f Renovation of Terminal 2, which became the first airport terminal in the U.S. to achieve Leadership in Energy and Environmental Design (LEED®) Gold certification from the U.S. Green Business Council.
f Achieving LEED Gold certification for the renovation of the new Airport Business Center.
f Reducing GHG emissions from SFO-controlled operations as well as providing financial and physical facility support for GHG emission reductions by SFO enterprises. SFO is well on its way to meeting the City’s mandate of 25% reduction from 1990 GHG emission level by 2017.
f Mitigating 99% of SFO’s carbon footprint by enabling the reduction of GHG emissions by SFO enterprises.
f Launch of an online visual flight tracking tool. This unique three-dimensional application enables near real-time monitoring of flights to more precisely assess noise impacts.
f Installation of “hydration stations” at Terminal 2, where passengers can easily refill water bottles post-security. These facilities help to significantly reduce the amount of plastic bottle waste.
f Reducing the amount of solid waste produced. In FY 2010 SFO increased its recycling and composting of recoverable materials to a record 74%. The recycling rate has continued to increase since the end of FY 2010.
f Installing infrastructure to support electric vehicles. As use of electric vehicles becomes more widespread, the Airport has installed publicly accessible charging stations in the garages.
f Tree planting. SFO has planted over 2,000 trees around the Airport over the past few years; one of the best things to do for air quality and the environment.
At San Francisco International Airport we are proud of our accomplishments, but we also understand that to become and stay the No. 1 Airport in the country requires continuous improvement in all facets of our operations. The Airport Commission, and SFO management and employees have embraced this responsibility and are committed to our mission to provide an exceptional airport in service to our communities.
John L. Martin Airport Director

2
Five-year Strategic Objectives
1. Be ranked No. 1 by passengers in the following categories:
US International Gateway Airport in customer satisfaction by ACI-ASQ survey.
US International Airport in customer satisfaction for overseas travelers by Skytrax survey.
2. Be considered a world-class airport by customers.
3. Be nimble about meeting passenger demands and needs for services.
4. Be the airport of choice for premium passengers.
5. Have the most efficient airport ground transportation system in the country.
1. Ensure SFO can meet passenger traffic growth in the next five years and improve airlines’ on time arrival performance to 75%.
2. Ensure competitive air service.
3. Increase current international passenger traffic by 30% in five years.
4. Maintain average CPE below $18.90 in constant FY 07-08 dollars in order to maintain and attract airline service.
1. As part of maintaining average CPE below $18.90, achieve non-airline revenues below:
2011/2012 $358 M 2012/2013 $375 M 2013/2014 $387 M 2014/2015 $396 M 2015/2016 $403 M
2. Increase per passenger spending annually as follows:
Food & Beverage 2.5% Retail 3.0% Duty Free 3.5%
1. Be ranked one of the Bay Area’s best employers in SF Business Times’ annual list.
2. Be known for innovation, expertise, and management excellence in the aviation industry.
Customers/Passengers
Airlines/Aircraft/Routes
Non-airline Revenue
Employees and Organization
SFO recently undertook a strategic planning process that resulted in the identification of eight strategic goals, each with supporting objectives. These goals and objectives will guide the Airport’s decision-making through 2016. As part of the strategic planning process, SFO asked 23 Task Forces-comprised of representatives from across the organization-to work with three steering committees to develop strategic initiatives that will help the Airport achieve its goals and objectives. These Task Forces worked for eight months and were guided by the Airport’s overall aspiration for the future, its vision, of “Reaching for No. 1”. Many of these objectives overlap with the Airport activities described in this report.
REACHING FOR
Number
CPE=Cost per enplaned passenger

3
1. Achieve 100% mitigation of SFO-controlled GHG emissions by 2012.
2. Achieve 50% reduction in baseline GHG emissions from SFO-controlled operations by 2015.
3. Increase the solid waste recycling rate to 80%.
4. Achieve LEED Gold certification in all new buildings.
1. To be an airport innovative leader in safety & security and implement at least two new industry-leading security programs in the next five years.
2. Maintain SFO’s airfield in as safe as possible condition through the use of technology, procedures, inspections and continual evaluation of airfield best practices.
3. Be the least vulnerable US airport to terrorist activity and possess the best integrated response capability.
4. Coordinate the sharing of information and planning among all federal and local law enforcement agencies to ensure all the dots are continually connected.
1. As part of maintaining average CPE below $18.90, invest in capital projects strategically.
2. Minimize overall life cycle costs of facilities.
3. Maintain the airport’s infrastructure in optimal condition.
4. Continue to invest in capital projects that make the airport environmentally sustainable.
5. Implement projects that will generate net revenue to the extent possible, while meeting the airport’s mission.
1. Support awareness among government entities of SFO as a successful enterprise, that is well managed and a valuable asset to San Francisco and the Bay Area communities.
2. Develop and maintain productive relationships with government agencies and local cities and counties.
3. Increase local business participation with SFO.
4. Develop and maintain a model employment development program for the benefit of the communities that SFO serves.
Environmental Sustainability
Safety and Security
Infrastructure External Relations

photo courtesy of Calbookaddict/en.wikipedia
An aerial view of San Francisco
International Airport.

5
San Francisco International Airport (SFO) is the premier airport
serving Northern California, located on San Francisco Bay 14 miles
south of the City. SFO has long demonstrated its commitment to
environmental stewardship, implementing ambitious initiatives
ranging from reducing carbon emissions to reducing aircraft noise.
SFO strives for excellence and identifies environmental sustainability
as one of the key pillars of its mission. This chapter describes
the context for environmental sustainability within the airport
organization and provides a snapshot of SFO’s environmental
sustainability performance.
1. SFO Profile
SFO’s Mission is “to provide an exceptional airport in service to our communities”

6
1 1. SFO Profile
7
SFO 2010 Snapshot
Airport Land Uses
Airport land uses are broadly categorized as
either “airside” (where aircraft operate) or “landside”
(devoted primarily to passenger uses, airport
administration, and support).
Airside Land Uses
SFO currently maintains four intersecting runways:
two parallel east-west runways and two parallel
north-south runways. The majority of aircraft
landings occur on Runways 28R and 28L and the
majority of the takeoffs occur from Runways
1R and 1L.
Landside Land Uses
Ten years ago, the Airport underwent a major
expansion, adding more than 5 million square feet
of new landside improvements including:
f A new International Terminal;
f Two new boarding areas;
f A new Airport people-mover (AirTrain);
f A new multi-modal connection for Bay Area
Rapid Transit (BART) and AirTrain;
f Various other office/administrative space, airline
maintenance support, and air cargo, and;
f Parking, roadway, and other transportation-
related improvements.
f In FY 2010, SFO also undertook the renovation
of Terminal 2, converting the old International
Terminal to a world class LEED® Gold certified
terminal for domestic airlines.
Airside:
1,700 acres
Runways:
28R/10L (11,870 feet)
28L/10R (10,602 feet)
1R/19L (8,648 feet)
1L/19R (7,500 feet)
Natural Tidelands and Wetlands:
2,500 acres
Landside:
1,000 acres
Major Facilities:
Terminal Complex
Airport Business Center
Engineering Building
Building and field maintenance facilities
Crash/fire/rescue facilities
Utilities
Aircraft fueling
Airport police
Commercial enterprises
Rental car facilities
Employees:
1,849 Full Time Employee Equivalents
in FY 2010
Activity Levels:
2010 Operations: 387,248
2010 Passengers: 39,391,234
2010 Cargo Tons: 426,724

8
1 1. SFO Profile
Operations0 100,000 200,000 300,000 400,000 500,000
20002001200220032004200520062007200820092010 387,248
Passengers0 10,000,000 20,000,000 30,000,000 40,000,000 50,000,000
20002001200220032004200520062007200820092010 39,391,234
Cargo0 200,000 400,000 600,000 800,000 1,000,000
20002001200220032004200520062007200820092010 426,724
Aircraft Operations
In 1997, aircraft operations (aircraft landings and
takeoffs) peaked at SFO and remained fairly stable for
the following four years. The number of operations
dropped after the events of September 11, 2001 but
has shown improvement in subsequent years.
Passenger Activity
The number of passengers flying to and from SFO
peaked in 2000 and then declined until 2003. This
number has increased steadily since 2003. Aircraft load
factors have also continued to increase in recent years
in response to high fuel costs and other economic
factors; most airlines are flying their aircraft at the
highest historical load factors (the percentage of
aircraft seats occupied).
Cargo Activity (metric tons)
Cargo shipments at SFO peaked in 2000 and remained
steady through most of the decade. In recent years,
cargo shipment at SFO has declined, reflecting the
impact of the current economic recession. However,
in 2010 cargo shipments showed a slight increase
compared to the 2009 level.
Aviation Activity
Airport activity levels refer to SFO annual aircraft operations, passenger traffic, and cargo loads. Activity levels provide a measure for Airport
growth and the context for assessing the Airport’s environmental performance.
SFO is one of the busiest airports in the U.S., ranking 15th in total annual aircraft operations for 2010.

9
30 (+4.7%)UNITED STATES
0.7 (+12.2%)MEXICO/CENTRAL
& SOUTH AMERICA
1.3 (+12.2%)CANADA
0.4 (-5.4%)OCEANIA
2.2 (-1%)EUROPE
4.2 (+10.4%)ASIA, INDIA
& MIDDLE EAST
millions of passengers (growth vs. 2009)
2010 SFO Passenger Travel by Region
In 2010, over 39 million passengers traveled to and from SFO. Of these passengers,
the majority (over 30 million) traveled domestically. In addition, SFO provides non-
stop service to Canada, Asia, Oceania, Europe, as well as Central and South America.
The two service areas that grew the most in 2010 compared to 2009 were Central
and South America (12.2% increase), as well as Asia, India, and the Middle East
(10.4% increase). SFO passenger volume has steadily increased since 2003.
Note: This graphic
includes enplaned and
deplaned passengers
at SFO and does not
include passengers who
fly into and out of SFO
on the same aircraft.
10
1 1. SFO Profile
SFO Environmental PerformanceSFO monitors its environmental performance in each of
the categories described below.
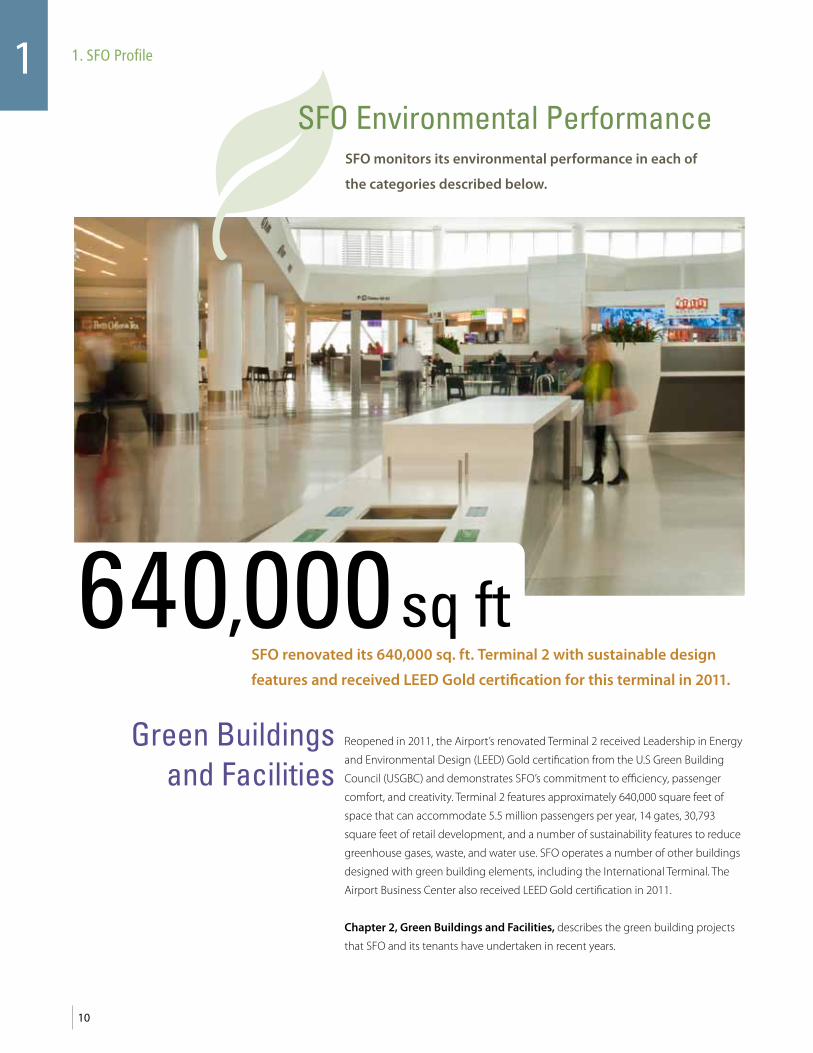
SFO renovated its 640,000 sq. ft. Terminal 2 with sustainable design
features and received LEED Gold certification for this terminal in 2011.
Reopened in 2011, the Airport’s renovated Terminal 2 received Leadership in Energy
and Environmental Design (LEED) Gold certification from the U.S Green Building
Council (USGBC) and demonstrates SFO’s commitment to efficiency, passenger
comfort, and creativity. Terminal 2 features approximately 640,000 square feet of
space that can accommodate 5.5 million passengers per year, 14 gates, 30,793
square feet of retail development, and a number of sustainability features to reduce
greenhouse gases, waste, and water use. SFO operates a number of other buildings
designed with green building elements, including the International Terminal. The
Airport Business Center also received LEED Gold certification in 2011.
Chapter 2, Green Buildings and Facilities, describes the green building projects
that SFO and its tenants have undertaken in recent years.
sq ft640,000Green Buildings
and Facilities
11
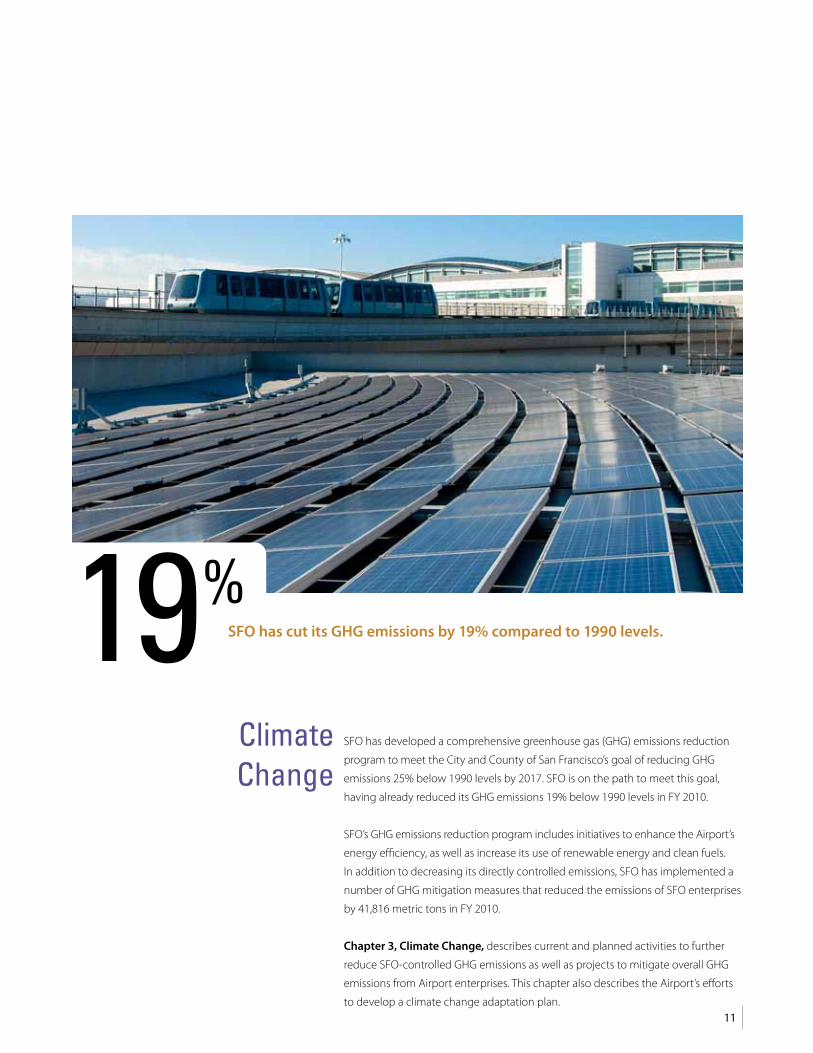
SFO has developed a comprehensive greenhouse gas (GHG) emissions reduction
program to meet the City and County of San Francisco’s goal of reducing GHG
emissions 25% below 1990 levels by 2017. SFO is on the path to meet this goal,
having already reduced its GHG emissions 19% below 1990 levels in FY 2010.
SFO’s GHG emissions reduction program includes initiatives to enhance the Airport’s
energy efficiency, as well as increase its use of renewable energy and clean fuels.
In addition to decreasing its directly controlled emissions, SFO has implemented a
number of GHG mitigation measures that reduced the emissions of SFO enterprises
by 41,816 metric tons in FY 2010.
Chapter 3, Climate Change, describes current and planned activities to further
reduce SFO-controlled GHG emissions as well as projects to mitigate overall GHG
emissions from Airport enterprises. This chapter also describes the Airport’s efforts
to develop a climate change adaptation plan.
SFO has cut its GHG emissions by 19% compared to 1990 levels.19%
Climate Change

12
1 1. SFO Profile
SFO Environmental PerformanceSFO monitors its environmental performance in each of
the categories described below.
SFO has reduced its electricity consumption by 6.3% since 2004,
despite increases in passenger activity.
Starting in 2007, SFO has implemented a number of electric energy efficiency
projects which along with planned projects will achieve 10,938 MWh of electricity
savings per year. With over 49 electric energy efficiency projects implemented to
date, by FY 2010 the Airport had reduced its electricity consumption by 6.3%
compared to FY 2004 electricity use. Projects implemented to date include lighting
improvements, HVAC efficiency improvement projects, and SFO Information
Technology energy saving measures.
Chapter 4, Energy Conservation and Renewable Energy, describes SFO’s efforts
to enhance the energy efficiency of airport facilities, provide a diverse mix of clean
fuel infrastructure, and use alternative sources of power for facilities and equipment.
6.3%
Energy Conservation and
Renewable Energy

13
SFO has continued its comprehensive air quality enhancement program to minimize air quality impacts
from aircraft and associated ground service equipment (GSE), cars, and buses at the Airport, and from
fuel and energy use at Airport facilities. Elements of SFO’s air quality improvement program include:
f Converting SFO’s fleet vehicles to clean fuels,
such as compressed natural gas (CNG) and
biofuel, or using electric vehicles
f Offering incentives to passengers and rental
car companies to increase the availability and
use of fuel efficient rental cars
f Encouraging employees and passengers to use
alternative transportation by providing efficient
public transportation access to the Airport and
offering employees incentives to use public transit
f Reducing air pollutant emissions resulting from
airside operations by providing ground power
and preconditioned air to aircraft at the gates,
encouraging aircraft single-engine taxiing,
electrifying GSE, and providing airside
alternative fuel infrastructure
Chapter 5, Air Quality, describes the air quality benefits of improvements to SFO’s transportation system.
To date, more than 500 diesel and gasoline-powered vehicles have been
converted to or replaced with vehicles using alternative fuels , resulting
in savings of 1.3 million gallons of gasoline and diesel fuel per year.
1.3 million
Air Quality

14
1 1. SFO Profile
SFO Environmental PerformanceSFO monitors its environmental performance in each of
the categories described below.
SFO has eliminated all incompatible land uses within the State CNEL
65 dB noise contour.
Through its noise insulation program, SFO became the first major airport in
California to eliminate all incompatible land uses within the State Community
Noise Equivalent Level (CNEL) 65 decibel (dB) noise contour line and to operate
without a variance. Incompatible land uses include residences, schools, hospitals,
convalescent homes and places of worship, which could be adversely affected by
excessive noise, as defined in Title 21 of the California Code of Regulations.
In 2011, SFO released a powerful new user-controlled online flight tracking tool,
which provides the public with live flight information for aircraft anywhere in the
SFO airspace. Users can utilize this tool to identify the location, altitude, operator
(airline), flight number, and departing/arriving airport (SFO, San Jose, or Oakland).
Please visit http://www.flyquietsfo.com/.
Chapter 6, Noise Abatement, describes SFO’s ongoing efforts to reduce the
impacts of noise on its neighboring communities.
0Noise
Abatement

15
SFO has reduced its potable water use by 14% since 2004.
SFO’s rigorous water conservation program has resulted in a decline in total Airport
water use by 14% since 2004. In 2010, water use per passenger reached a new low
of 12 gallons per passenger, down from 16.6 gallons per passenger in 2006. This
steady decline in water use can be attributed to a number of water efficiency
measures that SFO has implemented, including installing low-flow and sensor-
operated restroom fixtures, elimination of unnecessary hydrant flushing, and
replacement of aging and leaking water distribution pipes.
Chapter 7, Water Conservation and Water Quality Enhancement, describe
the water conservation initiatives and water quality protection activities that SFO
has undertaken.
14%
Water Conservation

16
1 1. SFO Profile
SFO Environmental PerformanceSFO monitors its environmental performance in each of
the categories described below.
SFO has mitigated for 32 acres of on-Airport fill by improving 558
acres of existing wetlands and tidal marshes, including the creation
of over 80 acres of new wetlands throughout the Bay Area.
As mitigation for the Airport’s Master Plan construction projects, SFO has compen-
sated for 32 acres of on-Airport fill by improving 558 acres of wetlands and tidal
marshes (including the creation of 84 acres of new wetland) throughout the Bay
Area, committing more than $20 million to this effort. Over the past ten years, SFO
has also developed approximately 50 acres of landscaping around the Airport. In
total, the Airport has planted 2,020 trees of over 15 different species, resulting in an
estimated 121 metric tons of carbon sequestration per year.
Chapter 8, Natural Resources Management, describes SFO’s efforts to improve
on-Airport environmentally sensitive habitats and manage wildlife, while maintaining
airport safety.
Natural Resources Management
558acres

17
SFO’s recycling in 2010 included composting 36% of airport waste, which was
processed at the facility shown in the photo above.
SFO has one of the largest recycling and composting programs in San Mateo
County and continues to demonstrate exemplary performance in recycling and
waste minimization. Notably, the Airport has increased its solid waste recycling rate
from 51% in 2002 to an impressive 74% in 2010, bringing SFO very close to
achieving its interim goal of recycling 80% of its solid waste by 2015. SFO’s recycling
in 2010 included composting 36% of airport waste, which was processed at the
facility shown in the photo above. SFO continues to recycle almost all of its
construction and demolition waste, with a consistent recycling rate over 90%.
Chapter 9, Solid and Hazardous Waste Management, describes SFO’s efforts to
reduce, reuse, and recycle waste, as well as effectively and safely manage the gener-
ation, storage, and disposal of hazardous materials and waste.
74%
Solid Waste Recycling

18
1 1. SFO Profile
SFO Environmental PerformanceSFO monitors its environmental performance in each of
the categories described below.
In 2011, 628 airport employees participated in a
walking challenge. Each team walked 1,016 miles
over the 10 week duration of the challenge.
To promote employee wellbeing, SFO has established an award-winning wellness
program with the goal of making the airport a more pleasant and healthy work-
place. Fitness classes, educational tools and information, as well as preventative
health care services such as flu shots and health screening, are provided at the
airport, making it easy for employees to participate in these programs and utilize
these services.
Chapter 10, Employee Wellness, describes SFO’s initiatives to promote employee
wellbeing.
Employee Wellness
1,016 miles

19
AwardsOver the years SFO has received a number of awards reflecting excellence in service, superior facilities, and diligence in environmental achievements. A sampling of these awards is shown below.
2011 f Leading Edge Editors’ Picks for Terminal 2 – Executive Travel
magazine
f Healthiest Place to Work for large companies (500-1,999 employees) in the greater Bay Area – San Francisco & Silicon Valley/San Jose Business Times
f Airports Council International North America Excellence in Airport Marketing & Communications Contest, 3rd Place, Social Media Campaigns
f Public Managerial Excellence Award to Cheryl Nashir, SFO Associate Deputy Airport Director for Revenue Development and Management— Municipal Fiscal Advisory Council
f Best Overall Concession Program, Large Airport (three-way tie)— Airport Revenue News
f Best Concessions Design, Large Airport (tie)— Airport Revenue News
f Best Airport in North America— Business Traveller Germany
2010 f Airport Safety Award— Federal Aviation Administration
f Best Overall Concessions Program, Large Airport— Airport Revenue News
f Second, Best Airports 2010 eDreams
f Fit Business Award (bronze) —California Task Force on Youth and Workplace Wellness
2009 f Best Airport Terminal in the United States— Dwell Magazine
f Best of Decade for International Terminal— San Francisco Chronicle
f Best of Decade for “You are Hear” Music Program— San Francisco Chronicle
f Silver Medal for Best Airport Website— flightglobal.com
f One of top Five US Airport Websites— aviation.com
f Best Airport Restaurants in the Country—poll, Airport Revenue News
f Fit Business Award (bronze) —California Task Force on Youth and Workplace Wellness
2008 f Best Airport in North America-Skytrax
f Fit Business Award—California Task Force on Youth and Workplace Wellness
f Nomination for Best Government Website, flysfo.com— Webby Awards
f Environmental Programs Award— U.S. Environmental Protection Agency Region 9
f Fit Business Award (silver) —California Task Force on Youth and Workplace Wellness
2007 f Environmental Management Award— Airports Council
International-North America
f Fit Business Award (silver) —California Task Force on Youth and Workplace Wellness
2006 f Best Airport in North America— CityBloc.com
f Best Airport in North America— Skytrax
f Herman C. Bliss Airports Partnership Award— Federal Aviation Administration
f Best Airport in North America— Business Traveller Germany
2005 and prior f Best Airport in United States Award— Executive Travel
Magazine, 2005
f Eagle Award International Air Transport Association, 2004
f Certified Forest Products Council Certified Sustainable Product Use Award, 2003
f Honored for Clean Vehicle Policy Natural Gas Coalition at 9th Annual Achievement Awards, October 2001
f Saluted by Secretary of Transportation Norman Y. Mineta for Leadership in Usage of Alternative Fuel Vehicles, May 2001
f “Clean Air Hero” Award the American Lung Association, received by SFO Senior Transportation Planner Roger Hooson for work to improve air quality, April 2001
f Excellence in Environmental Achievement Award Governor’s Office of Environment, 1998
f Environmental Action Award of Excellence San Mateo County Economic Development Association, September 1998
f Environmental Excellence Award Airport Council International, 1998

An interior view of
Terminal 2. The facility
features approximately
640,000 square feet
that can accommodate
5.5 million passengers
per year, 14 gates,
30,793 square feet of
retail development,
and a number of
sustainability features to
reduce greenhouse gases,
waste, and water use.
© Nic Lehoux Photography and Gensler
21
SFO Policy
Airport facilities, where practicable, shall be designed, constructed, and rehabilitated to make use of sustainable mate-
rials and green building techniques, meeting LEED Gold certification. SFO shall incorporate sustainability and life cycle
cost analyses into current and future planning, design, construction, operations, and maintenance of its facilities.
Objectives
f Achieve LEED Gold certification in all new buildings.
f Establish proven programs with baseline performance standards, from which operations can be
tracked and monitored.
f Ensure projects are in accordance with San Francisco Building Code Chapter 13C and California’s
Building Standards.
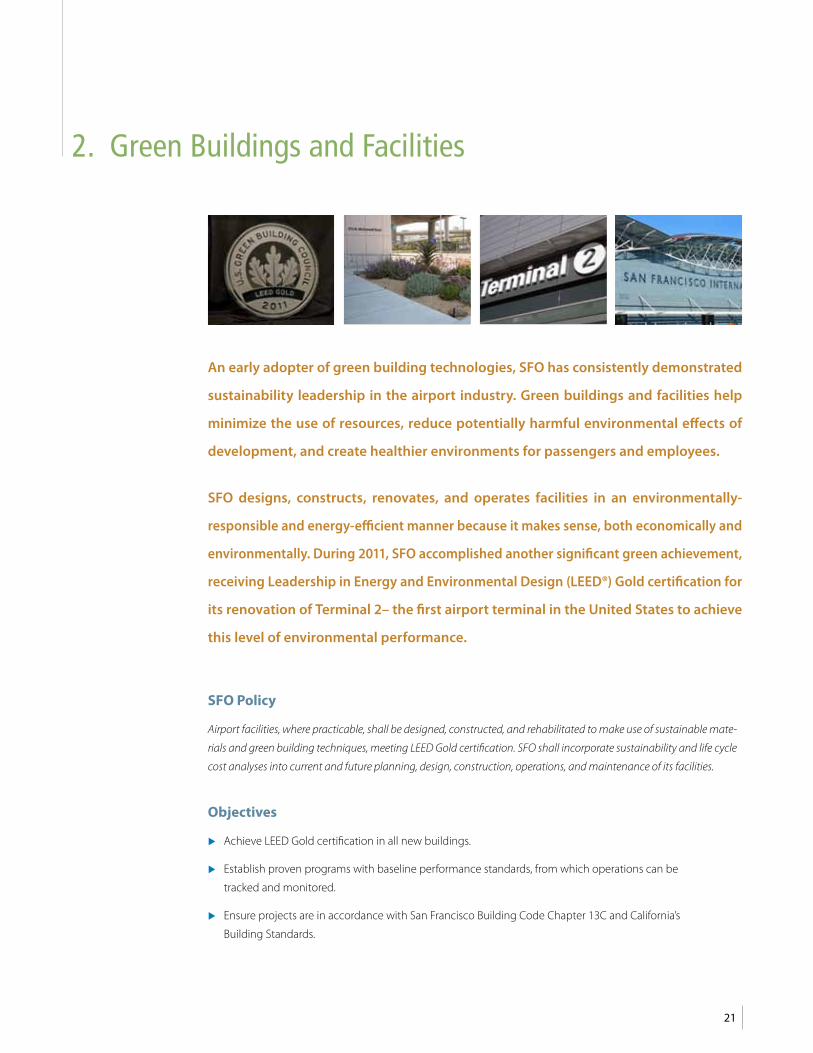
An early adopter of green building technologies, SFO has consistently demonstrated
sustainability leadership in the airport industry. Green buildings and facilities help
minimize the use of resources, reduce potentially harmful environmental effects of
development, and create healthier environments for passengers and employees.
SFO designs, constructs, renovates, and operates facilities in an environmentally-
responsible and energy-efficient manner because it makes sense, both economically and
environmentally. During 2011, SFO accomplished another significant green achievement,
receiving Leadership in Energy and Environmental Design (LEED®) Gold certification for
its renovation of Terminal 2– the first airport terminal in the United States to achieve
this level of environmental performance.
2. Green Buildings and Facilities
22
2 2. Green Buildings and Facilities
What Have We Accomplished?
The Airport has taken concrete steps to ensure
buildings are more resource-efficient, including
requiring that:
f All new buildings have low-flow restroom
fixtures and automatic-shutoff valves to
conserve water.
f Lighting improvements include replacing
existing fixtures with lamps that generate more
light (lumens) while consuming less energy and
containing little or no mercury.
f Specifications for all new and remodeled
buildings include strict requirements for recycling
construction waste and demolition debris.
Terminal 2 is an excellent example of SFO’s innova-
tive and effective use of green building techniques.
The redevelopment of Terminal 2, which stemmed
from an increase in passenger demand, has estab-
lished a new standard for terminal space that is
operated at optimal efficiency and creates a
pleasant environment for passengers.
Airport tenants, including leading concessions and
airlines, have joined SFO in its pursuit of green
building excellence, adopting simple energy and
resource-efficient design strategies whenever possible.
Terminal 2
Originally constructed in 1954 as the Airport’s
Central Terminal, Terminal 2 was renovated in 1983,
but was closed to passengers in 2000 after the
construction and opening of SFO’s International
Terminal. Airline operations then shifted to the new
International Terminal, but Terminal 2 continued to
be used for Airport administrative offices in addition
to housing FAA’s main control tower. In 2008, due to
an increase in passenger demand, the Airport
decided to reopen Terminal 2. SFO developed plans
to renovate the Terminal using sustainability prin-
ciples, materials, and techniques. The $383 million
project transformed Terminal 2 into a state-of-the-
art domestic terminal. In April 2011, Terminal 2
officially reopened to great acclaim from airlines,
concessionaires, and passengers. In late 2011, the
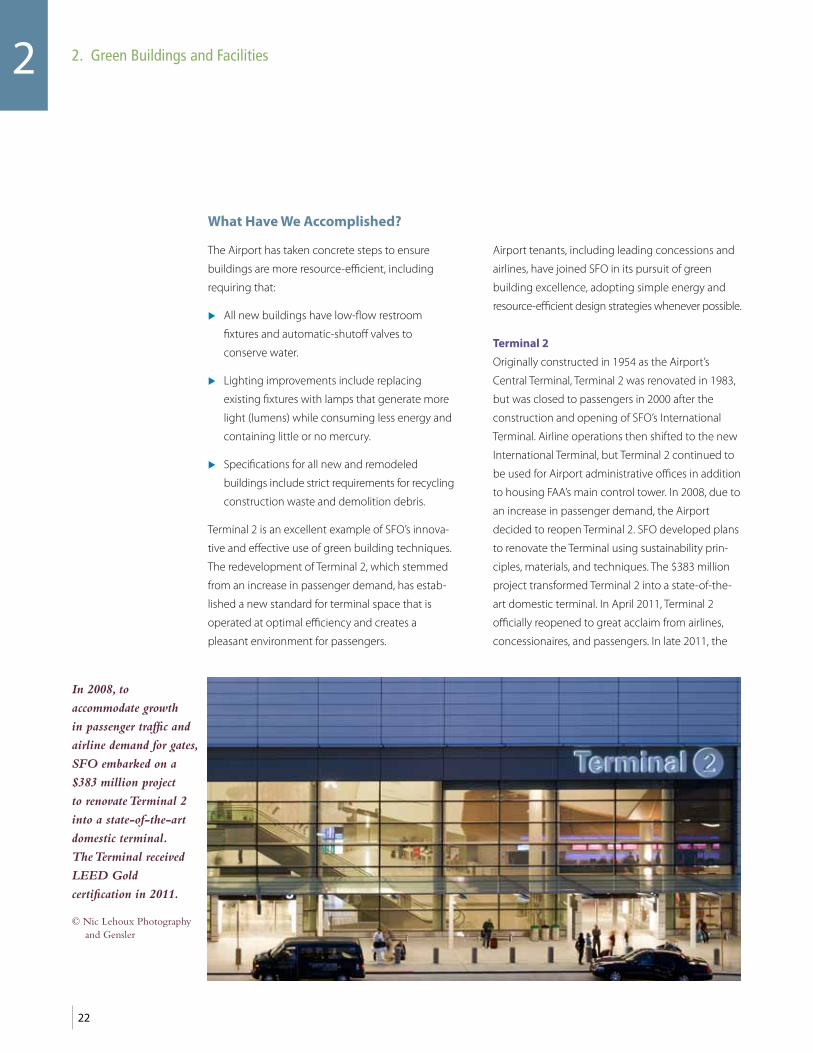
In 2008, to
accommodate growth
in passenger traffic and
airline demand for gates,
SFO embarked on a
$383 million project
to renovate Terminal 2
into a state-of-the-art
domestic terminal.
The Terminal received
LEED Gold
certification in 2011.
© Nic Lehoux Photography and Gensler

23
renovated Terminal 2 was awarded LEED Gold certi-
fication by the US Green Building Council (USGBC).
The sustainable design elements included in
Terminal 2 are anticipated to reduce greenhouse
gas emissions, improve indoor air quality, and
reduce energy consumption at the facility. The
facility features approximately 640,000 square feet
(sq ft) of terminal space that can accommodate
5.5 million passengers per year; and includes
14 gates, 30,793 sq ft of retail development, a
pedestrian bridge to AirTrain, and a number of
sustainability features described below.
Adopting LEED: the USGBC’s Green Building Rating System
SFO has adopted the U.S. Green Building Council’s (USGBC)
Leadership in Energy and Environmental Design (LEED) green
building rating system, which is a consensus-based international
standard for developing high performance, sustainable buildings.
Members of the USGBC from all segments of the building industry
helped develop the LEED rating system and continue to contribute
to its evolution.
LEED provides a practical framework to identify and implement
green building and sustainable design for construction, operations,
and maintenance of buildings. It offers a flexible system of rating
buildings based on the following categories:
f Sustainable Sites: Discourages use of previously undeveloped
land and encourages minimization of a building’s impacts, and
construction-related impact, on natural resources. Encourages
appropriate landscaping and transportation choices.
f Water Efficiency: Encourages smarter use of water through use
of more efficient indoor appliances and fixtures, and water-
conscious landscaping.
f Energy and Atmosphere: Encourages energy minimization
strategies such as energy use monitoring, efficient design,
efficient appliances and lighting, and the use of renewable
energy sources.
f Materials and Resources: Encourages the reduction of waste,
use of sustainably grown, harvested, produced, and transported
products and materials, and reuse and recycling.
f Indoor Environmental Quality: Encourages activities that
improve indoor air quality, the use of natural daylight, and
acoustics.
f Locations and Linkages: Encourages new construction be
built near already existing infrastructure, community resources,
and transit as well as locations that promote walking and use of
the outdoors.
f Awareness and Education: Encourages providing users of the
building, home, or facility with the education and awareness of
what makes the building sustainable, and how they contribute
by using its green features.
f Innovation in Design: Encourages innovative technologies and
strategies to improve a building’s performance or to account for
other green building techniques that are not addressed in other
performance areas.
The highest level of certification is Platinum, followed by Gold,
Silver, and Certified.
For more information, please see www.usgbc.org

24
2 2. Green Buildings and Facilities
Terminal 2’s Sustainability Features
Terminal 2’s sustainability features include:
f Greenhouse Gas Emissions Reduction Initiatives
f Waste Reduction
f Reclaimed Water Reuse Program
Greenhouse Gas Emissions Reduction Initiatives
Terminal 2’s design includes a number of measures to
reduce the carbon footprint of the terminal, such as:
f Preconditioned (PC) Air and 400 Hz Power
Supply Systems: SFO provides PC Air and 400
Hz power supply to aircraft at all Terminal 2
gates. These facilities are conservatively
estimated to reduce jet fuel consumption by
aircraft Auxiliary Power Units (APU) by 521,000
gallons per year and reduce GHG emissions by
approximately 5,100 metric tons per year.
f Energy Efficiency Measures: The incorporation
of energy efficient lighting and efficient
machinery are expected to reduce electrical
energy consumption by 2.9 gigawatt hours per
year, and natural gas consumption by 116,000
therms per year, resulting in a reduction of 750
metric tons of GHG emissions per year.
f Building Materials Savings: By reusing a
substantial portion of the infrastructure of the
existing building in the renovated Terminal 2,
SFO generated cost savings and reduced the
global warming impact of the renovated
terminal by a one-time reduction of
approximately 12,300 metric tons of GHG
emissions.
f Plug-in Electrical Chargers for Ground
Service Equipment (GSE): SFO installed
chargers for use by GSE equipment at all gates,
resulting in both fuel saving and a reduction in
GHG emissions.
f Preferential Parking for Electric and Hybrid
Vehicles: SFO allocates preferential parking
spaces and public charging stations in the
Domestic Parking garage for exclusive use by
hybrid and electrical vehicles.
Waste Reduction
SFO’s Zero Waste Program requires the reuse/recycling
of all waste generated during construction projects
to the extent feasible. Contractors recycled over 90%
of Terminal 2 construction and demolition debris.
SFO also requires ongoing source separation of all
recyclable solid waste to help meet its interim goal
of recycling 80% of the generated waste by 2015.
All Terminal 2 food vendors are required to use
biodegradable tableware and source separate all
food service wastes for direct transport to off-
Airport composting facilities.
SFO’s Terminal 2
features abundant
natural light, which
with the use of highly
efficient lighting and
machinery is expected
to reduce energy
consumption upwards
of 2.9 gigawatt hours,
compared to a building
designed to code. This
is enough energy
savings meet the needs
of approximately 431
California residences
for a year.1
© Nic Lehoux Photography and Gensler

25
All Terminal 2 food
vendors are required to
use biodegradable
tableware and source
separate all food service
wastes for direct
transport to off-Airport
composting facilities.
Passengers are
encouraged to deposit
their waste at recycling
and composting
receptacles located
throughout the terminal.
As part of its design,
Terminal 2 includes
sustainability education
components, achieved
through creative
graphics and signage.
In this educational
display, the passenger’s
attention is drawn to a
very large trash
compactor located
outside the window.
The accompanying
descriptions explain
how the airport waste
is managed.

26
2 2. Green Buildings and Facilities
Reclaimed Water Reuse Program
SFO has installed a dual water supply system at
Terminal 2, which will allow the use of reclaimed
water from the Airport’s Mel Leong Wastewater
Treatment Plant. The Airport is currently designing
the new pipeline to bring treated effluent from the
treatment plant for appropriate gray water use –
such as toilet flushing – at Terminal 2 and landscape
irrigation at other areas at SFO.
Terminal 2 Tenant and Concessionaire Facilities
Terminal 2 is occupied by two airlines, Virgin
America and American Airlines, as well as a number
of concessionaires.
Virgin America
Virgin America occupies seven gates at Terminal 2.
They have created an innovative space near their
gates, with waiting areas designed to be calming to
passengers. Virgin America ticket counters also use
“mood-lit” energy-efficient LED lighting at counters
and the airline takes advantage of the Terminal’s
abundant natural lighting, which significantly
reduces the overall electricity usage rate.
Virgin America supplemented Terminal 2’s overall
design with additional sustainable design elements,
such as using:
f Environmentally-friendly certified wood and
other green building materials
f Night/day motion sensors
f Energy efficient heating, cooling, and ventilation
in Virgin America staff spaces
f EnergyStar-rated computer and office equipment
f Low-VOC paints and coatings
Virgin America’s spaces have received LEED
Platinum certification for Commercial Interiors –
the highest level for LEED certification.
American Airlines
American Airlines is also committed to imple-
menting programs that reduce its environmental
impact. The airline’s operations are located in
Terminal 2, and provide the Terminal’s only airport
lounge, the SFO Admirals Club. This club also incor-
porates sustainable design features and has received
LEED Silver certification for Commercial Interiors.
Concessions Program
As with other tenants, SFO’s concessionaires are
encouraged to use green building materials for their
facilities and are required to segregate the recy-
clable and compostable portion of their solid waste.
For Terminal 2, the Airport encouraged its food and
beverage tenants to provide sustainable food to the
greatest extent possible. Food products considered
“sustainable” include:
Trees feature
prominently in the
design of the American
Airlines Admirals Club,
a symbol of the space’s
use of sustainable design
elements. The American
Airlines Airport Lounge
received LEED Silver
certification for
Commercial Interiors.

27
f Organic, local products
f Organic or natural meats
f Dairy products free of the rBST hormone
f Cage-free and antibiotic-free eggs
f Sustainable seafood
f Fair-Trade organic coffee
f Non-genetically modified agricultural products
f Products that do not include artificial colors,
flavors, or additives
f Non-hydrogenated oils
Other products provided and/or used include
biodegradable to-go containers and utensils;
compostable bio-resin or paper bottles for water;
and the use of low- or no-phosphate detergents for
dishwashing operations.
Building 575: The SFO Business Center
Building 575 has also been renovated using green
building techniques and now serves as the Airport’s
Business Center. Several administration offices from
Terminal 2 were relocated to this building, and the
Business Center now houses the Airport Commis-
sion employees working in Information Technology
and Telecommunications (ITT), Aviation Manage-
ment, Parking Management, Revenue Development
and Management, Finance and Accounting, and
staff of the Airport Liaison Office. The Business
Center received LEED Gold certification in 2011.
SFO’s Business Center design included the following
green building elements:
f Sustainable Materials
Over 90% of the wood used on the project was
Forest Stewardship Council (FSC)-certified as
responsibly managed and harvested. The
majority of the space was furnished with
furniture purchased locally from a salvage and
[LEFT]
The SFO Business
Center is the second
major Airport
renovation project
that has been awarded
LEED Gold
certification.
[RIGHT]
The SFO Business
Center features three
charging stations and
dedicated electric vehicle
parking spaces. The
electric chargers are
available for public use.

28
2 2. Green Buildings and Facilities
refurbishing company, which helps reduce
overall waste and supports local businesses.
During construction, 93% of construction waste
was diverted from landfills.
f Energy Efficiency
Efficient LED and fluorescent light fixtures and
other high efficiency equipment have contributed
to creating a sustainable space in the Business
Center. The project achieved a 20% reduction in
lighting power density (a reduction of nearly
10,000 watts), and uses automatic lighting controls
to minimize excess use of lighting in the offices.
The space also uses energy-efficient EnergyStar
approved appliances and submeters that aid in
monitoring the energy used by these appliances.
f Water Efficiency
Water use has been reduced by 153,675 gallons
per year (a reduction of more than 40% below
the building code requirement) due in part to
the use of water efficient fixtures such as
low-flow toilets and automatic shutoff faucets,
and xeriscape landscaping outside the building.
Xeriscape landscaping refers to
landscaping and gardening that is
designed to reduce or eliminate the need
for supplemental irrigation. Xeriscapes
are often achieved by using drought-
tolerant plants and/or plants that are
native to the area, and therefore are able
to thrive in the existing climate, without
additional watering.
f Occupant Wellbeing
Healthy interior spaces were emphasized with air
quality management plans during and after
construction. Renovations included the use of
construction materials such as paints, carpets,
adhesives, and furniture that emit minimal to no
volatile organic compounds (VOCs), which can be
harmful to human health. SFO also emphasized
occupant wellbeing by installing systems that
enable occupants to control lighting and
temperature in their individual office space.
Along with the building’s “green” features, other
amenities serve to encourage sustainable practices,
such as bike racks, a changing room, and shower
facilities for bicycle commuters, electric vehicle
charging stations, and specially designated parking
spaces for carpoolers.
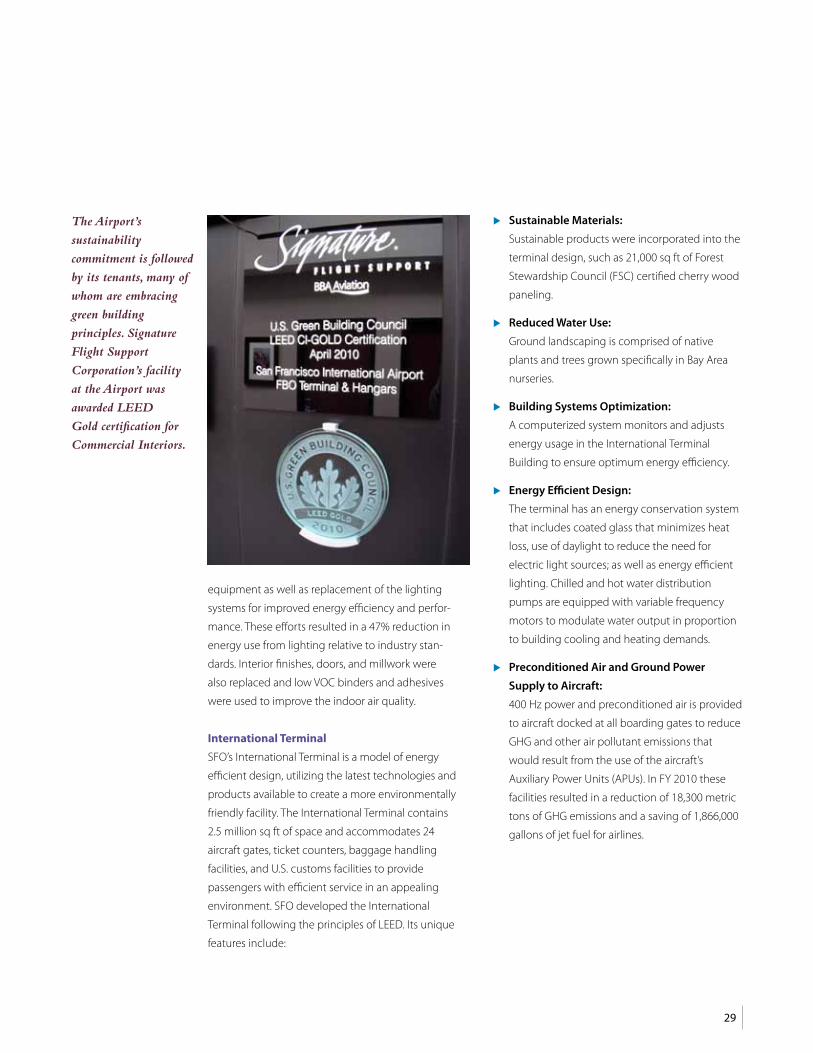
Signature Flight Support Fixed Base Operator
Terminal/Hangars
Signature Flight Support Corporation’s facility at the
Airport was awarded LEED Gold certification for
Commercial Interiors in 2010. Facility improvements
included an extensive renovation of the existing
9,800 sq ft executive terminal and the two existing
25,000 sq ft aircraft hangars. The renovation included
new heating, ventilation, and air conditioning
The aesthetically
engaging landscaping
surrounding the SFO
Business Center
contains plants that
do not require regular
watering. This
xeriscaped landscaping
has contributed to
a reduction in water
use by 153,675 gallons
per year.
29
equipment as well as replacement of the lighting
systems for improved energy efficiency and perfor-
mance. These efforts resulted in a 47% reduction in
energy use from lighting relative to industry stan-
dards. Interior finishes, doors, and millwork were
also replaced and low VOC binders and adhesives
were used to improve the indoor air quality.
International Terminal
SFO’s International Terminal is a model of energy
efficient design, utilizing the latest technologies and
products available to create a more environmentally
friendly facility. The International Terminal contains
2.5 million sq ft of space and accommodates 24
aircraft gates, ticket counters, baggage handling
facilities, and U.S. customs facilities to provide
passengers with efficient service in an appealing
environment. SFO developed the International
Terminal following the principles of LEED. Its unique
features include:
f Sustainable Materials:
Sustainable products were incorporated into the
terminal design, such as 21,000 sq ft of Forest
Stewardship Council (FSC) certified cherry wood
paneling.
f Reduced Water Use:
Ground landscaping is comprised of native
plants and trees grown specifically in Bay Area
nurseries.
f Building Systems Optimization:
A computerized system monitors and adjusts
energy usage in the International Terminal
Building to ensure optimum energy efficiency.
f Energy Efficient Design:
The terminal has an energy conservation system
that includes coated glass that minimizes heat
loss, use of daylight to reduce the need for
electric light sources; as well as energy efficient
lighting. Chilled and hot water distribution
pumps are equipped with variable frequency
motors to modulate water output in proportion
to building cooling and heating demands.
f Preconditioned Air and Ground Power
Supply to Aircraft:
400 Hz power and preconditioned air is provided
to aircraft docked at all boarding gates to reduce
GHG and other air pollutant emissions that
would result from the use of the aircraft’s
Auxiliary Power Units (APUs). In FY 2010 these
facilities resulted in a reduction of 18,300 metric
tons of GHG emissions and a saving of 1,866,000
gallons of jet fuel for airlines.
The Airport’s
sustainability
commitment is followed
by its tenants, many of
whom are embracing
green building
principles. Signature
Flight Support
Corporation’s facility
at the Airport was
awarded LEED
Gold certification for
Commercial Interiors.

30
2 2. Green Buildings and Facilities
Boarding Area E Planned Renovation
A major renovation and expansion project is
currently under design for Boarding Area E. This
project will pursue the same green building stan-
dards of excellence that were achieved for the
Terminal 2 renovation. The Airport envisions
creating a terminal space with unique and
acclaimed restaurants, local food and merchandise,
unexpected and re-purposed spaces, a focus on
sustainability and cutting edge technologies, and
design features that bring people together. These
concepts will serve as the basis for the project, while
achieving the following goals:
f Increase space at gate waiting areas
f Increase concession space
f Increase the space for amenities
f Increase natural daylight
f Enhance the customer experience
Greening Existing Buildings
SFO recognizes that greening new or renovated
buildings is only half the battle. Enhancing the effi-
ciency of the existing airport building stock is also
an important element to SFO’s green building
program with the objectives of reducing energy
consumption and greenhouse gas emissions.
In 2011, SFO undertook a study to evaluate the
feasibility of securing LEED certification under the
Existing Buildings Operations and Maintenance
standard (LEED EBOM) for the entire Terminal
Complex. LEED EBOM is different from LEED for New
Construction (LEED NC) in that it focuses on the
ongoing efficient operation of buildings; whereas
LEED NC is intended to ensure that facilities are
designed and built to a green standard. Pursuing
LEED EBOM certification would ensure the terminal
complex is operated and maintained in a way that
maximizes resource efficiency and minimizes the
environmental footprint of building operations.
Securing LEED EBOM certification for 9 million sq ft
of terminal and related space would make SFO the
first major airport to earn a high level of LEED EBOM
certification for an entire terminal complex.
1 Assumes an average electricity use of 6,721 kWh per California resident in 2010.
Source: The California Energy Commission, Energy Almanac. U.S. Per Capita Electricity Use by State in 2010. http://energyalmanac.ca.gov/electricity/us_per_capita_electricity-2010.html

31
International Terminal
Building at SFO displays
greenery and abundant light.
SFO’s International Terminal
was designed to minimize its
environmental footprint.
This project led the way to
SFO’s comprehensive green
building program, which
now includes a suite of
LEED-certified buildings.

Solar panels atop SFO’s
Terminal 3, generating
renewable electricity
for the Airport. These
panels were installed in
February 2008. SFO
has taken steps to reduce
its GHG emissions and
encourages others to do
the same by supporting
alternative energy
projects.

33
3. Climate Change
Policy
In 2008 the Board of Supervisors adopted, and the Mayor signed into law, Ordinance No. 81-08 Climate Change Goals
and Action Plan, which mandates GHG emissions reductions of 25% by 2017, 40% by 2025, and 80% by 2050, below
1990 emission levels. Each City Department, including the Airport, must meet these targets. The Airport shall continue
to reduce its carbon emissions in order to meet the City’s goal.
Objectives
f Achieve 100% mitigation of SFO-controlled GHG emissions by 2012
f Achieve 50% reduction from 2010 baseline GHG emissions from SFO-controlled operations by 2015
f Increase the solid waste recycling rate to 80% by 2015 to conserve resources and offset GHG emissions
f Increase the use of renewable sources of energy
f Consider the risks of changing climatic conditions in airport planning and operational decision-making
SFO strives to set environmental sustainability goals that are often more ambitious
than the mandated local, state, or federal requirements. The City and County of San
Francisco has set a goal of reducing GHG emissions to 25% below 1990 levels by 2017. SFO
is on the path to meet this goal and by FY 2010 had already reduced its GHG emissions
to 19% of 1990 levels. In addition, SFO has mitigated 99% of the GHG emissions from
SFO-controlled operations by reducing the GHG emissions from aircraft parked at the
boarding gates and from vehicles rented by passengers at SFO, among other measures.
This chapter describes current and planned activities to further reduce SFO-controlled
GHG emissions and provides details on projects to mitigate the Airport’s GHG emissions.
Lastly, this chapter describes the need for developing a climate change adaptation plan.

34
3 3. Climate Change
What Have We Accomplished?
Greenhouse Gas Reductions and Mitigation
Measures
The Airport Commission has demonstrated leader-
ship since 2008 in taking action to meet the require-
ments of City Ordinance No. 81-08, Climate Change
Goals and Action Plan, by implementing a compre-
hensive GHG emission reduction program that
resulted in a 19% decrease in GHG emissions in
FY 2010, compared to 1990 levels. In addition to
reducing the GHG emissions from SFO-controlled
operations, SFO has implemented a number of GHG
emission mitigation measures that yielded a total
mitigation of 41,816 metric tons, equivalent to 99%
of SFO’s GHG emissions, in FY 2010. Although SFO
did not attempt to formally certify these mitigation
measures as emission offsets, they nevertheless
reduced the GHG emissions at SFO and had a posi-
tive climate impact. SFO has also achieved GHG
emission offsets by sequestering carbon through
trees planted at the Airport and through recycling/
composting 74% of the solid waste generated at
the Airport.
The graph below shows the gross GHG emissions
from SFO-controlled operations, as well as the miti-
gation/offset levels for the 1990 baseline and 2008
through 2010.
Sources of SFO-Controlled GHG Emissions
Category 1 emissions are emissions generated by
SFO-controlled operations. Baseline GHG emissions
are defined in this report as the sum of direct and
indirect emissions from operating facilities under
the Airport’s control. In 2010, the Airport emitted a
total of 44,562 metric tons of GHG, generated from
the sources described below.
Direct Emissions (82%)
GHG emissions are generated on-site at SFO from
the operations listed below:
f Consumption of various fuels by vehicular traffic
on SFO-controlled roads, SFO fleet vehicles,
emergency generators, SFO Shuttle buses, etc.
(14,877 metric tons in 2010)
0
10,000
20,000
30,000
40,000
50,000
60,000
Annual GHG Emission O�set Level at SFO
Annual GHG Emission Mitigation Level at SFO
Gross SFO-controlled GHG Emissions
FY 2010FY 2009FY 20081990
Tonn
es/y
ear
Although the number of SFO passengers has increased by 30% since 1990, SFO was able to reduce the GHG emissions from Airport-controlled operations (“Category 1”) by 19% in FY 2010 compared to 1990 levels. In addition to the measures SFO has implemented to reduce/offset its direct GHG emissions, the Airport has invested in GHG emission mitigation projects to further minimize its impact on climate change.
GHG emission “mitigation” measures refer to investments SFO has made to reduce the overall GHG emissions released into the atmosphere by SFO enterprises and passengers.
Annual GHG Emissions and GHG Mitigation/Offset Levels at SFO

35
How do Airports Calculate Greenhouse Gas Emissions?
Currently, the United States has no national standard for preparing
an Airport Greenhouse Gas Emissions inventory. The Transportation
Research Board (TRB), a division of the National Academies,
published a guidebook1 under the Airports Cooperative Research
Program (ACRP) to provide consistent guidance on developing
airport GHG emissions inventories. SFO used the methodology
presented in this guidebook to prepare its GHG Inventory, which
includes complete details of Category 1 Emissions for SFO-
controlled operations as well as estimated values for Category 2
and Category 3 emission generated by airport enterprises and
operations related to SFO.
SFO has used the following airport-specific ownership and control
categories for evaluating its carbon footprint which is consistent
with ACRP guidelines:
Category 1 - SFO-controlled Emissions
GHG emissions from operations that are under the control of SFO,
including emissions from boilers, purchased electricity, SFO
employees’ commute and from all modes of travel on SFO-
controlled roads. This category includes all of Scopes 1 and 2,
and a portion of Scope 3 emissions.
Category 2 - Airlines, Concessionaires, and Airline
Support Services Emissions
GHG Emissions, within the physical boundaries of SFO; by airline
operations, including landing and take-off (LTO) cycles; ground
service equipment (GSE) and other support services; and by various
concessionaires and other tenants. This category includes mostly
Scope 2 emissions.
Category 3 - Optional Emissions
U.S. Environmental Protection Agency (EPA) defines optional emis-
sions as those emissions that are not directly emitted by, but are
connected with, the reporting enterprise’s operations. Examples
include GHG emissions from passenger travel to and from SFO,
outbound cruising aircraft, and delivery trucks. This category
includes Scope 3 emissions.
Other classifications are also used for quantifying the GHG emis-
sions in the context of international climate change initiatives such
as the Kyoto Treaty such as “Scopes 1, 2, and 3”, referred to above,
which differentiate emissions based on whether they are generated
directly or indirectly by the operating entity.
The graphs above show SFO’s category 1, 2, and 3 GHG emissions for 1990, and FY 2008 through FY 2010. Although the City and SFO’s GHG reduction goal applies to those emissions over which SFO exerts direct control (Category 1), SFO also tracks the emissions from all other Airport-related activities, such as airlines and enterprise operations and passenger travel to and from the Airport.
0
2,000,000
4,000,000
6,000,000
8,000,000
10,000,000
CATEGORY 3Optional Emissions
CATEGORY 2Airlines, Concessionaires, and Airline Support Services Emissions
CATEGORY 1SFO Controlled Emissions
FY 2010FY 2009FY 20081990
Tonn
es/y
ear
Tonn
es/y
ear
0
10,000
20,000
30,000
40,000
50,000
60,000
FY 2010FY 2009FY 20081990
Greenhouse Gas Emissions from all Airport-related Activities (Categories 1, 2, and 3)
For more information, please visit: ACRP Report 11: A Guidebook on Preparing Airport Greenhouse Gas Inventories (2009). http://onlinepubs.trb.org/onlinepubs/acrp/acrp_rpt_011.pdf
Note the significant difference in the scale between the two graphs.

36
3 3. Climate Change
f Consumption of natural gas, including natural
gas supplied to all tenants by SFO (17,714 metric
tons in 2010)
f Fugitive refrigerant gas releases (3,512 metric
tons in 2010) and
f Process emissions at SFO’s wastewater treatment
facilities (322 metric tons in 2010)
Indirect Emissions (18%)
GHG emissions generated off-site but associated
with the consumption of resources by SFO-
controlled-operations or by the activities connected
to such operations, are classified as indirect emis-
sions. The various categories of indirect emissions
for SFO-controlled operations are listed below:
f GHG emissions from various modes of commute
travel by SFO employees (2,553 metric tons in 2010)
f Electrical energy consumption, including
electrical energy supplied to all tenants by SFO
(4,764 metric tons in 2010)
f Solid waste disposal (820 metric tons in 2010)
Aircraft operations are clearly a substantial source of
GHG emissions at SFO, far outweighing the impact
of SFO-controlled operations. However, these oper-
ations are neither owned nor totally controlled by
SFO and are therefore not included as Category 1
GHG emissions.
The Airport has taken concrete steps to reduce the
GHG emissions associated with direct and indirect
sources listed above. These initiatives are described
in the following chapters:
Chapter 2: Green Buildings and Facilities
Chapter 4: Energy Conservation and
Renewable Energy
Chapter 5: Air Quality
Chapter 9: Solid Waste and Recycling
For example, the Airport has invested in on-site
renewable energy systems (Chapter 4), is converting
its vehicle fleet to low emission vehicles (Chapter 5),
is incorporating efficient building design principles
into new development (Chapter 2), and is
increasing its rate of recycling (Chapter 9).
SFO Fuel Consumption—Vehicle & Shuttle Fleet and Emergency Generators (FY 2010)
This chart shows the sources of direct and indirect GHG emissions from SFO-controlled operations (Category 1). The majority of Category 1 GHG emissions (73%) at SFO result from the combined natural gas consumption by SFO and SFO enterprises, plus fuel consumption by SFO-controlled operations.
40%
NATURAL GAS CONSUMPTION
33%
SFO FUEL CONSUMPTION (VEHICLE & SHUTTLE FLEET, & EMERGENCY
GENERATORS)
10%
ELECTRICAL ENERGY CONSUMPTION
8%
FUGITIVE REFRIGERANT GAS RELEASES
6%
SFO EMPLOYEE COMMUTING
1%
WASTEWATER TREATMENT FACILITIES
2%
SOLID WASTE DISPOSAL
DIRECT EMISSIONS
INDIRECT EMISSIONS

37
Greenhouse Gas Emission Offset Measures
SFO has implemented two GHG emission offset measures over the years, consisting of carbon sequestration by
landscaping trees and recycling/ composting of solid waste generated at the Airport.
Solid Waste Recycling/Composting
SFO recycled 38% of the regular solid waste gener-
ated at the Airport in FY 2010 and composted an
additional 36% of the waste for a total of 74%. These
recycling/ composting operations generated 2,205
metric tons of GHG emission offset in FY 2010.
Tree Plantings
SFO has planted 2,020 trees of different varieties
around the Airport in recent years. These trees are
estimated to sequester approximately 121 metric
tons of carbon dioxide per year.
SFO’s Climate Action Plan: Third Party VerifiedSan Francisco local law mandates that all city departments,
including the Airport, develop a Climate Action Plan (CAP) that
outlines the procedures for meeting the City and County of
San Francisco’s GHG emission reduction goals. SFO has been
preparing annual CAPs since 2008. In the interest of complete
transparency, in 2011, SFO chose to seek third party verification
of its plan. SFO enlisted ICF International, an internationally-
recognized climate change management firm, to validate SFO’s
GHG inventory and confirm the emissions reductions, offsets and
mitigations reported in the CAP. This work is currently ongoing.
Taking initiative in seeking third-party verification of its CAP
underscores the Airport’s dedication to realizing true reductions
and mitigations in GHG emissions.
To view SFO’s Climate Action Plan please visit: www.flysfo.com/downloads/SFOClimateActionPlan2010.pdf

38
3 3. Climate Change
Greenhouse Gas Emission Mitigation Measures
SFO has also successfully implemented a number of measures to mitigate GHG emissions indirectly associated
with its operations. These measures, totaling 41,816 metric tons in FY 2010, are described below:
Preconditioned Air and 400 Hz Power
Installation of preconditioned air supply (PC Air) and
400 Hz power supply equipment at the International
Terminals A and G, Terminal 2, and the majority of
domestic boarding areas has reduced the need for the
use of aircraft Auxiliary Power units (APUs) by the air
carriers for providing electric power and conditioned
air to the aircraft during the deplaning and enplaning
of passengers. In FY 2010, the PC Air and 400 Hz
Power system operated by the Airport mitigated the
aircraft GHG emissions by 21,889 metric tons.
Construction and Demolition (C&D)
Solid Waste Recycling
The GHG emission mitigation associated with the
C&D recycling operations at SFO are estimated at
462 metric tons in FY 2008, 13,095 metric tons in
FY 2009, and 4,545 metric tons in FY 2010. The
magnitude of GHG emission mitigation associated
with C&D recycling varies based on the quantity of
construction and demolition waste generated in
each year. Due to this variability SFO treats the impact
of these recycling operations as GHG emission miti-
gation rather than GHG emission offset. In contrast,
SFO treats the recycling/composting of regular solid
waste as an offset measure due to permanence and
steady state condition of these operations.
Green Car Rental Incentive Program (GCRIP)
In 2009, SFO initiated the Green Car Rental Incentive
Program (GCRIP), a program that provides financial
incentives to the Airport rental car companies to
increase the number of fuel efficient cars with an
EPA rating of 17 or higher to 15% of their rental vehicle
inventory. As a part of the GCRIP, SFO also initiated a
three-year program to reward the passengers
renting a “green” vehicle by providing a $15 discount
on each rental transaction. In FY 2010, the net GHG
emissions mitigated by the GCRIP was estimated at
11,442 metric tons.
BART
SFO provided partial
funding for the Bay
Area Rapid Transit
(BART) extension to
SFO which in FY 2010
resulted in a reduction
of about 69 million
miles of commute travel by airline passengers based
on monthly passenger data provided by BART. SFO
shares approximately 9.1% of this mitigation based
on the Airport’s capital contribution to the BART
extension. In FY 2010, it is estimated that the BART
extension mitigated SFO’s GHG emissions by 2,076
metric tons.
AirTrain
In 2003, SFO
completed the
construction of
AirTrain, which has
eliminated the need
for the use of shuttle
buses by all on-Airport rental car agencies. In FY 2010,
the AirTrain system mitigated SFO’s GHG emissions
by 1,864 metric tons.
Achieving SFO’s GHG Emission Reduction Goal
SFO considers GHG emission reduction a key tenet
of its mission “to provide an exceptional airport in
service to our communities.” SFO will continue to
implement its GHG emission reduction and mitiga-
tions programs in order to minimize the Airport’s
impact on the environment. Ongoing and planned
GHG emission reduction and mitigation measures
that will bring SFO closer to meeting its sustain-
ability goals include:

Greenhouse Gas Emission Mitigation Measures (FY 2010)
39
Proposed GHG Emission Reduction Measures
F Additional electric energy efficiency improve-
ments identified in SFO’s Energy Audit. These
measures could further reduce SFO-controlled
(Category 1) GHG emissions by up to 473
metric tons per year. Also, projected reductions
in natural gas consumption could reduce the
GHG emissions by 5,219 metric tons per year.
F Planned fleet vehicle replacements, including
234 of the existing aged vehicles over a six
year period, mostly with CNG powered vehicles,
where available. This program is expected to
reduce the Category 1 GHG emissions by
354 metric tons per year upon completion.
F Lighting fixture replacement for tenant occupied
buildings. SFO is planning to replace all
outdated lighting fixtures in tenant occupied
buildings in the next two years. Because
electric energy consumption by tenants is
included in the SFO baseline GHG emissions,
the reduction in energy consumption from
the new fixtures would aid in reducing the
carbon footprint of SFO-controlled operations.
Proposed GHG Emission Offset Measures
F Increasing the solid waste recycling rate to
80% by 2015 from the 2008-2009 recycling
rate of 62%. This measure is expected to
yield an additional GHG emission offset of
about 2,000 metric tons per year.
Proposed GHG Emission Mitigation Measures
F Full year operation of installed PC Air units
at Boarding Areas C and F in FY 2011. These
systems are expected to yield a combined
additional GHG emission mitigation of 5,728
metric tons per year.
F Activation of PC Air and 400 Hz power
supply systems at renovated gates in
Terminal 2. These systems are expected to
yield an additional GHG emission mitigation
of 5,731 metric tons per year.
F Full year operation of PC Air units at Board-
ing Area E in FY 2014. These systems are
expected to yield a GHG emission mitigation
of 4,394 metric tons per year.
This chart shows the magnitude of each GHG emission mitigation measure. Supplying PC Air and 400 Hz power to aircraft at the gates constitutes the largest GHG emission mitigation measure at SFO.
41,816 metric tons
21,889 PC AIR AND 400 HZ POWER SUPPLY AT INTERNATIONAL &
DOMESTIC TERMINALS
11,442
GREEN CAR RENTAL INCENTIVE
PROGRAM
4,545 CONSTRUCTION
AND DEMOLITION WASTE RECYCLING
2,076 BART EXTENSION
TO SFO (SFO’S SHARE)
1,864
AIRTRAIN FACILITY
Note: A number of these
measures associated with
the Terminal 2 Renovation
Project, PC Air installation
at Boarding Areas C and F
have already been imple-
mented and are opera-
tional. Other measures such
as PC Air units in Boarding
Area E will become opera-
tional at the completion of
ongoing renovations in this
terminal.

40
3 3. Climate Change
Estimates of the GHG emission reduction levels to
be achieved to meet the mandates of Ordinance
No. 81-08 were developed by comparing projected
GHG emissions with the mandated target emission
levels for 2017 and 2025. The results of these calcu-
lations indicate that, assuming an increase in base-
line emissions by 17.5% in 2017 and 38.1% by 2025,
SFO would need to reduce its emissions by an addi-
tional 2,801 metric tons by 2017 and 19,827 metric
tons by 2025 to comply with the requirements of
Ordinance No. 81-08. The Airport plans to achieve
these GHG reductions by continually seeking
greater opportunities for efficiencies and utilizing
the most up-to-date technologies and strategies.
Climate Change Adaptation
To date, the majority of efforts to address climate
change have been focused on climate change “miti-
gation”, or implementing GHG emission reduction
and offset measures. However, due to the long term
impact of greenhouse gases on the climate, it is
considered advisable to evaluate the impact of
potential changes in the climate and develop
Climate Change Adaptation Plans to ensure
continued operation of the facilities and services.
Both the state of California and the Bay Area local
governments have initiated efforts to prepare climate
change adaptation plans. At the state level, Executive
Order S-13-08 outlines the following actions:
f Calls for additional research on future magnitude
of sea level rise in California;
f Requires all state agencies that are planning
construction in coastal areas to consider the
project’s vulnerability to sea level rise and reduce
expected risks; and
f Requires the development of a state Climate
Adaptation strategy, which assesses California’s
vulnerability and outlines solutions that can be
implemented within and across state agencies
to promote resiliency.
In the San Francisco Bay Area, the Bay Conservation
and Development Commission (BCDC) has devel-
oped a report that analyzes the vulnerabilities to
climate change in the Bay and recommends policies
that would alter design and siting requirements for
some projects requiring permits from BCDC2. The
BCDC 2008 vulnerability assessment, Living With A
Rising Bay: Vulnerability And Adaptation In San Fran-
cisco Bay And On the Shoreline (http://www.bcdc.
ca.gov/BPA/LivingWithRisingBay.pdf), is based
on research findings by the United States Geological
Survey (USGS) on expected inundation due to sea
level rise in the Bay Area and on an analysis of the
socioeconomic impacts of the potential inundation
by the Pacific Institute. The results of these efforts
show that:
f Approximately 180,000 acres of shoreline lands
are vulnerable to flooding following a 16-inch
rise in sea level, and more than 213,000 acres
following a 55-inch rise in sea level, potentially
flooding over a quarter-million of the Bay’s
residents.
f The replacement value of the resources at risk
would be about $62 billion.
SFO has installed a sea wall along most of the adja-
cent shoreline with an elevation of 3 feet above the
high tidal water level in the Bay. SFO is also planning
to extend this wall to cover the remaining shore line
at the Airport. A focused assessment of Climate
Change impacts at the Airport will also be carried
out in the ongoing Sustainability Planning process.
1 ACRP Report 11: A Guidebook on Preparing Airport Green-house Gas Inventories (2009). http://onlinepubs.trb.org/onlinepubs/acrp/acrp_rpt_011.pdf
2 See BCDC’s Proposed Climate Change Bay Plan Amendment website http://www.bcdc.ca.gov/proposed_bay_plan/bp_amend_1-08.shtml for additional information

41
Due to the Airport’s
proximity to the
Bay, SFO recognizes
its vulnerability to
inundation due to
future rise in sea
level. As part of its
ongoing Sustainability
Planning process, SFO
will conduct a focused
assessment of potential
climate change impacts
at the Airport.
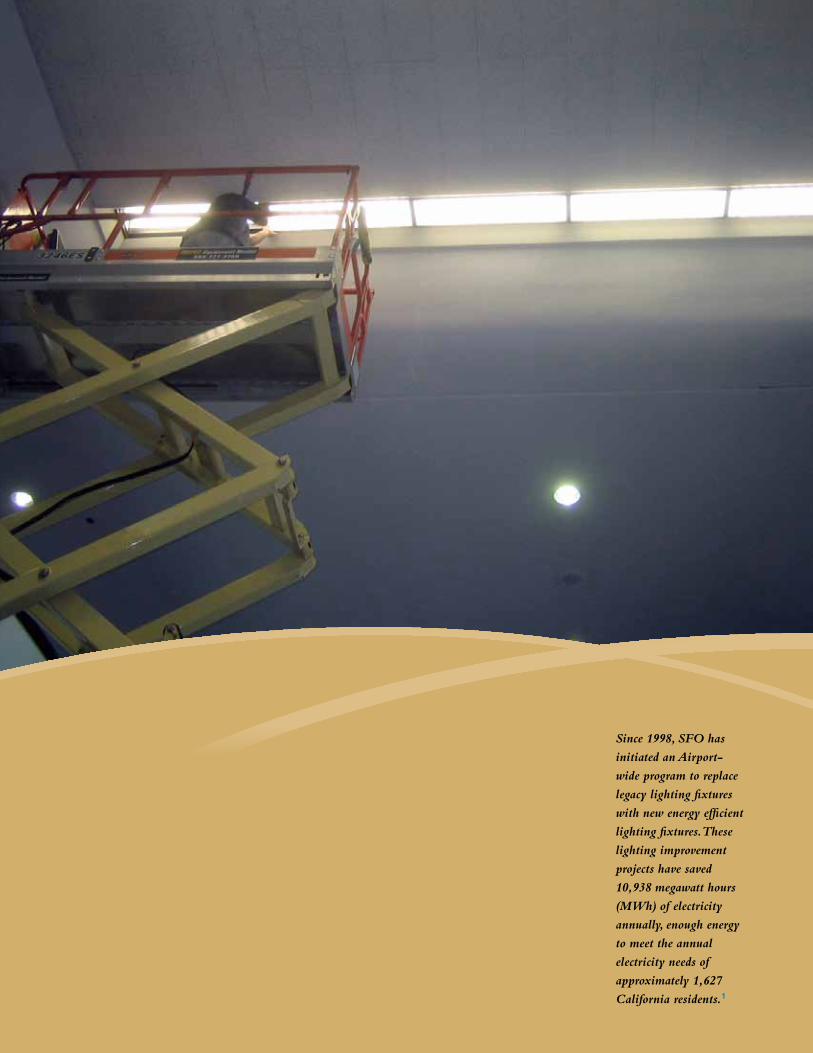
Since 1998, SFO has
initiated an Airport-
wide program to replace
legacy lighting fixtures
with new energy efficient
lighting fixtures. These
lighting improvement
projects have saved
10,938 megawatt hours
(MWh) of electricity
annually, enough energy
to meet the annual
electricity needs of
approximately 1,627
California residents.1

43
4. Energy Conservation and Renewable Energy
SFO Policy
SFO shall reduce energy use to the maximum extent practicable and seek to utilize clean and renewable
energy sources.
Objectives
f Reduce overall power use by maximizing energy efficiency.
f Enhance the use of energy supplies based on renewable, environmentally sound resources to the
maximum extent practicable.
f Minimize GHG and ozone-depleting emissions associated with energy use at the Airport.
Energy conservation and the use of renewable energy yield numerous economic and
environmental benefits including reducing greenhouse gas (GHG) generation, improving
air quality, as well as reducing energy costs. SFO maximizes these benefits by using
hydroelectricity supplied from the City’s Hetch Hetchy facilities, continually seeking
ways to enhance the energy efficiency of airport facilities, providing infrastructure
for a diverse mix of clean fuels at the Airport, and using alternative sources of power
for facilities and equipment, as described in this chapter.

44
4 4. Energy Conservation and Renewable Energy
SFO and Tenant Electricity Consumption
SFO and Tenant Natural Gas Consumption
SFO continues to implement measures to maximize its energy efficiency and encourages tenants to do the same. In FY 2010, overall airport electricity consumption decreased 2.8%, from 332,078 MWh in FY 2009 to 322,927 MWh in FY 2010.
Combined SFO and tenant natural gas consumption increased, however by 5.9% since FY 2009. This increase in natural gas consumption in FY 2010 was likely due to an increased demand for chilled water.
MW
h
315,000
320,000
325,000
330,000
335,000
340,000
FY 2010FY 2009FY 2008
Ther
ms
2,000,000
2,400,000
2,800,000
3,200,000
3,600,000
4,000,000
FY 2010FY 2009FY 2008
For context, 322,927 megawatt hours, the electricity used by SFO and its tenants in FY 2010, is enough to meet the annual electricity needs of over 48,000 California residents.2
includes tenant use
includes tenant use

45
What Have We Accomplished?
Energy Use
Electricity and Natural Gas Consumption
SFO uses electric energy for lighting and for
powering equipment (such as people movers); and
heating, ventilation, and air conditioning (HVAC)
equipment at the terminals, boarding areas, and
other SFO facilities.
Combined SFO and tenant electric energy
consumption decreased from 332,078 megawatt
hours (MWh) in FY 2009 to 322,927 MWh in FY 2010,
showing a 2.8% decrease in overall airport electricity
consumption.
SFO-specific electric energy consumption increased,
however, from 165,846 MWh in FY 2009 to 173,100
MWh in FY 2010, showing a 4.4% increase. The
increase in SFO electric energy consumption was
likely due to demand from final phases of the Terminal
2 renovation and activation of the Terminal in the
last four months of FY 2010. A 5.4% increase in
passenger traffic and a 1.1% increase in flight opera-
tions at SFO could also have impacted this energy
use. Despite the recent increases, SFO’s energy effi-
ciency improvement program has resulted in a 6.3%
overall reduction in electricity use since FY 2004.
Combined SFO and tenant natural gas consumption
increased from 3,143,872 therms in FY 2009 to
3,330,555 therms in FY 2010 indicating a 5.9%
increase, but remaining below FY 2008 consumption.
This increase was likely due to an increased demand
for chilled water.
Vehicle Fleet Fuel Consumption
In addition to electricity and natural gas used to
power its facilities, SFO uses a mix of fuels to power
its vehicle fleet, including gasoline, diesel, biodiesel,
electricity, and compressed natural gas (CNG).
Fuel Usage of SFO General and Shuttle Fleets
General Fleet Shuttle Fleet
GASOLINE gallons
GASOLINE gallons
50% 0%27% 60%23% 40%
CNG gasoline gallons
equivalent
CNG gasoline gallons
equivalent
BIODIESEL gallons
BIODIESEL gallons
SFO seeks to power its general fleet and shuttle fleet using a diverse mix of fuels. In FY 2010, 50% of SFO’s general fleet usage was from gasoline, 23% from biodiesel, and 27% from CNG. SFO’s shuttle fleet used 40% biodiesel and 60% CNG.

46
4 4. Energy Conservation and Renewable Energy
Energy Efficiency Program
Initiated in 2007, SFO’s program of implemented,
ongoing, and planned electric energy efficiency
projects have collectively resulted in a significant
amount of electricity savings per year. With over
49 electric energy efficiency projects implemented
to date, the Airport has reduced its electricity
consumption by 6.3% since FY 2004, based on FY
2010 consumption. While the implementation of
programs and purchase of equipment requires an
initial investment, the expenditures are typically
recovered through energy cost savings. The
elements of SFO’s energy efficiency program are
described below.
Energy Audit
Conducting an energy audit is essential to under-
stand the energy flows throughout the Airport’s
facilities and to identify opportunities for increased
efficiencies.
In February 2007, SFO completed a preliminary
Energy Audit in cooperation with the San Francisco
Public Utilities Commission (SFPUC). The effort was
part of SFPUC’s Clean Energy Clean Air Program to
reduce operating costs and improve energy effi-
ciency at the Airport. The preliminary audit identi-
fied a number of energy and lighting efficiency
opportunities, which SFO continues to implement.
As a next step, SFO completed an investment grade
audit of the mechanical and Heating Ventilating and
Air Conditioning (HVAC) systems in the main
terminal complex. This investment-grade audit
expanded upon the preliminary energy audit,
detailing technical and economical issues necessary
to justify the investment for implementing energy
efficiency measures. The resulting report included
recommendations that could reduce SFO’s energy
costs by $6.1 million per year, with a capital invest-
ment of $36.8 million, a simple payback of just six
Retro-commissioning: The key to maximizing building performanceRetro-commissioning is a process that seeks to improve how
building equipment and systems function together. It can often
resolve problems that occurred during the design or construction
of the building, or address problems that have developed
throughout the building’s life. In all, retro-commissioning improves
a building’s operations and maintenance (O&M) procedures to
enhance overall building performance.
Benefits of retro-commissioning include:2
f Reduced maintenance costs
f Improved system operation
f Improved equipment performance
f Increased O&M Staff capabilities and expertise
f Increased asset value
f Energy savings, valued at $0.11 - $0.72/sq ft
f Improved occupant comfort
f Improved indoor environmental quality
Retro-commissioning is also an element of LEED EBOM certification.
For more information on Retro-commissioning, visit the California Department of General Services. Retro-commissioning Fact Sheet www.documents.dgs.ca.gov/green/eeproj/ retrocommfactsheet.doc

47
years. Investment would primarily include
upgrading outdated equipment, but would result in
reduced operation and maintenance costs as well
as a reduced electrical demand for the Airport’s
heating and cooling systems.
The investment grade audit recommended the
following improvements:
f Optimization of control systems
f Conversion of air handlers to more efficient
variable air volume (VAV) units
f Boiler replacements in the central plant
f Component upgrades to the cooling tower fans.
f Optimization of the chilled water and heating
hot water distribution systems and conversion to
variable flow systems.
f Installation of a thermal energy storage system
at the central plant that can generate and store
chilled water at night
f Reset of zone temperature set-points.
f Retro-commissioning
In addition to energy savings, the recommended
improvements were projected to reduce approxi-
mately 15,368 metric tons of GHG emissions
per year.
SFO continues to evaluate the recommendations
from these energy audits and has implemented a
number of these recommendations to date.
Lighting Efficiency Improvements
SFO’s Facilities Division has implemented over 60
projects since 1998 to replace legacy lighting
fixtures across the airport with new energy efficient
lighting fixtures, such as LED roadway lighting and
more efficient terminal lighting, affording the
passengers an improved environment as well as
reducing energy consumption. These lighting
improvement projects have saved 10,938 MWh of
electricity per year, enough energy to meet the
annual electricity needs of approximately 1,627
California residents each year.1
SFO is planning to retrofit all remaining legacy light
fixtures throughout the Airport over the next two
years, which will yield significant additional energy
savings and GHG emission reductions.
SFO operations and maintenance staff replace
lighting fixtures in Terminal 3 with new energy
efficient fixtures. These lighting improvement
projects have resulted in annual electricity savings
of 10,983 MWh.

48
4 4. Energy Conservation and Renewable Energy
Hot Water Boiler Improvements
In the last two years, the Airport has replaced all
four of its hot water boilers in the Central Plant with
the latest and most efficient boiler models. The new
boilers meet the revised and more stringent Bay
Area Air Quality Management District’s emission
requirements. The new boilers should also aid in
reducing the growth of natural gas consumption
at the Airport.
HVAC Improvements
In 2009, SFO installed a new heat exchanger for
supplying chilled water to terminals during cold
temperature days. The heat exchanger has allowed
SFO to provide chilled water to the terminals in the
winter without the use of chillers, achieving
substantial savings on energy costs.
A cost-benefit analysis for the heat exchanger,
conducted by Stanford University, estimated that
the system has saved the Airport 649,247 kWh and
$90,895 in electricity costs each year.
Information Technology Energy Saving Measures
For the past five years, SFO’s Information Technology
Transfer (ITT) department has embarked on an
aggressive carbon footprint reduction program to
reduce energy consumption by computers, printers,
and monitors. The energy efficiency measures
implemented in this program include:
f Printer Consolidation for reduced energy use
SFO has implemented a printer consolidation
program to reduce the total number of printers
used airport-wide. The objective was to utilize
one printer for every 8 staff personnel, thereby
reducing electrical usage.
f Paper Reduction through Duplex Printing
Two-sided printing settings have been
programmed for all printers. This action has
reduced SFO’s paper consumption by 50%
to date.
f Energy Star computers and laptops
Since 2005, SFO has been gradually replacing
older, outdated computers used by staff with
Energy Star compliant laptops, computers, and
monitors. These computers are more energy
efficient and reduce SFO’s electrical usage.
f Automated Shutdown of inactive computers
at night
In order to further reduce unnecessary energy
usage, the Airport automatically shuts down
inactive computers each night. This simple
measure has reduced energy consumption by
1.2 million kWh annually, compared to energy
consumption prior to 2005.
f Server replacement for reduced energy use
The Airport has implemented a replacement
program to retire older, stand-alone servers.
These servers have been replaced with rack-
mounted, “blade” servers that are more energy
efficient.
SFO’s new heat
exchanger reduces
electric energy
consumption by
providing chilled
water to terminals in
the winter without
the need for using the
chillers. A Stanford
University analysis
estimated that this
system has saved
the Airport 649,247
kWh and $90,895 in
electricity costs per year.
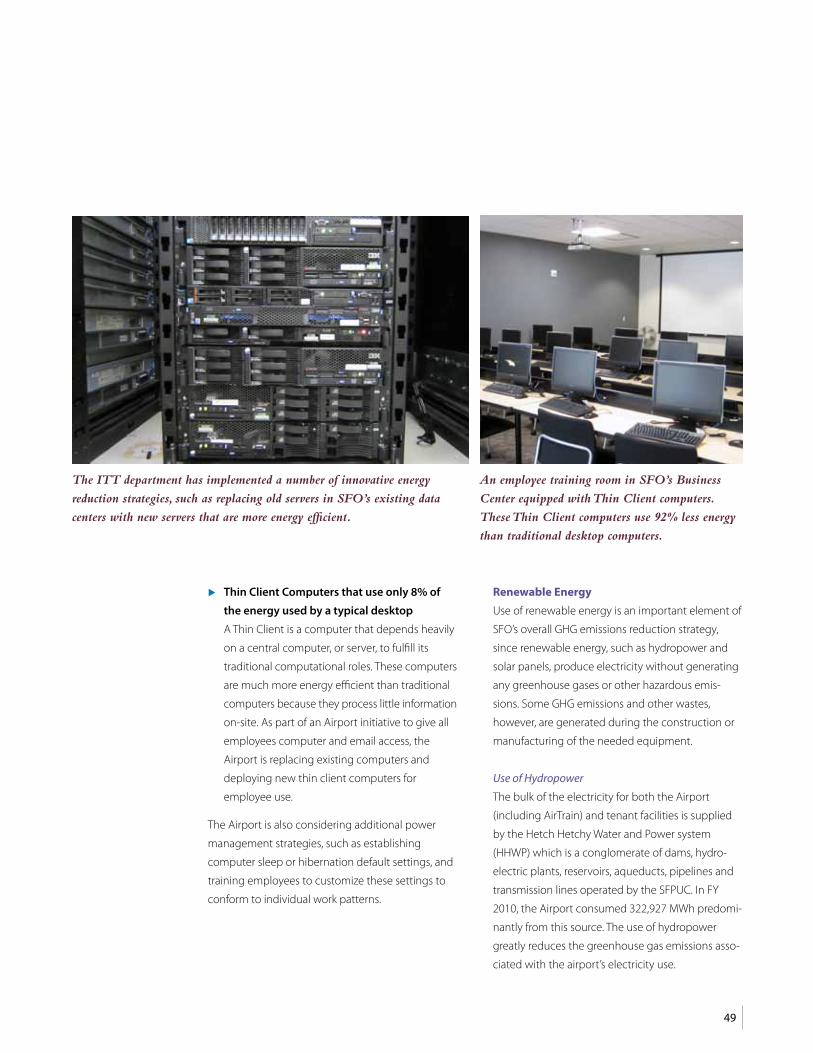
49
f Thin Client Computers that use only 8% of
the energy used by a typical desktop
A Thin Client is a computer that depends heavily
on a central computer, or server, to fulfill its
traditional computational roles. These computers
are much more energy efficient than traditional
computers because they process little information
on-site. As part of an Airport initiative to give all
employees computer and email access, the
Airport is replacing existing computers and
deploying new thin client computers for
employee use.
The Airport is also considering additional power
management strategies, such as establishing
computer sleep or hibernation default settings, and
training employees to customize these settings to
conform to individual work patterns.
Renewable Energy
Use of renewable energy is an important element of
SFO’s overall GHG emissions reduction strategy,
since renewable energy, such as hydropower and
solar panels, produce electricity without generating
any greenhouse gases or other hazardous emis-
sions. Some GHG emissions and other wastes,
however, are generated during the construction or
manufacturing of the needed equipment.
Use of Hydropower
The bulk of the electricity for both the Airport
(including AirTrain) and tenant facilities is supplied
by the Hetch Hetchy Water and Power system
(HHWP) which is a conglomerate of dams, hydro-
electric plants, reservoirs, aqueducts, pipelines and
transmission lines operated by the SFPUC. In FY
2010, the Airport consumed 322,927 MWh predomi-
nantly from this source. The use of hydropower
greatly reduces the greenhouse gas emissions asso-
ciated with the airport’s electricity use.
The ITT department has implemented a number of innovative energy
reduction strategies, such as replacing old servers in SFO’s existing data
centers with new servers that are more energy efficient.
An employee training room in SFO’s Business
Center equipped with Thin Client computers.
These Thin Client computers use 92% less energy
than traditional desktop computers.

50
4 4. Energy Conservation and Renewable Energy
SFO’s First-of-its-Kind “Green” Data Center: A model for innovation and efficiencyBackground
As part of the City’s Data Center Consolidation Plan, SFO is plan-
ning a new data center building at the Airport. This new SFO
Data Center will be a “Class A - COLO”, a type of mission critical
data center that services multiple agencies.
Sustainable Design
Data centers increasingly have been high energy users to match
the ever growing demand for high capacity network servers.
SFO’s new data center, however, will be designed using the most
up-to date standards to maximize energy efficiency.
The 2011 Thermal Guidelines, developed by the American
Society of Heating, Refrigerating and Air-Conditioning Engineers
(ASHRAE), has established new indoor environmental design
criteria. The guidelines allow for a much wider indoor tempera-
ture and humidity design range, whereas for the last 40 years,
the indoor design conditions required stringent temperature
controls, resulting in heavy reliance on computer room air
conditioning units and chiller plants.
SFO is now proposing a data center design that will utilize the
cool ambient air of the San Francisco Bay Area as the primary
source for conditioning the air in the facility, thereby avoiding the
use of energy-intensive traditional cooling units.
To maximize the outside air cooling concept, the architect has
incorporated two key architectural elements into the new
building. These keys include “half dome” hot aisles located at the
roof level and floor to ceiling louvered walls. These building
features were specifically designed to discharge heated air at the
roof level using high efficiency exhaust fans, and introduce cool
outside air at the floor level into the data center.
Based on this high volume, high air-exchange rate design, it is
anticipated that even during warm outside air conditions (75°F-
85°F), the data center will be within the range of acceptable
temperature and humidity. However, for the few hours each year
when outside air is above 90°F, the mechanical system will utilize
indirect evaporative cooling units to cool the data center.
Exterior views of
Data Center
Close-up view of the “half dome” roof aisles
Interior cross-sectional
view of data center,
including the “half
dome” roof aisles and
high efficiency ceiling
exhaust fans
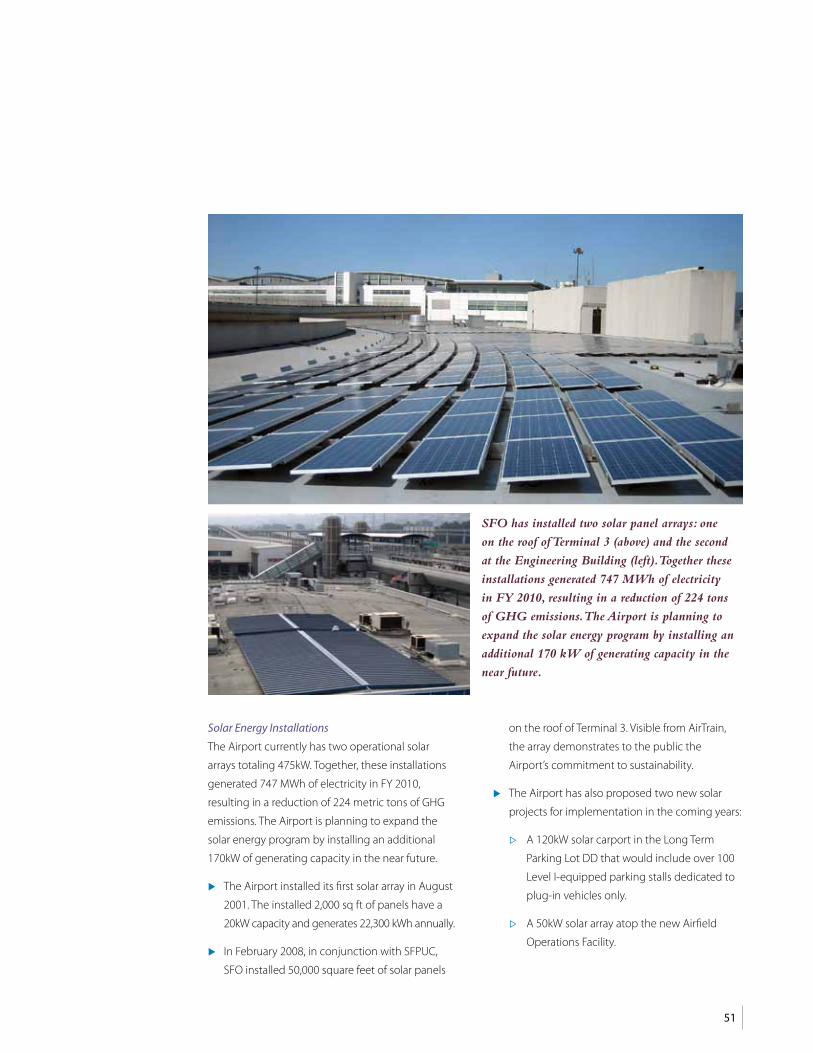
51
Solar Energy Installations
The Airport currently has two operational solar
arrays totaling 475kW. Together, these installations
generated 747 MWh of electricity in FY 2010,
resulting in a reduction of 224 metric tons of GHG
emissions. The Airport is planning to expand the
solar energy program by installing an additional
170kW of generating capacity in the near future.
f The Airport installed its first solar array in August
2001. The installed 2,000 sq ft of panels have a
20kW capacity and generates 22,300 kWh annually.
f In February 2008, in conjunction with SFPUC,
SFO installed 50,000 square feet of solar panels
on the roof of Terminal 3. Visible from AirTrain,
the array demonstrates to the public the
Airport’s commitment to sustainability.
f The Airport has also proposed two new solar
projects for implementation in the coming years:
F A 120kW solar carport in the Long Term
Parking Lot DD that would include over 100
Level I-equipped parking stalls dedicated to
plug-in vehicles only.
F A 50kW solar array atop the new Airfield
Operations Facility.
SFO has installed two solar panel arrays: one
on the roof of Terminal 3 (above) and the second
at the Engineering Building (left).Together these
installations generated 747 MWh of electricity
in FY 2010, resulting in a reduction of 224 tons
of GHG emissions. The Airport is planning to
expand the solar energy program by installing an
additional 170 kW of generating capacity in the
near future.
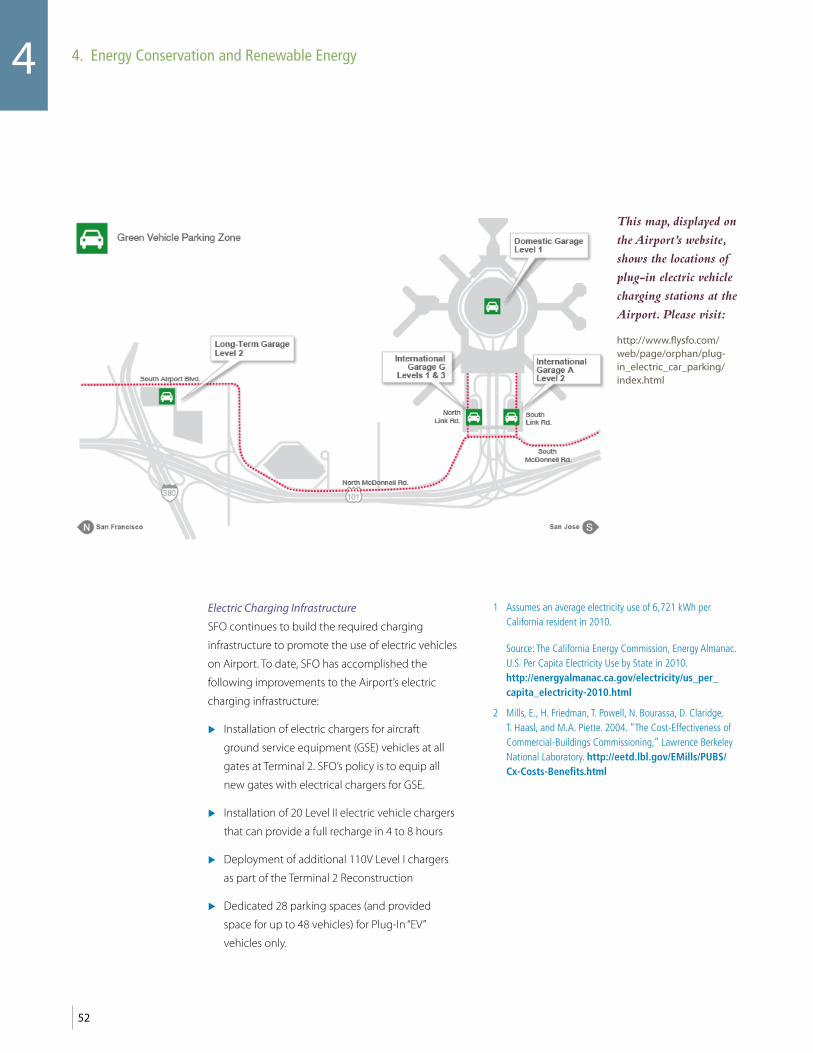
52
4 4. Energy Conservation and Renewable Energy
Electric Charging Infrastructure
SFO continues to build the required charging
infrastructure to promote the use of electric vehicles
on Airport. To date, SFO has accomplished the
following improvements to the Airport’s electric
charging infrastructure:
f Installation of electric chargers for aircraft
ground service equipment (GSE) vehicles at all
gates at Terminal 2. SFO’s policy is to equip all
new gates with electrical chargers for GSE.
f Installation of 20 Level II electric vehicle chargers
that can provide a full recharge in 4 to 8 hours
f Deployment of additional 110V Level I chargers
as part of the Terminal 2 Reconstruction
f Dedicated 28 parking spaces (and provided
space for up to 48 vehicles) for Plug-In “EV”
vehicles only.
1 Assumes an average electricity use of 6,721 kWh per California resident in 2010.
Source: The California Energy Commission, Energy Almanac. U.S. Per Capita Electricity Use by State in 2010. http://energyalmanac.ca.gov/electricity/us_per_ capita_electricity-2010.html
2 Mills, E., H. Friedman, T. Powell, N. Bourassa, D. Claridge, T. Haasl, and M.A. Piette. 2004. “The Cost-Effectiveness of Commercial-Buildings Commissioning,” Lawrence Berkeley National Laboratory. http://eetd.lbl.gov/EMills/PUBS/ Cx-Costs-Benefits.html
This map, displayed on
the Airport’s website,
shows the locations of
plug-in electric vehicle
charging stations at the
Airport. Please visit:
http://www.flysfo.com/web/page/orphan/plug-in_electric_car_parking/index.html

53
Biofuel: A new frontier for aircraft alternative fuelsBiofuels now offer the most promising means of reducing aircraft
GHG emissions. Currently, aviation represents 2% of global emis-
sions, but is expected to grow to 3% by 2050. A number of airlines
are pursuing alternative fuels as a means to combat crude oil price
volatility, save costs, and reduce GHG emissions. On July 1, 2011, the
U.S.-based technical-standards group –ASTM– approved biofuels
for commercial aircraft use. Since then, a number of airlines have
initiated commercial and demonstration flights. Although aircraft
GHG emissions are not accounted for as part of Airport-controlled
emissions (Category 1), SFO encourages airline initiatives to reduce
their GHG emissions.
Sources of aircraft biofuel
Sources of biofuel vary depending on the region where biofuels are
processed. Sources currently include plant sources, such as algae,
waste oils, and solid biomass, such as organic waste.
Airlines are exploring the use of biofuels
In February 2008, Virgin Atlantic flew the very first biofuel test flight
between London and Amsterdam, using a 20% blend of biofuels in
one of its engines. Air New Zealand, Continental Airlines, Japan
Airlines, Air China, and United Airlines have since initiated demon-
stration flights without passengers.
A number of airlines have taken their commitment to biofuels one
step further, by using biofuel on commercial flights: Alaska Airlines
has committed to make a number of biofuel-powered flights.
Lufthansa has flown several flights in Europe using a biofuel blend,
and United Airlines made a biofuel passenger flight in November
2011, a first for a domestic carrier.
Biofuels now offer the
most promising means
of reducing aircraft
GHG emissions.

SFO has established an
exemplary air quality
improvement program
that focuses on reducing
air emissions from
vehicles driving around
the airport. As part of
this effort, SFO has
dedicated parking spots
for clean fuel vehicles,
such as electric vehicles
(“EVs”), across the
airport.

55
SFO Policy
SFO shall continue to encourage the use of public transit, and, to the maximum extent practicable, require the use of
increasingly efficient vehicles and engines, and the use of clean fuels.
Objectives
f Use alternate clean fuels such as compressed natural gas (CNG), biodiesel, hydrogen, and electricity for
vehicles and equipment.
f Retrofit existing diesel-powered vehicles and equipment to reduce emissions.
f Reinforce SFO’s 2000 Clean Vehicle Policy that requires 100% clean vehicle use by 2012 where practicable.
f Develop staged intermediate air quality enhancement goals for Airport tenants and commercial entities
serving the Airport.
f Minimize air emissions by increasing the use of clean energy sources, developing additional solar energy
supplies, and evaluating the possible use of wind power.
SFO continues to be a leader in converting its fleet to clean vehicles and establishing
innovative programs to encourage Airport enterprises to take similar actions. The
Airport’s comprehensive air quality enhancement program minimizes air quality impacts
from aircraft and associated ground service equipment, cars and buses driving in and
around the Airport, and from fuel and energy use at Airport facilities. As air emissions are
closely linked to ozone and greenhouse gas generation, SFO’s air quality enhancement
initiatives not only benefit the health of the local community but also help to reduce the
Airport’s impact on climate change. The air quality benefits of transportation system
improvements are described in this chapter.
5. Air Quality
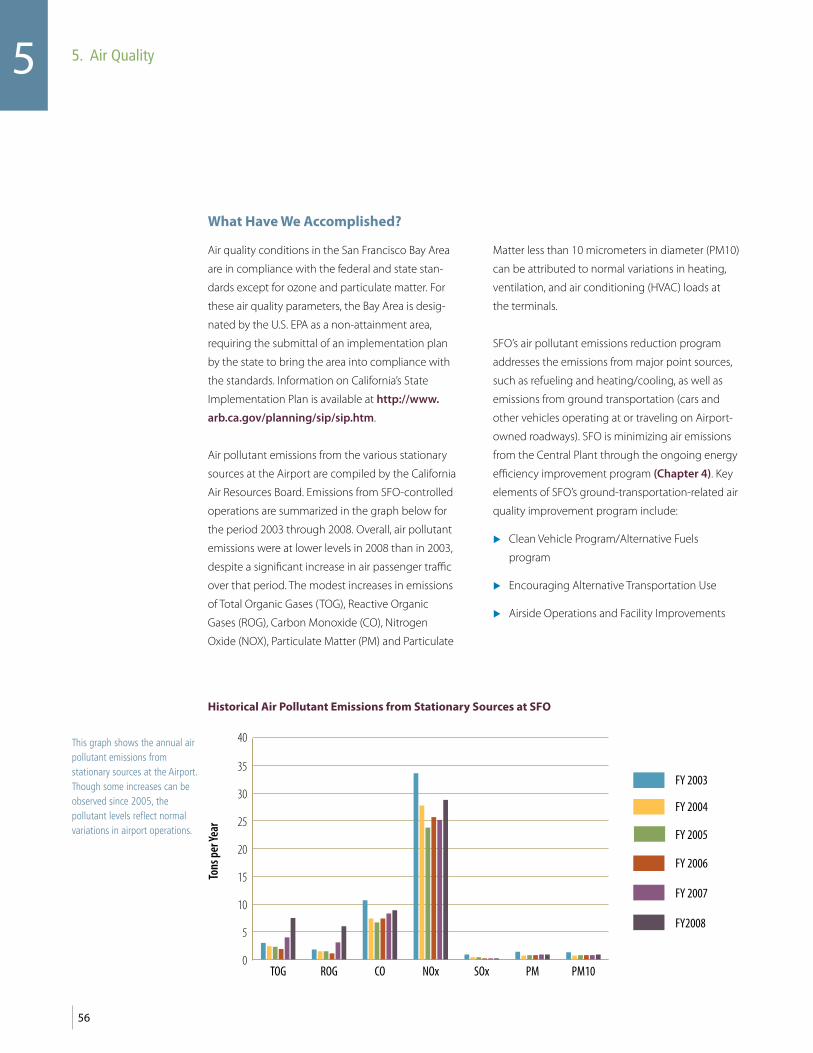
56
5 5. Air Quality
What Have We Accomplished?
Air quality conditions in the San Francisco Bay Area
are in compliance with the federal and state stan-
dards except for ozone and particulate matter. For
these air quality parameters, the Bay Area is desig-
nated by the U.S. EPA as a non-attainment area,
requiring the submittal of an implementation plan
by the state to bring the area into compliance with
the standards. Information on California’s State
Implementation Plan is available at http://www.
arb.ca.gov/planning/sip/sip.htm.
Air pollutant emissions from the various stationary
sources at the Airport are compiled by the California
Air Resources Board. Emissions from SFO-controlled
operations are summarized in the graph below for
the period 2003 through 2008. Overall, air pollutant
emissions were at lower levels in 2008 than in 2003,
despite a significant increase in air passenger traffic
over that period. The modest increases in emissions
of Total Organic Gases (TOG), Reactive Organic
Gases (ROG), Carbon Monoxide (CO), Nitrogen
Oxide (NOX), Particulate Matter (PM) and Particulate
Matter less than 10 micrometers in diameter (PM10)
can be attributed to normal variations in heating,
ventilation, and air conditioning (HVAC) loads at
the terminals.
SFO’s air pollutant emissions reduction program
addresses the emissions from major point sources,
such as refueling and heating/cooling, as well as
emissions from ground transportation (cars and
other vehicles operating at or traveling on Airport-
owned roadways). SFO is minimizing air emissions
from the Central Plant through the ongoing energy
efficiency improvement program (Chapter 4). Key
elements of SFO’s ground-transportation-related air
quality improvement program include:
f Clean Vehicle Program/Alternative Fuels
program
f Encouraging Alternative Transportation Use
f Airside Operations and Facility Improvements
This graph shows the annual air pollutant emissions from stationary sources at the Airport. Though some increases can be observed since 2005, the pollutant levels reflect normal variations in airport operations.
Historical Air Pollutant Emissions from Stationary Sources at SFO
0
5
10
15
20
25
30
35
40
FY2008
FY 2007
FY 2006
FY 2005
FY 2004
FY 2003
PM10PMSOxNOxCOROGTOG
Tons
per Y
ear
57
Clean Vehicle and Alternative Fuel Program
In 2000, SFO adopted a Clean Vehicle Policy that
established aggressive target dates to replace
gasoline and diesel powered vehicles with clean air
vehicles powered by alternative fuels such as CNG
and electricity. Where manufacturers offer competi-
tive alternative fuel products, the policy sets a goal
of 100% clean air vehicles in Airport and Airport-
permitted fleets by 2012. The fleet vehicles that are
covered by SFO’s Clean Vehicle Policy include hotel
and parking courtesy shuttles, shared-ride vans,
taxis, airline crew shuttles, and airfield vehicles such
as baggage tractors, belt loaders, and aircraft push-
back tractors.
Financing and Incentives
SFO uses a number of different financing and incentive
mechanisms to achieve the clean vehicle transition:
f Vehicle acquisition incentives for SFO and
permitted operator fleets
The Airport has secured $12 million in vehicle
acquisition incentives from the Bay Area Air
Quality Management District (BAAQMD),
Metropolitan Transportation Commission (MTC),
and San Francisco County Transportation
Authority (SFCTA) for vehicles operating to and
from the Airport.
f Funding from federal and state agencies for
SFO fleet and infrastructure
SFO has obtained $4 million for airfield vehicles
and infrastructure, on-Airport shuttles, Airport
utility vehicles, and an advanced hydrogen
vehicle refueling station from federal and state
agencies including the Federal Aviation
Administration (FAA), Environmental Protection
Agency (EPA), California Air Resources Board
(CARB), and California Energy Commission (CEC).
f Financial and nonfinancial incentives
SFO encourages alternative fuel vehicle use by
fleet operators through a variety of financial and
nonfinancial incentives, including:
F penalty trip fees for hotel courtesy shuttles
have reduced miles traveled by one third
F “head of the line” privileges for CNG
taxicabs
F a requirement that shared-ride van operators
use CNG or equivalent emission vans
F CNG fueling stations. The Airport hosts two
of the largest public CNG fueling stations in
Northern California.
F Green Car Rental Incentive Program. The
GCRIP provides financial incentives to Airport
rental car companies to increase the number
of “green” fuel efficient or alternative-fueled
vehicles in their rental car inventory. As part
of the GCRIP, SFO also initiated a three-year
program to reward the passengers renting a
“green” vehicle, by providing a $15 discount on
each rental transaction. In FY 2010, 25.6% of
car rental transactions were for “green” vehicles,
saving over 1 million gallons of gasoline for
the passengers and reducing 11,442 metric
tons of GHG emissions to the atmosphere.
Advertisement for SFO’s Green Car Rental Incentive Program

58
5 5. Air Quality
The Airport levies higher fees on those operators
that do not comply with the requirements of the
Clean Vehicle Policy.
Greening Airfield Vehicles
SFO’s Clean Vehicle Policy extends to airfield vehi-
cles. The move to electrify aircraft ground service
equipment (GSE) started more than a decade ago.
Now, over 300 all electric vehicles and a growing
number of clean diesel vehicles are in service. By
2012, about half the GSE fleet will use clean power,
up more than 40% in a decade. As part of the
Terminal 2 renovation project, electric chargers were
installed and are sufficient to serve that building’s
GSE needs.
Diesel Vehicle Filters and Rebuilds
Major charter bus and scheduled airporter bus
firms, and SFO’s on-Airport shuttle bus company
have installed the most advanced particulate filters
available on 125 diesel vehicles serving SFO. These
filters reduce emissions of fine particle by 97% and
of nitrous oxides by 85%, in a major advance for public
health. The firms have also added new vehicles to their
fleets that incorporate engines and filters providing
equivalent emission reductions. On the airfield,
Southwest Airlines and others are completely
rebuilding diesel-powered ground support equip-
ment with the cleanest available engines.
City and County of San Francisco “Zero Emissions
2020” Plan
In addition to its own Clean Vehicle Policy, SFO is
participating in the City’s Zero Emissions 2020 Plan,
which commits all City departments to developing
a clean air plan for public transit. In coordination
with San Francisco Municipal Railway (MUNI), “Zero
Emissions 2020” focuses on the purchase of cleaner
transit buses, including hybrid diesel-electric buses.
Because the Airport’s own clean vehicle policy is
more aggressive than the City’s, SFO remains ahead
of the City goal.
Clean Air Vehicle Program Successes
Clean air vehicle use substantially reduces legacy
vehicle emissions. Despite the post-2001 air traffic
downturn which seriously delayed vehicle replace-
ments in many cases, SFO has met the conversion
targets for public transit vehicles, hotel courtesy
shuttles, off-Airport parking shuttles, and aircraft
ground support equipment. By 2012, SFO plans to
replace 100% of conventional vehicles with clean air
vehicles, where viable clean fuel options are available.
In 2008, the Airport partnered with the San Francisco
Taxi Line outside
Terminal 1. SFO
allows taxi drivers
using CNG-powered
vehicles to skip to the
head of the taxi queue.
This financial incentive
encourages taxicabs to
drive cleaner vehicles.

59
Municipal Transportation Agency (MTA) to develop
a Clean Taxi Policy. The City’s taxi fleet (which handles
99% of Airport pickups) currently consists of over
1000 hybrid-electric cabs and about 100 CNG cabs,
representing at least 75% of all City cabs on the
path to full compliance in 2012.
SFO Clean Vehicle Count
SFO strives to maintain a diversity of fuel uses at the
Airport in order to maintain flexibility in its fleet
vehicle composition, while supporting a variety of
technologies. In FY 2010, over 3,000 electric, CNG,
advanced diesel, biodiesel, and propane vehicles
were in operation at SFO. These include the
following types of vehicles:
f 168 BART, AirTrain rail cars (electric)
f 1,200 taxicabs (hybrid-electric, CNG)
f 500+ rental cars (hybrid-electric)
f 53 limousines (hybrid-electric, CNG)
f 250 highway coaches (filtered diesel)
f 23 transit buses (CNG, filtered diesel)
f 115 minibuses (CNG)
f 125 vans (CNG)
f 400 airfield vehicles (electric, rebuilt diesel,
propane)
f 300 staff and utility vehicles (CNG, plug-in
electric, hybrid-electric, biodiesel [some with
particulate filters])
In FY 2010, the following fuel sources were in use at
the Airport:
f Compressed Natural Gas: The majority of
on-road alternative fuel vehicles at the Airport
operate on CNG, which emit 25% less CO2 than
gasoline powered vehicles per mile traveled.1
To date, more than 500 diesel and gasoline-
powered vehicles have been replaced with
CNG models, resulting in savings of over
1.5 million gallons of gasoline and diesel fuel
annually by SFO ground transportation and
ground service vehicles.
f Electric Plug-In Vehicles: SFO’s Clean Air
Vehicle Policy extends to airfield vehicles and
equipment. The move to electrify GSE vehicles
started more than a decade ago. Of the 1,000
privately-owned and operated off-road GSE
vehicles that are dedicated to the airfield, about
400 are electric vehicles, resulting in savings of
700,000 gallons of diesel fuel per year. This includes
83 vehicles that replaced propane vehicles. Due
to a new CARB rule (LSI rule), off-road propane
vehicles are no longer considered compliant
with emissions standards. Also, SFO operates 28
neighborhood electric vehicles that are typically
designed to have a top speed of 30 miles per hour.
A CNG-powered
airport shuttle bus.
The majority of
on-road alternative fuel
vehicles at the Airport
operate on CNG, which
emit 25% less CO2
than gasoline powered
vehicles per mile
traveled.1

60
5 5. Air Quality
f Hybrid-Electric Vehicles: The Airport operates
26 hybrid-electric vehicles, and continues to
replace aging vehicles with hybrid-electric ones.
f Biodiesel: San Francisco’s Department of the
Environment credits SFO with being the first city
department to run all its diesel vehicles on a 20%
biodiesel blend (20% soy fuel, 80% diesel fuel).
Currently, all 12 Airport-owned diesel shuttle buses
are using B-20 biodiesel with annual diesel fuel
savings of 35,000 gallons, and all 137 Airport-
owned diesel vehicles used biodiesel in FY 2010.
Electric Vehicle Charging StationsSFO offers electric charging stations for private motorists, airport
fleet vehicles, as well as for aircraft ground service equipment
(GSE) vehicles used on the airfield (e.g. aircraft pushback tugs).
GSE Electrical Chargers
SFO’s policy is to equip all new aircraft gates with electrical char-
gers for GSE. Currently electric chargers are located at all gates at
Terminal 2. In addition, airlines provide their own GSE chargers at
other boarding areas.
Automobile Chargers
Twenty 208V Level II electric vehicle charging stations have been
installed in SFO’s short-term parking garages for the use of
private motorists. Depending on the vehicle, these chargers can
provide a full recharge in 4 to 8 hours. In addition, the Airport
installed additional Level I chargers in Terminal 2 garages as well
as at parking stalls at the Airport Business Center. These 110V
systems can provide a full charge in 10 to 20 hours. The Airport is
also preparing to lease land for an electric vehicle battery
exchange station that quickly swaps spent batteries for
recharged ones. Only specially-manufactured vehicles will be
able to use this facility.
The Airport is considering sponsoring one or more 480V (“fast”)
charging facilities in the garages. Motorists would be required to
pay to use these chargers and they would potentially be offered
in conjunction with retail or fueling concessions. These chargers
can bring a vehicle to full charge in less than one hour.
Electric vehicles
utilizing SFO’s Level
II charging stations in
the Domestic Garage.

61
Encouraging Alternative Transportation Use
SFO recognizes that offering public transportation
alternatives is an essential component of SFO’s
mission of providing an exceptional airport in
service to Bay Area communities, and improving
local air quality.
Public Transportation Improvements
AirTrain: As described in Chapter 3, Climate
Change, SFO inaugurated service on AirTrain in
2003. AirTrain eliminated 200,000 car rental shuttle
bus trips from the terminal loop annually, reducing
both traffic congestion and the emissions created
by traditionally fueled vehicles.
Bay Area Rapid Transit (BART): BART began
serving SFO in 2003, connecting the Airport with
downtown San Francisco, the Peninsula and much
of the East Bay. Customers arriving on BART are able
to exit the Airport BART station and walk directly to
the international airline ticket counters or connect
to AirTrain (one level up at a shared AirTrain/ BART
Station) to reach the domestic terminals. Currently
approximately 10% of passengers use BART for travel
to and from SFO. In some East Bay localities, BART
carries over 25% of the Airport customers.
Caltrain: A BART cross-platform connection to
Caltrain at the Millbrae station provides direct
access from the Peninsula’s key rail route to the
Airport terminals.
Transit-First Program
SFO is a leader among US airports in the use of
shared ground transportation for Airport access.
SFO’s Transit-First Policy promotes the use of public
and private high occupancy vehicles (HOV) for
traveling to the Airport, increasing the use of
shared-ride modes over driving alone. This results
in improving regional intermodal ground access
between the Airport and regional rail, bus, and
waterborne transit systems. The Transit-First Policy
gives priority to public and private high occupancy
transportation modes. The use of BART by passengers
has increased significantly since 2006. Approximately
10% of air passengers use public transportation in
the form of BART/ Caltrain in 2011. SFO is exploring
initiatives that could further increase the use of
public transit by passengers.
Results from a 2011 Airport Customer Survey indicated that most customers reach the airport by automobile; with more than half saying either they were dropped off, took a taxi or limo, drove a rental car, or drove their own vehicle and parked. Approximately 10% of air passengers used public transportation in the form of BART/ Caltrain in 2011. The use of BART by passengers has increased significantly since 2006.
Passenger Travel Modes (2011 Survey)
43% PRIVATE VEHICLE (PARKED OR DROP-OFFS)
13% RENTAL CAR
10% BART
16% TAXI/LIMOUSINE
18% DOOR-TO-DOOR VAN/HOTEL SHUTTLE/CHARTER BUS
Note: Passengers transferring from another flight are not included in the chart above.

62
5 5. Air Quality
Employee Commute Program
In 1993, SFO added a “Trip Reduction Rule” to the
Airport’s official Rules and Regulations aimed at
reducing employee trips to the airport in single
occupancy vehicles. SFO’s Employee Trip Reduction
Program includes the following elements:
f New employees are notified of the Airport’s Trip
Reduction Rule.
f SFO conducts a biennial survey of all employees
regarding their commuting habits.
f Ground transportation information is provided
on SFO’s website and at information booths in
the terminals, also through a public media
campaign and curbside program.
In January 2009, the City and County of San Fran-
cisco issued a new Commuter Benefits Ordinance
that requires all employers in San Francisco with
20 or more employees to implement a community
benefits program. As a result of this ordinance, SFO
amended its Trip Reduction Rule to require each
covered employer to provide employees working at
SFO with one of the following:
1. Use of pre-tax dollars for public transit and
vanpool expenses
2. An employer-paid benefit allowance for
commuting expenses such as bus or rail passes
up to the value of a Municipal Railway monthly
pass (currently $72/month);
3. Employer provided transportation.
The most recent survey of Airport Commission
employees’ commute travel was conducted in
January 2011, the results of which are shown in the
adjacent graphic. Convenience, travel times, and the
availability of free parking are the determining
factors in employee commute decisions.
Bicycle Use
SFO encourages bicycle commuting as well as using
bikes to get around at the Airport. SFO has been
expanding its bike lane network and in 2012 plans
Employee Commuting Travel Modes (2011)
Results from a January 2011 Employee Survey show that 80% of employees drive alone, 11% carpool, 8% use public transportation, and 1.2 % use other modes (bike, etc.). 80%
DRIVE ALONE
11% CARPOOL
8% BART/BUS
.2% SHUTTLE/TAXI/LIMOUSINE
.6% MOTORCYCLE/SCOOTER
.1% TELECOMMUTE
.5% BICYCLE

63
to make shared smartbikes available to employees
for use at the Airport. North and South McDonnell
Road offer good bicycle access with a marked route
into the airport beginning at San Bruno Avenue
from the north, and Millbrae Avenue from the
south. In addition, SFO offers five courtesy bicycle
parking areas at the airport, where passengers and
airport employees may utilize courtesy bicycle racks.
To gain access to the airport via bicycle, BART and
SamTrans offer a convenient bike/transit option that
is safe and environmentally friendly.
Airside Operations and Facility Improvements
Over the past several years SFO has implemented a
number of measures to reduce the generation of
waste materials and emission of air pollutants,
including the modification of operating procedures
and the use of technologically-advanced equipment.
Procedures employed by aircraft operators can
reduce fuel consumption and emissions associated
with aircraft ground operations. SFO does not
currently have any mandatory programs requiring
fuel efficiency or emission reduction requirements
by air carriers. However, most airlines have internal
policies aimed at reducing fuel consumption that
also result in associated reductions in air pollutant
emissions. SFO encourages airlines and ground
service equipment operators to institute environ-
mentally and economically beneficial operational
procedures, such as:
f Single-engine taxiing of aircraft,
f Airside alternative fuel infrastructure,
f Conversion to clean fuel ground service
equipment, and
A bike lane on South
McDonnell Road offers
bicyclists a marked route
to their destination at
the Airport. Although
only 0.5% of employees
commute by bike, the
bike lanes are also
used by many regional
cyclists. The McDonnell
Road bike lanes are
a key link in the Bay
Trail, which encircles
the Bay.
B
C
D
F
DomesticGarage
Terminal 2
Terminal 3Terminal 1
AInternationalGInternational
E
InternationalTerminal
San Francisco
San Jose
N
S
South Airport Blvd.
South McDonnell Rd.
MillbraeAve
NorthLink Rd.
SouthLink Rd.
Use North and/or South McDonnell Road to access bicycle racks
WestArea Dr
WestField Rd
101
North McDonnell Rd.
101
Gnational Internationa
Rental Car Center
IntteWestfieldGarage
Courtyard G Courtyard A
Domestic GarageLevel 4, Section C
A map of the five
courtesy bicycle parking
areas at the Airport.

64
5 5. Air Quality
f Route planning, altitude selection, and reduced
fuel loading for aircraft weight control.
Airside Alternative Fuel Infrastructure
SFO has installed ground based energy supply and
service facilities to curtail the use of aircraft auxiliary
power systems for providing aircraft electricity and
air conditioning at the gate:
f 400 Hz Ground Power and pre-conditioned air is
provided at International Terminal gates, at most
gates at Boarding Areas B, C, E, and F, and all
gates at the renovated Terminal 2. Assuming
similar usage for other areas of the Airport, the
system at Terminal 2 could save 522,838 gallons
of jet fuel and reduce the associated air emissions.
f Procurement and use of portable Ground Power
Units (GPUs) by Airport tenants is encouraged by
the Airport when Ground Power is not available
at the gate.
1 U.S. Department of Energy, Alternative Fuels and Advanced Vehicles Data Center. Natural Gas Vehicle Emissions. http://www.afdc.energy.gov/afdc/vehicles/natural_gas_emis-sions.html (accessed 12/30/11)
SFO is planning to lease property for hydrogen vehicle refueling
and electric vehicle battery swap facilities. These facilities are set
to open in late 2012 and 2013. They will be the first of their type
at any North American airport. Hydrogen will be dispensed at
sufficient pressure to allow vehicles up to 300 miles of range,
while electric batteries would be exchanged in the time it takes
to refill the tank in a hydrocarbon powered vehicle.
The facilities represent a partnership between SFO and private
sector energy companies Linde LLC and Better Place and grant
agencies including the California Air Resources Board and Cali-
fornia Energy Commission.
SFO is an industry leader in deploying alternative fuel and low-
emission vehicles at the Airport. Currently vehicles operated at
SFO use CNG (taxis, vans, shuttles, and SFO fleet vehicles); pure
electricity (cars and aircraft service vehicles); hybrid electric (taxis,
rental cars, and Airport-owned vehicles) filtered diesel (charter,
scheduled Airporter buses and Airport-owned vehicles) and
biodiesel (Airport-owned vehicles). For more information on
SFO’s Clean Air Vehicle policy, please see the fact sheet available at
http://www.flysfo.com/web/page/about/green/index.html
Funding
Total hydrogen fueling and battery swap facility investment
exceeds $5 million, including over $1 million from the private sector.
Location
The hydrogen and electric vehicle battery swap complex will be
located near Millbrae Avenue, a block from the Highway 101
interchange. Access will be from South McDonnell Road, just
inside the boundary of SFO property.
Uses
The hydrogen fueling and electric vehicle battery exchange
complex will add to the fuel diversity of the airport’s fleet vehi-
cles and will be used by taxicabs, advanced fuel cell autos,
on-Airport shuttle buses and San Francisco MTA buses powered
by hydrogen, and airfield mobile lighting units that would
replace the less fuel efficient diesel-powered units.
SFO Hydrogen and Electric Battery Exchange Fueling Complex

65
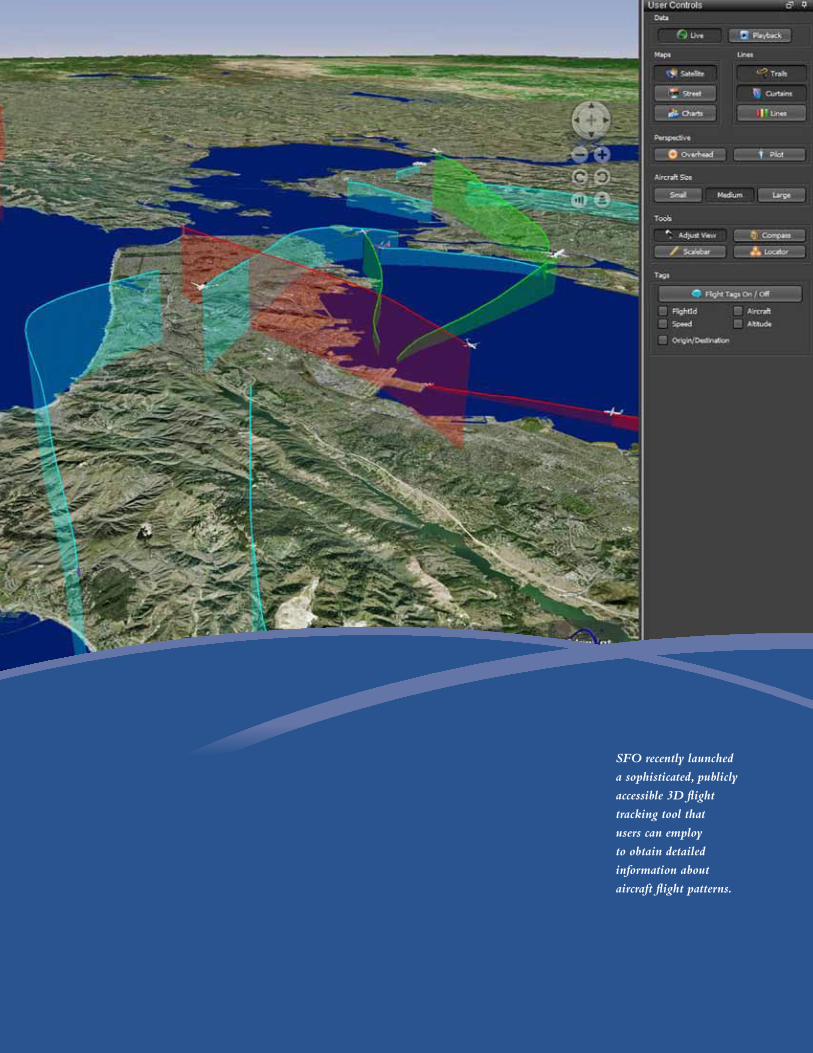
SFO recently launched
a sophisticated, publicly
accessible 3D flight
tracking tool that
users can employ
to obtain detailed
information about
aircraft flight patterns.
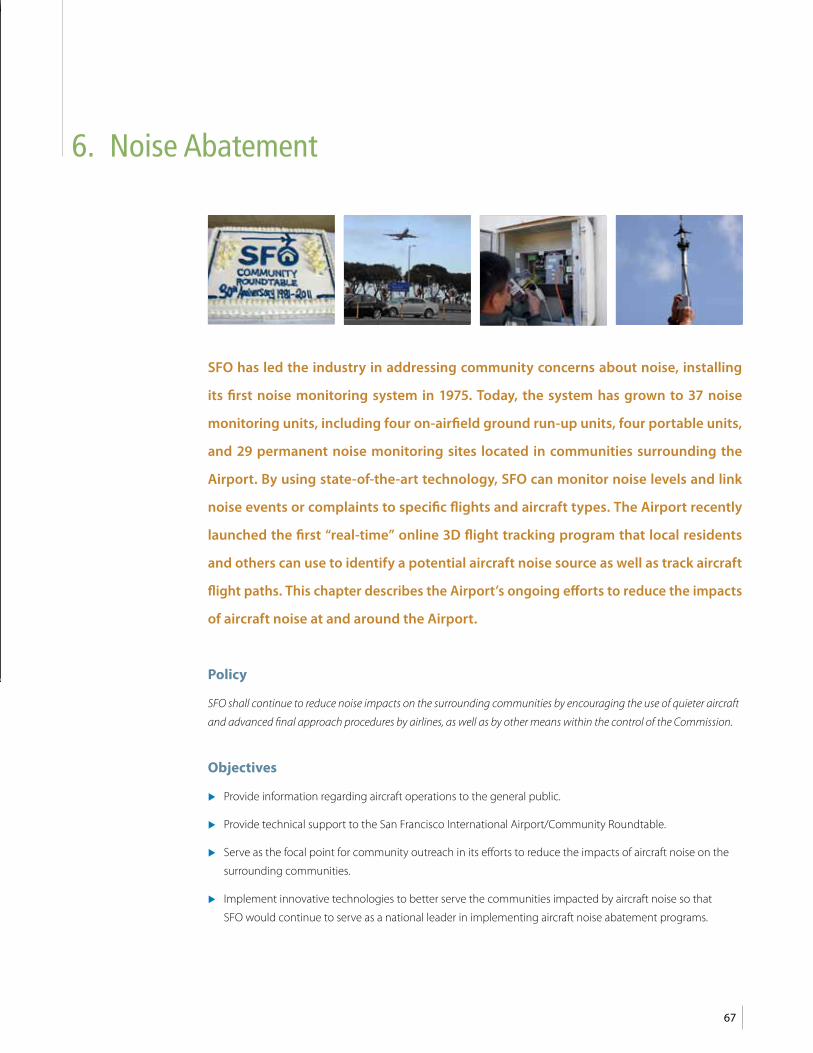
67
Policy
SFO shall continue to reduce noise impacts on the surrounding communities by encouraging the use of quieter aircraft
and advanced final approach procedures by airlines, as well as by other means within the control of the Commission.
Objectives
f Provide information regarding aircraft operations to the general public.
f Provide technical support to the San Francisco International Airport/Community Roundtable.
f Serve as the focal point for community outreach in its efforts to reduce the impacts of aircraft noise on the
surrounding communities.
f Implement innovative technologies to better serve the communities impacted by aircraft noise so that
SFO would continue to serve as a national leader in implementing aircraft noise abatement programs.
SFO has led the industry in addressing community concerns about noise, installing
its first noise monitoring system in 1975. Today, the system has grown to 37 noise
monitoring units, including four on-airfield ground run-up units, four portable units,
and 29 permanent noise monitoring sites located in communities surrounding the
Airport. By using state-of-the-art technology, SFO can monitor noise levels and link
noise events or complaints to specific flights and aircraft types. The Airport recently
launched the first “real-time” online 3D flight tracking program that local residents
and others can use to identify a potential aircraft noise source as well as track aircraft
flight paths. This chapter describes the Airport’s ongoing efforts to reduce the impacts
of aircraft noise at and around the Airport.
6. Noise Abatement

68
6 6. Noise Abatement
What Have We Accomplished?
For more than 30 years, SFO has been a leader in
noise monitoring, disclosure, and reduction
programs and policies. As a result of these efforts,
the number of people living within the 65 decibel
(dB) Community Noise equivalent Level (CNEL)
contour, the area defined as experiencing significant
aircraft noise, dropped from 35,100 in 1976 to 3,298
at the beginning of 2000. Through the use of sound
insulation and avigation easements, SFO has been
able to eliminate all incompatible land uses within
the noise impact area, as defined in Title 21 of the
California Code of Regulations. Consequently, SFO
was the first major airport in California to succeed in
eliminating all incompatible land uses within the
State 65 dB CNEL contour and to operate without a
variance. In 2002, the San Mateo County Board of
Supervisors honored the Airport with a resolution
recognizing it as the first airport in the State of Cali-
fornia to remove all incompatible land uses within
the State-defined noise impact area.
The noise impact area of aircraft overflights are
shown in the adjacent figure that depicts the 2nd
Quarter 2011 65 dB CNEL aircraft noise contour
around the Airport. Due to the Airport’s geographic
location and landing and takeoff patterns, most of
the significant aircraft noise impacts occur over the
Bay with a portion of the 65 dB CNEL contour over-
lapping the municipal areas of San Bruno, South
San Francisco, and Daly City.
The Noise Abatement Office has been responsible
for implementation of the comprehensive Aircraft
Noise Abatement Plan and for identifying noise
reduction initiatives. The Office continues to work
collaboratively with the FAA’s Air Traffic Control
(ATC) Tower and the airlines to reduce nighttime
noise and for the evaluation of new procedures to
further reduce noise impacts. SFO continues to
improve long-standing noise abatement programs
such as the Fly Quiet Program, noise complaint
tracking, aircraft noise monitoring, nighttime prefer-
ential runway use, and arrival procedure research.
These programs and initiatives are intended to aid
in achieving the Airport’s noise policy objectives.
What is “Compatible Land Use”? What is an “Avigation Easement”?The Federal Aviation Regulation (FAR) Part 150 designates
noise compatibility areas by land use. Residential uses are
considered compatible with Airport generated noise if the
Community Noise Equivalent Level (CNEL) at the site is below
65 dB. If the homes are sound insulated, the noise compat-
ibility threshold level is raised to 70 dB for the given site.
Commercial land uses are considered to be compatible within
CNEL contour lines of 80 dB or less. The CNEL noise metric,
used by SFO and the State of California, gives both evening
and late night noise a heavier weight to account for the more
aggravating disturbance caused by such noise.
An avigation easement allows aircraft to fly, land, or take off in
unobstructed airspace above a parcel of real property. Such an
easement often prohibits the property owner from installing
structures that exceed a specified height and/ or grants the
right to make noise and generate dust at or above the
property in conjunction with proper operation of an aircraft.

69
Aircraft Noise Monitoring System
SFO maintains a state-of-the-art permanent noise
monitoring system to keep track of noise levels in
communities around the Airport. SFO has deployed
29 permanent noise monitoring stations located
around the Airport and also uses four portable units.
Information produced from the Noise Monitoring
System is central to the operations of the Aircraft
Noise Abatement Office and serves as the basis for:
f Identifying overall trends in noise levels
f Evaluating airline compliance with noise
abatement flight tracks, including the Fly
Quiet Program
f Following up on unusual occurrences
f Monitoring preferential runway use programs
f Validating the accuracy of CNEL noise
contour models
Image © 2011 TerraMetrics | Data CSUMB SFML CA OPC | Data SIO, NOAA, U.S. Navy, NGA, GEBCO
© Google Earth™ mapping service
This image shows the 65 dB CNEL aircraft noise contours at SFO for the 2nd Quarter of 2011. Most
of the significant aircraft noise impacts occur over the Bay with a portion of the 65 dB CNEL contour
overlapping the municipal areas of San Bruno and South San Francisco. SFO became the first major
airport in California to succeed in eliminating all incompatible land uses within the State 65 dB
CNEL contour.
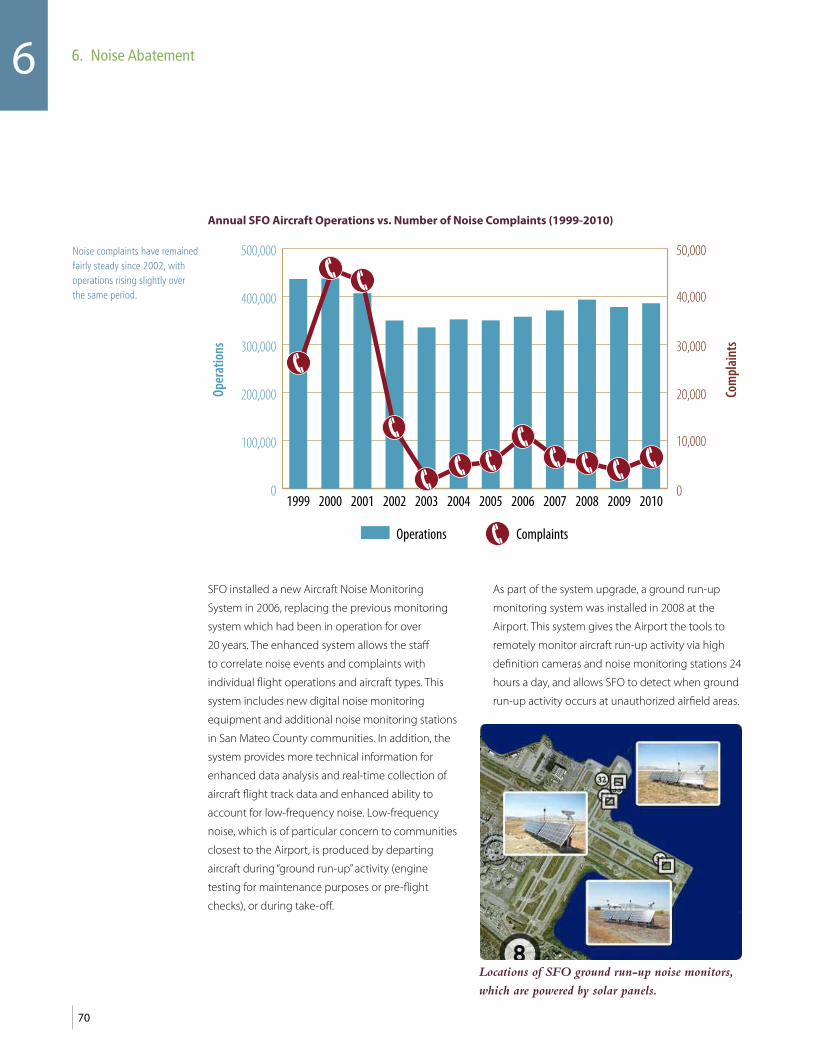
70
6 6. Noise Abatement
SFO installed a new Aircraft Noise Monitoring
System in 2006, replacing the previous monitoring
system which had been in operation for over
20 years. The enhanced system allows the staff
to correlate noise events and complaints with
individual flight operations and aircraft types. This
system includes new digital noise monitoring
equipment and additional noise monitoring stations
in San Mateo County communities. In addition, the
system provides more technical information for
enhanced data analysis and real-time collection of
aircraft flight track data and enhanced ability to
account for low-frequency noise. Low-frequency
noise, which is of particular concern to communities
closest to the Airport, is produced by departing
aircraft during “ground run-up” activity (engine
testing for maintenance purposes or pre-flight
checks), or during take-off.
As part of the system upgrade, a ground run-up
monitoring system was installed in 2008 at the
Airport. This system gives the Airport the tools to
remotely monitor aircraft run-up activity via high
definition cameras and noise monitoring stations 24
hours a day, and allows SFO to detect when ground
run-up activity occurs at unauthorized airfield areas.
Noise complaints have remained fairly steady since 2002, with operations rising slightly over the same period.
Annual SFO Aircraft Operations vs. Number of Noise Complaints (1999-2010)Op
erat
ions
Com
plai
nts
0
100,000
200,000
300,000
400,000
500,000
0
20,000
10,000
30,000
40,000
50,000
201020092008200720062005200420032002200120001999
Operations Complaints
Locations of SFO ground run-up noise monitors,
which are powered by solar panels.

71
Airport employees installing and programming noise monitors. SFO has deployed 37 noise
monitoring stations on-Airport and throughout the neighboring communities. Four of these
monitors are solar-powered.
Live Online 3D Flight Tracking: the first of its kind
In 2011, SFO released a powerful new user-controlled
online flight tracking tool, which provides the public
with live* flight information for aircraft anywhere in
the SFO airspace. This tool can help users identify the
location, altitude, operator (airline), flight number,
and originating/arriving airport (SFO, San Jose, or
Oakland) for any flight of interest. This 3D flight
tracking tool, the first of its kind to be made publicly
available, also gives users a wide range of controls,
including:
f The choice to playback flights from any past date
or to view live flights*
f Ability to manipulate the screen view (zoom in
and out, tilt, or rotate the view)
f Ability to use “overhead” view or track a selected
aircraft in “pilot” view, which allows users to view
an aircraft’s trajectory from the pilot’s perspective
f Ability to vary aircraft speed
f Satellite, street map, or aeronautical chart views
f Ability to view aircraft trails or “curtains” that extend
the aircraft’s location to the ground-equivalent
location, and flight track lines that do not
disappear when aircraft have left the airspace
f Ability to find a specific address on the map and
mark this location on the map
f Ability to tag aircraft with identifiers such as
altitude, speed, operator (airline), flight number,
and origin/destination
To access the live* online 3D flight tracking system,
please visit SFO’s Fly Quiet website: http://www.
flyquietsfo.com/
* The flight tracking display is delayed by 10 minutes
for security, which also allows a user time to enter
the website and identify an aircraft that may have
caused a noise disturbance.
SFO developed this tool in collaboration with
BridgeNet International.

72
6 6. Noise Abatement
Two views of SFO’s
online 3D Flight
Tracking Tool, the first
of its kind to be publicly
available. The tool
allows anyone to track
flights departing and
arriving at SFO, San
Jose, or Oakland, either
in “overhead” mode
(above) or “pilot”
mode (below, from
the “cockpit” of
the aircraft).
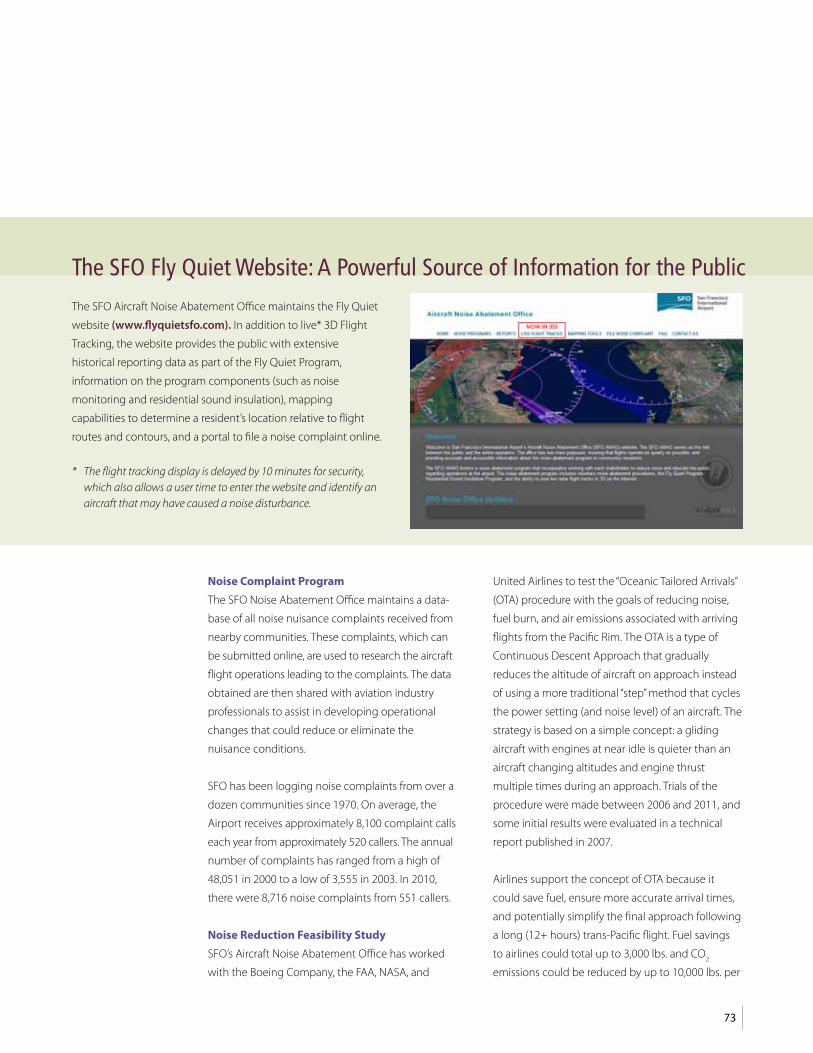
73
Noise Complaint Program
The SFO Noise Abatement Office maintains a data-
base of all noise nuisance complaints received from
nearby communities. These complaints, which can
be submitted online, are used to research the aircraft
flight operations leading to the complaints. The data
obtained are then shared with aviation industry
professionals to assist in developing operational
changes that could reduce or eliminate the
nuisance conditions.
SFO has been logging noise complaints from over a
dozen communities since 1970. On average, the
Airport receives approximately 8,100 complaint calls
each year from approximately 520 callers. The annual
number of complaints has ranged from a high of
48,051 in 2000 to a low of 3,555 in 2003. In 2010,
there were 8,716 noise complaints from 551 callers.
Noise Reduction Feasibility Study
SFO’s Aircraft Noise Abatement Office has worked
with the Boeing Company, the FAA, NASA, and
United Airlines to test the “Oceanic Tailored Arrivals”
(OTA) procedure with the goals of reducing noise,
fuel burn, and air emissions associated with arriving
flights from the Pacific Rim. The OTA is a type of
Continuous Descent Approach that gradually
reduces the altitude of aircraft on approach instead
of using a more traditional “step” method that cycles
the power setting (and noise level) of an aircraft. The
strategy is based on a simple concept: a gliding
aircraft with engines at near idle is quieter than an
aircraft changing altitudes and engine thrust
multiple times during an approach. Trials of the
procedure were made between 2006 and 2011, and
some initial results were evaluated in a technical
report published in 2007.
Airlines support the concept of OTA because it
could save fuel, ensure more accurate arrival times,
and potentially simplify the final approach following
a long (12+ hours) trans-Pacific flight. Fuel savings
to airlines could total up to 3,000 lbs. and CO2
emissions could be reduced by up to 10,000 lbs. per
The SFO Fly Quiet Website: A Powerful Source of Information for the PublicThe SFO Aircraft Noise Abatement Office maintains the Fly Quiet
website (www.flyquietsfo.com). In addition to live* 3D Flight
Tracking, the website provides the public with extensive
historical reporting data as part of the Fly Quiet Program,
information on the program components (such as noise
monitoring and residential sound insulation), mapping
capabilities to determine a resident’s location relative to flight
routes and contours, and a portal to file a noise complaint online.
* The flight tracking display is delayed by 10 minutes for security, which also allows a user time to enter the website and identify an aircraft that may have caused a noise disturbance.

74
6 6. Noise Abatement
Boeing 777 aircraft flight1. Air traffic controllers
believe the OTA will assist them in planning ideal
descents and improve efficiency during high traffic
periods. Communities along the arrival routes would
also benefit because the aircraft flying an OTA
would operate at reduced power and with few or
no drag-inducing and noise making surfaces (flaps,
speed brakes, and landing gear) being deployed.
Currently, the OTA procedure is voluntarily flown by
participating airlines. Full adoption of the OTA
procedure in the future will require aircraft
equipped with Future Air Navigation System (FANS)
avionics, which provide for a direct data link
between the aircraft and Air Traffic Control (ATC).
Asia and South Pacific Initiative to Reduce
Emissions (ASPIRE)
SFO and New Zealand’s Auckland Airport are one of
the first city pairs to be included in an industry effort
to reduce noise levels and air pollutant emissions on
heavily traveled air routes between the US and Asia/
South Pacific. The ASPIRE program is a collaborative
effort of the FAA, Airservices Australia, Airways New
Zealand, Japan Civil Aviation Bureau, and the Civil
Aviation Authority of Singapore. The Auckland,
New Zealand to SFO route was one of the first to
start testing procedures resulting in fuel savings
and emissions reductions in 2008.
The Fly Quiet Program
The Fly Quiet Program, implemented by the Aircraft
Noise Abatement Office, encourages individual
airlines to operate as quietly as possible at SFO. As
part of the program, Airport staff generates a Fly
Quiet Report, which provides airline scores on the
following elements (noise abatement ranking
procedures for flight departures are shown in the
following figure):
f Fleet noise quality
Fly Quiet assigns a higher rating or grade to
airlines operating quieter, new generation
aircraft, while airlines operating older, louder
technology aircraft would rate lower. The goal of
this measurement is to fairly compare airlines—
not just by the fleet they own, but by the
frequency that they schedule and fly particular
aircraft into SFO.
f Number of times allowable noise levels were
exceeded (Noise Exceedance)
Whenever an aircraft overflight produces a noise
level higher than the maximum decibel value
established for a particular monitoring site, the
noise threshold is surpassed and a noise
exceedance occurs. Noise exceedances are
logged by the exact operation along with the
aircraft type and airline name.
f Nighttime preferential runway use
The main focus of this program is to maximize
flights over water and minimize flights over land
and populated areas between 1:00 a.m. and 6:00
a.m. Although the program cannot be used
100% of the time because of winds, weather,
and other operational factors, the Airport, the
Community Roundtable, the FAA, and the
Airlines have all worked together to maximize
the use of certain runways at night when
conditions permit. The program is voluntary;
compliance is at the discretion of the pilot.
f Shoreline departure quality
Fly Quiet assigns a higher grade to aircraft that
use the Shoreline Departure Procedure. This
departure steers aircraft to the northeast shortly
after takeoff in an attempt to keep aircraft and
aircraft noise away from the residential
communities located to the northwest of SFO.
By keeping aircraft east of Highway 101, the
majority of the overflights are experienced by
industrial and business parks instead of
residential areas and operators will receive a
higher rating.
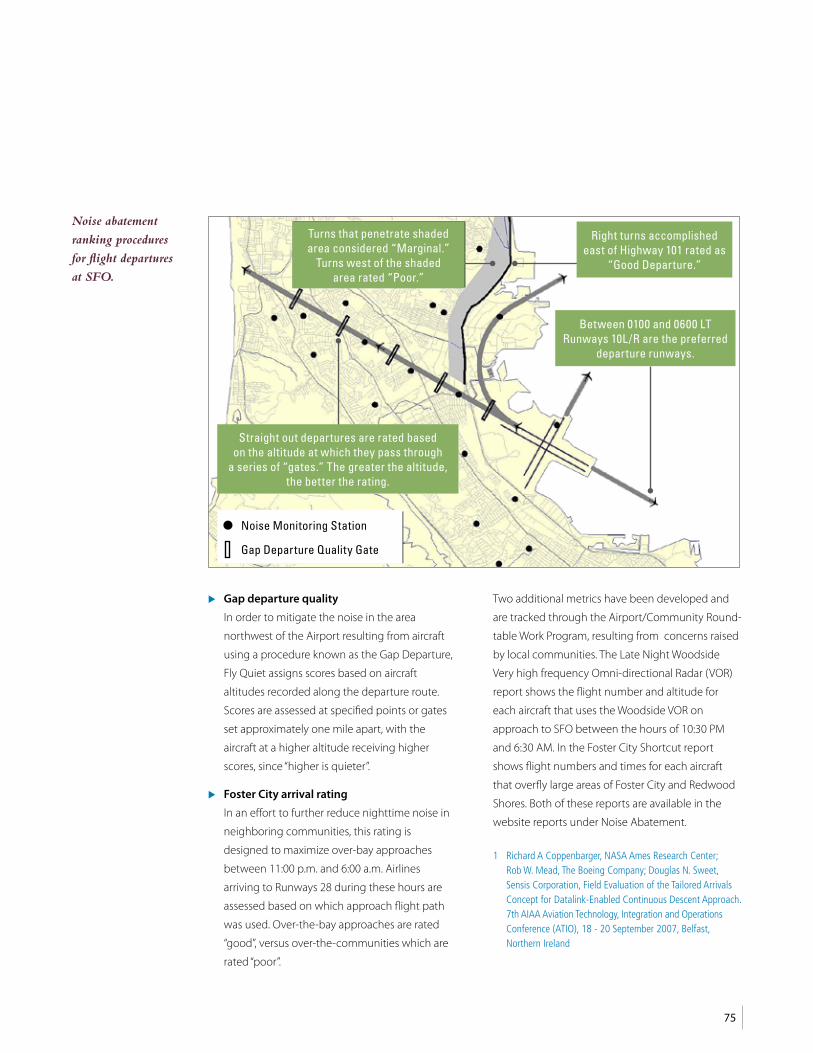
75
f Gap departure quality
In order to mitigate the noise in the area
northwest of the Airport resulting from aircraft
using a procedure known as the Gap Departure,
Fly Quiet assigns scores based on aircraft
altitudes recorded along the departure route.
Scores are assessed at specified points or gates
set approximately one mile apart, with the
aircraft at a higher altitude receiving higher
scores, since “higher is quieter”.
f Foster City arrival rating
In an effort to further reduce nighttime noise in
neighboring communities, this rating is
designed to maximize over-bay approaches
between 11:00 p.m. and 6:00 a.m. Airlines
arriving to Runways 28 during these hours are
assessed based on which approach flight path
was used. Over-the-bay approaches are rated
“good”, versus over-the-communities which are
rated “poor”.
Two additional metrics have been developed and
are tracked through the Airport/Community Round-
table Work Program, resulting from concerns raised
by local communities. The Late Night Woodside
Very high frequency Omni-directional Radar (VOR)
report shows the flight number and altitude for
each aircraft that uses the Woodside VOR on
approach to SFO between the hours of 10:30 PM
and 6:30 AM. In the Foster City Shortcut report
shows flight numbers and times for each aircraft
that overfly large areas of Foster City and Redwood
Shores. Both of these reports are available in the
website reports under Noise Abatement.
1 Richard A Coppenbarger, NASA Ames Research Center; Rob W. Mead, The Boeing Company; Douglas N. Sweet, Sensis Corporation, Field Evaluation of the Tailored Arrivals Concept for Datalink-Enabled Continuous Descent Approach. 7th AIAA Aviation Technology, Integration and Operations Conference (ATIO), 18 - 20 September 2007, Belfast, Northern Ireland
Noise abatement
ranking procedures
for flight departures
at SFO.
Turns that penetrate shaded area considered “Marginal.”
Turns west of the shaded area rated “Poor.”
Right turns accomplished east of Highway 101 rated as
“Good Departure.”
Between 0100 and 0600 LT Runways 10L/R are the preferred
departure runways.
Straight out departures are rated based on the altitude at which they pass through
a series of “gates.” The greater the altitude, the better the rating.
Noise Monitoring Station
Gap Departure Quality Gate

76
6 6. Noise Abatement
Recent Accomplishments of the Community RoundtableThe SFO/Community Roundtable is one of the longest estab-
lished community-based airport noise mitigation organizations
in the country, and is an example of neighborhood groups
working cooperatively with the Airport and the aviation industry
to reduce noise impacts.
Celebrating its 30th Anniversary in 2011, the Roundtable’s 45
representatives and alternates are elected officials representing
the City and County of San Francisco and San Mateo County, as
well as advisory members, airline chief pilots, and FAA staff. SFO
Airport Director John L. Martin and his staff support and attend
these monthly meetings, at which public discussion focuses on
airport noise abatement activities.
The Roundtable has been critical in serving as a communication
conduit between the Airport and the surrounding community.
Recent discussion items originating in the Roundtable have
resulted in the following activities that have strengthened the
SFO noise abatement program:
f Raising of minimum recommended aircraft altitude on arrival
procedures (and thereby decreasing noise exposure)
f Making Website improvements and developing of electronic
noise complaint forms
f Providing additional portable and solar-powered noise
monitors
The SFO/Community Roundtable celebrated
its 30th Anniversary in 2011 with cake and
acknowledgements of the group’s important
achievements in the past 30 years.
San Francisco Airport/Community Roundtable www.sforoundtable.org
For more information on the San Francisco Airport/Community Roundtable, please
see http://www.sforoundtable.org

77

The Airport’s water
conservation efforts aid
in conserving existing
freshwater supplies
from the Sierra Nevada
Mountains, an
important freshwater
resource for millions
of Californians.

79
Policy
SFO shall minimize potable water use by deploying water efficient fixtures and other facilities and shall contribute to
improving water quality in the lower San Francisco Bay through state-of-the-art wastewater treatment and enhanced
stormwater management.
Objectives
f Maximize water conservation and minimize water use and waste.
f Strive to expand the use of the treated wastewater for landscaping irrigation and gray water uses,
thereby reducing the demand for potable water.
f Enhance the management of stormwater runoff and non-stormwater discharges to the Bay.
f Discharge treated wastewater that meets or exceeds regulatory standards.
The Airport has implemented a number of water use efficiency measures to help conserve
the existing freshwater supplies from the Sierra Nevada Mountains. The water efficiency
measures also help to minimize wastewater generation, reduce energy consumption
for water heating and cooling, promote habitat protection, and result in cost savings.
In addition, state-of-the-art wastewater treatment and proactive voluntary measures
to capture and treat the “first flush” of stormwater runoff at the Airport contribute
to the enhancement of water quality in San Francisco Bay. Both water conservation
initiatives and water quality protection programs at SFO are discussed in this chapter.
7. Water Conservation and Water Quality Enhancement

80
7 7. Water Conservation and Water Quality Enhancement
Water consumption per SFO passenger has declined steadily in recent years. In 2010, per passenger use was at 12 gallons, showing a 28% decline since 2004.
Annual Water Use and Water Use per PassengerAn
nual
Wat
er U
se (m
illion
s of g
allon
s)
Wat
er U
se pe
r Pas
seng
er (g
allon
s/pas
seng
er)
0
100
200
300
400
500
600
0
2
4
6
8
10
12
14
16
18
20
201020092008200720062005200420032002
Annual Water Use Water Use per Passenger
The Airport has achieved water use
efficiencies by installing low-flow and
sensor-operated fixtures in restrooms,
such as the one shown above, located in
SFO’s newly renovated Terminal 2.
SFO uses treated wastewater for the irrigation of all
landscaping at the Sanitary and Industrial Wastewater
treatment plants, which has contributed to a reduction in
the Airport’s overall water use.

81
What Have We Accomplished?
Water Conservation
In recent years, the Airport has undertaken an
aggressive water conservation program, resulting in
a steady decline in total and per passenger water
use. In FY 2010, SFO consumed 459 million gallons
of water, showing a 14% reduction from 533 million
gallons consumed in 2004.
The decline in water use can be attributed to the
following measures SFO has implemented and
expanded over time to conserve water and
enhance efficiency:
f Installation of low flow restroom fixtures in all
new buildings
f Installation of sensor-operated fixtures in public
restrooms
f Elimination of unnecessary hydrant flushing
f Identification and replacement of aging/leaking
water distribution pipes
The Airport is also planning to reuse treated effluent
from the sanitary wastewater treatment plant for
gray water use at Terminal 2 and in future new and
renovated buildings, where possible. The Terminal 2
reuse program is expected to further reduce potable
water usage by over one million gallons per year. The
Airport anticipates this system will be operational
by 2015.
Wastewater Treatment
In FY 2006, SFO pumped an average of 640,000
gallons per day of treated sanitary wastewater and
630,000 gallons per day of treated industrial waste-
water to the North Bayside System Unit for
discharge into lower San Francisco Bay through a
joint deep water outfall. In FY 2010, an average of
540,000 and 610,000 gallons per day of treated sani-
tary wastewater and treated industrial wastewater
were discharged into the Bay, respectively.
The generated wastewaters were treated in the
Airport’s sanitary and industrial wastewater
Volumes of sanitary and industrial wastewater vary from year to year, and are not within Airport control. In FY 2010, SFO treated an average of 540,000 and 610,000 gallons per day of sanitary wastewater and industrial wastewater, respectively.
Annual Average Daily Wastewater Flows at SFO Treatment Plants
0.0
0.1
0.2
0.3
0.4
0.5
0.6
0.7
Industrial Wastewater Treatment Plant
Sanitary Waste Treatment Plant
FY 2010FY 2009FY 2008FY 2007FY 2006Aver
age D
aily
Was
tewa
ter F
low
(milli
ons g
allon
s per
day)

82
7 7. Water Conservation and Water Quality Enhancement
treatment plants and the discharges met or
exceeded the effluent water quality standards
established in the National Pollutant Discharge
Elimination System (NPDES)Permits issued for the
two plants by the San Francisco Bay Area Regional
Water Quality Control Board.
SFO’s sanitary wastewater treatment plant, named
the Mel Leong Treatment Plant, provides secondary
treatment for sanitary wastewater from the terminal
buildings, aircraft blue waters, aircraft hangars,
restaurants, shops, and other Airport facilities. In 2005,
the Airport completed the construction of a new
$37 million state-of-the-art Sequential Batch Reactor
(SBR) treatment unit and other upgrades to the Mel
Leong Treatment Plant. The plant has a design treat-
ment capacity of 2.2 million gallons per day (mgd).
The Airport’s Industrial Wastewater Treatment Plant
(IWTP) treats wastewater from industrial sources at
the Airport as well as the first flush of stormwater
runoff collected in the stormwater detention basins
from developed areas of the Airport. The dry
weather design capacity of the IWTP is 1.2 mgd and
the wet weather design capacity is 1.7 mgd. The
Airport is currently planning to upgrade the Indus-
trial Wastewater Treatment Plant. Two options under
consideration are to maintain a separate industrial
wastewater treatment plant or to pre-treat the
industrial wastewater in the existing plant and then
process the flow through the new SBR unit at the
sanitary wastewater treatment plant.
The Airport is meeting the treatment goals for both
wastewater treatment plants by managing these
plants at maximum attainable efficiency for the
treatment technologies used in these facilities.
Stormwater Runoff Management
The first flush of stormwater runoff from terminals,
taxiways, tarmacs, and aircraft and vehicle parking
areas, as well as most of the landside areas is
diverted to four detention ponds with a combined
capacity of 8.6 million gallons. The runoff collected
SFO’s SWTP is
named after Mel Leong,
who worked at the
Airport for 46 years,
was the first head of the
Environmental Control
Section at SFO and
oversaw the construction
of the Airport’s first
SWTP in 1970 and the
first IWTP in 1980.
Mel Leong’s dedication
to environmental
protection stands as a
symbol of SFO’s
commitment to the
environment.

83
in these ponds is treated in the IWTP before being
discharged to the Bay. Any excess runoff generated
by continuing or consecutive storm events is
discharged directly to the Bay. A significant portion
of annual stormwater runoff from developed areas
of the Airport is thus captured for treatment. Storm-
water runoff from other parts of the Airport flows
into bioswales (grassy channels) before being
discharged to the Bay or to wetland areas.
Stormwater Runoff Pollution Prevention
The Airport has prepared a Stormwater Pollution
Prevention Plan (SWPPP) in accordance with the
NPDES Permit requirements for industrial and
construction activities. In addition to fulfilling its
permit requirements, the Airport proactively
implements stormwater runoff treatment measures
on a voluntary basis to enhance the water quality
of the Bay.
Stormwater Pollution Prevention Plan (SWPPP)
For all Airport and tenant construction projects, a
SWPPP must be submitted during the permitting
process. These SWPPPs are reviewed for complete-
ness by the Stormwater Pollution Prevention (SWPP)
staff, and revisions to the plans are requested as
appropriate. Construction activities are regularly
monitored by SWPP staff to ensure that Best
Management Practices (BMPs) are employed for the
prevention of stormwater pollution at each site. The
industrial elements of the SWPPP cover all non-
construction activities at the Airport and provide
BMPs for preventing stormwater pollution at each
site. The BMPs include general maintenance,
hazardous materials storage practices, clean-up of
minor leaks and spills of petroleum products or
other chemicals, street sweeping, runway surface
scrubbing, etc. The SWPP staff conducts routine
inspections of all Airport facilities to ensure compli-
ance with BMPs. Citations and warning letters are
issued by the staff if any deficiencies in the BMPs are
observed at a site. The site is then revisited to ensure
that corrective measures have been implemented.
National Pollutant Discharge Elimination System
(NPDES) Permit
The NPDES permit for the Industrial Wastewater
Treatment Plant includes specific provisions for
visual observation of all stormwater outfalls during
storm events and during dry weather conditions.
Sampling and analysis of stormwater discharges at
each outfall is also required during two major storm
events in each wet season.
SFO constructed
grassy channels, or
“bioswales”, to capture
and treat stormwater
runoff from the main
Airport terminal access
roads and adjoining
areas before it flows into
the nearby wetland areas.
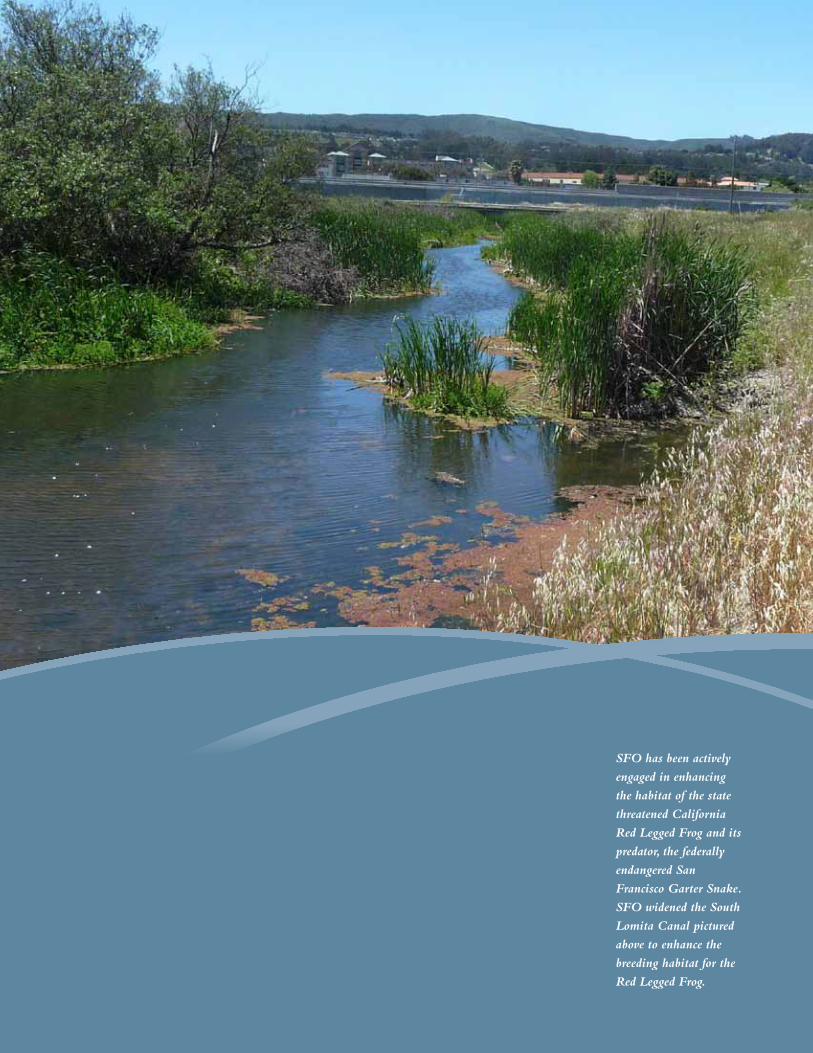
SFO has been actively
engaged in enhancing
the habitat of the state
threatened California
Red Legged Frog and its
predator, the federally
endangered San
Francisco Garter Snake.
SFO widened the South
Lomita Canal pictured
above to enhance the
breeding habitat for the
Red Legged Frog.

85
Policy
SFO shall work in partnership with local, State, and Federal agencies to protect environmentally sensitive habitat on
Airport property and on Airport land, while ensuring the safe operation of the Airport.
Objectives
f Preserve existing wetlands’ biological resources at the Airport.
f Protect and restore viable existing remnant natural ecosystems on Airport property.
f Protect and manage federal and state endangered and threatened species on Airport property.
SFO aims to preserve and enhance local natural resources in its daily operations and
when planning new projects. The Airport is always looking to explore opportunities for
improving environmentally sensitive habitats and managing wildlife while maintaining
airport safety. Natural resources on SFO property include wetlands, uplands, Bay Water
and tidal marshes, which provide habitat for a wide variety of vegetative communities and
terrestrial and aquatic wildlife. Wildlife populations in the area include the endangered
San Francisco Garter Snake and the threatened California Red-Legged Frog.
Even in more developed portions of the Airport, SFO provides habitat and contributes
to plant and wildlife biodiversity around the airport through its landscaping program.
Thoughtful landscaping has also resulted in GHG emission reduction at the Airport
due to carbon sequestration by various species of trees planted at the Airport. This
chapter describes SFO’s efforts to preserve and enhance local natural resources.
8. Natural Resources Management
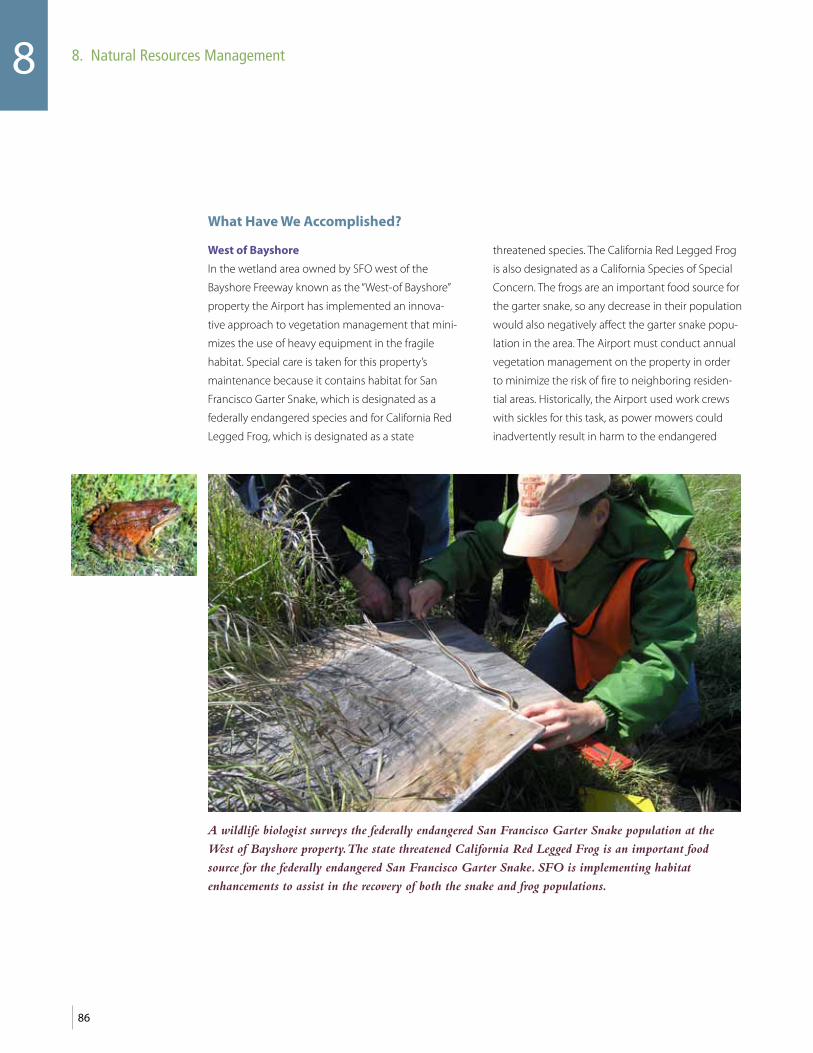
86
8 8. Natural Resources Management
What Have We Accomplished?
West of Bayshore
In the wetland area owned by SFO west of the
Bayshore Freeway known as the “West-of Bayshore”
property the Airport has implemented an innova-
tive approach to vegetation management that mini-
mizes the use of heavy equipment in the fragile
habitat. Special care is taken for this property’s
maintenance because it contains habitat for San
Francisco Garter Snake, which is designated as a
federally endangered species and for California Red
Legged Frog, which is designated as a state
threatened species. The California Red Legged Frog
is also designated as a California Species of Special
Concern. The frogs are an important food source for
the garter snake, so any decrease in their population
would also negatively affect the garter snake popu-
lation in the area. The Airport must conduct annual
vegetation management on the property in order
to minimize the risk of fire to neighboring residen-
tial areas. Historically, the Airport used work crews
with sickles for this task, as power mowers could
inadvertently result in harm to the endangered
A wildlife biologist surveys the federally endangered San Francisco Garter Snake population at the
West of Bayshore property. The state threatened California Red Legged Frog is an important food
source for the federally endangered San Francisco Garter Snake. SFO is implementing habitat
enhancements to assist in the recovery of both the snake and frog populations.

87
snakes. Lack of standing water (the area contains
seasonal wetlands) and disturbance related to flood
control activities also contribute to creating less-
than-ideal habitat conditions for both species1. The
population of the garter snake had decreased to the
extent that SFO, in cooperation with the U.S. Fish
and Wildlife Service and the California Department
of Fish and Game, recently developed an action
plan that would assist in the population’s recovery.
Activities prescribed in the plan aim to benefit both
the garter snakes and frogs. Implementation of the
Recovery Action Plan has been ongoing since 2007
and is divided into several phases. Currently in
the first phase, activities are focused on habitat
enhancements of two canals and vegetation
removal activities. Recovery actions planned in this
phase seek to achieve a balance between habitat
restoration and safety for nearby neighborhoods.
Specific activities include:
f South Lomita Canal. Activities in the canal
include the creation of four channel openings
along South Lomita Canal, widening the channel
in some areas, and vegetation removal in order
to restore open water conditions.
f Cupid Row Canal. Activities include vegetation
management and canal widening in order to
provide open water conditions as well as the
installation of a sediment trap at the canal’s
upstream end.
f Other property-wide enhancements. In
addition to the canals, the 7th Avenue ditch will
be enhanced using similar techniques such as
vegetation removal, and widening the ditch to
increase frog breeding habitat and open water
storage.
[TOP]
Workers lay down jute netting alongside a newly widened canal in order to prepare for the application of hydroseed.
A seasonal pond that was deepened to encourage frog breeding on Airport property.
[BOTTOM]
BART built this pond as on-site mitigation for the SFO-BART Extension project.

88
8 8. Natural Resources Management
Use of Goats
In 2006, SFO introduced the use of goats for vegeta-
tion management at the Airport. Goats are effective
in removing such weeds and vegetation as yellow
star thistle, coyote brush, Scotch broom, and Hima-
layan Blackberry bush. The herd used by the Airport,
which consists of about 300 animals, can clear
approximately 4 acres of brush in two weeks,
depending on the type of vegetation. The goats are
utilized on the airport to clear overgrown and unde-
sirable invasive vegetation with minimal hazard to
the endangered San Francisco Garter Snake.
Wildlife Hazard Management
Airports have to manage their facilities to discourage
the use of their property as habitat by species that
could pose a hazard to safe aircraft operation, such
as bird strikes. However, wildlife hazard management
can also include activities such as grass management
(as some birds prefer to feed and breed in grassy
habitats) and deer-proof fence installation (to
prevent deer from encroaching on airport property),
or wildlife trapping and removal activities.
The purpose of the Wildlife Hazard
Management Plan and the Wildlife Hazard
Assessment are to assist the Airport in
developing an integrative and adaptive manage-
ment program to effectively reduce wildlife/
aircraft collisions by documenting baseline
wildlife and habitat data that informs vegetation
and water management techniques, and other
control measures implemented by the Airport.
A herd of goats is
brought onto the
Airport to graze
undesirable vegetation
in a critical habitat
area. Goats provide an
efficient and minimally
invasive method to clear
brush.
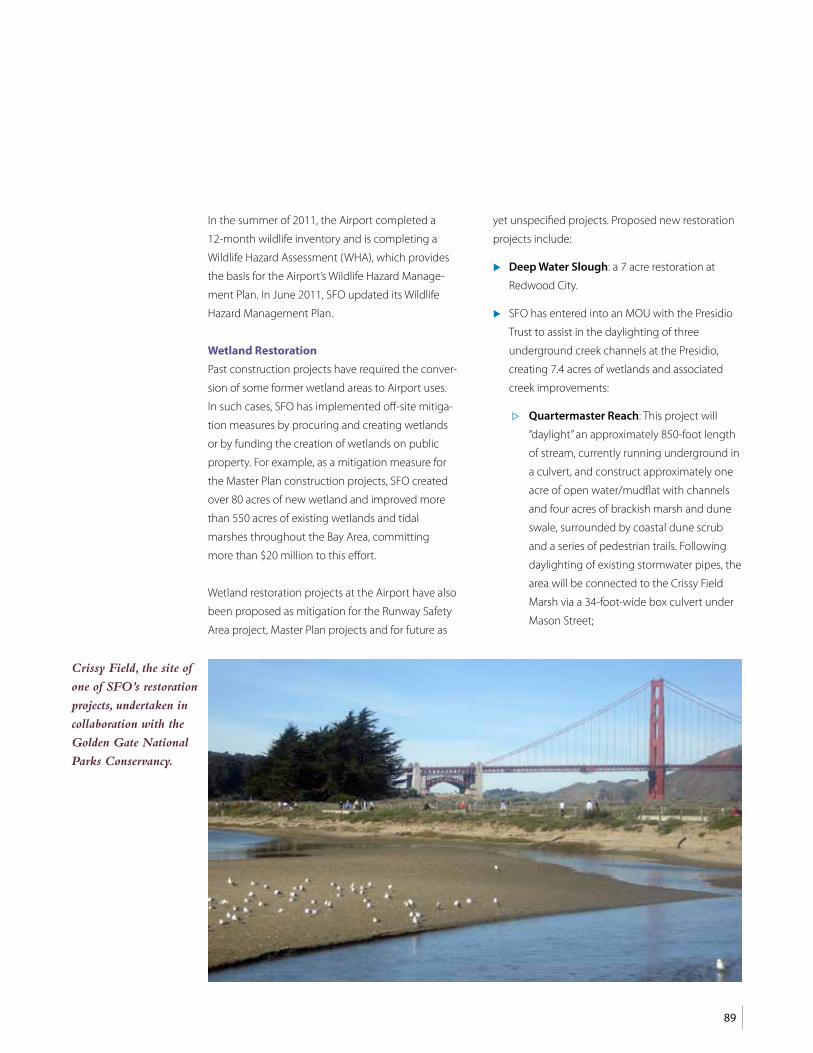
89
In the summer of 2011, the Airport completed a
12-month wildlife inventory and is completing a
Wildlife Hazard Assessment (WHA), which provides
the basis for the Airport’s Wildlife Hazard Manage-
ment Plan. In June 2011, SFO updated its Wildlife
Hazard Management Plan.
Wetland Restoration
Past construction projects have required the conver-
sion of some former wetland areas to Airport uses.
In such cases, SFO has implemented off-site mitiga-
tion measures by procuring and creating wetlands
or by funding the creation of wetlands on public
property. For example, as a mitigation measure for
the Master Plan construction projects, SFO created
over 80 acres of new wetland and improved more
than 550 acres of existing wetlands and tidal
marshes throughout the Bay Area, committing
more than $20 million to this effort.
Wetland restoration projects at the Airport have also
been proposed as mitigation for the Runway Safety
Area project, Master Plan projects and for future as
yet unspecified projects. Proposed new restoration
projects include:
f Deep Water Slough: a 7 acre restoration at
Redwood City.
f SFO has entered into an MOU with the Presidio
Trust to assist in the daylighting of three
underground creek channels at the Presidio,
creating 7.4 acres of wetlands and associated
creek improvements:
F Quartermaster Reach: This project will
“daylight” an approximately 850-foot length
of stream, currently running underground in
a culvert, and construct approximately one
acre of open water/mudflat with channels
and four acres of brackish marsh and dune
swale, surrounded by coastal dune scrub
and a series of pedestrian trails. Following
daylighting of existing stormwater pipes, the
area will be connected to the Crissy Field
Marsh via a 34-foot-wide box culvert under
Mason Street;
Crissy Field, the site of
one of SFO’s restoration
projects, undertaken in
collaboration with the
Golden Gate National
Parks Conservancy.

90
8 8. Natural Resources Management
F YMCA Reach: The project will consist of
approximately 650- foot length of new
meandering stream channel within a two
acre area of braided network of freshwater
marsh, riparian scrub, and willow woodland
habitat. The 520 feet of daylighted creek
restoration is located immediately upstream
of the Tennessee Hollow Creek’s restored
stream and will help to extend a wildlife
corridor through this part of the Presidio.
F East Arm of Mountain Lake: The project
will restore approximately 0.4 acres of existing
freshwater marsh, and create approximately
half an acre of seasonal freshwater marsh
with riparian vegetation. The project is part
of a larger multi-phased restoration effort for
Mountain Lake which started in 2001.
Other wetland mitigation projects undertaken by
SFO in the past include:
f Restoration of Mountain Lake Park in
partnership with the San Francisco Department
of Recreation and Parks and the Golden Gate
National Recreation Area.
f Crissy Field Restoration: Together with the
Golden Gate National Parks Conservancy, SFO
created 18 acres of tidal marsh at Crissy Field at
the Presidio.
f The India Basin Hunters Point Recreation
Project restored up to 3.4 acres of tidal marsh.
f At the Oliver Brothers Salt Ponds, SFO and the
Hayward Area Recreation and Park District
restored and enhanced 324 acres of wetlands at
a cost of more than $1.3 million.
f In Palo Alto Harbor Point, SFO worked with the
City to restore 7.2 acres of tidal marsh.
f At Outer Bair Island, SFO and the California
Department of Fish and Game created 42 acres
of wetlands and enhanced 140 acres of existing
wetlands.
f Yosemite Slough in the Hunters Point area in
San Francisco: SFO is creating 12 acres of new
wetlands in conjunction with the California
Department of Parks and Recreation and the
California State Parks Foundation. This project
started construction in October 2011.
f Hunters Point, Parcel E: SFO has provided
funding to ArcEcology to prepare environmental
studies for a proposed Stormwater Wetland
Open Space project in Hunters Point.
Carbon Sequestration
Over the past ten years, SFO has developed approxi-
mately 50 acres of landscaping around the Airport.
In total, the Airport has planted 2,020 trees of over
15 different species, including sequoia, sycamore,
and poplar. Each tree sequesters carbon dioxide in
its biomass over its lifespan. SFO staff calculated the
annual rate of carbon sequestration for each major
tree species planted using the U.S. Forest Service’s
Carbon Sequestration Model. SFO estimates that
the new tree plantings sequester carbon dioxide at
a rate of approximately 121 metric tons per year.
Once the carbon dioxide is sequestered, it would
not be released back into the environment because
SFO’s management plan calls for the long term
maintenance of the trees, and in the case a tree
must be removed, SFO would salvage its wood, and
plant a new one.
1 LSA Associates, Recovery Action Plan for the San Francisco Garter Snake, West-of-Bayshore Property, San Francisco International Airport. San Mateo County, California. April 2008.

91
Large poplar trees line a parking garage at the
Airport. Over the past 10 years, SFO has planted
2,020 trees, which are able to sequester
approximately 121 metric tons of CO2 per year.

The Zanker Disposal
and Recycling “Z-Best
Composting Facility”,
located in Gilroy, CA,
composts SFO’s food
and other organic waste.
Photo courtesy of Zanker Disposal and Recycling

93
SFO Policy
SFO shall minimize the generation of solid waste from operations and shall recycle the collected waste products to
the maximum extent practicable.
SFO shall strive to reduce the use of hazardous materials, promote their reduced usage with the airlines and tenants,
and seek to improve overall environmental quality through cleanup and restoration efforts focused on soil and
groundwater contamination caused by accidental spills or leaks of fuel products or other chemicals.
Objectives
f Minimize the generation of solid waste from Airport operations.
f Increase the solid waste recycling rate to 80% by 2015.
f Strive to eliminate or minimize hazardous materials use, hazardous waste generation, and the release of any
hazardous materials to the environment.
f Maintain a record of all hazardous materials used, ensure that adequate training is provided for proper
handling of such materials, and procure non-hazardous materials substitutes, when practicable.
f Seek to manage pests while minimizing the human health and environmental impacts of pesticides use.
SFO has one of the largest recycling and composting programs in San Mateo County.
From the airlines to the terminals, from the construction sites to the reprographics
department, the Airport uses both innovative and proven ways to maximize recycling
of waste products.
SFO’s Hazardous Material and Waste Program is aimed at managing the generation,
storage, and disposal of hazardous material and waste by the Airport and by Airport
tenants. Environmental management efforts include a hazardous material substitution
program; a program for the identification and abatement of asbestos and lead-based
paint; and a program for reducing the use of pesticides, insecticides, and herbicides.
9. Solid and Hazardous Waste Management

94
9 9. Solid and Hazardous Waste Management
What Have We Accomplished?
SFO continues to improve the recycling and waste
minimization operations throughout the Airport.
Notably, SFO has increased the solid waste recycling
rate from 51% in 2002 to an impressive 74% in 2010,
bringing SFO close to achieving the intermediate
goal of recycling 80% of the generated solid waste
by 2015. In addition, SFO continues to recycle
almost all of the generated construction and demo-
lition waste, consistently recycling over 90% of
these wastes.
SFO provides specifically-labeled containers for
bottles and cans, paper, food waste and other
biodegradable materials, and trash around the
Airport terminals for use by passengers, concession-
aires, and other tenants. The waste material is then
transferred to separate on-site dumpsters and
compactors that are hauled to an off-site processing
facility. All mixed solid waste is sorted by material
type into recyclable or compostable components at
the off-site facility and any residual solid waste is
disposed of at a landfill. A significant portion of the
solid waste collected at the terminals, consisting
mainly of biodegradable materials, is hauled directly
from the Airport to a composting facility.
In addition to minimizing the burden on already
constrained landfills, recycling is also an important
component of SFO’s carbon emissions reduction
program. Because reused material requires less
energy to convert to new products, recycling
reduces CO2 emissions from downstream manufac-
turing operations in comparison with the use of
virgin materials.
The following elements of SFO’s solid waste
management program are described in additional
detail below:
f Solid Waste Reduction
f Composting
f Material Use Reduction
f Waste Separation
f Construction and Demolition Waste Recycling
SFO recycled an impressive 74% of the solid waste generated in 2010. The recycled materials consisted primarily of food and other compostable materials, paper, and cardboard.
Estimated Composition of Airport Solid Waste (2010)
Food/Compostable Materials
Refuse (land�lled)
Cardboard
Paper
Wastewater Treatment Sludge
Metal, Glass, Plastic
Wood
37%
26%
13%
11%
7%4%
1%

95
Airport Solid Waste Recycling and Composting
In 2010, about 9,928 tons of solid waste was
generated at SFO, of which 7,307 tons or 74% was
recycled. SFO’s recycled solid waste is composed
primarily of food/compostable materials (37%),
cardboard (13%), and paper (11%), as shown on the
adjacent pie chart.
The solid waste recycling rate at SFO has increased
rapidly since 2007, as shown in the above graph.
This increase in SFO’s recycling rate can be attrib-
uted to improved on- and off-site sorting of waste,
as well as the success of SFO’s comprehensive
composting program.
Composting
SFO has been able to successfully transform a 2006
pilot food waste separation program into an
ongoing large-scale composting program.
Currently, food waste along with biodegradable
materials, landscaping trimmings, and wastewater
treatment sludge is transported to off-site
composting facilities. SFO also requires the use of
biodegradable tableware, plates, containers, etc. by
food vendors in all new leases and lease renewals.
This measure enables the composting of 100% of
the waste generated at SFO’s food concessionaires.
In 2010, SFO composted 3,623 tons of food and
biodegradable waste, or 37% of SFO’s total annual
waste. The success of the Airport’s composting
program has significantly contributed to the increase
in the Airport’s overall solid waste recycling rate.
Wastewater Treatment Plant Sludge Reduction
and Recycling
SFO has improved the management of sludge
generated at the two treatment plants in order to
minimize the volume and weight of the sludge
transported to composting facilities or disposed of
in landfills. For this purpose, the Airport dewaters
the anaerobically digested sludge on sand beds and
uses a filter press for dewatering the IWTP sludge. In
2010, 732 tons of sludge were dewatered and deliv-
ered to a composting facility.
Historical Airport Solid Waste Recycling Rate (2002-2010)
SFO’s ambitious recycling program successfully diverted 74% of airport solid waste from landfills, up from 51% in 2002.
Recy
cling
Rat
e
50
60
70
80
201020092008200720062005200420032002

96
9 9. Solid and Hazardous Waste Management
Material Use Reduction
Although recycling is integral to minimizing the
waste sent to landfills, reducing the waste genera-
tion rate is equally important. SFO has implemented
a successful resource conservation program that
has helped reduce the airport’s overall generation of
solid waste by 7% since its peak in 2007, as indicated
on the adjacent graph. SFO’s resource conservation
program seeks to educate, encourage, and persuade
Airport staff, tenants, and the general public to
generate less waste at the Airport. These initiatives
address primarily the use of office paper, plastic
bottles, and paper towels and are described below.
Office Paper Use Reduction
SFO staff has developed a paper use reduction
program, pursuant to the Mayor’s Executive Directive.
The program has the following elements:
f Paper Allocation
SFO assigns a paper allocation to each Division
at 80% of the previous year’s consumption level
and requires the submittal of a special request if
the assigned allocation is prematurely exhausted.
f Double-Sided Printing
SFO has programmed all printers and copiers to
produce double-sided prints or copies and has
posted signs at all copying machines
encouraging users to save paper and avoid
unnecessary copying and printing.
f Electronic Document Transfer
SFO encourages all staff to transmit documents
electronically, wherever possible.
Paper Towel Use Reduction
SFO has experimented with the use of electric hand
dryers in the Airport terminal restrooms. The results
of the pilot program have been promising and plans
are being made for widespread use of these hand
dryers throughout the Airport. The use of electricity
by the dryers is mitigated by the benefits derived
from saving paper towels. In terminal restrooms
that still use paper towels, SFO has posted signs on
dispensers encouraging users to “Please conserve
natural resources. Take only what you really need.”
Total Annual Solid Waste Generation vs. Annual Passenger Levels at SFO (2002-2010)
In recent years, SFO has reduced its overall generation of waste, despite increased numbers of passengers traveling through the Airport.
Solid
Was
te (t
ons)
Pass
enge
r Lev
els
0
2,000
4,000
6,000
8,000
10,000
12,000
0
5,000,000
10,000,000
15,000,000
20,000,000
25,000,000
30,000,000
35,000,000
40,000,000
201020092008200720062005200420032002
Solid Waste Passenger Levels
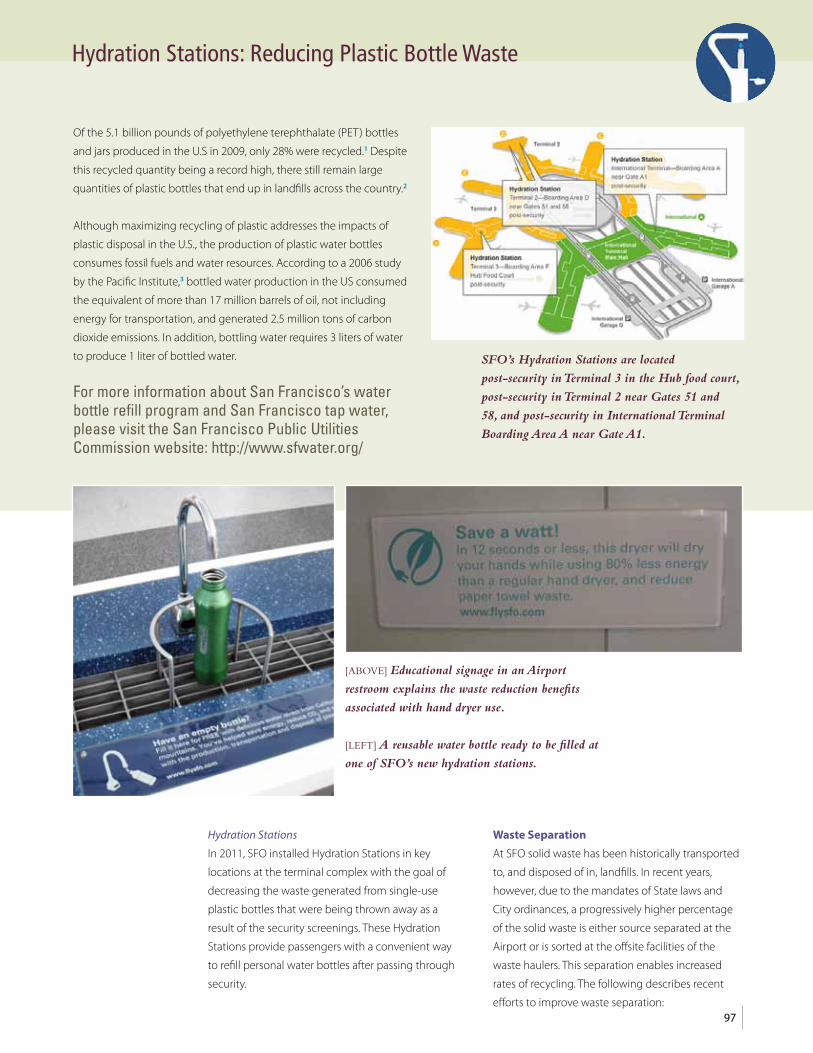
Hydration Stations: Reducing Plastic Bottle Waste
Of the 5.1 billion pounds of polyethylene terephthalate (PET) bottles
and jars produced in the U.S in 2009, only 28% were recycled.1 Despite
this recycled quantity being a record high, there still remain large
quantities of plastic bottles that end up in landfills across the country.2
Although maximizing recycling of plastic addresses the impacts of
plastic disposal in the U.S., the production of plastic water bottles
consumes fossil fuels and water resources. According to a 2006 study
by the Pacific Institute,3 bottled water production in the US consumed
the equivalent of more than 17 million barrels of oil, not including
energy for transportation, and generated 2.5 million tons of carbon
dioxide emissions. In addition, bottling water requires 3 liters of water
to produce 1 liter of bottled water.
For more information about San Francisco’s water bottle refill program and San Francisco tap water, please visit the San Francisco Public Utilities Commission website: http://www.sfwater.org/
SFO’s Hydration Stations are located
post-security in Terminal 3 in the Hub food court,
post-security in Terminal 2 near Gates 51 and
58, and post-security in International Terminal
Boarding Area A near Gate A1.
97
Hydration Stations
In 2011, SFO installed Hydration Stations in key
locations at the terminal complex with the goal of
decreasing the waste generated from single-use
plastic bottles that were being thrown away as a
result of the security screenings. These Hydration
Stations provide passengers with a convenient way
to refill personal water bottles after passing through
security.
Waste Separation
At SFO solid waste has been historically transported
to, and disposed of in, landfills. In recent years,
however, due to the mandates of State laws and
City ordinances, a progressively higher percentage
of the solid waste is either source separated at the
Airport or is sorted at the offsite facilities of the
waste haulers. This separation enables increased
rates of recycling. The following describes recent
efforts to improve waste separation:
[ABOVE] Educational signage in an Airport
restroom explains the waste reduction benefits
associated with hand dryer use.
[LEFT] A reusable water bottle ready to be filled at
one of SFO’s new hydration stations.

98
9 9. Solid and Hazardous Waste Management
f Enhanced On-Site Source Separation
In FY 2010 approximately 19% of the solid waste
generated at the Airport was separated at the
source for recycling and was transported directly
to the recycling facilities. During this period SFO
deployed additional solid waste containers, in
sets of three, throughout the Airport for depositing:
F Paper,
F Bottles & Cans, and
F General Trash.
This procedure is employed in all of the terminals
and facilitates source separation of the waste by the
general public and SFO employees. Additional dedi-
cated bins have also been deployed for temporary
storage of the different waste types. These actions
have contributed to SFO’s increased source separa-
tion rate, reaching 21% in the 4th quarter of 2010.
f Improved Off-Site Separation
In FY 2010, SFO’s contractor achieved a recycling
rate of 51% for mixed solid waste transported off
the Airport. This value represents the average
rate of recycling for the combined operation of
South San Francisco Scavenger Company
(SSFSC), including composting operations. SSFSC
has continued to improve the offsite recycling
rate and in the 4th quarter of 2010 and achieved
a recycling rate of 54%.
Construction and Demolition Waste Recycling
The City’s Policy calls for recycling a minimum of
65% of non-hazardous construction and demolition
waste generated at City construction projects. SFO
maintains a goal to recycle at least 75% of the waste
generated at Airport’s construction and demolition
projects. SFO consistently surpasses this goal,
achieving construction and demolition waste
recycling rates above 90%.
The Airport stores source separated solid waste
on-site before being transported to an offsite
composting or processing facility.
Workers at the South San Francisco Scavenger Company recycling facility
sort incoming mixed solid waste. In 2010, the facility staff recycled 51% of
mixed solid waste and processed 19% of source separated recyclable waste
transported off the Airport.
Photo courtesy of South San Francisco Scavenger Company

99
Hazardous Material and Waste Management
SFO’s Hazardous Material and Waste Management
Programs address the generation, storage, and
disposal of hazardous material and waste generated
by both the Airport and Airport tenants. Hazardous
substances generally consist of materials with chem-
ical and physical properties that may pose a hazard
to human health and/or the environment when
improperly handled, stored, disposed, or otherwise
managed. The adjacent table shows the breakdown of
hazardous waste that was disposed of at SFO in 2010.
Hazardous Waste Material Disposal Breakdown (2010)Leaded Paint Chips 200 lbsLead Contaminated Materials 90 lbsCorrosive Solids 270 lbsWaste Flammable Solids 600 lbsContaminated Soil 357 tonsFriable Asbestos 14 cy
Hazardous Materials Management
Hazardous waste generated by the Airport has
declined since 2004 due to decreased remediation
activities. However, all Airport enterprises using
hazardous materials in the course of their routine
activities are still required to prepare a Hazardous
Materials Business Plan for submittal to San Mateo
County. San Mateo County staff performs periodic
inspections of hazardous materials storage, record
keeping, and handling operations to ensure compli-
ance with the County regulations.
The Airport through the City’s Health Department
contractors continues to recycle hazardous waste
such as fluorescent light fixtures, computer moni-
tors, used oil products, paint residues, and other
hazardous materials. Hazardous building materials
such as asbestos containing materials and lead-
based paint generated during various construction
activities are disposed of in permitted landfills. Other
hazardous wastes such as vehicle and general-
purpose batteries are collected for recycling.
Estimated Composition of Airport Construction and Demolition Recycled Materials
Metals
Mixed Construction & Demolition Waste
Concrete
Mixed Paper
Wood
FY 2009Concrete
Mixed Construction & Demolition Waste
Metal, Glass, Plastic
Wood
Other (Aluminum, Plastics, Cardboard)
Drywall
Mixed Paper
FY 2010
The pie charts above show the estimated composition of the airport construction and demolition materials that were recycled in FY 2009 and FY 2010. The composition of this waste depends largely on the type of demolition work that the Airport has undertaken.

100
9 9. Solid and Hazardous Waste Management
Site Remediation
Since 1992, the Airport and its tenants have carried
out an extensive program of site investigation, char-
acterization, and remediation of contaminated soil
and groundwater to protect human health and
safety and to prevent the degradation of environ-
mental resources in and around the Airport. Work
continues in areas of the Airport requiring additional
monitoring, remediation, and/or investigation.
Soil and Groundwater Remediation
In additional to jet fuel, gasoline and diesel fuels are
stored at the Airport in above-ground and under-
ground tanks. Accidental releases, leaks, or spills of
these hazardous materials could pose environ-
mental and/or health and safety risks. SFO continues
to implement a rigorous program for prevention of
soil and groundwater contamination, which
includes installation of state-of-the-art jet fuel
supply pipelines and hydrant fuel pits in the airfield
in order to minimize any risks of leakage. Old fuel
pipelines that were suspected of leakage have been
abandoned and replaced with new pipelines or
tanker truck deliveries. Also, SFO continues to grad-
ually decommission the abandoned fuel pipelines.
Material Substitution Program
The Airport remains an active participant in the San
Francisco Department of the Environment’s Envi-
ronmentally Preferred Purchasing Program, which
seeks to minimize the purchase of products
containing hazardous ingredients, in favor of alter-
nate products that pose less risk to City employees
and the public. Programs for the identification and
abatement of asbestos-containing materials and
lead-based paint, as well as for reducing the usage
of pesticides, insecticides and herbicides have also
been implemented. The Airport promotes the use
of non-hazardous materials, where possible, and
continues to seek environmentally safe solutions as
better technology and products become available.
Demolition work at Terminal 2. Demolished waste is separated on-site and subsequently recycled.
SFO contractors water down piles of debris to minimize dust pollution. In order to minimize waste
and save materials from Terminal 2, demolition was performed selectively, leaving the steel and
concrete shell.
101
Integrated Pest Management (IPM) Program
To comply with the City’s IPM Ordinance, the Airport
Commission adopted an IPM policy and SFO
published its first IPM plan in April 1998. With the
use of alternative, less toxic methods, SFO reduced
the use of pesticides and herbicides by approxi-
mately 82% between 1996 and 2001. While usage
has continued to decrease for landscaped areas,
pesticide use on runways and surrounding areas has
increased. This increase is likely due in part to State
and County regulations requiring the Airport to
treat for West Nile Virus as well as an increase in the
area for which SFO is responsible. The needed
increase in pesticide use, however, continues to be
moderated by the IPM program.
Reprographics Department Sustainability
Practices
The Airport’s Reprographics Department has played
a significant role in reducing the use of reprographics
resources while continuing to serve the needs of the
Airport. Actions taken by this department include:
f Reducing the number of copying machines
Airport-wide.
f Primarily using paper that contains 30%
post-consumer recycled paper.
f Changing the default settings of printers and
copiers to “double-sided” .
f Ensuring all work orders are submitted to
reprographics electronically.
1 Earth911. Facts about Plastic Bottles. http://earth911.com/recycling/plastic/plastic-bottles/facts-about-plastic-bottles/
2 U.S. Environmental Protection Institute, Common Wastes & Materials: Plastics. http://www.epa.gov/osw/conserve/materials/plastics.htm
3 Pacific Institute. Bottled Water and Energy: A Fact Sheet. www.pacinst.org/topics/water_and_sustainability/bottled_water/bottled_water_and_energy.html

An Airport employee
stepping up to SFO’s
“Stair Challenge”,
held in October 2011.
SFO’s Employee Health
and Wellness Program
offers employees a
variety of measures to
improve physical fitness,
nutrition, and overall
health.

103
SFO Policy
The Airport Commission shall establish, implement, and manage an effective health and wellness program.
Objectives
f Be ranked one of the Bay Area’s best employers in SF Business Times’ annual list.
f Integrate health promotion activities into Airport Commission occupational safety and health programs.
f Support the City and County of San Francisco’s commitment to lead the way in worksite-based injury/illness
prevention and health promotion by implementing ‘Shape Up At Work’ strategies, in accordance with
mayoral Executive Directive 05-111.
f Increase employee productivity, improve employee health, and reduce total employee sick time hours.
The Airport Commmission understands that enhancing the health of its employees enables
the Airport to have a healthy business. To promote wellbeing, SFO has established an
award-winning wellness program with the goal of making the Airport a more pleasant
and healthy place to work. Many Airport Commission employees take advantage of
SFO’s wellness program because services are conveniently offered in their offices and
work spaces. Fitness classes, educational tools and information, as well as preventative
health care services such as flu shots and health screening, are provided at the Airport,
making it easy for employees to participate in the program and utilize these services.
10. Employee Wellness

104
10 10. Employee Wellness
The SFO-sponsored “Stair Challenge”
draws employees from across the Airport
organization to challenge themselves
physically in a fun, social environment.
What Have We Accomplished?
SFO Wellness Program
SFO has been actively promoting employee health
and wellness for several years. In 2011, however, the
Airport Director took steps to expand the Airport’s
program and increase employee participation by
designating a Wellness Coordinator and forming a
Wellness Advisory Council to act as a conduit for
feedback from SFO employees. The Wellness
Advisory Council is committed to educating and
encouraging employees to live healthy lifestyles.
SFO’s Health and Wellness program is managed by
the Airport’s Safety and Health division. Twenty
seven “team leaders” from various airport work
divisions assist with program implementation by
coordinating wellness activities.
The elements of the Airport’s Wellness Program
include:
f Employee Fitness
f Preventative Health Care
f Nutrition
f Education
In the past year, the Airport has sponsored an
extensive number of initiatives as part of its Health
and Wellness Program, as described below.

105
Employee Fitness
Fitness and exercise is an important aspect of main-
taining employee health and morale. SFO has spon-
sored the following activities to help employees
maintain physical and mental wellbeing:
f “Stair Challenge”
The Airport sponsored a Stair Challenge event
on October 19, 2011. Utilizing one of the parking
garages at the Airport, employees challenged
themselves to see how many stairs they could
climb in a 30 minute period.
f “Shape Up San Francisco” Walking Challenge
In 2011, 628 airport employees participated in
this 10 week challenge to promoted physical
activity. Each team walked the equivalent of
1,016 miles over 10 weeks, the distance along
the California coast. Pedometers were provided
to employees to keep track of their miles.
f Fitness Classes
Yoga classes are taught by employee volunteers
during lunch, and Zumba classes are offered
during lunch and after work. Stretching and
fitness rooms are also provided for Airfield Safety
and Maintenance staff.
SFO Receives Employee Wellness Awards
SFO is proud to have received two separate awards recognizing the Airport’s proactive program
to improve employee health and wellbeing.
Healthiest Workplace for large Companies in the
greater Bay Area
On September 30, 2011, the San Francisco Business Times, in
conjunction with the Silicon Valley/San Jose Business Journal,
listed SFO as the healthiest workplace for large companies
(500 – 1,999 employees) in the greater Bay Area. In announcing
the award, the Business Times specifically cited the Airport’s
creation of a Wellness Advisory Council and the naming of a
Wellness Coordinator.
Fit Business Award
In November 2007, the California Task Force on Youth and Work-
place Wellness honored SFO, as one of over 80 employers in the
State, for its commitment to employee wellness and promoting a
healthier workplace. The Airport received a Silver trophy at the
Task Force’s 2007 Fit Business Awards ceremony, sponsored by
Kaiser Permanente, in recognition of the Airport’s Health and
Wellness Program. The program featured a 5-year implementation
plan to provide SFO employees nutrition and fitness initiatives at
the Airport. Program initiatives recognized with this award
ranged from providing employees with health information and
training to providing free blood pressure checks.

106
10 10. Employee Wellness
f Plans to develop an Employee Fitness Facility
Scheduled to open in 2012, this employee facility
will be located in the terminal complex and will
include a space for cardio equipment (treadmill,
elliptical, stationary bike) and fitness classes.
Preventative Health Care
SFO works with employees to take steps to prevent
workplace injury or personal illness. These preventa-
tive health care measures include:
f Ongoing ergonomic evaluations– conducted
by Airport Safety and Health staff, these
evaluations are intended to minimize work-
related injury and illness by ensuring proper “fit”
of workplace conditions.
f Medical monitoring program– The Airport’s
Medical Clinic provides free audiograms and
consultations with an occupational medicine
doctor.
f Flu Shots– Each year, the Airport provides
employees free flu shots.
f The Airport Medical Clinic actively participates
in on-site safety fairs and events, offering free
blood pressure checks and cholesterol screenings.
Nutrition
Maintaining a healthy diet is crucial to prevent
illness and improve general wellbeing. SFO encour-
ages positive nutrition choices through the
following initiatives:
f Healthy food alternatives, such as fresh fruit,
provided at Airport Safety Committee and other
safety meetings
f Organic garden outside the Jason Yuen
Engineering building. SFO carpenters and
landscaping staff built the two 4 ft x 6 ft garden
beds, which produce greens, tomatoes, herbs,
sun flowers, as well as lemons, limes, and
tangerines. Members of the Airport’s Salad Club
contribute to the purchase of seeds and the
harvested foods are used as ingredients in the
club’s salads.
f Organic garden at the Belle Air Elementary
School in San Bruno. The SFO Maintenance
Division helped the school construct the school’s
eight 4 ft x 6 ft garden beds. The elementary
school children plant and harvest foods ranging
from artichokes, red onion, strawberries,
zucchini, rosemary, sage, Swiss chard and
pumpkins. The Airport continues to provide
general maintenance support to the garden,
which is located on Airport property.
Organic garden beds outside the Airport Engineering Building (right) and at the Belle Air Elementary
School in San Bruno (left). SFO staff constructed and now help maintain these gardens that provide a
healthful and educational outlet for Belle Air Elementary school children and for SFO staff.

107
In addition to
nutritious vegetables,
SFO employees plant
flowers, such as this
Protea plant, to beautify
their organic garden.
Wellness Education
SFO seeks to inform airport employees about the
measures they could take to improve their own
health. SFO wellness education initiatives include:
f Publication of quarterly health and wellness
electronic newsletters
f Walking and stretching posters distributed
throughout Airport Commission buildings and
posted in employee lunch rooms and other
common spaces
f Airport Safety Policy and Procedures Manual,
which details the components of the Airport’s 5
year Health and Wellness Program
f Stretch break software program and DVD
designed for all Airport Commission employees
f Monthly safety meetings to discuss safety and
wellness topics


109
Appendix: SFO by the Numbers
Chapter 1: SFO Profile
Aircraft Operations Passenger Activity Cargo Activity
Year Operations
2000 429,2222001 387,5942002 351,4532003 334,5152004 353,2312005 352,8712006 359,2012007 379,5002008 387,7102009 379,7512010 387,248
Year Pax Total
2000 41,040,9952001 34,632,4742002 31,456,3422003 29,313,2712004 32,744,1862005 33,394,2252006 33,574,8072007 35,790,7462008 37,402,4452009 37,453,6342010 39,391,234
Year Cargo
2000 869,8392001 636,0052002 589,7302003 573,5232004 562,8752005 590,5562006 594,8572007 562,9332008 493,6282009 408,1022010 426,724
2010 US Airports Ranking by Operations
2010 Passenger Volume and Growth by Continent
Rank Airport 2010 Operations
1 Atlanta, GA (ATL) 950,1192 Chicago, IL (ORD) 882,6173 Dallas, TX (DFW) 652,2584 Denver, CO (DEN) 635,4585 Los Angeles, CA (LAX) 575,8356 Houston, TX (IAH) 531,9837 Charlotte, NC (CLT) 529,1078 Las Vegas, NV (LAS) 505,6049 Philadelphia, PA (PHL) 460,779
10 Detroit, MI (DTW) 452,61611 Phoenix, AZ (PHX) 449,35112 Minneapolis, MN (MSP) 435,58313 New York, NY (EWR) 408,82114 New York, NY (JFK) 404,17415 San Francisco, CA (SFO) 387,24816 Miami, FL (MIA) 376,20817 Washington D.C. (DCA) 371,80118 Boston, MA (BOS) 368,85119 Phoenix, AZ (DVT) 368,74720 New York, NY (LGA) 367,346
Source: FAA Opsnet
Continent Passengers % Change since 2009Asia, India & Middle East 4,200,000 10.40%Europe 2,200,000 -1%Canada 1,300,000 12.2%Mexico/Central & South America 700,000 5.3%Oceania 450,0000 -5.4%U.S. 30,000,000 4.7%

110
A Appendix: SFO by the Numbers
Chapter 3: Climate Change
1990 FY 2008 FY 2009 FY 2010
Gross SFO-controlled GHG Emissions (tonnes) 52,248 41,064 45,047 44,562
Annual GHG Emission Mitigation Level at SFO 0 18,293 39,409 41,816
Annual GHG Emission Offset Level at SFO 0 3,645 2,870 2,326
Annual GHG Emissions and GHG Mitigation/Offset Levels at SFO
SFO Emission Category GHG Emission (Tonnes)
1990 FY 2008 FY 2009 FY 2010
Category 1-SFO-controlled Emissions* 52,248 37,419 42,177 42,236
Category 2-Airlines, Concessionaires, and Airline Support Services Emissions
839,000 688,275 668,037 676,169
Category 3-Optional Emissions 7,127,543 8,340,264 7,937,546 8,195,369*Corresponds to gross SFO-controlled GHG emissions minus GHG emissions offsets from projects implemented by the Airport
Greenhouse Gas Emissions from all Airport-related Activities (Categories 1, 2, and 3)
Breakdown of SFO-controlled GHG Emissions Sources (FY 2010)
Breakdown of GHG Emission Mitigation Measures (FY 2010) (tons)
FY 2010
(Dire
ct Em
ission
s)
Natural Gas Consumption 40%
SFO Fuel Consumption (Vehicle & Shuttle Fleet, Generator)
33%
Fugitive refrigerant gas releases 8%
Wastewater Treatment Facilities 1%
(Indir
ect E
miss
ions) SFO Employee Commuting 10%
Electrical energy consumption 6%
Solid waste disposal 2%
Type of Mitigation Measure FY 2010
PC Air and 400 Hz Power Supply at International Terminal 21,889
Green Car Rental Incentive Program 11,442
Construction and Demolition Waste Recycling 4,545
BART Extension to SFO (SFO's share) 2,076
AirTrain Facility 1,864

111
Chapter 4: Energy
SFO and Tenant Electricity Consumption
SFO and Tenant Natural Gas Consumption
Activity Energy Consumption (MWh)
FY 2008 FY 2009 FY 2010
Subtotal Electricity 338,729 332,078 322,927
General Fleet FY 2010
Gasoline, gallons 50%
CNG, gasoline gallons equivalent (GCE) 27%
Biodiesel, gallons 23%
Shuttle Fleet FY 2010
Gasoline, gallons 0
CNG, gasoline gallons equivalent (GCE) 60%
Biodiesel, gallons 40%
Activity Energy Consumption (therms)
FY 2008 FY 2009 FY 2010
Natural Gas Consumption by SFO and tenants 3,640,573 3,143,872 3,330,555
Fuel Usage of SFO General and Shuttle Fleets

112
A Appendix: SFO by the Numbers
Chapter 5: Air Quality
Historical Air Pollutant Emissions from Stationary Sources at SFO (tons)
Passenger Travel Modes (2011 Survey)
TOG ROG CO NOx SOx PM PM10
2003 3 1.8 10.7 33.6 0.9 1.4 1.3
2004 2.4 1.5 7.4 27.8 0.4 0.7 0.7
2005 2.3 1.5 6.7 23.8 0.4 0.8 0.8
2006 1.9 1.1 7.4 25.7 0.2 0.8 0.8
2007 4 3.1 8.3 25.2 0.2 0.9 0.8
2008 7.5 6 8.9 28.8 0.2 0.9 0.9
Mode of Travel %
Private Vehicle (Parked or Drop Offs) 43%
Door to door van/ hotel shuttle/ charter bus 18%
Taxi/ Limousine 16%
Rental Car 13%
BART 10%Note: Passengers transferring from another flight are not included in the chart above.
Commute Mode % of Employees Miles Travelled GHG Emission, Tonnes/Year
Drive Alone 79.79 6,643,353 2,404
Carpool 10.53 310,741 112
BART/ Bus 8.1 674,410 29
Shuttle/Taxi/Limousine 0.18 14,987 2
Motorcycle/Scooter 0.58 48,291 9
Telecommute 0.13 0 0
Bicycle 0.52 0 0
Total 100 2,557Survey conducted in January 2011
Employee Commuting Travel Modes (2011)
TOG Toxic Organic Gases
SOx Sulfur Oxide
ROG Reactive Organic Gases
PM Particulate Matter
CO Carbon Monoxide
PM10 Particulate Matter less than 10 microns in diameter,
NOx Nitrous Oxide which are the greatest concern to public health.
Source: California Air Resources Board
Facility ID: 1784 http://www.arb.ca.gov/app/emsinv/facinfo/facinfo.php

113
Chapter 6: Noise Abatement
Annual SFO Aircraft Operations vs. Number of Noise Complaints (1999-2010)
Year Operations Complaints
1999 436,659 27,103
2000 437,763 48,051
2001 407,040 43,242
2002 350,133 11,154
2003 335,785 3,555
2004 352,616 5,980
2005 350,508 6,718
2006 357,957 10,179
2007 371,291 7,842
2008 393,714 7,668
2009 378,205 5,481
2010 386,064 8,716

114
A Appendix: SFO by the Numbers
Chapter 7: Water Conservation and Water Quality Enhancement
Annual Water Use and Water Use per Passenger
Annual Water Consumption at SFO (millions of gallons)
Annual Water Use
2002 491.2
2003 470.0
2004 533.2
2005 479.3
2006 480.6
2007 502.7
2008 507.4
2009 475.8
2010 458.5
Total SFO Water Use per Passenger (gallons per passenger)
Annual Water Use per Passenger
2002 15.9
2003 16.3
2004 16.6
2005 14.6
2006 14.9
2007 14.6
2008 14.8
2009 13.9
2010 12
Annual Average Daily Wastewater Flows at SFO Treatment Plants (millions of gallons)
FY 2006 FY 2007 FY 2008 FY 2009 FY 2010
Sanitary Waste Treatment Plant 0.64 0.6 0.59 0.54 0.54
Industrial Wastewater Treatment Plant 0.63 0.48 0.49 0.61 0.613

115
Chapter 9: Solid and Hazardous Waste Management
Estimated Composition of Airport Solid Waste (2010) Hazardous Waste Material Disposal Breakdown (2010)
Historical Airport Solid Waste Recycling Rate (2002-2010)
Tons
Metal, Glass, Plastic 434
Paper 1113
Cardboard 1318
Wood 87
Food/Compostable Materials 3623
Wastewater Treatment Sludge 732
Refuse (landfilled) 2621
Solid Waste 2002 2003 2004 2005 2006 2007 2008 2009 2010
% Diverted From Landfill 51 51 51 52 54 58 62 70 74
Total Annual Solid Waste Generation vs. Annual Passenger Levels at SFO (2002-2010)
Estimated Composition of Airport Construction and Demolition Recycled Materials
Solid Waste 2002 2003 2004 2005 2006 2007 2008 2009 2010
Total Waste (tons) 6,794 5,942 6,846 9,000 9,394 10,660 10,637 9,568 9,928
Passenger Levels 31,456,342 29,313,271 32,744,186 33,394,225 33,574,807 35,790,746 37,402,445 37,453,634 39,391,234
Waste Type (tons) FY 2009 FY 2010
Metals 2370 639
Wood 17 187
Mixed Paper 74 32
Concrete 336 6839
Mixed Construction & Demolition Waste 1756 2470
Drywall 0 72
Other (Aluminum, Plastics, Cardboard) 0 7
Leaded Paint Chips 200 lbsLead Contaminated Materials 90 lbsCorrosive Solids 270 lbsWaste Flammable Solids 600 lbsContaminated Soil 357 tonsFriable Asbestos 14 cy
116
A

SFO “Firsts”
LEED Gold Certification of Terminal 2Design and construction of the renovated Terminal 2 to the
U.S. Green Building Council’s Leadership in Energy and Envi-
ronmental Design (LEED) green building standards. Terminal
2 is the first airport terminal in the U.S. to achieve the Gold
level of LEED certification.
“Green” Data CenterSFO is designing and building the first of its kind highly
energy efficient Data Center Building at the Airport. The data
center, a model for innovation and efficiency, will utilize the
cool ambient air of the San Francisco Bay Area as the primary
source for conditioning the air in the facility, thereby avoiding
the use of energy-intensive traditional cooling units.
SFO Hydrogen and Electric Battery Swap Fueling Complex SFO is planning to lease property for vehicle refueling facili-
ties that will provide hydrogen fuel and fast electric vehicle
battery swap services. The facility is set to open in 2012 and
will be the first public access refueling complex offering
these services at a North American airport.
Real-Time Online Flight Tracking in “3D”In 2011, SFO released a powerful new user-controlled online
flight tracking tool, which provides the public with live flight
information for aircraft anywhere in the SFO airspace. This
tool can help users identify aircraft location, altitude, oper-
ator (airline), flight number, and originating/arriving airport
(SFO, San Jose, or Oakland). This 3D flight tracking tool is the
first of its kind to be made publicly available.
Green Car Rental Incentive ProgramSFO was the first airport in the country to incentivize
customers to rent low emission, fuel efficient vehicles.
Established in 2009, the three-year program rewarded
customers who rented “green” high mileage or alternative-
fueled vehicles, such as hybrids, by offering a $15 discount
on their rental. This program also provides financial
incentives to rental car companies to increase the number
of fuel efficient cars (with an EPA rating of 17 or higher) to
15% of their rental vehicle inventory. In FY2010, 25.6 percent
of car rental transactions were for “green” vehicles, saving
more than 1 million gallons of gasoline for the passenger
and reducing approximately 11,442 metric tons of GHG
emissions to the atmosphere.

Contact Information:Sam Mehta, Environmental Services ManagerSan Francisco International Airport710 N. McDonnell RoadP. O. Box 8097San Francisco, CA 94128650.821.7841 l FAX 650.821.5383email: [email protected]


