
2017
Santa Clara County
Early Learning Master Plan

The 2017 Santa Clara County Early Learning Master Plan is sponsored by:
Santa Clara County Office of Education
FIRST 5 Santa Clara County
Silicon Valley Community Foundation
Kids in Common
Local Early Education Planning Council of
Santa Clara County
Santa Clara County School Boards
Association
Silicon Valley Council of Non-profits
The Silicon Valley Organization
The Strong Start Initiative Leadership Group
Jon R. Gundry, County Superintendent of Schools Derrick Seaver, Executive Vice President, The Silicon Valley Organization Jolene Smith, Chief Executive Officer, FIRST 5 Santa Clara County Erica Wood, Chief Community Impact Officer, Silicon Valley Community
Foundation Mike Wasserman, Supervisor – District 1, County of Santa Clara Board of
Supervisors
The Santa Clara County Board of Education
Michael Chang, President
Joseph Di Salvo
Darcie Green
Rosemary Kamei, Vice President
Grace H. Mah
Claudia Rossi
Anna Song
Researchers and Authors
Jennifer Anthony, Karen Manship, Susan
Muenchow, Melissa Arellanes, and Linda
Choi
Dr. Mary Ann Dewan and Dr. Matthew
Tinsley

Contents
Letter From the Superintendent ................................................................................................... 2
Vision Statement ............................................................................................................................ 3
Early Learning Master Plan Acknowledgements .......................................................................... 4
Executive Summary ....................................................................................................................... 7
Background and Purpose .......................................................................................................... 7
Progress Since the 2010 ELMP, Current Needs, and Goals to Address Them ..................... 7
Introduction .................................................................................................................................. 15
Organization of the Plan .............................................................................................................. 16
Section A: State of the County Summary: The Status of Early Child Care and Education in
Santa Clara County in 2017 ........................................................................................................ 17
Introduction .......................................................................................................................... 18
Access ................................................................................................................................... 19
Articulation, Alignment, and Data Systems ........................................................................ 35
Facilities ................................................................................................................................ 43
Family Engagement ............................................................................................................. 50
Program Quality .................................................................................................................... 54
Workforce Development ...................................................................................................... 66
Summary and Conclusions From the State of the County Summary ............................... 71
Section B: 2017 Goals and Implementation Plan ..................................................................... 74
Section B: 2017 Goals and Implementation Plan ................................................................. 75
Summary Table of Goals ......................................................................................................... 76
Goals ............................................................................................................................................. 77
Access ................................................................................................................................... 77
Articulation, Alignment, and Data Systems ........................................................................ 84
Facilities ................................................................................................................................ 88
Family Engagement ............................................................................................................. 91
Program Quality .................................................................................................................... 94
Workforce Development ...................................................................................................... 98
References ................................................................................................................................ 103
Appendix .................................................................................................................................... 108

2
Letter From the Superintendent The evidence is clear that providing equitable access to high-quality early care and education (ECE)
is the most effective means of preventing the racial-ethnic and socioeconomic opportunity gaps that
blight the futures of too many young people in our communities. Every year, over 3,000 low-income
children in our county arrive at kindergarten without this vital preparation for school and life, and,
despite the heroic efforts of their teachers and families, they may never catch up.
In 2010, the Santa Clara County Office of Education (SCCOE) launched the first countywide Early
Learning Master Plan (ELMP) with the vision of creating an ECE system that provided every child with
the quality supports they would need to be successful – to the benefit of the child, their family, and
our community. Since its launch, there have been significant improvements to the landscape of ECE
in our county – many of them recommendations from that first ELMP. Following the state’s
successful Race to the Top – Early Learning Challenge grant application, FIRST 5 Santa Clara County
has led the development of our county’s Quality Rating and Improvement System, QUALITY MATTERS
... a STRONG START for kids (QUALITY MATTERS). Santa Clara County’s own State Senator (and now
County Supervisor) Joe Simitian led the creation of the Transitional Kindergarten program, providing
a second year of kindergarten for the youngest enrollees in our public K-12 education system.
Educare of California at Silicon Valley, a national model, high-quality early education and family
support program, has opened, following a five-year development effort in which the SCCOE was a
proud partner. The Strong Start Initiative, supported by the SCCOE and more than 30 other
organizations, agencies, and districts and 150 community members, has come together to educate,
identify, and advocate for local solutions to the needs of our ECE sector and the children and
families it serves. But, despite these changes, the shared vision of the first ELMP has not yet been
met.
This second countywide ELMP serves as a marker of the progress we have made in our community,
and the distance we have to go, toward making that vision a reality. It builds on the progress made in
the last seven years and provides a strategic framework for continuing advances in providing access
to quality programs, articulation between ECE and K-12 education, developing and sustaining
facilities, family engagement, program quality, and workforce development. This plan represents the
culmination of a year of engagement and effort by members of the county’s ECE community and is a
demonstration of their shared commitment, ingenuity, and passion. The goals, milestones, and key
actions describe the steps needed to achieve the goal of providing every child in our community with
the strong start they need and deserve.
I would like to offer my thanks to the Strong Start leadership and coalition, the many community
organizations and individuals who volunteered their time to be part of this tremendous effort, and to
the staff of the SCCOE who made it possible.
Sincerely,
Jon R. Gundry
Santa Clara County Superintendent of Schools
3
Vision Statement
It is the shared vision of the contributors to the 2017 Santa Clara County Early Learning
Master Plan (ELMP) that all children from birth to eight in Santa Clara County will have
equitable and inclusive access to affordable, voluntary, high-quality early care and education
(ECE) services. This vision is for all of our children – children of all ethnicities and
socioeconomic backgrounds, English learners, and children with special needs. Building on
the work of the 2010 ELMP, this plan emphasizes six core principles that will guide the
implementation of its recommendations. The principles are:
• embracing ECE as a developmental continuum from birth to age eight,
• creating equitable and inclusive access to quality ECE opportunities for all children in our
community,
• collaborative implementation by all stakeholders in the ECE sector,
• supporting our existing diverse delivery system,
• fostering innovation as a means to achieve our goals, and
• emphasizing program quality as the key ingredient in achieving the outcomes our children
deserve.
The ELMP is intended to provide a strategic framework that supports and aligns the
stakeholders’ individual and joint efforts to achieve this vision. The plan could not have been
developed, and will not be implemented, without the input and dedication of Santa Clara
County’s stakeholders.

4
Early Learning Master Plan Acknowledgements
The Early Learning Master Plan would not have been possible without the dedicated input
from members of the Planning Group, who met in December 2016 and January 2017, and
the members of the six Workgroups, who each met three times between March and May
2017. The list below includes the names of individuals who helped shape this plan.
American Institutes for Research (AIR) staff facilitated the meetings for the six workgroups
as follows: Jennifer Anthony (Program Quality and Workforce Development); Susan
Muenchow (Access and Facilities); and Karen Manship (Articulation, Alignment, and Data
Systems and Family Engagement).
Access Workgroup
Jeannette Bellerive Community Child Care Council of Santa Clara County
Julie Cates Silicon Valley Social Ventures
Dr. Mary Ann Dewan SCCOE
Antonio Fuentes SCCOE
Angela Garcia Community Child Care Council of Santa Clara
Michael Garcia SCCOE
Ingrid Holguin City of San Jose
Camille Llanes-Fontanilla Somos Mayfair
Meri Maben Silicon Valley Education Foundation
Dr. Bonnie Mace Santa Clara County School Boards Association
Grace Mah Santa Clara County Board of Education
Avo Makdessian Silicon Valley Community Foundation
Scott Moore Kidango
Jenny Niklaus American Leadership Forum
Dominique Pacolba City of San Jose
Articulation, Alignment, and Data Systems Workgroup
Jeannette Bellerive Community Child Care Council of Santa Clara County
Don Bolce SCCOE
Dana Bunnett Kids in Common
Angela Garcia Community Child Care Council of Santa Clara County
Veronica Goei Grail Family Services
Melissa Hong FIRST 5 Santa Clara County
Marcy Lauck SCCOE
Kathy Lincoln Eduvative Thinking
Dr. Jaime Peterson Department of Pediatrics, Stanford University
Buu Thai County of Santa Clara
Christine Thorsteinson Silicon Valley Community Foundation
Melinda Waller Franklin McKinley School District
Ellen Wheeler Mountain View-Whisman School District Board Member

5
Facilities Workgroup
Cathy Boettcher California Young World
Sandy Knight County of Santa Clara
Toby Librande The Health Trust
Dr. Bonnie Mace Santa Clara County School Boards Association
Carol Marcroft Community Care Licensing, California Department of Social
Services
Adolfo Pando SCCOE
Harvey Schloss Congregation Beth Am
Michelle Sioson Hyman Silicon Valley Community Foundation
Kathy Tama Consultant (ECE Program and Facility Expert)
Dr. David Villegas SCCOE
Elizabeth Winograd Low Income Investment Fund
Marie Young Formerly with Low Income Investment Fund
Family Engagement Workgroup
Karen Alden Strong Start Coalition
Nancy Crowe SCCOE
Araceli Delgado-Ortiz City of San Jose
Nora Guerra Oak Grove School District
Hong Hoang International Children Assistance Network
Martin Huici Grail Family Services
Charlene Moore-Tatis FIRST 5 Santa Clara County
Erwin Morton Sixth District PTA
Martha Munoz SCCOE
Hope Nguyen International Children Assistance Network
Kimmy Nguyen WestEd
Betsy Nikolchev Family Engagement Institute
Sapna Shah (Gosalia) WestEd
Pedro Sousa SCCOE
Quyen Vuong International Children Assistance Network
Debra Watkins California Alliance of African American Educators
Jennifer Weeks Santa Clara County Library District

6
Planning Group
Cathy Boettcher California Young World
Don Bolce SCCOE
Laura Demaree FIRST 5 Santa Clara County
Dr. Mary Ann Dewan SCCOE
Larry Drury Go Kids
Nora Guerra Oak Grove School District
Melissa Hong FIRST 5 Santa Clara County
Kelly Peaton The Silicon Valley Organization
Michelle Sioson Hyman Silicon Valley Community Foundation
Jolene Smith FIRST 5 Santa Clara County
Dr. Matthew Tinsley SCCOE
Program Quality Workgroup
Barbara Carmody SCCOE
Nancy Crowe SCCOE
Laura Demaree FIRST 5 Santa Clara County
Meghan Galazzo Bright Horizons
Ilene Hertz WestEd
Jennifer Mayman WestEd
Peggy Pizzo Graduate School of Education, Stanford University
Lisa Rock Palo Alto Community Child Care
Linda Van Mouwerik Sunnyvale School District
Kathy Wahl SCCOE
Jennifer Winters Bing Nursery School, Stanford University
Beth Wise Bing Nursery School, Stanford University
Workforce Development Workgroup
Marian Browning Pacific Oaks College
Linda Cochran SCCOE
Dr. Barbara Malaspina San Jose City College and Gavilan College
Kelly Mercurio Go Kids
Elena Montoya Center for the Study of Childcare Employment, UC Berkeley
Kelly Peaton The Silicon Valley Organization
George Philip WestEd
Peggy Pizzo Graduate School of Education, Stanford University
Sara Reyes Catholic Charities of Santa Clara County
Dr. Emily Slusser Child and Adolescent Development Department, San Jose
State University
Gail Solit Children's Center at Google
Camilla Weiberg Mission College

7
Executive Summary
Background and Purpose
Between 2009 and 2010, the Santa Clara County Office of Education (SCCOE), along with
approximately 100 early care and education (ECE) professionals, child development
advocates, community members, and civic leaders, developed an Early Learning Master
Plan (ELMP) for Santa Clara County, which described the state of the county’s ECE system
across six key areas and outlined goals and metrics to build upon assets, and address
needs, by the year 2017.
In 2016, as the seventh and final year of the 2010 ELMP’s projected goals drew near,
SCCOE sought to analyze the degree to which of the 2010 ELMP goals were achieved,
determine which goals needed to be adjusted to reflect changing circumstances in the
county and state, and, based upon these findings, develop a plan for the next seven years.
This 2017 ELMP presents both a snapshot of the state of ECE in Santa Clara County as of
2017 and a roadmap for the future, with goals, milestones, and actions aimed to address
the needs of children ages birth to eight, their families, and the ECE providers who teach
and care for them. The ELMP addresses strengths and challenges in six major areas of the
early learning system – Access; Articulation, Alignment, and Data Systems; Facilities; Family
Engagement; Program Quality; and Workforce Development.
The 2017 ELMP has two sections. First, the State of the County Summary, presented in
Section A of the plan, provides an update of progress made since the 2010 plan and an
analysis of current needs and efforts to address them. Section B, which presents an
implementation plan for the next seven years, with goals and steps to achieve them, was
informed by the expertise of key stakeholders who shared their input and expertise in the six
focal areas. Between November 2016 and May 2017, ECE professionals, community
members, civic leaders, and child development advocates gathered in a series of meetings
at SCCOE to develop the updated plan for the county. In partnership with SCCOE, American
Institutes for Research (AIR) facilitated these meetings and summarized stakeholder
feedback, presented in Section Two of this plan.
The 2017 ELMP provides an overview of progress made since 2010, current needs, and
specific goals and steps to address those needs between now and 2024, as summarized
below.
Progress Since the 2010 ELMP, Current Needs, and Goals to Address Them
Each focal area has several goals, including one or two key goals. Most of the goals have
two-, five-, and seven-year milestones. The two-year milestones include specific actions to
achieve them; however, not all of the five- and seven-year milestones have actions, to allow
for changing circumstances and flexibility in achieving the goals within that extended time
frame.

8
Access
Progress Since 2010 and Current Needs
Spaces for Preschoolers. The 2010 ELMP set a goal of having a quality early education
space for 70 percent of Santa Clara County’s preschool population (children ages three
through five years old). While the county had enough licensed center and family child
care spaces for about three-quarters of the preschool age group, this finding only reflects
the number of licensed physical spaces and does not address whether these spaces are
operational or enrolled, meet quality standards to promote child development, or
address the family’s needs in terms of location, hours of service, or type of program.
Based on parent responses to the 2014 American Community Survey, an ongoing
statistical survey by the U.S. Census Bureau that collects detailed information about the
American people and the country’s workforce, actual enrollment in preschool is closer to
60 percent, and there is hence currently an overall shortage of approximately 7,500
spaces.
Spaces for School-Age Children. The 2010 ELMP set a goal of having a quality early
education space for 50 percent of its five- to eight-year-olds. Licensed Out-of-School Time
(OST) is available for about one in 10 children under age 12 in the county, and the
supply has decreased slightly since 2010. However, many OST programs are not
required to be licensed. Hence the actual capacity of after-school and summer programs
for young school-age children in the county is unknown, and there may be more capacity
for this age group than the available data suggest.
Spaces for Infants/Toddlers. Santa Clara County has less than one licensed space for
every six children under three years old. At the same time, family preferences for home-
based care for infants and toddlers suggests a range of options may be needed,
including improved access to paid family leave, improved access to licensed family child
care, and an expansion of center-based programs, such as Early Head Start, community-
college-based facilities, and workplace-based facilities.
Addressing Existing Needs and Challenges
Scale Up Transitional Kindergarten. One existing option for alleviating a portion of the
shortage of preschool for four-year-olds is to increase access to and expand enrollment
in state-funded Transitional Kindergarten (TK). As many as 3,000 currently unenrolled
four-year-olds are estimated to be eligible; however, nearly half of the county’s
elementary schools do not yet offer a TK program.
Increase the Income Eligibility Threshold. The maximum family income eligible for state-
funded programs does not currently represent a realistic level of need for financially
assisted participation in the county’s early learning programs. The implementation of the
increase in income eligibility to 85 percent of the State Median Income (SMI) for state-
funded ECE programs (included in the 2017-18 California State budget and also
proposed in the county’s local child care pilot program, currently under consideration by
the California Department of Education) will help make ECE affordable to more families.

9
These changes will also assist the county in claiming additional State Preschool slots for
which it is already eligible.
Leverage New State Funding. With more generous reimbursements recently made
available from the state of California, it is likely that ECE providers will be able to
increase the number of state-funded slots they contract to deliver. However, the increase
in the number of children eligible for services due to the change in the income eligibility
threshold (as noted above) is likely to outpace the number of new slots provided by the
state, and could more than double the number of unserved eligible preschool-aged
children.
Expand Local Funding. Existing state and federal funds for preschool are not sufficient to
make preschool available to all the low- and middle-income children who need it. Even if
the county meets the goal of increasing access to ECE by enrolling all eligible children in
TK, and increasing access to the California State Preschool program, there will still be
thousands of additional spaces needed to meet the goal of providing access to
approximately 75 percent of preschool-age children. Adding local funds to address this
gap and to help subsidize universal access to ECE will improve the affordability of ECE
programs for families and create socioeconomic diversity in preschool classrooms.
Articulation, Alignment, and Data Systems
Progress Since 2010 and Current Needs
Alignment. The 2010 ELMP intended to align systems and services for children from
birth to third grade – strategies included enhanced communication across child-serving
systems, meaningful child assessments, and PreK–grade 3 curriculum alignment. Some
progress on these articulation and alignment goals has been made. First, developmental
screening is being provided by a number of agencies in the County. For example, the
Ages and Stages Questionnaire (ASQ) is mandated by the CSPP program and is
performed in FIRST 5 Santa Clara County-funded Family Resource Centers. Second,
PreK-Grade 3 curriculum alignment was a key component of the development of the
California Preschool Learning Foundations – and a substantial report on their alignment
with other key early learning resources, including the Common Core State Standards and
the California Content Standards, was published by the California Department of
Education in 2012.
Data Systems. Only one of the county’s 27 elementary school districts has linked early
care to its elementary school database. The key barrier here is the lack of a student
identifier for children served in ECE settings that is carried over into the public school
system, thereby limiting information sharing across these programs.
Addressing Existing Needs and Challenges
Expand Early Learning Provider Networks. Early Learning Provider Networks (ELPNs) at
the school district level can improve instructional alignment and personalization in the
early grades by facilitating communication between elementary school staff and ECE

10
providers. Identifying model ELPNs and supporting their expansion will support improved
alignment.
Share Data. Simplifying and supporting access to student data across the ECE-K12
transition can be achieved through the use of an integrated data system (IDS).
Expanding the existing DataZone IDS operated by SCCOE to include ECE providers –
which requires assigning unique, non-personally identifiable, identifiers (SSIDs) to their
students – provides a way to address this need.
Encourage School Readiness Assessments. The county can enhance articulation by
encouraging school districts to use validated school readiness assessments (SRAs). In
addition, districts should ensure that all parents receive school readiness and enrollment
information for their children.
Facilities
Progress Since 2010 and Current Needs
Early Learning Facilities Coalition. The 2010 ELMP set a goal that by 2017, there would
be a coordinated, integrated, sustainable system to ensure the planning and funding
needs for quality facilities for all birth-to-eight-year-olds in Santa Clara County are met.
The county established an Early Learning Facilities Coalition to help ensure the
development and maintenance of ECE facilities in the first years after the development
of the 2010 ELMP.
Early Learning Facilities Study. The county is also acting on the primary facility-related
recommendation from the 2010 ELMP – namely, conducting an Early Learning Facilities
Study to inventory resources, complete asset mapping, and list barriers and potential
strategies to overcome them.
Addressing Existing Needs and Challenges
Create Early Learning Facilities Development Plan. The Santa Clara County Early
Learning Facilities Study (ELFS), conducted in 2017, helps the county 1) assess the
capacity and condition of existing ECE centers; 2) explore potential new spaces and sites
for future centers; 3) identify opportunities to partner with public and private entities to
develop new facilities; and 4) identify the barriers that prevent the improvement or
expansion of existing facilities, as well as the development of new facilities. This study
will form the basis of a countywide facilities development plan to be developed as part of
the ELMP and will identify areas requiring further analysis or study.
Establish Early Learning Facilities Technical Assistance Provider. A countywide ECE
facilities technical assistance provider can help ensure that there is an entity in charge
of helping cities or interested providers identify where new or expanded facilities are
most needed, and build upon the findings of the 2017 facilities study, which maps the
location of existing programs by zip code and their proximity to schools and

11
transportation. This technical assistance provider could also help navigate the different
zoning requirements and fees in the county’s 15 different municipalities, and provide
guidance on how to balance family interest in greater access to high-quality ECE facilities
with other citizen interests, such as limiting noise and traffic congestion.
Enhance Facilities Licensing Process. Licensing inspections by the Community Care
Licensing Division (CCLD) of the state’s Department of Social Services provide an
opportunity to evaluate the condition of the current inventory of ECE facilities. Enhancing
the facilities licensing process in collaboration with CCLD could ensure that the county
has a more current, comprehensive understanding of the quality of its ECE facilities.
Provide Support for Development. The cost of expanding or upgrading existing facilities
and of constructing new programs is high, and there is no dedicated funding source to
support facilities. The county can engage in ongoing advocacy for sustainable sources of
funding and partner with cities to help improve existing facilities and develop new sites.
Family Engagement
Progress Since 2010 and Current Needs
Family Engagement Workgroup. The 2010 ELMP set a goal of establishing a workgroup
to help inspire and support family engagement in each child’s education and
development, and the county has met that goal by establishing a Family Engagement
and Leadership Working Committee that met several times in the year following the
2010 plan and developed a logic model with specific goals.
Parent Survey. In 2013, the Local Planning Council surveyed parents to determine the
types of ECE they prefer. A majority of working parents of infants and toddlers indicated
informal arrangements, whereas working parents of preschoolers preferred some type of
formal program. The picture was mixed for parents of school-age children, with some
indicating formal and others informal services. This survey helped set local priorities for
use of state and federal funds.
Addressing Existing Needs and Challenges
Implement a Countywide Family Engagement Framework. Ensuring the coordinated,
countywide use of a family engagement framework, which includes established practices
and evaluation, will provide a consistent structured approach to this important aspect of
quality ECE programs across all stakeholders.
Establish a Family Engagement Collaborative. A collaborative focused on family
engagement, that includes ECE providers and K-12, aligns the work of both groups and
supports children and their families as they transition from one sector to the other.
Promote Family Education. A media campaign will provide families, caregivers, and ECE
providers with a shared understanding of the importance of family engagement and
highlight specific practices to support their children. Such a campaign can also

12
demonstrate that the county’s ECE providers are committed to partnering with them in
supporting their children’s development.
Program Quality
Progress Since 2010 and Current Needs
Quality Rating and Improvement System (QRIS). The 2010 ELMP set a goal of having 75
percent of the county’s ECE programs serving three- and four-year-olds participate in a
Quality Rating and Improvement System (QRIS). Santa Clara County has made great
strides in establishing and implementing its QRIS, QUALITY MATTERS … a STRONG
START for kids (QUALITY MATTERS), to assess program quality: more than half of the
assessed programs are rated at the top two levels. However, there has only been enough
funding to assess less than a quarter of the county’s licensed centers and two percent of
its licensed family child care homes. Therefore, most children attend programs required
to meet state licensing requirements that are intended to protect children’s safety, but
do not address program quality, and hence the actual quality of most ECE programs,
particularly those serving infants and toddlers, is still unknown.
Other Ways to Define and Provide Quality. Forty-five child care centers in the county (or
approximately seven percent of the county’s child care centers) are accredited by the
National Association for the Education of Young Children (NAEYC), These NAEYC-
accredited programs meet some of the criteria for the highest ranked programs in
QUALITY MATTERS.
Transitional Kindergarten. Approximately half of the county’s elementary schools have
TK programs. TK programs excel on the workforce qualification components in QUALITY
MATTERS.
Addressing Existing Needs and Challenges
Expand QUALITY MATTERS and Other Quality Accreditation Programs Participation. The
plan aims to build upon the considerable progress made since the 2010 plan in
improving quality by expanding participation in QUALITY MATTERS and increasing the
number of sites participating in other quality accreditation programs (e.g., NAEYC
accreditation).
Assess and Improve Quality Improvement Strategies. A common program quality data
system will ensure that the county has a more current, comprehensive understanding of
the current level of quality programming for enrolled children in the county. The plan also
aims to gain a better understanding of the status of programming for children in TK and
of school-age children through assessing and identifying ways to improve quality.
Increase Community Awareness. Because improving the quality of ECE programs
requires the understanding and support of parents and families, one critical piece of the
ELMP is to enhance their awareness of the impacts of quality programming.

13
Workforce Development
Progress Since 2010 and Current Needs
Professional Development. The 2010 ELMP set a goal that by 2017, at least half of the
teachers/providers in the county’s ECE programs have at least a bachelor’s degree, and
that almost a third of the assistants have at least an associate’s degree. Some progress
has been made on this goal. For example, as of 2016, 83 percent of Head Start teachers
held a bachelor’s degree, which both surpassed the ELMP’s goal and also exceeded the
federal Head Start requirement that 50 percent of Head Start lead classroom teachers
hold a bachelor’s degree. Fifty-five percent of Early Head Start teachers in the county
had a bachelor’s degree or higher. In the TK program, all teachers must have at least a
bachelor’s degree. The higher rated programs in QUALITY MATTERS typically have lead
teachers with a bachelor’s degree. Yet data are lacking on the qualifications of the ECE
professionals serving children in other publicly subsidized settings and privately funded
programs.
Compensation. Low salaries in the ECE field pose a substantial barrier to increasing staff
qualifications and program quality. As of May 2015, on average, preschool teachers
earned over $25,000 per year less than kindergarten teachers and over $35,000 per
year less than elementary school teachers. Low compensation is one factor that heavily
influences the recruitment and retention of qualified ECE professionals.
Addressing Existing Needs and Challenges
Reopen Early Childhood Lab Schools. Providing access to practicum opportunities at
community colleges – the primary source of training for new entrants into the ECE
workforce – supports higher quality and consistency of students’ initial hands-on training
and experience. Many of the ECE lab schools at community colleges have closed due to
lack of funding, and reopening them would address workforce development needs – as
well as facility and program quality issues.
Promote Worthy Wages. The goal of improving compensation for the ECE workforce is
heavily linked to expanding access to quality ECE programs and to improving the quality
of existing programs. Workforce studies will provide the local data required to support
advocacy for worthy wages.
Increase Availability of Qualified Staff. The county will increase the use of the Early Care
and Education Workforce Registry (ECE Workforce Registry) to more accurately
understand the qualifications and needs of the existing pool of ECE professionals in the
county. A strategic talent management effort will address gaps between workforce need
and supply, and provide the information required to support ECE training programs in
developing more responsive, higher quality pre- and in-service training for the local ECE
workforce.
Develop School Administrator Training. Pre- and in-service elementary school
administrator training will include ECE content to assist administrators’ leadership of

14
ECE programs within the K-12 setting and to enhance elementary schools’ alignment
with the ECE programs that prepare their incoming students.
Enhance Community Awareness. The general public is largely unaware of the increasing
academic rigor of pre- and in-service training for ECE professionals, and of the crucial
role of ECE teachers in preparing children for success in school and life. A public
education campaign on these topics will increase the community’s awareness of these
issues and provide support for many of the other goals (e.g., Family Engagement,
Program Quality) in the ELMP.

15
Introduction
This 2017 Early Learning Master Plan (ELMP) presents both a snapshot of the state of early
care and education (ECE) in Santa Clara County in 2017 and a roadmap for the future, with
goals, milestones, and action items to address the needs of children from birth to age eight,
their families, and the ECE providers who teach and care for them. The ELMP addresses
strengths and challenges in six major areas of the ECE system – Access; Articulation,
Alignment, and Data Systems; Facilities; Family Engagement; Program Quality; and
Workforce Development.
Santa Clara County has the sixth largest population in the state of California1 and more than
214,000 children aged eight and under.2 The county ranks at or near the top in the state of
California on measures of income, education, and economic success. Despite the county’s
overall well-being and its commitment to ECE programs, however, there is a persistent gap
in school achievement between children of affluent and low-income families in the
community. As of school year 2015-16, for example, nearly a third of third grade students in
the county were in school districts with at least 40 percent of their students not meeting
English Language Arts proficiency standards.3 Countywide, there is a 40-percentage-point
gap between third graders from socioeconomically disadvantaged and non-disadvantaged
backgrounds in meeting English Language Arts standards (32 percent versus 74 percent,
respectively).4 Even relatively affluent working parents in Santa Clara County, with its high
cost of living, struggle to find and afford quality spaces for their infants and toddlers,
preschool children, and young elementary children in quality ECE settings. Currently, there is
an estimated shortage of 7,500 spaces for preschool-age children across all income levels,
and licensed spaces for only one in six infants and toddlers and one in 10 young school-age
children. Finding a space for preschool children with special needs is difficult for families in
all income groups.
The county has a rich history of supporting its population of young learners through
collaborative planning and partnership among key agencies—along with a readiness to pilot
and secure funding for innovative programs and initiatives. The development of the 2010
ELMP and the beginnings of the Strong Start initiative in 2012 highlight the county’s
commitment to improving the ECE landscape for children from birth to age eight. The
opening of Educare of California at Silicon Valley is testament to the county’s commitment to
increasing access and quality through innovation and partnership. Santa Clara County was
one of 16 counties in the state to apply for and receive a three-year grant to develop a pilot
Quality Rating and Improvement System (QRIS) for early childhood programs, underscoring
the county’s dedication to defining and sharing information about quality. As of early
February 2017, the county had more than 140 rated programs in its QRIS, QUALITY
1 U.S. Census Bureau. (2016). Annual estimates of the resident population: April 1, 2010 to July 1, 2015. Washington, DC: Author. Retrieved from http://factfinder.census.gov/faces/tableservices/jsf/pages/productview.xhtml?fpt=table 2 California Department of Finance (2014). Historical and projected state and county births, 1970-2023, with actual and projected fertility rates by mother’s age and race/ethn icity, 2000-2023. Sacramento, CA: Author. Retrieved from http://www.dof.ca.gov/Forecasting/Demographics/projections/Historical_And_Projected_Births/ 3 Sources: California Department of Education, California Assessment of Student Performance and Progress (CAASPP) data: CAASPP Research Files 2015-16, downloaded on 1/6/17 at http://caaspp.cde.ca.gov/sb2016/ResearchFileList 4 California Department of Education, California Assessment of Student Performance and Progress (CAASPP) Research Files 2015 -16, downloaded on 1/6/17 at http://caaspp.cde.ca.gov/sb2016/ResearchFileList

16
MATTERS … a STRONG START for kids (QUALITY MATTERS), three quarters of which were
either rated “Platinum” (“Tier 5”), “Gold” (“Tier 4”), or “Silver” (“Tier 3”).5
This commitment and history of partnership is reflected in the development of the 2017
ELMP. Following an initial planning effort between SCCOE and its consultant, AIR, in the fall
of 2016, a large group of ECE stakeholders from Santa Clara County – many of whom had
participated in the 2010 ELMP development effort – were brought together in a ”kick-off”
event at SCCOE. At this meeting, the group assessed progress towards the goals identified in
the 2010 ELMP, identified focal areas and goals for the next phase of the plan, and
proposed additional stakeholders to be included in the 2017 ELMP development process.
SCCOE, AIR, and a subset stakeholders (the Planning Group) convened twice – in December
2016 and January 2017 – to finalize the focus areas, design a workgroup process to
develop goals, milestones, and actions for the ELMP, and to invite members of the ECE
community (largely, but not exclusively, from Santa Clara County) to participate in the
workgroups. These six groups each met for three half-day meetings in March, April, and May
2017. The recommendations of these various workgroups were then compiled and, through
an iterative process of drafting and feedback between AIR, SCCOE and the ELMP Planning
Group, have been shaped into this comprehensive and aligned plan. At each stage of this
process, the vision of equitable and inclusive access to affordable, voluntary, high-quality
early care and education (ECE) services for all children from birth to eight in Santa Clara
County served to guide the work. The resulting 2017 ELMP is intended to build upon the
2010 ELMP and aligns with existing ECE initiatives in the county, and, to the greatest extent
possible, it represents the consensus view of stakeholders in each workgroup.
Organization of the Plan This report is divided into two major sections. Section A is a State of the County Summary,
which assesses the extent to which the 2010 ELMP goals have been achieved, the changes
in the landscape of ECE in the seven subsequent years, the strengths of the ECE system in
the county, and the challenges that remain. The purpose of this summary is to set the stage
for the 2017 ELMP goals, milestones, and actions.
Section B describes the goals, milestones, and actions in the six focus areas: Access;
Articulation, Alignment, and Data Systems; Facilities; Family Engagement; Program Quality;
and Workforce Development. Each focal area has several goals, including one or two
identified as “key” goals. Most of the goals have two-, five-, and seven-year milestones. The
two-year milestones include specific actions to achieve that milestone; however, not all of
the five- and seven-year milestones have associated actions, to allow for changing
circumstances and flexibility in achieving the goals within that extended timeframe.
5 First 5 Santa Clara County, as of 2/2/2017. Additional data available from: First 5 Santa Clara. (2017). QRIS participant current rating by site. San Jose, CA: Author. Retrieved from: http://www.first5kids.org/early-learning/qris-list

17
Section A: State of the County Summary: The Status of
Early Child Care and Education in Santa Clara County in
20176
6 As of spring 2017.

18
Introduction
This State of the County Summary assesses the current status of early care and education (ECE)
in Santa Clara County for the purpose of informing the 2017 Early Learning Master Plan (ELMP).
Between March and November 2009, SCCOE led an effort to develop the first ELMP for Santa
Clara County. This collaborative, participatory effort included ECE professionals, community
members, civic leaders, and child development advocates, and resulted in the 2010 ELMP.
From November 2016 to October 2017, American Institutes for Research (AIR) helped SCCOE
assess the progress made toward the goals of the 2010 ELMP and create an updated,
countywide 2017 ELMP. The purpose of this updated plan is to provide a strategic framework for
the ECE community in Santa Clara County as it works to ensure that all children from birth to age
eight in the county have equitable and inclusive access to high-quality ECE opportunities through
a focus on six areas: 1) Access; 2) Articulation, Alignment, and Data Systems; 3) Facilities; 4)
Family Engagement; 5) Program Quality; and 6) Workforce Development.
This State of the County Summary provides background information on the accomplishments
made since 2010 for the purpose of informing the six workgroups in the above focal areas in the
development of two-, five- and seven-year goals and milestones, and actions to achieve those
goals.
The summary was informed by a review of extant data and literature, and communication and
interviews with ECE advocates and stakeholders in Santa Clara County.

19
Access
Population of Children in the County Has Decreased Since 2008
As of 2016, more than 141,000 birth- through-five-year-old children live in Santa Clara County.
However, as shown in Exhibit A-1, the number of children decreased by 11 percent between
2008 and 2014. Given the continued high cost of living, this trend is expected to continue,
though at a reduced pace, between 2016 and 2022.
The 2010 plan set a goal of having a quality early education space for 70 percent of the county’s
preschool population and child care spaces for 50 percent of its five- to eight-year-olds. Technically,
the county had enough licensed center and family child care spaces for 78 percent of the preschool
age group as of 2014, although these spaces were not all necessarily quality spaces. Based on
parent responses to the 2014 American Community Survey, actual enrollment in preschool was
closer to 60 percent, indicating a shortage of approximately 7,500 spaces for three- and four-year-
olds. Meanwhile licensed Out-of-School Time (OST) was available for about one in 10 children under
age 12, but many OST programs are not required to be licensed. Infant and toddler care was
available for only one in six children under three years old in the county. The unmet need for
subsidized ECE decreased, due to the reduction in the population of children in poverty and an
outdated low subsidy eligibility income threshold in a county with a high cost of living.

20
Exhibit A-1. Number of Children From Birth through Five Years Old in Santa Clara County in 2008-2022
Percent
Change
Age 2008 2010 2012 2014a 2016b 2018c 2020d 2022d
2008
to
2010
2012
to
2014
2008
to
2014
2014
to
2022
Under
1
Year 26,730 23,936 24,308 23,392 23,462 23,477 23,414 23,300 -10% -4% -12% 0%
1-
Year-
Olds 27,484 25,200 23,652 23,224 23,427 23,477 23,470 23,361 -8% -2% -16% 1%
2-
Year-
Olds 26,942 26,730 23,936 24,308 23,392 23,462 23,477 23,414 -1% 2% -10% -3%
3-
Year-
Olds 26,553 27,484 25,200 23,652 23,224 23,427 23,477 23,470 4% -6% -11% -1%
4-
Year-
Olds 26,537 26,942 26,730 23,936 24,308 23,392 23,462 23,477 2% -10% -10% -2%
5-
Year-
Olds 26,997 26,553 27,484 25,200 23,652 23,224 23,427 23,477 -2% -8% -7% -6%
Total 161,243 156,845 151,310 143,712 141,465 140,458 140,727 140,499 -3% -5% -11% -2% a The numbers of infants under age 1 in 2014 are projected estimates. b The numbers of children up to two years old in 2016 are projected estimates. c The numbers of children up to four years old in 2018 are projected estimates. d The numbers of all children in 2020 and 2022 are projected estimates. Source: California Department of Finance. (2014). Historical and projected state and county births, 1970-2023, with actual and projected fertility rates by mother’s age and race/ethnicity, 2000-2023. Sacramento, CA: Author. Retrieved from: http://www.dof.ca.gov/Forecasting/Demographics/projections/Historical_And_Projected_Births/

21
Population of Children in Poverty Decreased Steadily Between 2010 and 2014
Although the number of young children living below the federal poverty threshold in Santa Clara
County increased between 2008 and 2010, the county has experienced a steady decrease in
the number of birth to five-year-olds in poverty since 2010 – from a high of over 20,000 in 2010
to approximately 12,000 in 2014. As shown in Exhibit A-2, this trend between 2010 and 2014
differs from the statewide trends over time of children living in poverty; the number of children in
poverty statewide increased between 2010 and 2012 and only decreased between 2012 and
2014. This decrease in the number of young children in poverty at the county level has
significant implications for subsidized ECE programs.
Exhibit A-2. Number of Children from Birth to Five Years Old Living in Poverty in Santa Clara
County and California in 2008, 2010, 2012, and 2014a,b
Percent Change
2008 2010 2012 2014
2008
to
2010
2012
to
2014
2008
to
2014
California 626,804 705,084 760,003 690,825 12% -9% 10%
Santa Clara County 14,444 20,255 17,899 12,070 40% -33% -16%
Sources: a 2008 and 2010 data: California Child Care Resource and Referral Network. (2011). 2011 California child care portfolio. San Francisco, CA: Author. Retrieved from: http://d3n8a8pro7vhmx.cloudfront.net/rrnetwork/pages/88/attachments/original/1387861343/2011-portfolio-combined.pdf?1387861343 b 2012 and 2014 data: California Child Care Resource and Referral Network. (2015). 2015 California child care portfolio. San Francisco, CA: Author. Retrieved from: https://d3n8a8pro7vhmx.cloudfront.net/rrnetwork/pages/204/attachments/original/1456339909/Santa_Clara__County__2.23.2016.pdf?1456339909
Child Care Capacity Varied by Type of Setting and Age Cohort
Overall, licensed capacity in ECE has increased since 2010. Between 2010 and 2014, the latest
year for which data were available for this summary, licensed center-based capacity in Santa
Clara County increased 13 percent for infants and toddlers, 16 percent for preschool-age
children, and 16 percent for five-year-olds, while decreasing slightly for older school-age children.
Meanwhile, the supply of family child care decreased somewhat across all age groups by almost
3 percent.

22
Exhibit A-3. Child Care Capacity by Age Group and Type of Settinga,b
Child Care Supply
Licensed Child Care Centers
Licensed Family Child Care
Homes
2010 2012 2014 2010 2012 2014
Total number of slots 42,993 45,000 47,953 19,702 19,414 19,170
Infant slots (under 3 years old)c,d 5,898 6,341 6,649 4,728 4,659 4,601
Preschool slots (3-4 years old)e,f 25,622 27,076 29,804 7,684 7,571 7,476
5 years oldg,h 1,490 1,574 1,733 985 971 959
School-age slots (6 years and
older)i 9,983 10,009 9,767 6,305 6,212 6,134
Total number of sites 580 607 666 1,928 1,895 1,867 a Source for 2010 data: California Child Care Resource and Referral Network. (2011). 2011 California child care portfolio. San Francisco, CA: Author. Retrieved from: http://d3n8a8pro7vhmx.cloudfront.net/rrnetwork/pages/88/attachments/original/1387861343/2011-portfolio-combined.pdf?1387861343 b Source for 2012 and 2014 data: California Child Care Resource and Referral Network. (2015). 2015 California child care portfolio. San Francisco, CA: Author. Retrieved from: https://d3n8a8pro7vhmx.cloudfront.net/rrnetwork/pages/204/attachments/original/1456339909/Santa_Clara__County__2.23.2016.pdf?1456339909 Notes: AIR adjusted the age cohorts presented in the California Child Care Resource and Referral Network’s 2011 California Child Care Portfolio and 2015 California Child Care Portfolio (i.e., under two, two- through five-year-olds, and six years and older) to reflect the ages in the cohorts used in this table and elsewhere in the report (i.e., birth to two -year-olds, three- and four-year-olds, and five-year-olds). See the notes below for how the adjustments were estimated, based upon the findings from AIR’s study of child care supply and demand [Anthony, J., Manship, K., Chandra, C., & Muenchow, S. (2009). Preschool supply and demand in the state of California: An assessment of preschool enrollment in publicly contracted and privately operated preschool programs. San Mateo, CA: Author] and data from the Community Child Care Council of Santa Clara County reported in the 2013 Santa Clara County Child Care Needs Assessment. c The number of licensed child care center slots for infants (under three years old): The number of licensed child care center slots for children under two years old, plus 9 percent of the number of licensed child care center slots for two- through five-year-olds. d The number of licensed family child care home slots for infants (under three years old): 24 percent of total number of licensed family child care home slots. e The number of licensed child care center slots for preschoolers (three- and four-year-olds): 86 percent of the number of licensed child care center slots for ages 2-5. f The number of licensed family child care home slots for preschoolers ( three- and four-year-olds): 39 percent of total number of licensed family child care home slots. g The number of licensed child care center slots for five-year-olds: 6 percent of the number of number of licensed child care center slots for ages 2-5. h The number of licensed family child care home slots for five-year-olds: 5 percent of total number of licensed family child care home slots. i The number of licensed family child care home slots for children six years old and older: 32 percent of total number of licensed family child care home slots.
Capacity of Care for Preschoolers Increased but Capacity in High-Quality Care Still
Needs to be Addressed
The 2010 ELMP set a goal of providing access to quality ECE for 70 percent of the preschool
population and afterschool care for 50 percent of the school-age population. As shown in Exhibit
A-4, as of 2014, if both licensed, center-based capacity and licensed family child care capacity
are considered, there were spaces for 78 percent (37,280 slots for 47,588 preschoolers) of
preschool-aged children in the county. Part of this increase in percentage served was due to a
decrease in the population – but most of the remainder resulted from the introduction of the
Transitional Kindergarten program.
While it appears that the 2010 ELMP goal has been met for the preschool age group in terms of
sheer number of available physical spaces, this does not necessarily mean that the sites actually
enroll enough children to meet their licensed capacity (due to circumstances such as the number

23
of staff available, or the desire to enroll fewer children, for example), or that they meet families’
needs in terms of hours or location, or that they are of sufficiently high quality. Indeed, if
licensing requirements for staff-child ratios were changed to meet nationally recognized quality
standards such as those of the National Association for the Education of Young Children (NAEYC)
(i.e., from 1 adult per 12 preschoolers to 1 per 10 or fewer), licensed capacity in the county
would decrease. If only spaces in licensed, center-based care are considered, there were spaces
for 63 percent of preschoolers (29,804 slots for 47,588 of the cohort) in 2014. Similarly, based
on the Santa Clara County Local Early Education Planning Council’s (Local Planning Council’s)
analysis of parents’ responses to the American Community Survey,7 approximately 60 percent, or
about 30,000 of the roughly 50,000 three- and four-year-olds in the county at that time, were
enrolled in preschool. In states that provide universal access to preschool, typically no more than
75 percent participate. To meet the goal of serving at least 75 percent of children, Santa Clara
County would therefore need to make services available to approximately 7,500 more children.
As shown in Exhibit A-4, the 2010 ELMP goal of quality spaces for 50 percent of the school-age
population does not appear to have been met, and the number of school-age children enrolled
decreased slightly between 2010 and 2014. Licensed Out-of-School Time (OST) programs for
school-age children are available for about one in 10 school-age children under age 12; there
are no available data on the number of five- to eight-year-olds who are served. In addition, many
OST programs are not required to be licensed. As a result, the actual availability of school-age
child care is not known.
Meanwhile, the county has one licensed infant/toddler space for every six children under three
years old (i.e., spaces for 11,250 or 16 percent of the 70,924 infants and toddlers in the
county). While the total number of infant/toddler center-based slots increased between 2010
and 2014, the number of licensed family child care spaces decreased slightly.
7 The Office of the Superintendent, Administrative Services of the Santa Clara County Office of Education. (2013). 2013 Santa Clara County child care needs assessment. Santa Clara, CA: Local Early Education Planning Council of Santa Clara County. Note: The Local Planning Council presented the data (see page 5 of the LPC report) from Children Now’s 2012-13 California County Scorecard [Children Now. (2013). 2012-13 California county scorecard. Oakland, CA: Author. Retrieved from http://scorecard.childrennow.org/resources/scorecard12_notes.pdf.] Children Now obtained its data from the ACS 2006-08 and 2008-10, 3-Year Estimates (March 2012).

24
Exhibit A-4. Licensed Capacity as a Proportion of Child Population, 2010 and 2014a
Infant/Toddler (under 3 years old) Preschool (3-4 years old)
5 Years Old School-Age (6 years and older)
a Source for population data: California Department of Finance (2014). Historical and projected state and county births, 1970-2023, with actual and projected fertility rates by mother’s age and race/ethnicity, 2000-2023. Sacramento, CA. Retrieved from:
http://www.dof.ca.gov/Forecasting/Demographics/projections/Historical_And_Projected_Births/ Notes on capacity: AIR adjusted the age cohorts presented in the California Child Care Resource and Referral Network’s 2015 California Child Care Portfolio (i.e., under 2, 2- through 5-year-olds, and 6 years and older) to reflect the ages in the cohorts used in this table and elsewhere in the report (i.e., birth to two, three- and four-year-olds, and five-year-olds). See the notes below Exhibit A-3 for how the adjustments were estimated, based upon the findings from AIR’s Preschool supply and demand in the state of California: An assessment of preschool enrollment in publicly contracted and privately operated preschool programs and data from the 2013 Santa Clara County Child Care Needs Assessment [The Office of the Superintendent, Administrative Services of the Santa Clara County Office of Education. (2013). 2013 Santa Clara County child care needs assessment. Santa Clara, CA: Local Early Education Planning Council of Santa Clara County.] See Exhibit A-3 for more detail about how the
percentages of slots were estimated.
5,898 (8%) 6,649 (9%)
4,728 (6%) 4,601 (6%)
65,240(86%)
59,674(84%)
75,866children 70,924
children
0
10,000
20,000
30,000
40,000
50,000
60,000
70,000
80,000
2010 2014
25,622 (47%)
29,804 (63%)
7,684 (14%)
7,476 (16%)
21,120(39%)
10,308 (22%)
54,426children
47,588children
0
10,000
20,000
30,000
40,000
50,000
60,000
70,000
80,000
2010 2014
1,490 (6%) 1,733 (7%)985 (4%) 959 (4%)
24,078(91%)
22,508(89%)
26,553children 25,200
children
0
5,000
10,000
15,000
20,000
25,000
30,000
2010 2014
9,983 (6%) 9,767 (6%)6,305 (4%) 6,134 (4%)
167,094(90%) 154,541
(90%)
183,382children 170,442
children
0
20,000
40,000
60,000
80,000
100,000
120,000
140,000
160,000
180,000
200,000
2010 2014

25
Unmet Need for Subsidized Care Decreased, but Likely to Rise With More Realistic
Income Ceiling
Access to ECE requires not only an adequate supply of spaces but also families’ ability to pay for
the service. Since 2010, the unmet need for preschool-age children eligible for subsidy at an
income threshold of 70 percent of the State Median Income (SMI) actually decreased in Santa
Clara County – from 5,900 in 2010 to 2,397 in 2014. However, as indicated below, the
reduction in unmet need primarily reflects an outdated low-income ceiling for the subsidy that
did not take into account the high cost of living in Santa Clara County.
Exhibit A-5 presents the estimated need for subsidized or publicly supported ECE among low-
income preschoolers in the county; the numbers enrolled, by type of ECE setting; and unmet
need, as of 2014. Any estimate of “unmet need” depends partly on the assumptions used, both
in terms of estimated participation rate and also the income threshold for subsidy eligibility.
The estimate of unmet need begins with assumptions regarding the estimated participation rate.
As will be discussed later in this summary, family preference for type of child care setting (e.g.,
formal versus informal, out-of-home versus relative care) is an important consideration. For
example, while most families of four-year-olds prefer some type of formal program, they may
also, for a variety of reasons, require supplemental, less formal arrangements. However, for
purposes of promoting school readiness, especially for a disadvantaged population, the best way
to estimate the “demand” or participation rate may be to look to a community where access to a
quality preschool program is virtually guaranteed. In order to estimate the likely participation rate
in the county’s subsidized programs (if they truly were available to serve all children in low-
income neighborhoods), the most analogous programs may be the preschool programs located
in the Abbott districts in New Jersey—a set of districts where a school finance adequacy lawsuit
resulted in the state’s lowest achieving (and highest poverty) districts being required to offer
preschool to all children in the district. Median participation rates in the Abbott district preschool
programs are higher than 90 percent.8 It is reasonable to assume that lower income parents
(such as those with children eligible for California’s State Preschool Program) may choose to
have their children participate in publicly provided preschool programs at higher rates than other
parents, on average. These parents, although unable to afford high-quality private programs, may
recognize that their children need ECE services to help them get ready for school, and may also
need free or affordable ECE in order to work. This report, for the population of disadvantaged
preschoolers, assumes participation rates of 90 percent, as was found in the Abbott districts.
Another important factor in estimating unmet need for subsidy-eligible children is the income
ceiling for subsidy, and its relationship to the local cost of living. Prior to the most recent
California state budget, and the proposed increase in income eligibility to 85 percent of SMI in
the county’s recently developed local child care subsidy pilot plan, the maximum family income
eligible for subsidy (70 percent of SMI, or about $46,896 for a family of four)9 for Title 5 State
Preschool was unrealistically low, and therefore resulted in a misrepresentation of the level of
need for financially assisted participation in ECE programs in Santa Clara County. To be self-
8 Farrie, D. (2014). The Abbot preschool program: A 15-year progress report. Philadelphia, PA: Education Law Center. Retrieved from: http://www.edlawcenter.org/assets/files/pdfs/publications/AbbottPreschool15YearProgressReportMay2014.pdf 9 California Department of Education. (2016). Family fee schedule. Sacramento, CA: Author. Retrieved from: https://www.mcs4kids.com/documents/famfeeschedule2016.pdf

26
sufficient, a family of four (two adults and two preschool-age children) in Santa Clara County
needs a much higher annual income. Although the poverty threshold for a family of four in 2014
was only $24,230, an estimated $90,750 was required for a family of two adults and two
preschool-age children to meet basic needs in Santa Clara County.10 As of 2012, only 70 percent
of all households in the county and 63 percent of households with children were estimated to be
living above the self-sufficiency standard.11 Furthermore, the proportion of households meeting
this self-sufficiency standard varies greatly depending upon the race and ethnicity of the
household. For example, in 2012, while 81 percent of White and 77 percent of Asian families
were above the self-sufficiency standard, only 64 percent of Black and 41 percent of Latino
families were above it.
Because not enough families have been able to qualify for subsidized care under the 70-percent-
of-SMI standard, some providers have not been able to enroll enough children to earn their
contract, For example, as shown in the Appendix (Exhibit C-1), approximately 500 fewer income-
eligible three- and four-year-olds were enrolled in State Preschool in 2014 than in 2010, and the
funds left on the table had to be sent back to the state.12
As will be discussed later in this summary, the county is due to implement a local child care
subsidy pilot plan early in the 2017-18 school year, which raises the income eligibility for Title 5
programs from 70 percent of SMI (about $58,524 for a family of four in 2017) to 85 percent of
SMI (about $71,065 for a family of four in 2017).13 However, unlike the TK program, where
eligibility is not based on family income, families will still have to complete income verification
forms, and many families below the family self-sufficiency level would still not qualify. Given this
local subsidy plan to raise income eligibility, and the state’s recent increase in the income
eligibility threshold for Title 5-funded ECE programs, Exhibit A-5 also presents unmet need in
2014 at 85 percent of SMI. Increasing the eligibility level more than doubles the number of
unserved eligible preschool children, from 2,397 to 6,789.
However, even increasing the income eligibility to 85 percent of SMI does not make preschool
affordable for many families. In 2015, according to the California Child Care Resource and
Referral Network, the average cost of full-day care in a licensed center in Santa Clara County was
$16,375 for an infant and $11,991 for a preschool-age child – or 14 percent and 10 percent,
respectively, of the median family income of $120,125.14 According to the U.S. Department of
Health and Human Services, child care is affordable when a family pays no more than 7 percent
10 Center for Women’s Welfare. (2015). Self-sufficiency standards. Seattle, WA: University of Washington. Retrieved from: http://www.selfsufficiencystandard.org/self-sufficiency-standard-state 11 Center for Women’s Welfare. (2012). The Self-sufficiency standard by select household characteristics: California 2012. Seattle, WA: University of Washington Retrieved from: http://www.insightcced.org/past-archives/insight-networks/building-economic-security-for-all-besa/californians-for-economic-security-cfes/the-self-sufficiency-standard-for-california/ 12 Exhibit C-1 shows changes in enrollment by age group and child care setting between 2010 and 2014. Notably, enrollment of income-eligible four-year-olds in center-based, publicly funded early care and learning programs increased between 2010 and 2014, largely due to the introduction of the Transitional Kindergarten program. Interestingly, enrollment of all other age groups in center-based, publicly funded programs decreased. For example, enrollment of income-eligible five-year-olds decreased by 9 percent, enrollment of three-year-olds decreased by 20 percent, and infant and toddler enrollment decreased by a significant 30 percent. These decreases were largely a result of the sharp countywide decrease in both the total number of children and specifically of children in poverty. 13 California Department of Education. (2016). Family fee schedule. Sacramento, CA: Author. Retrieved from: https://www.mcs4kids.com/documents/famfeeschedule2016.pdf 14 California Child Care Resource and Referral Network. (2015). 2015 California child care portfolio. San Francisco, CA: Author. Retrieved from https://d3n8a8pro7vhmx.cloudfront.net/rrnetwork/pages/204/attachments/original/1456339909/Santa_Clara__County__2.23.2016.pdf?1456339909

27
of its income for child care.15 However, for a median income family in Santa Clara County, the
average cost of licensed care for two children can absorb about a quarter of their income, and
many well-known facilities with established reputations for quality charge far more.
Exhibit A-5 presents the number of children who were eligible for subsidized ECE at different
potential income thresholds in 2014. The table also takes into account the projected likely
participation rate of 90 percent, as discussed above.16 Exhibit A-6 presents a graphic showing
the unmet need for children eligible and potentially interested in preschool at 85 percent SMI.
Additionally, Exhibits A-7 and A-8 compare unmet need at 70 percent and 85 SMI thresholds.
Exhibit A-5. Estimated Eligibility and Unmet Need for Early Care and Education Among Low-
Income Three- and Four-Year-Olds in Santa Clara County at Different Subsidy Eligibility Levels in
2014a
3-Year-
Olds
4-Year-
Olds Total
Number of Children
A Number of Childrenb 23,652 23,936 47,588
B Subsidy eligible at 70% of SMIc 5,029 6,385 11,414
B(a) 90% participation rated 4,526 5,747 10,273
C Subsidy eligible at 85% of SMIc 7,636 8,659 16,295
C(a) 90% participation rated 6,872 7,793 14,666
D At Extremely Low Income Limits (2014 HUD) c 2,507 2,742 5,249
D(a) 90% participation rated 2,256 2,468 4,724
E At Very Low Income Limit (2014 HUD)c 5,052 6,641 11,693
E(a) 90% participation rated 4,547 5,977 10,524
F At Low Income Limits (2014 HUD)c 7,300 8,447 15,747
F(a) 90% participation rated 6,570 7,602 14,172
Number of Subsidy-Eligible Children Enrolled (at 70% of SMI)
G Title 5 State Preschool Programe 1,348 2,754 4,102
H Other State-Contracted Title 5 Programsf 131 68 199
I Early Head Start/Head Start (excluding those also funded by
other programs)g 485 830 1,315
J State-Subsidized Voucher Programs – CalWORKs and Alternative
Payment Programsh 554 534 1,088
K Transitional Kindergarteni 0 1,172 1,172
L Total subsidy-eligible enrollment in public programs 2,518 5,358 7,876
Unmet Need j
M(a) Subsidy eligible at 70% of SMI
Percent of eligible children unserved
2,008 389 2,397
44% 7% 23%
M(b) Subsidy eligible at 85% of SMI
Percent of eligible children unserved
4,354 2,435 6,789
63% 32% 46%
15 United States Department of Health and Human Services. (2015). 45 CFR Part 98 Child Care and Development Fund (CCDF) Program; Proposed rule. (80)247. Retrieved from https://www.gpo.gov/fdsys/pkg/FR-2015-12-24/pdf/2015-31883.pdf 16 See Appendix A-2 for estimated eligibility, enrollment, and unmet need by zip code.

28
3-Year-
Olds
4-Year-
Olds Total
M(c) At Extremely Low Income Limits (2014 HUD)
Percent of eligible children unserved
-262 -2,890 -3,152
-12% -117% -67%
M(d) At Very Low Income Limits (2014 HUD)
Percent of eligible children unserved
2,029 619 2,648
45% 10% 25%
M(e) At Low Income Limits (2014 HUD)
Percent of eligible children unserved
4,052 2,244 6,296
62% 30% 44% Sources and notes: a The table does not include enrollment for the six sites that received local funds from First 5 Child Signature Program (CSP) in 2014 for teacher salaries to make specific preschool sessions available. In 2014, First 5 CSP provided funding to four sites, with a total of 839 preschool slots, that also received Title 5 State Preschool and/or Head Start funding. Three other sites with 68 preschool slots also received funding from First 5 CSP in 2014 and did not receive Title 5 State Preschool and/or Head Star t funding. b California Department of Finance. (2014). Historical and projected state and county births, 1970-2023, with actual and projected fertility rates by mother’s age and race/ethnicity, 2000-2023. Sacramento, CA: Author. Retrieved from: http://www.dof.ca.gov/Forecasting/Demographics/projections/Historical_And_Projected_Births/ c American Community Survey, Public Use Microdata Sample (PUMS) one-year data file, 2014, produced by American Institutes for Research in the Early Learning Needs Assessment Tool (www.elneedsassessment.org) d Not all families who are eligible will choose to enroll their child in preschool programs. This analysis assumes at most 90% of subsidy-eligible families will choose to enroll their children, based on the experiences of the New Jersey Abbott Preschool Program, Washington, D.C; and states with voluntary prekindergarten programs. e Title 5 State Preschool Program: California Department of Education. (October 2014). CD-801A Monthly Report, October 2014. Sacramento, CA: Author. (Archived data), Number of Children Enrolled in California State Preschool Program (CSPP), produced by American Institutes for Research in the Early Learning Needs Assessment Tool (www.elneedsassessment.org). According to the California Department of Education’s CD-801A Monthly Child Care Data, the percentage of all children enrolled in 2014 in the Title 5 State Preschool Program who were in families at or under 70 percent of the SMI was 97.78 percent. f Other Title 5 programs include Title 5 Migrant Child Care Program, Severely Handicapped Program , Title 5 Center-Based Child Care (CCTR) Program, Title 5 Family Child Care Home Education Network (FCCHN): Data from California Department of Education, CD-801A Monthly Report, October 2014 (archived data), produced by American Institutes for Research in the Early Learning Needs Assessment Tool (www.elneedsassessment.org). According to the California Department of Education’s CD-801A Monthly Child Care Data, the percentage of all children in families at or under 70 percent of the SMI enrolled in the Migrant Child Care Program was 100 percent, enrolled in Title 5 Severely Handicapped State Preschool Program was 61.02 percent, enrolled in Title 5 Center-Based Child Care (CCTR) was 99.56 percent, and enrolled in Title 5 Family Child Care Home Education Network (FCCHN) Program was 99.39 percent in 2014. g Head Start: American Institutes for Research survey of Head Start grantees, produced by American Institutes for Research in the Early Learning Needs Assessment Tool (www.elneedsassessment.org). To avoid double counting students who received funding combinations from more than one program and are already counted in o ther programs in this table, 25 percent of Head Start enrollment in in the 2014–15 school year were excluded. The combination funding percentage estimate is based on the total number of students in Early Head Start and Head Start who received combination funding in State Preschool, center -based child care, or Migrant Child Care Program. h State-Subsidized Voucher Programs – CalWORKs and Alternative Payment Programs: data from California Department of Education, CD-801A Monthly Report, October 2014 (archived data), produced by American Institutes for Research in the Early Learning Needs Assessment Tool (www.elneedsassessment.org). According to the California Department of Education’s CD-801A Monthly Child Care Data, the percentage of all children in families at or under 70 percent of the SMI e nrolled in 2014 in CalWORKs Stage 2 Programs was 99.78 percent, enrolled in CalWORKs Stage 3 was 99.71 percent, and enrolled in Alternative Payment Programs was 94.88 percent. i TK: California Department of Education. (2015). Transitional kindergarten program participation (census day), Sacramento, CA: Author. Retrieved 01/07/16 from: http://data1.cde.ca.gov/dataquest/tkreports/TkLevels.aspx?cdscode=43000000000000&year=2014-15. In the 2014-15 school year, 39 percent of 5-year-olds were in families under 70 percent of the SMI. Estimate based on analysis by American Institutes for Research. j Note: This estimate is based on analysis of eligibility at various family sizes. In 2014, while 85 percent of SMI exceeded the HUD Low Income Level for a family of six, for example, i t was less than the HUD Low-Income Level for a family of four.

29
Exhibit A-6. Unmet Need of Preschoolers Who Are Subsidy-Eligible at 85 Percent of the State
Median Income (SMI)
Source for Infographic: American Institutes for Research, based on data compiled and analyzed from the sources cited below. Sources: Interested: California Department of Finance (2014). Historical and projected state and county births, 1970-2023, with actual and projected fertility rates by mother’s age and race/ethnicity, 2000 -2023. Sacramento, CA: Author. Retrieved from: http://www.dof.ca.gov/Forecasting/Demographics/projections/Historical_And_Projected_Births/ Eligible at 85% SMI: American Community Survey, Public Use Microdata Sample (PUMS) one-year data file, 2014, produced by American Institutes for Research in the Early Learning Needs Assessment Tool (www.elneedsassessment.org) Not all families who are eligible will choose to enroll their child in preschool programs. This analysis assumes at most 90% of subsidy-eligible families will choose to enroll their children, based on the experiences of the New Jersey Abbott Preschool Program , Washington, D.C; and states with voluntary prekindergarten programs. Enrolled: Title 5 State Preschool Program: California Department of Education. (October 2014). CD-801A Monthly Report, October 2014. Sacramento, CA: Author. (Archived data), Number of Children Enrolled in California State Preschool Program (CSPP), produced by American Institutes for Research in the Early Learning Needs Assessment Tool (www.elneedsassessment.org). Other Title 5 programs: Include Title 5 Migrant Child Care Program, Severely Handicapped Program, Title 5 Center -Based Child Care (CCTR) Program, Title 5 Family Child Care Home Education Network (FCCHN): Data from California Department of Education, CD-801A Monthly Report, October 2014 (archived data), produced by American Institutes for Research in the Early Learning Needs Assessment Tool (www.elneedsassessment.org). Head Start: American Institutes for Research survey of Head Start grantees, produced by American Institutes for Research in the Early Learning Needs Assessment Tool (www.elneedsassessment.org). State-Subsidized Voucher Programs – CalWORKs and Alternative Payment Programs: data from California Department of Education, CD-801A Monthly Report, October 2014 (archived data), produced by American Institutes for Research in the Early Learning Needs Assessment Tool (www.elneedsassessment.org). TK: California Department of Education. (2015). Transitional kindergarten program participation (census day) , Sacramento, CA: Author. Retrieved 01/07/16 from: http://data1.cde.ca.gov/dataquest/tkreports/TkLevels.aspx?cdscode=43000000000000&year=2014-15

30
Exhibit A-7. Unmet Need of Preschoolers Who Are Subsidy Eligible at 70 Percent of the State Median Income (SMI)
Source for map: American Institutes for Research, based on data compiled and analyzed from the sources cited below. Sources for eligible children: American Community Survey, Public Use Microdata Sample (PUMS) one-year data file, 2014, produced by American Institutes for Research in the Early Learning Needs Assessment Tool (www.elneedsassessment.org) Sources for eligible enrolled children: Title 5 State Preschool Program: California Depar tment of Education. (October 2014). CD-801A Monthly Report, October 2014. Sacramento, CA: Author. (Archived data). Other Title 5 programs include Title 5 Migrant Child Care Program, Severely Handicap ped Program, Title 5 Center-Based Child Care (CCTR) Program, Title 5 Family Child Care Home Education Network (FCCHN): Data from California Department of Education, CD -801A Monthly Report, October 2014 (archived data). Head Start: American Institutes for Research survey of Head Start grantees. State -Subsidized Voucher Programs – CalWORKs and Alternative Payment Programs: data from California Department of Education, CD-801A Monthly Report, October 2014 (archived data). TK: California Department of Education. (2015). Transitional kindergarten program participation (census day), Sacramento, CA: Author. Retrieved 01/07/16 from: http://data1.cde.ca.gov/dataquest/tkreports/TkLevels.aspx?cdscode=43000000000000&year=2014-15.

31
Exhibit A-8. Unmet Need of Preschoolers Who Are Subsidy Eligible at 85 Percent of the State Median Income (SMI)
Source for map: American Institutes for Research, based on data compiled and analyzed from the sources cited below. Sources for eligible children: American Community Survey, Public Use Microdata Sample (PUMS) one-year data file, 2014, produced by American Institutes for Research in the Early Learning Needs Assessment Tool (www.elneedsassessment.org) Sources for eligible enrolled children: Title 5 State Preschool Program: California Department of Education. (October 2014). CD-801A Monthly Report, October 2014. Sacramento, CA: Author. (Archived data). Other Title 5 programs include Title 5 Migrant Child Care Program, Severely Handicap ped Program, Title 5 Center-Based Child Care (CCTR) Program, Title 5 Family Child Care Home Education Network (FCCHN): Data from California Department of Education, CD-801A Monthly Report, October 2014 (archived data). Head Start: American Institutes for Research survey of Head Start grantees. State -Subsidized Voucher Programs – CalWORKs and Alternative Payment Programs: data from California Department of Education, CD-801A Monthly Report, October 2014 (archived data). TK: California Department of Education. (2015). Transitional kindergarten program participation (census day) , Sacramento, CA: Author. Retrieved 01/07/16 from: http://data1.cde.ca.gov/dataquest/tkreports/TkLevels.aspx?cdscode=43000000000000&year=2014-15.

32
Exhibit A-9 presents the United State Department of Housing and Urban development (HUD)
income levels for a four-person and six-person family, as compared to 70 and 85 percent of
the state median income. Data are shown for 2014 and 2017. It is important to point out
that in July of 2017, the California Department of Education issued a Management Bulletin
that notified its contractors about the revised income ceiling that they needed to use to
determine income eligibility for fiscal year 2017-18 at initial certification for subsidized child
development services. The bulletin noted that as of July 1, 2017, 70 percent of SMI for a
four-person family increased to $58,524 and 85 percent of SMI increased to $71,065.
Exhibit A-9. HUD Income Levels by Family Size, as Compared to 70 and 85 Percent of State
Median Income (SMI)
Type
Income
Limit
Category
2014 2017
Income Limit,
4-Person Family
Income Limit,
6-Person Family
Income Limit,
4-Person Family
Income Limit,
6-Person Family
SMIa,b
70% of
SMI $46,896 $61,908 $58,524 $77,252
85% of
SMI $67,752 $89,424 $71,065 $93,806
HUDc,d
Low
Income $71,300 $82,750 $84,750 $98,350
Very Low
Income $50,950 $59,150 $59,700 $69,300
Extremely
Low
Income $30,550 $35,450 $35,800 $41,550 a 2014 SMI: California Department of Education. (2016). Family fee schedule. Sacramento, CA: Author. Retrieved from: https://www.mcs4kids.com/documents/famfeeschedule2016.pdf b 2017 SMI: SMI was increased as of July 1, 2017. California Department of Education. (2017). Management bulletin 17-08. Sacramento, CA: Author. Retrieved from: http://www.cde.ca.gov/sp/cd/ci/mb1708.asp c 2014 HUD: United States Department of Housing and Urban Development. (2014). Income limits. Washington, DC: Author. Retrieved from: https://www.huduser.gov/portal/datasets/il.html d 2017 HUD: United States Department of Housing and Urban Development. (2017). Income limits. Washington, DC: Author. Retrieved from: https://www.huduser.gov/portal/datasets/il.html
Examples of Key County Resources, Programs, and Initiatives That Address
Access
Transitional Kindergarten
Transitional Kindergarten is a recent initiative that has expanded access to education for
four-year-old children in Santa Clara County. The Kindergarten Readiness Act (California
Senate Bill 1381), which was passed in 2010, changed the entry date for incoming
kindergartners in California. The legislation also established the Transitional Kindergarten
(TK) program, which began in the 2012-2013 school year. TK is the first year of a two-year
kindergarten program that uses a modified kindergarten curriculum that is age and
developmentally appropriate. A child is eligible for TK if the child will have his or her fifth
birthday between September 2 and December 2 of the current school year. As of the 2014-
15 school year, approximately 3,000 children were served in TK in 134 schools in the

33
county’s 27 elementary and unified school districts, providing services to approximately half
of the age-eligible children.17,18 However, nearly half (123) of the 257 elementary schools do
not yet offer a TK program.
A recent evaluation of the TK program19 found many benefits for young children. Students
who attended TK had an advantage over their peers at kindergarten entry in literacy and
math, and showed greater engagement in their learning according to their teachers. In
addition, the program showed particularly strong and long-lasting effects for low-income
students in math and for English learners in English proficiency skills. Unlike many publicly
subsidized programs, TK eligibility is not based on family income, and the program is free to
all eligible children.
Local Child Care Subsidy Pilot Plan
As noted above, the Local Child Care Subsidy Pilot Plan may also help increase access to
ECE in Santa Clara County. The plan is modeled after other efforts in the San Francisco Bay
Area. For example, in 2003, AB 1326 authorized San Mateo County to develop and
implement a local child care subsidy pilot plan to address how the state of California’s single
statewide income eligibility criteria, reimbursement, and fund restrictions impact ECE
providers and the children and families whom they serve. San Mateo County developed an
individualized plan with limited local flexibility that allowed it to maximize allocated funding
and efficiently use child care subsidy funds in order to better serve the needs of more
children and families.20
As in San Mateo County, the high cost of living in Santa Clara County results in many
families who cannot afford the market rate for ECE and still do not qualify for subsidized
child care. In addition, state reimbursement rates to providers serving subsidized children
are insufficient to cover the true cost of care in the county.21 As a result, some providers in
areas with a high cost of living have shut down their program due to high costs, arguing that
offering subsidized ECE is no longer cost effective. As a result of the decreasing numbers of
children qualifying for subsidized care in the county and the loss of providers due to
inadequate state reimbursement rates, Santa Clara County has not been able to fully utilize
the ECE subsidy funds allocated to the county. According to Santa Clara County’s Local Early
Education Planning Council, approximately $9.3 million per year of potential funds, awarded
through state-subsidized ECE contracts under Title 5, has been returned to the state. These
unused funds mean, of course, that fewer children have been served. For example, $9.3
17 California Department of Education. (2015). Transitional kindergarten program participation (census day) , Sacramento, CA: Author. Retrieved 01/07/16. http://data1.cde.ca.gov/dataquest/tkreports/TkLevels.aspx?cdscode=43000000000000&year=2014-15. 18 SCCOE includes 31 districts but four districts in the county only serve 9-12th grade students (Campbell Union High, Fremont Union High, Los Gatos-Saratoga Joint Union High, and Mountain View-Los Altos Union High). 19 Manship, K., Holod, A., Quick, H., Ogut, B., Brodziak de los Reyes, I., Anthony, J., Jacobson Chernoff, J., Hauser, A., Martin, A., Keuter, S., Vontsolos, E., Rein, E., and Anderson, E. (2017). Transitional kindergarten in California: The impact of Transitional kindergarten on English Learner students. San Mateo, CA: American Institutes for Research. Retrieved from: http://www.air.org/resource/impact-transitional-kindergarten-california-students 20 Office of Assemblyman Rich Gordon. (2016). AB2368: Santa Clara County child care subsidy pilot. Retrieved 2/27/16 from: https://cappa.memberclicks.net/assets/PublicPolicy/2016/Legislation/ab%202368%20fact%20sheet.pdf 21For Regional Market Rates as of 1/1/17: California Department of Social Services (2017). All county letter (ACL) No. 16-70. Sacramento, CA: Author. Retrieved from: http://www.cdss.ca.gov/lettersnotices/EntRes/getinfo/acl/2016/16-70.pdf

34
million could have gone toward serving approximately 1,100 children more children in the
county.22
As with San Mateo County’s AB 1326, Santa Clara County’s AB 2368 will neither increase
nor decrease the total amount of funds provided to Santa Clara County for subsidized ECE.
However, the plan has the potential to increase the county’s ability to use the full allocation
of subsidy funds that it receives and thus ability to serve more children. The upside of the
new plan is that the minimum income threshold will increase and therefore more families
who cannot afford the market cost of care will qualify for subsidized ECE. On the other hand,
the increase in the number of subsidy-eligible children at 85 percent SMI may outpace the
state funds currently available. Thus, over time and without new resources, the number of
unserved eligible children may increase.
Santa Clara County began work on its local child care subsidy pilot plan in early 2017. The
plan was submitted to the local planning council and the Santa Clara County Board of
Supervisors and approved in April 2017.23 At the time this report was finalized, the plan has
yet to receive final approval from the California Department of Education. AB 2368 also
mandates that the county annually prepare and submit to the Legislature, the State
Department of Social Services, and the State Department of Education a report that
contains specified information relating to the success of the county’s plan. The authorization
would end on January 1, 2022.24
22 Office of Assemblyman Rich Gordon. (2016). AB2368: Santa Clara County child care subsidy pilot. Retrieved from: https://cappa.memberclicks.net/assets/PublicPolicy/2016/Legislation/ab%202368%20fact%20sheet.pdf 23 Santa Clara County Board of Supervisors. (2017). The county of Santa Clara California: Report 85082. http://sccgov.iqm2.com/Citizens/Detail_LegiFile.aspx?Frame=&MeetingID=8495&MediaPosition=&ID=85082&CssClass 24 Office of Assemblyman Rich Gordon. (2016). AB2368: Santa Clara County child care subsidy pilot. Retrieved from: https://cappa.memberclicks.net/assets/PublicPolicy/2016/Legislation/ab%202368%20fact%20sheet.pdf

35
Articulation, Alignment, and Data Systems
Some School Districts Working Toward PreK-to-Grade 3 Alignment
Early identification and treatment of learning problems and improved articulation between
ECE and elementary school education are important strategies to promote school readiness
and enhance children’s school performance by third grade. However, alignment between
ECE and elementary education can prove difficult in Santa Clara County. Santa Clara is a
geographically large and densely populated county (with a total of 31 school districts and
approximately 160 school board members25 elected to serve nearly 275,000 K-12 students
as of the 2015-16 school year);26 it has various ECE provider settings and funding streams;
it lacks coordinated data systems; and it has no formal means of communication between
ECE and elementary education (e.g., established joint ECE/elementary advisory groups).
Although considerable work remains to be done around articulation and alignment in the
county, according to one recent study, three of its school districts are well prepared to
pursue alignment work.27 This study used two criteria for selecting districts as strong
candidates to engage in preschool-to-grade 3 alignment: 1) existing systems’ infrastructure
to support this work, such as a backbone organization, champion(s) of alignment, networks
connecting elementary schools to prekindergarten educators, and professional development
infrastructure; and 2) demonstrated interest in alignment among multiple district players. As
presented in Exhibit A-10 below, the study summarized each school district’s readiness for
alignment along five alignment readiness factors: 1) experience with systems and cross-
sector work, 2) leadership and buy-in, 3) existing promising practices, 4) appetite for
innovation and new initiatives, and 5) relationships with funders.
25 Harder+Company. (2016). PreK-3rd grade alignment readiness in Santa Clara County: Brief findings. San Mateo, CA: Silicon Valley Community Foundation Center for Early Learning. 26 California Department of Education. (2016). Enrollment by Grade for 2015-16. County Enrollment by Grade (with district data). Sacramento, CA: Author. Retrieved 2/17/16 from: http://data1.cde.ca.gov/dataquest/ 27 Harder+Company. (2016). PreK-3rd grade alignment readiness in Santa Clara County: Brief findings. San Mateo, CA: Silicon Valley Community Foundation Center for Early Learning.
The 2010 ELMP aimed for system-wide alignment from birth to third grade, including
meaningful child assessments, cross-communication, curriculum alignment, and the goal
that all children perform well in school. Some progress on articulation and alignment has
been made. For example, developmental screening has been made available – if not
uniformly institutionalized – for most children. Efforts have been made to align standards
and curriculum, and one school district has linked early care to its elementary school
database, though this remains the exception and not the norm.

36
Exhibit A-10. Degree of Alignment Readiness for Three County School Districts
Readiness Factor
Readiness Level
Franklin-McKinley
School District
Oak Grove School
District
San Jose Unified
School District
Experience With
Systems and
Cross-sector Work High Low-to-Moderate Low-to-Moderate
Leadership and Buy-In Moderate Low-to-Moderate Moderate
Existing Promising
Practices Moderate Moderate-to-High Moderate-to-High
Appetite for Innovation
and New Initiatives High Moderate High
Relationships With
Funders High Moderate Low Source: Harder+Company. (2016). Prek-3rd grade alignment readiness in Santa Clara County: Brief findings . San Mateo, CA: Silicon Valley Community Foundation Center for Early Learning.
The Percentage of Third Grade Students Meeting or Exceeding ELA and Math
Standards Varies by Economic Status and Ethnicity
One goal of alignment of instruction across ECE programs and early elementary classrooms
is to ensure students’ success in third grade. According to third grade proficiency scores in
English Language Arts (ELA) and math on the 2015-16 California Assessment of Student
Progress and Performance (CAASPP), although there were large performance discrepancies
across districts in both ELA and math on the CAASPP, students tended to perform better in
math compared to ELA: 63 percent of third graders in Santa Clara County met or exceeded
the grade standard in math, compared to 57 percent in ELA.28 There was a wide range of
proficiency across school districts, from 29 percent to 86 percent of third grade students
proficient in ELA. In math, proficiency ranged from 35 percent to 94 percent.
Approximately 30 percent of third grade students in Santa Clara County were in districts with
at least 60 percent of their third grade students meeting ELA proficiency. Approximately 50
percent of third grade students in the county were in districts with at least 60 percent of
their third grade students meeting math proficiency.29
28 Note: Statistical comparisons to the 2009 proficiency data presented in the 2010 ELMP cannot be made here, as CDE implemented a new test in school year 2014-15. 29 California Department of Education. (2016). California Assessment of Student Performance and Progress (CAASPP) data: CAASPP Research Files 2015-16. Retrieved 1/6/17 from: http://caaspp.cde.ca.gov/sb2016/ResearchFileList
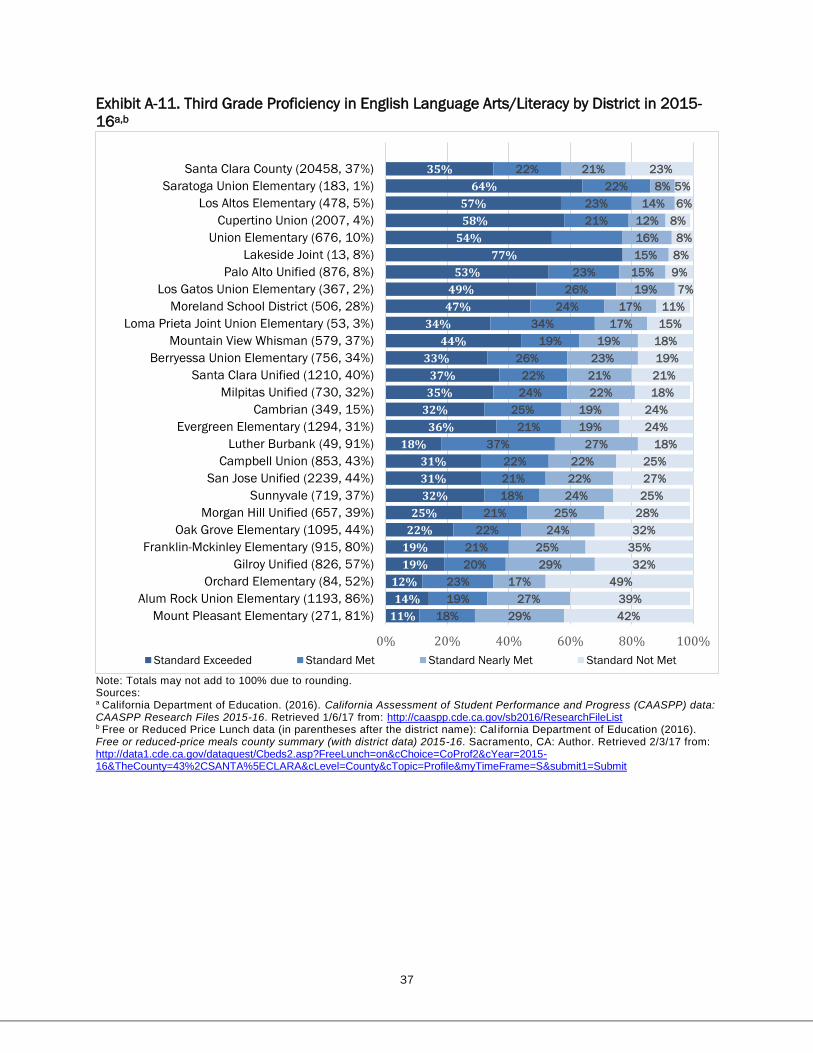
37
Exhibit A-11. Third Grade Proficiency in English Language Arts/Literacy by District in 2015-
16a,b
Note: Totals may not add to 100% due to rounding. Sources: a California Department of Education. (2016). California Assessment of Student Performance and Progress (CAASPP) data: CAASPP Research Files 2015-16. Retrieved 1/6/17 from: http://caaspp.cde.ca.gov/sb2016/ResearchFileList b Free or Reduced Price Lunch data (in parentheses after the district name): Cal ifornia Department of Education (2016). Free or reduced-price meals county summary (with district data) 2015-16. Sacramento, CA: Author. Retrieved 2/3/17 from: http://data1.cde.ca.gov/dataquest/Cbeds2.asp?FreeLunch=on&cChoice=CoProf2&cYear=2015-16&TheCounty=43%2CSANTA%5ECLARA&cLevel=County&cTopic=Profile&myTimeFrame=S&submit1=Submit
11%
14%
12%
19%
19%
22%
25%
32%
31%
31%
18%
36%
32%
35%
37%
33%
44%
34%
47%
49%
53%
77%
54%
58%
57%
64%
35%
18%
19%
23%
20%
21%
22%
21%
18%
21%
22%
37%
21%
25%
24%
22%
26%
19%
34%
24%
26%
23%
21%
23%
22%
22%
29%
27%
17%
29%
25%
24%
25%
24%
22%
22%
27%
19%
19%
22%
21%
23%
19%
17%
17%
19%
15%
15%
16%
12%
14%
8%
21%
42%
39%
49%
32%
35%
32%
28%
25%
27%
25%
18%
24%
24%
18%
21%
19%
18%
15%
11%
7%
9%
8%
8%
8%
6%
5%
23%
0% 20% 40% 60% 80% 100%
Mount Pleasant Elementary (271, 81%)
Alum Rock Union Elementary (1193, 86%)
Orchard Elementary (84, 52%)
Gilroy Unified (826, 57%)
Franklin-Mckinley Elementary (915, 80%)
Oak Grove Elementary (1095, 44%)
Morgan Hill Unified (657, 39%)
Sunnyvale (719, 37%)
San Jose Unified (2239, 44%)
Campbell Union (853, 43%)
Luther Burbank (49, 91%)
Evergreen Elementary (1294, 31%)
Cambrian (349, 15%)
Milpitas Unified (730, 32%)
Santa Clara Unified (1210, 40%)
Berryessa Union Elementary (756, 34%)
Mountain View Whisman (579, 37%)
Loma Prieta Joint Union Elementary (53, 3%)
Moreland School District (506, 28%)
Los Gatos Union Elementary (367, 2%)
Palo Alto Unified (876, 8%)
Lakeside Joint (13, 8%)
Union Elementary (676, 10%)
Cupertino Union (2007, 4%)
Los Altos Elementary (478, 5%)
Saratoga Union Elementary (183, 1%)
Santa Clara County (20458, 37%)
Standard Exceeded Standard Met Standard Nearly Met Standard Not Met

38
Exhibit A-12. Third Grade Proficiency in Math by District in 2015-16 a,b
Note: Totals may not add to 100% due to rounding. Sources: aCalifornia Department of Education. (2016). California Assessment of Student Performance and Progress (CAASPP) data: CAASPP Research Files 2015-16. Retrieved 1/6/17 from: http://caaspp.cde.ca.gov/sb2016/ResearchFileList bFree or Reduced Price Lunch data (in parentheses after the district name): Cal ifornia Department of Education (2016). Free or reduced-price meals county summary (with district data) 2015-16. Sacramento, CA: Author. Retrieved 2/3/17 from: http://data1.cde.ca.gov/dataquest/Cbeds2.asp?FreeLunch=on&cChoice=CoProf2&cYear=2015-16&TheCounty=43%2CSANTA%5ECLARA&cLevel=County&cTopic=Profile&myTimeFrame=S&submit1=Submit
6%
13%
21%
20%
17%
24%
18%
21%
29%
23%
27%
33%
31%
35%
30%
36%
39%
28%
38%
47%
50%
48%
56%
56%
60%
66%
34%
29%
24%
28%
29%
33%
27%
35%
33%
29%
35%
32%
29%
31%
29%
34%
28%
26%
47%
38%
31%
32%
35%
27%
28%
25%
28%
29%
25%
30%
25%
24%
26%
22%
24%
21%
20%
22%
25%
20%
20%
16%
22%
21%
21%
17%
23%
14%
13%
13%
11%
9%
10%
4%
19%
40%
33%
26%
27%
24%
28%
22%
26%
23%
20%
16%
19%
18%
19%
14%
14%
14%
8%
8%
6%
5%
6%
7%
5%
2%
18%
0% 20% 40% 60% 80% 100%
Mount Pleasant Elementary (274, 81%)
Alum Rock Union Elementary (1207, 86%)
Franklin-Mckinley Elementary (922, 80%)
Oak Grove Elementary (1097, 44%)
Gilroy Unified (828, 57%)
San Jose Unified (2250, 44%)
Luther Burbank (49, 91%)
Orchard Elementary (86, 52%)
Campbell Union (867, 43%)
Morgan Hill Unified (655, 39%)
Cambrian (348, 15%)
Santa Clara Unified (1224, 40%)
Sunnyvale (731, 37%)
Evergreen Elementary (1297, 31%)
Berryessa Union Elementary (762, 34%)
Milpitas Unified (735, 32%)
Mountain View Whisman (590, 37%)
Loma Prieta Joint Union Elementary (53, 3%)
Lakeside Joint (13, 8%)
Moreland (510, 28%)
Union Elementary (686, 10%)
Los Gatos Union Elementary (370, 2%)
Los Altos Elementary (490, 5%)
Palo Alto Unified (897, 8%)
Cupertino Union (2069, 4%)
Saratoga Union Elementary (183, 1%)
Santa Clara County (20670, 37%)
Standard Exceeded Standard Met Standard Nearly Met Standard Not Met

39
Children from families that were not economically disadvantaged were more than twice as
likely to meet state math and ELA standards than children from economically disadvantaged
families. Proficiency levels also varied by ethnicity. For example, Black or African-American
and Hispanic or Latino students still performed much lower than Asian and White students
of the same economic status group. For example, only one quarter of economically
disadvantaged Hispanic or Latino students achieved proficiency in third grade ELA, versus
58 percent of Asian students and 40 percent of White students. These trends mirrored the
challenges identified in the 2010 ELMP, which reported that children of Latino and African-
American descent, regardless of income, had lower scores than White and Asian children.30
Exhibit A-13. Third Grade Proficiency in English Language Arts/Literacy by Student Subgroup
in 2015-16
Source: California Department of Education. (2016). California Assessment of Student Performance and Progress (CAASPP) data: CAASPP Research Files 2015-16. Retrieved 1/6/17 from: http://caaspp.cde.ca.gov/sb2016/ResearchFileList
30 Hill Scott, K., Ed. D., Harris, J., & Felice, M. (2010). Santa Clara County early learning master plan (Vol. I). San Jose, CA: Santa Clara County Office of Education. Retrieved from: http://www.sccoe.org/depts/students/early-learning-services/Documents/Master_Plan.pdf
74%
82%
75%
55%51%
31%
58%
40%
33%
25%
0%
10%
20%
30%
40%
50%
60%
70%
80%
90%
100%
All
Students
n =
12153
Asian
n = 4810
White
n = 3602
Black or
African
American
n = 137
Hispanic
or Latino
n = 1945
All
Students
n = 8305
Asian
n = 1032
White
n = 415
Black or
African
American
n = 203
Hispanic
or Latino
n = 6142
Not Economically Disadvantaged Economically Disadvantaged

40
Exhibit A-14. Third Grade Proficiency in Math by Student Subgroup in 2015-16
Source: California Department of Education (2016). California Assessment of Student Performance and Progress (CAASPP) research files 2015-16. Retrieved 1/6/17 from: http://caaspp.cde.ca.gov/
79%
89%
80%
59%55%
38%
68%
49%
32% 32%
0%
10%
20%
30%
40%
50%
60%
70%
80%
90%
100%
All
Students
n =
12319
Asian
n = 4888
White
n = 3641
Black or
African
American
n = 139
Hispanic
or Latino
n = 1952
All
Students
n = 8351
Asian
n = 1054
White
n = 412
Black or
African
American
n = 203
Hispanic
or Latino
n = 6167
Not Economically Disadvantaged Economically Disadvantaged

41
Examples of Key County Resources, Programs, and Initiatives That Address
Articulation and Alignment Between Early Care and Education and Elementary
School
My Brother’s Keeper: San Jose
My Brother’s Keeper: San Jose (MBK: SJ) addresses articulation and alignment between ECE
and elementary education, as well as racial disparities in school achievement. In September
2014, then-president Barack Obama invited local governments across the country to join
the My Brother’s Keeper Community Challenge. The goal of the program is that boys and
young men of color have the opportunity to succeed, regardless of circumstances. The
Silicon Valley Community Foundation partnered with San José Mayor Sam Liccardo to accept
the challenge in January 2015. The initiative has four priorities: 1) entering school ready to
learn, 2) reading at grade level by third grade, 3) graduating high school ready for college
and career, and 4) reducing youth engagement in crime and providing pathways to success
for youth who have interacted with the criminal justice system.31
The Strategic Plan for MBK: SJ was developed in fall 2016 and expected to be implemented
in late 2017. The MBK: SJ plan set many targets, including the following: 1) increase the
percentage of students entering kindergarten demonstrating learning readiness, 2) expand
access to and participation in quality early education programs for boys of color, 3) increase
the percentage of third graders demonstrating reading proficiency, and 4) eliminate
disparities among third grade boys of color in reading proficiency. Given the common timing
and similar goals between MBK: SJ and the 2017 ELMP, collaboration between the two
efforts should be considered. For example, as with the Articulation, Alignment, and Data
Systems Workgroup, some recommendations for achieving the MBK: SJ’s goals focus on
data use and coordination (e.g., expanding the collection, use, and coordination of data and
developing, and using technology, online platforms, and mobile apps to amplify outreach
and information and access to programs and services).32
Data Integration
A key aspect of articulation and alignment is data integration among ECE settings and with
the K-12 system; however, a lack of a common data system and unique identifiers has long
impeded data integration in the county – and across the state. Multiple data
systems/programs are utilized in the ECE field (e.g., ChildPlus; Controltec – CenterTrack;
NoHo; Excel spreadsheets; MCT – Care Control or Care Attendance; DRDP Tech; Learning
Genie); however, not all of them communicate with each other or with the K-12 data system.
31 Office of Mayor Sam Liccardo, City of San José Silicon Valley Community Foundation, and Applied Survey Research. (2015). My Brother’s Keeper: San José working together to ensure boys and young men of color thrive: A policy and program review and a framework for action. Retrieved from: https://www.sanjoseca.gov/DocumentCenter/View/48175 32City of San Jose and Silicon Valley Community Foundation. (2016). My Brother’s Keeper: San José: Working together to ensure boys and young men of color thrive: Local action plan. San Jose, CA: Authors. Retrieved from: https://www.siliconvalleycf.org/sites/default/files/publications/mbk-sj-report-and-action-plan.pdf

42
Stakeholders want to move toward an integrated ECE data system in which information can
be shared with SCCOE’s data warehouse (DataZone)33 and in which real-time data are
available to providers on their progress in QUALITY MATTERS. iPinwheel is not currently used
in the ECE system, nor linked to DataZone as of this writing; however, according to some
ECE stakeholders, that is the expectation moving forward. iPinwheel provides
synchronization with DRDP Tech, the Aeries Student Information System, Childcare Manager,
ESchool, Kindertrack, PowerSchool, Procare, PROMIS, Synergy, Zangle, Q, and Learning
Genie. And because iPinwheel will synchronize with ChildPlus by the end of June 2017, the
hope is to promote it as the QUALITY MATTERS data system to support participating
providers in their site operation and QUALITY MATTERS implementation.
Silicon Valley Regional Data Trust
The Silicon Valley Regional Data Trust (SVRDT) intends to bring together data from
numerous public agencies in Santa Clara County and two other Bay Area counties (San
Mateo County and Santa Cruz County) that service children and families, including public
school districts, public health, child and family services, mental health, juvenile
justice/probation, and education technology companies. According to its website, “SVRDT is
a regionally based, nationally grounded collaborative research organization dedicated to
building a well-managed regional data trust that overcomes the limitations of siloed data
systems and resolves privacy and trust issues, combining data from numerous public
agencies that service children and families, to provide a comprehensive understanding of
factors contributing to student failure and success.”
With guidance from expert counsel, SVRDT intends to develop guidelines for the Regional
Data Trust that define and govern what is allowable under privacy regulations such as
FERPA, HIPAA, and COPPA, and will develop data-sharing agreements that accordingly
protect students’ privacy and confidentiality. Because the ultimate goal of SVRDT is to
create a personal blueprint for students that clarifies the myriad factors influencing their
lives and from that to improve the effectiveness of services and academic outcomes, this
work has goals that are similar to the ELMP’s, and could inform the work of the ELMP.
Transitional Kindergarten
Since implementation of TK statewide, SCCOE has been working to leverage the program to
foster kindergarten readiness and support alignment among TK teachers, preschool
teachers, and kindergarten teachers. For example, in July 2016, SCCOE held a “Pre-K, TK, K
Symposium 2016.” During this three-day workshop, teachers explored the developmental
learning continuum from prekindergarten to kindergarten in the social-emotional
development, science, math, English Language Arts (ELA), English Language Development
(ELD) and creative arts domains.34 These joint professional development sessions provide a
key opportunity for articulation and alignment between the ECE and K-12 systems.
33 DataZone is a resource available to all school districts in Santa Clara County. According to SCCOE, its DataZone data warehouse “saves valuable time for administrators and teachers with complete data integration, automated data loads, easy-to-use prebuilt dashboards and rapid implementation times.” Santa Clara County Office of Education. (2017) Santa Clara County Office of Education DataZone. San Jose, CA: Author. Retrieved from: http://www.sccoe.org/depts/isc/ISC%20Resources/Santa%20Clara%20County%20DW%20FAQ.pdf 34 Santa Clara County Office of Education. (2016). Together for kinder readiness. San Jose, CA: Author. Retrieved from: http://www.sccoe.org/depts/students/early-learning-services/Documents/Flyer%203%20LC%20-%20Symposium%20July%2019-21.pdf

43
Facilities
More Progress Needs to Be Made Toward Addressing Child Care “Deserts”
One approach to facilities asset mapping is to identify communities with the lowest
percentage of capacity in child care centers for three- and four-year-olds by identifying “child
care deserts.” According to the Center for American Progress, a “child care desert” is
defined as a zip code with at least 30 children and either no licensed child care centers or
so few centers that there are more than three times as many children as there are spaces in
centers.35 Using this definition, Exhibit A-15 shows an example of potential “child care
deserts” in Santa Clara County. If funds for building new facilities are limited, a second step
in this analysis might be to analyze the number of low-income children who qualify for
subsidized care in those identified child care deserts. For example, as shown in the exhibit,
while zip code 95053 (Santa Clara) had no licensed, center-based capacity for three- and
four-year-olds in 2014, only 18 percent of the preschool-age children were income-eligible
for publicly funded programs. In contrast, in 2014, while zip code 95138 (San Jose) had
enough slots for approximately 12 percent of its total population of preschool-age children,
an estimated 25 percent of its preschoolers had low enough family incomes to qualify for
subsidized care and thus this zip code might be one example of a priority area for building
new facilities.
A comparison of this child care desert analysis to the gaps identified in the 2010 ELMP
reveals that while some progress has been made in addressing areas without sufficient
spaces in child care centers since the last plan, much work remains to be done. For
example, one zip code in Palo Alto (94303) was identified as having a “severe shortage” of
child care in the 2010 ELMP but there no longer appears to be a shortage as of 2014. In
contrast, several zip codes in San Jose that were identified as having severe shortages in
the 2010 ELMP are still identified as child care deserts (e.g., 95131, 95111, 95127,
95148), as shown in Exhibit A-15.
It is important to consider potential limitations in the child care “desert” approach to needs
assessment. First, the child care desert analysis only includes the capacity of child care
35 Rasheed, M., Hamm, K, Adamu, M., & Morrissey, T. (2016). Child care deserts: An analysis of child care centers by zip code in 8 states. Washington, DC: Center for American Progress. Retrieved 2/24/17 from: https://www.americanprogress.org/issues/early-childhood/reports/2016/10/27/225703/child-care-deserts/.
The 2010 ELMP set a goal that by 2017, there would be a coordinated, integrated
sustainable system to ensure the planning and funding needs for quality facilities for all
birth-to-eight-year-olds in Santa Clara County are met. The county established an Early
Learning Facilities Coalition to help ensure the development and maintenance of early
learning facilities in the first years after the development of the 2010 ELMP, and is now
acting on the primary facility-related recommendation from that plan – namely,
contracting for an Early Learning Facilities Study to inventory resources, complete asset
mapping, and list barriers and potential strategies to overcome them. Although some
progress in addressing child care “deserts” has been made since the 2010 ELMP, much
work remains to be done.

44
centers – not family child care homes. If, for example, one considers the capacity in family
child care homes in zip code 95111, there are enough spaces for 30 percent of the
population. Second, the approach does not include the capacity of TK, which, as noted
above, is a school-based program for age-eligible four-year-olds. For example, in zip code
95132, where there are only licensed center-based slots for 21 percent of the children, the
capacity would rise to 36 percent if a TK program were implemented for the estimated 159
children eligible. Third, parents, especially those of infants and toddlers, may prefer child
care arrangements near their workplace instead of their home. For example, as shown in
Exhibit A-15 below, while zip code 94035 on Moffett Field’s NASA Ames Research Center36
had no young children, it did have a child care center with the capacity to serve 53 children.
In addition, as also pointed out in the 2010 ELMP, the absence of preschool or other
licensed ECE facilities in one zip code may not take into account the presence of a cluster of
high-quality facilities in an adjacent zip code. Nevertheless, the concept of a “child care
desert” deserves more analysis. Exhibits A-15 and A-16 below could serve as starting points
for more in-depth research. For example, focus groups with parents or child care providers
could help determine whether or not the absence of facilities in particular zip codes poses
real problems for families.
36 http://www.ameschildcare.org/contacts/

45
Exhibit A-15. Preschool (Three- and Four-Year-Old) Child Care “Deserts,” by Zip Code, 2014a
City Zip
Code
“Child
Care
Desert”b
Child Population Licensed Capacitye Transitional Kindergartenf
Total c
Subsidy
Eligible at
70% SMId
Centers Family Child Care Homes Total
Estimated
Eligibility Enrollment
Slots
% of
Population
With Slots
Slots
% of
Population
With Slots
Slots
% of
Population
With Slots
Los Gatos 95033 x 100 49 0 0% 7 7% 7 7% 8 4
Santa Clara 95053 x 62 11 0 0% 0 0% 0 0% 0 0
San Jose 95138 x 582 146 37 6% 34 6% 71 12% 34 0
San Jose 95121 x 1,149 359 101 9% 248 22% 349 30% 162 103
San Martin 95046 x 210 87 21 10% 28 13% 49 23% 21 0
San Jose 95111 x 1,806 415 230 13% 314 17% 544 30% 204 126
San Jose 95148 x 1,179 335 154 13% 359 30% 513 44% 171 97
San Jose 95131 x 792 59 146 18% 94 12% 240 30% 117 122
San Jose 95139 x 184 19 34 18% 20 11% 54 29% 18 0
Los Gatos 95030 x 300 48 59 20% 0 0% 59 20% 26 15
San Jose 95132 x 1,073 129 230 21% 252 23% 482 45% 159 0
Sunnyvale 94085 x 664 84 157 24% 90 14% 247 37% 47 54
Sunnyvale 94089 x 600 76 153 25% 118 20% 271 45% 40 31
Los Altos 94022 x 457 61 120 26% 12 3% 132 29% 86 49
San Jose 95127 x 1,401 444 362 26% 353 25% 715 51% 295 259
San Jose 95123 x 1,645 203 442 27% 285 17% 727 44% 233 145
San Jose 95133 x 683 284 203 30% 86 13% 289 42% 49 28
Santa Clara 95050 x 1,015 183 315 31% 135 13% 450 44% 97 50
Gilroy 95020 1,877 790 636 34% 341 18% 977 52% 257 109
San Jose 95130 372 117 132 35% 76 20% 208 56% 115 18
Santa Clara 95054 660 119 271 41% 172 26% 443 67% 80 29
San Jose 95116 1,516 676 620 41% 101 7% 721 48% 235 122
San Jose 95126 921 305 393 43% 48 5% 441 48% 47 0
San Jose 95110 562 180 249 44% 110 20% 359 64% 110 19
San Jose 95120 1,003 108 445 44% 119 12% 564 56% 158 83
San Jose 95122 1,707 618 776 45% 227 13% 1003 59% 211 141
Morgan Hill 95037 1,491 628 706 47% 164 11% 870 58% 164 107
San Jose 95112 1,649 581 773 47% 153 9% 926 56% 179 136
San Jose 95125 1,619 339 814 50% 118 7% 932 58% 272 158

46
City Zip
Code
“Child
Care
Desert”b
Child Population Licensed Capacitye Transitional Kindergartenf
Total c
Subsidy
Eligible at
70% SMId
Centers Family Child Care Homes Total
Estimated
Eligibility Enrollment
Slots
% of
Population
With Slots
Slots
% of
Population
With Slots
Slots
% of
Population
With Slots
San Jose 95136 1,172 196 590 50% 216 18% 806 69% 90 49
Mountain View 94041 327 44 181 55% 25 8% 206 63% 25 23
San Jose 95117 805 251 439 55% 83 10% 522 65% 87 26
San Jose 95134 432 77 294 68% 27 6% 321 74% 1 0
San Jose 95118 847 127 616 73% 179 21% 795 94% 130 115
Mountain View 94043 697 94 514 74% 127 18% 641 92% 70 25
Mountain View 94040 812 109 612 75% 51 6% 663 82% 125 75
Cupertino 95014 1,435 227 1095 76% 355 25% 1450 101% 191 4
San Jose 95135 618 155 469 76% 117 19% 586 95% 51 49
Santa Clara 95051 1,540 267 1184 77% 210 14% 1394 91% 236 52
Palo Alto 94301 418 56 330 79% 20 5% 350 84% 39 0
Alviso 95002 65 7 55 85% 6 9% 61 94% 22 0
San Jose 95128 991 346 844 85% 122 12% 966 97% 59 21
Sunnyvale 94086 1,426 181 1277 90% 267 19% 1544 108% 139 64
Palo Alto 94303 495 105 466 94% 67 14% 533 108% 69 34
Palo Alto 94306 654 88 626 96% 69 11% 695 106% 123 0
San Jose 95129 1,036 329 1020 98% 240 23% 1260 122% 239 3
San Jose 95124 1,289 218 1287 100% 261 20% 1548 120% 194 76
Milpitas 95035 1,858 139 1878 101% 306 16% 2184 118% 248 147
Saratoga 95070 718 116 725 101% 39 5% 764 106% 114 35
Palo Alto 94305 341 46 352 103% 0 0% 352 103% 43 0
Campbell 95008 1,237 365 1421 115% 175 14% 1596 129% 155 70
Los Altos 94024 549 74 643 117% 50 9% 693 126% 99 2
Sunnyvale 94087 1,682 215 1969 117% 293 17% 2262 134% 258 44
Stanford 94304 92 11 118 128% 0 0% 118 128% 1 0
Los Gatos 95032 593 102 917 155% 41 7% 958 162% 106 30
San Jose 95119 269 29 517 192% 55 20% 572 213% 65 53
Mountain View 94035 0 0 53 0 53 0 0
Milpitas 95036 0 0 22 0 22 0 0
Coyote 95013 4 1 0 0% 0 0% 0 0% 0 0

47
City Zip
Code
“Child
Care
Desert”b
Child Population Licensed Capacitye Transitional Kindergartenf
Total c
Subsidy
Eligible at
70% SMId
Centers Family Child Care Homes Total
Estimated
Eligibility Enrollment
Slots
% of
Population
With Slots
Slots
% of
Population
With Slots
Slots
% of
Population
With Slots
San Jose 95113 25 8 0 0% 3 12% 3 12% 0 0
Mount
Hamilton 95140
6 2 0 0% 0 0% 0 0% 0 0 a Excludes zip codes in which there are no three- or four-year-olds. b A “child care desert” is defined as a zip code with at least 30 children (in the “Child Population Total” colum n) and capacity in child care centers for less than one-third of these children (less than 33 percent in the “% of population with slots” column for “Centers”). c Source: American Community Survey, Public Use Microdata Sample (PUMS) five-year data file, 2014, produced by American Institutes for Research in the Early Learning Needs Assessment Tool (www.elneedsassessment.org) d Source: American Community Survey, Public Use Microdata Sample (PUMS) one-year data file, 2014, produced by American Institutes for Research in the Early Learning Needs Assessment Tool (www.elneedsassessment.org) e Source: California Child Care Resource and Referral Network’s 2014 supply data shared with AIR on 5/5/17. Red font in the “Centers” column indicates those zip codes that are child care deserts. f Source: California Department of Education. (2015). Transitional kindergarten program participation (census day) , Sacramento, CA: Author. Retrieved 01/07/16 from: http://data1.cde.ca.gov/dataquest/tkreports/TkLevels.aspx?cdscode=43000000000000&year=2014-15.

48
Exhibit A-16. Preschool (Three- and Four-Year-Old) Child Care “Deserts,” by Zip Code, 2014
Source for Map: American Institutes for Research, based on data compiled from the sources cited below. Notes: A “child care desert” is defined as a zip code with at least 30 children (in the “Child Population Total” column) and capacity in child care centers f or less than one-third of these children. Sources: Population: American Community Survey, Public Use Microdata Sample (PUMS) five-year data file, 2014, produced by American Institutes for Research in the Early Learning Needs Assessment Tool (www.elneedsassessment.org) Capacity: California Child Care Resource and Referral Network’s 2014 supply data shared with AIR on 5/5/17. Red font in the “Centers” column indicates those zip codes that are child care deserts.

49
Changes to Child Care Programs Affect Facility Priorities
The federally funded Head Start program in Santa Clara County is moving from part-day hours
that have accommodated double sessions to full-day services. As a result, SCCOE estimates that
there will be a need for five additional Head Start classrooms; the initial cost for each classroom
is estimated to be $750,000.
Examples of Key County Resources, Programs and Initiatives That Address
Facilities
Early Learning Facilities Study
The Santa Clara County Early Learning Facilities Study (ELFS) will provide critical information for
the county in planning facilities. With the help of a consulting firm and a local advisory group,
SCCOE is conducting the study to understand the supply of existing ECE facilities, including
preschool classrooms and child care centers and the demand for new facilities. The facility
needs assessment includes all eligible three- and four-year-olds to be served in public preschool
programs, and the opportunities and challenges associated with developing ECE facilities in
Santa Clara County. One of the study’s goals is to assess the capacity and condition of existing
child care and early education centers. A second goal is to explore potential new spaces and
sites for future centers, and identify opportunities to partner with public and private entities to
develop new facilities. Finally, the study identifies the barriers that prevent the improvement or
expansion of existing facilities, as well as the development of new facilities.37 The findings of the
ELFS will be available in late 2017.
37 Santa Clara County Office of Education. (2017). Request for proposal for Santa Clara County early learning facilities study for the office of superintendent. San Jose, CA: Author. Retrieved 2/27/17 from: http://legacy.sccoe.org/docs/biddocs/RFP23-16-17%20EARLY%20LEARNING%20FACILITIES%20STUDY.pdf

50
Family Engagement
Child Care Setting Preferences Vary by Age of Child
Engaging families in ECE is important in ensuring that their needs are being met. Assessing
families’ “demand” or “need” for ECE differs based on several factors, including the purpose of
the care, the type of child care setting, the work status of the child’s parents, family income, and
the age of the child. In 2013, the Santa Clara Local Planning Council (LPC) conducted a needs
assessment using local demographic information, national child care use patterns from the
National Survey of American Families, and information about child age, family income, the
workforce participation of families, and ethnicity.38 However, as the LPC assessment pointed out,
it is important to consider several caveats in interpreting these findings.
The purpose of the child care and the age of the child are key factors that influence parents’
child care needs. For example, parents of preschool-age children might prefer more formal
arrangements for their children that they believe support their children’s kindergarten readiness.
As shown in Exhibits A-17 and A-18, for preschoolers, demand rates for center-based child care
were similar, regardless of poverty levels or parent workforce status (ranging from 36 percent to
44 percent). In contrast, regardless of poverty levels or parent workforce status, 72 percent or
more of parents preferred informal care for their infants and toddlers.
38 To obtain the child care demand estimates, child care usage was first estimated by applying the child care use patterns by child care type for various child and family subpopulations (i.e., child’s age, income, parent workforce participation, and ethnicity) from the National Survey of American Families (NSAF) to the population in Santa Clara (as reported in American Community Survey Public Use Microdata). Next, findings from the National Household Education Survey (NHES) were used to estimate unmet demand for infants/toddlers and preschoolers not using child care, but would if a high-quality, affordable child care was available (based on the question from the NHES: "Some parents prefer to stay home to care for their children. Others choose to have care arrangements with someone other than a parent. If you could find high-quality, affordable child care by a relative, non-relative, or in a daycare or preschool program, would you choose to place child in one of these kinds of arrangements?”). School-age children using “self-care” were also categorized in the unmet need group. Finally, these child care demand estimates (child care use and unmet need) are applied to current and project populations, as reported by the State Department of Finance. See the Appendix for additional details and a graphic summary of the demand methodology used to inform the 2008 LPC Needs Assessment.
The 2010 ELMP set a goal of establishing a workgroup to help inspire and support family
engagement in each child’s education and development. The county has met that goal by
establishing a Family Engagement and Leadership Working Committee.
The county also recognizes that a key aspect of family engagement is to solicit input from
families about their needs and include their perspectives in program planning. In 2013,
the Local Planning Council surveyed parents to determine the types of ECE they prefer. A
majority of working parents of infants and toddlers indicated a preference for informal
arrangements, whereas working parents of preschoolers preferred some type of formal
program. The picture is mixed for parents of school-age children, with some indicating
formal and others informal services. However, for all age groups, it is not clear that
families, in their decision-making, can give priority to program quality. Other factors, such
as work hours and transportation, as well as cost, influence their decisions. It is also not
clear that families, policymakers, and providers agree on the components of quality. In
addition, many families may actually want a mixture of formal and informal
arrangements.

51
Parents’ work status also drives child care need and usage. As shown in Exhibits A-17 and A-18,
based on the LPC study, the 2013 patterns for child care usage and need tended to be similar
within age groups in households in which all parents were working, regardless of the families’
income levels. For example, parents of infants/toddlers and school-age children, regardless of
income, preferred informal arrangements.
Family income impacts the selection of a child care setting. As shown in Exhibits A-17 and A-18,
greater percentages of parents of infants/toddlers, preschoolers, and school-age children at less
than 200 percent of the poverty threshold preferred informal care than did parents of
infants/toddlers, preschoolers, and school-age children at greater than 200 percent of poverty.
First, without subsidized care, affordability becomes a significant barrier to child care. Thus, the
type of care families “prefer” depends partially on what they can afford. For example, the fact
that two-worker or single-parent working households below 200 percent of poverty rely more on
relative care may indicate that they simply prefer relative care, but it may also reflect the lower
cost of relative care, a desire to provide some income to the relative in the form of a subsidy
payment, or a need for child care during the nontraditional hours often associated with lower
wage work. This trend might be impacted by affordability; center-based care and family child care
homes are more expensive than informal care arrangements.
It is also possible that some working parents need more than one arrangement – for example, a
part-day preschool program in a formal setting and informal care – to address their hours of
work.
Exhibit A-17. Demand by Income and Setting, All Parents Working, 2013
Income Level Type of Setting Infant/Toddler Preschool School-Age
<200% of Poverty
Center Care 10% 41% 14%
Family Child
Care Home 14% 11% 10%
Home/Relative* 56% 36% 33%
Parent Only 20% 13% 43%
>200% of Poverty
Center Care 14% 44% 23%
Family Child
Care Home 15% 15% 8%
Home/Relative* 51% 33% 35%
Parent Only 21% 9% 34%
*Includes the following primary care arrangements: relative, out of child’s home; relative, in child’s home; and non -relative in child’s home. Source: The Office of the Superintendent, Administrative Services of the Santa Clara County Office of Education. (2013). 2013 Santa Clara County child care needs assessment. Santa Clara, CA: Local Early Education Planning Council of Santa Clara County.

52
Exhibit A-18. Demand for Child Care by Family Income and Child Care Setting, At Least One
Parent Not Working, 2013
Income Level Type of Setting Infant/Toddler Preschool School-Age
<200% of Poverty
Center Care 4% 36% 9%
Family Child
Care Home 8% 4% 2%
Home/Relative* 49% 29% 15%
Parent Only 39% 31% 74%
>200% of Poverty
Center Care 7% 42% 7%
Family Child
Care Home 5% 5% 2%
Home/Relative* 37% 26% 25%
Parent Only 51% 27% 66%
*Includes the following primary care arrangements: relative, out of child’s home; relative, in child’s home; and non -relative in child’s home.
Source: The Office of the Superintendent, Administrative Services of the Santa Clara County Office of Education. (2013). 2013 Santa Clara County child care needs assessment. Santa Clara, CA: Local Early Education Planning Council of Santa Clara County.
Examples of Key County Resources, Programs, and Initiatives That Address Family
Engagement
FIRST 5 Santa Clara County Family Engagement Coordinator
A recent development that highlights the county’s commitment to partnering with families is
FIRST 5 Santa Clara County’s hiring of a full-time Family Engagement Coordinator to support the
implementation of the Strengthening Families Framework.
Community Child Care Council of Santa Clara County
The mission of the county’s resource and referral agency (i.e., the Community Child Care Council
of Santa Clara County, or 4Cs) is “to provide assistance to parents and child care providers to
ultimately promote the welfare of children.” To achieve that mission, the resource and referral
agency offers various services. For example, the 4Cs helps families find child care providers that
meet their needs. It administers several programs [e.g., CalWORKs Stage 2, CalWORKs Stage 3,
the California Alternative Payment Program (CAPP)] to help eligible families pay for child care
services while they work, seek employment, or go to school. 4Cs also offers parent workshops
and training opportunities (in English and Spanish) and provides referrals to other parent
trainings and workshops offered in the community.39
Family Resource Centers
The county promotes family engagement through Family Resource Centers (FRCs). For example,
FIRST 5 Santa Clara County funds a number of FRCs, operated by The Health Trust, Catholic
Charities of Santa Clara County, and SJB Child Development Centers, that offer free programs
and services designed to strengthen families and promote children’s kindergarten readiness.
39 Community Child Care Council of Santa Clara County. (2017). Services overview. San Jose, CA: Author. Retrieved 2/28/17 from: http://www.4c.org/parent/

53
Services at the resource centers focus on four areas: 1) school readiness (e.g., developmental
screenings; early literacy programs; art enrichment; support groups for parents and caregivers of
infants); 2) nutrition and wellness (e.g., sports skills development; oral health education; breast
feeding support; low-cost fresh fruits and vegetables); 3) parent and family education; and 4)
information and community resources [e.g., health insurance enrollment; referrals to other
community programs and services).40
40 Health Trust. (2017). Family resource center initiative. San Jose, CA: Author. Retrieved from: http://healthtrust.org/services/learning-together-initiative/

54
Program Quality
A Large Proportion of Assessed Programs With High QUALITY MATTERS Ratings
The 2010 ELMP set a target for the county to have three quarters of its ECE programs serving
preschool-age children participate in a Quality Rating and Improvement System (QRIS). Since
2010, the county has made considerable progress in establishing and implementing QUALITY
MATTERS to assess program quality. As shown in Exhibit A-19, as of early February 2017, of the
approximately 2,500 licensed centers and family child care homes in Santa Clara County, 140
had been assessed.41 Across all settings, the majority of the rated programs had “Gold” (Tier 4)
ratings (44 percent) or “Silver” (Tier 3) ratings (22 percent).
The county has made the greatest progress assessing child care centers versus family child care
homes (see Exhibit A-19). Of the 140 assessed programs, the majority (78 percent) were child
care centers. Of the 109 child care centers with a rating, the majority (56, or 51 percent) had
“Gold” (Tier 4) ratings. Most of the QUALITY MATTERS-assessed centers are either State
Preschool or Head Start sites, which have their own relatively high-quality standards in
comparison to licensing requirements and thus are more likely to get higher scores. In contrast,
only 30 family child care homes in the county had a rating, and of these, the majority (16, or 53
percent) had “Bronze” ratings (Tier 2).
QUALITY MATTERS sets high standards, but because the assessment process is costly and labor-
intensive, funding has only been sufficient to assess approximately 17 percent of all licensed
centers and 2 percent of all licensed family child care homes in the county.
41 Number of programs: California Child Care Resource and Referral Network. (2015). 2015 California child care portfolio. San Francisco, CA: Author. Retrieved 2/25/17 from: https://d3n8a8pro7vhmx.cloudfront.net/rrnetwork/pages/204/attachments/original/1456339909/Santa_Clara__County__2.23.2016.pdf?1456339909 Number of rated programs in QRIS: First 5 Santa Clara County, as of 2/2/2017. Additional data available from: First 5 Santa Clara. (2017). QRIS participant current rating by site. San Jose, CA: Author. Retrieved from: http://www.first5kids.org/early-learning/qris-list
The 2010 ELMP set a goal of having 75 percent of Santa Clara County’s ECE programs
serving three- and four-year-olds participate in a Quality Rating and Improvement System
(QRIS). Santa Clara County has made great strides in establishing and implementing its QRIS,
“QUALITY MATTERS …a STRONG START for kids” (QUALITY MATTERS). Fifty-six percent of the
assessed programs (78 of 140) are rated at the top two levels; however, funding has only
been sufficient to assess approximately 17 percent of all licensed centers and 2 percent of
all licensed family child care homes in the county. In addition, 45 centers are accredited by
the NAEYC and 123 elementary schools have TK programs; NAEYC-accredited programs
meet some of the criteria for the highest ranked programs in QUALITY MATTERS, and TK
programs excel on the workforce qualification components of QUALITY MATTERS.
However, most children still attend programs only required to meet state licensing
requirements that are intended to protect children’s safety but not to address program
quality, and hence the actual quality of most ECE programs, particularly those serving infants
and toddlers, is still unknown.

55
Exhibit A-19. QUALITY MATTERS Participant Ratings by Type of Setting in Santa Clara County, as of February 2017
Rating
Descriptiona
Number of Centers With Ratingb
Number of Family Child Care
Homes With Ratingb
Number of Centers/Family
Child Care Homes With
Ratingb Total Number of Rated Sitesb
Blended
Public
only Unknown Total Blended
Public
only Total Blended
Public
only Total Blended
Public
only Unknown Total
Excellence in
Quality
Standards
(Platinum) 4 11 0 15 1 0 1 0 1 1 5 12 0 17
Exceeding
Quality
Standards
(Gold) 24 29 3 56 4 1 5 0 0 0 28 30 3 61
Achieving
Quality
Standards
(Silver) 11 7 5 23 8 0 8 0 0 0 19 7 5 31
Committed to
Quality
Improvement
(Bronze) 1 1 2 4 13 3 16 0 0 0 14 4 2 20
Rating In
Progress 0 4 7 11 0 0 0 0 0 0 0 4 7 11
Totals 40 52 17 109 26 4 30 0 1 1 66 57 17 140 a Rating Description according to First 5 Santa Clara. (2017). QRIS participant current rating by site. San Jose, CA: Author. Retrieved from: http://www.first5kids.org/early-learning/qris-list. Note: First 5 Santa Clara County’s ratings map to the statewide rating system [California Department of Education. (2017). RTT-ELC quality continuum framework rating matrix quality continuum framework rating matrix with elements and points for consortia common tiers 1, 3, and 4. Sacramento, CA: Author. Retrieved from: http://www.cde.ca.gov/sp/cd/rt/caqrisratingmatrix.asp] as follows: Tier 2 = Committed to Quality Improvement (Bronze) Tier 3 = Achieving Quality Standards (Silver) Tier 4 = Exceeding Quality Standards (Gold) Tier 5 = Excellence in Quality Standards (Platinum) b Source: First 5 Santa Clara County, as of 2/2/2017. Additional data available from: First 5 Santa Clara. (2017). QRIS participant current rating by site. San Jose, CA: Author. Retrieved from: http://www.first5kids.org/early-learning/qris-list

56
Exhibit A-20. QUALITY MATTERS Participant Ratings, by Zip Codes in Which There Were
QUALITY MATTERS Sites in Santa Clara County as of February 2017a, b
Zip
Code
Excellence
in Quality
Standards
(Platinum)b
Exceeding
Quality
Standards
(Gold)b
Achieving
Quality
Standards
(Silver) b
Committed
to Quality
Improvement
(Bronze) b
Rating In
Progress b
Total
Number
of Rated
Sites in
Zip Code b
Total
Number
of
Licensed
Child
Care
Centers in
Zip Code c
Licensed
Center
Capacity
(3-4) in
Zip Codeb
94041 1 (Center) 0 0 0 0 1 3 181
94043 2 (Centers) 0 0 0 0 2 13 514
94085 0 1 (FCCH) 1 (FCCH) 0 0 2 2 157
94086 1 (Center) 2 (Centers) 0 0 0 3 17 1,277
94087 0 0 1 (Center) 0 0 1 30 1,969
94089 0 2 (Centers) 0 0 0 2 4 153
95002 0 1 (Center) 0 0 0 1 1 55
95008 0 0 1 (Center) 2 (Centers) 0 3 25 1,421
95014 1 (Center) 0 1 (Center) 0 0 2 28 1,095
95020 1 (Center) 3 (Centers) 1 (Center) 0
3
(Centers) 8 18 636
95035 0 1 (Center) 1 (Center) 1 (FCCH) 0 3 33 1,878
95037 0 0 1 (FCCH) 0 0 1 20 706
95046 0 1 (Center) 0 0 0 1 1 21
95050 0 1 (Center) 0 0 0 1 11 315
95051 0 4 (Centers) 1 (FCCH) 0 0 5 22 1,184
95054 0 3 (Centers) 0 0 0 3 7 271
95070 0 1 (Center) 1 (Center) 0 0 2 15 725
95110 1 (Center)
2 (1 Center,
1 FCCH) 1 (FCCH) 0 0 4 6 249
95111 3 (Centers) 2 (Centers) 1 (FCCH) 4 (FCCHs)
2
(Centers) 12 7 230
95112 2 (Centers) 4 (Centers) 1 (Center) 0 1 (Center) 8 19 773
95116 1 (Center)
4 (3 Centers)
(1 FCCHs) 0 1 (FCCH) 0 7 18 620
95117 0 2 (Centers) 0 0 0 2 11 439
95118
1 (FCCH/
Center) 4 (Centers) 0 0 0 5 16 616
95119 0 0 1 (Center) 0 0 1 7 517
95120 0 0 0 1 (FCCH) 0 1 14 445
95121 0 1 (FCCH) 0 0 0 1 4 101
95122 2 (Centers) 5 (Centers)
4 (3
Centers,
1 FCCH) 2 (FCCHs) 1 (Center) 14 19 776
95123 0 1 (FCCH) 3 (Centers) 1 (FCCH) 1 (Center) 6 12 442
95124 0 0 1 (FCCH) 1 (FCCH) 0 2 29 1,287
95125 0 4 (Centers) 1 (Center) 0 0 5 23 814
95126 0 1 (Center) 0 0 0 1 11 393
95127 1 (FCCH) 4 (Centers) 3 (Centers)
2 (1 Center)
(1 FCCH) 0 10 14 362
95128 0 1 (Center) 0 1 (Center) 1 (Center) 3 12 844
95130 0 0 0 0 1 (Center) 1 4 132

57
Zip
Code
Excellence
in Quality
Standards
(Platinum)b
Exceeding
Quality
Standards
(Gold)b
Achieving
Quality
Standards
(Silver) b
Committed
to Quality
Improvement
(Bronze) b
Rating In
Progress b
Total
Number
of Rated
Sites in
Zip Code b
Total
Number
of
Licensed
Child
Care
Centers in
Zip Code c
Licensed
Center
Capacity
(3-4) in
Zip Codeb
95131 0 0 2 (Centers) 0 0 2 4 146
95132 0 1 (Center) 0 0 0 1 9 230
95133 0 2 (Centers) 1 (Center) 0 0 3 6 203
95134 0 0 0 1 (FCCH) 0 1 3 294
95136 0 1 (Center)
3 (2
Centers,
1 FCCH) 1 (FCCH) 1 (Center) 6 13 590
95148 0 1 (Center) 0 2 (FCCHs) 0 3 5 154
Totals 17 61 31 20 11 140 516 23,215 a
Note: The following presents how First 5 Santa Clara County’s ratings map to the statewide rating system [California Department of Education. (2017). RTT-ELC quality continuum framework rating matrix quality continuum framework rating matrix with elements and points for consortia common tiers 1, 3, and 4. Sacramento, CA: Author. Retrieved from: http://www.cde.ca.gov/sp/cd/rt/caqrisratingmatrix.asp]: Tier 2 = Committed to Quality Improvement (Bronze) Tier 3 = Achieving Quality Standards (Silver) Tier 4 = Exceeding Quality Standards (Gold) Tier 5 = Excellence in Quality Standards (Platinum) b
Source: First 5 Santa Clara County, as of 2/2/2017. Additional data available from: First 5 Santa Clara. (2017). QRIS participant current rating by site. San Jose, CA: Author. Retrieved from: http://www.first5kids.org/early-learning/qris-list c
Source: California Child Care Resource and Referral Network’s 2014 supply data shared with AIR on 5/5/17.
Numerous Zip Codes in the County Do Not Have QUALITY MATTERS-Rated
Sites but Have NAEYC-Accredited Sites or Transitional Kindergarten Programs
While the county has not met its 2010 ELMP goal to have 75 percent of its early childhood
education programs serving preschool-age children participate in a QRIS, there are other
approaches to measuring and supporting quality programming. For example, the voluntary
National Association for the Education of Children (NAEYC) accreditation process involves
four steps: 1) enrolling in a self-study program; 2) submitting an application agreeing to
complete candidacy materials; 3) becoming a candidate; and 4) meeting NAEYC’s 10
program standards (relationships, curriculum, teaching, assessment of child progress,
health, teachers, families, community relationships, physical environment, and leadership
and management). As of spring 2017, the county had 45 NAEYC-accredited sites in various
zip codes throughout the county, as shown in Exhibit A-21. Yet, as noted above, there are
approximately 2,500 licensed centers and family child care homes in Santa Clara County –
and only 45 are accredited and 140 are in QUALITY MATTERS.
Transitional Kindergarten represents another avenue through which to access quality ECE
programming. As discussed above, TK is the first year of a two-year kindergarten program for
children with birthdays between September and December that uses a modified
kindergarten curriculum taught by credentialed teachers that is age and developmentally
appropriate (CDE, 2017).42 As of the 2016-17 school year, 123 schools offered TK on their
42 California Department of Education. (2017). Transitional kindergarten FAQs. Sacramento, CA: Author. Retrieved from: http://www.cde.ca.gov/ci/gs/em/kinderfaq.asp#program

58
campuses. TK has high workforce qualifications and compensation; however, its staff-child
ratios are higher than some other early care and education programs.
In sum, the county has made great strides toward improving quality through participation in
QUALITY MATTERS, NAEYC accreditation, and TK programming; however, the majority of
Santa Clara County’s children are still in programs whose quality has not been assessed.

59
Exhibit A-21. NAEYC-Accredited Sites, QUALITY MATTERS-Rated Sites, and TK Enrollment in Santa Clara County, by Zip Code and
Citya
Zip
Code City
Number of
Accredited
Sites in Zip
Code,
2017a Names of Accredited Sites, 2017a
Total
Number
of QRIS
Rated
Sites in
Zip Code,
2017b
Total
Number of
Licensed
Child Care
Centers in
Zip Code,
2014c
Licensed
Center
Capacity
(for 3 & 4-
year-olds)
in Zip Code,
2014c
Public TK
Enrollment,
2014-15 d
Public K
Enrollment,
2014-15 d
94022 Los Altos 2
1) Los Altos/Mountain View Children’s
Corner, Inc.; 2) Children’s House of Los
Altos 0 4 120 49 309
94024 Los Altos 3
1) Mountain View Parent Nursery School;
2) Children’s Creative Learning Center- Los
Altos Campus; 3) Children’s House of Los
Altos 0 16 643 2 248
94035
Mountain
View
(Moffett
Field) 1 1) Ames Child Care Center 0 1 53 0 0
94039
Mountain
View 0 - 0 0 0 0 0
94040
Mountain
View 1 1) KinderCare Learning Center 0 16 612 75 470
94041
Mountain
View 0 - 1 3 181 23 98
94042
Mountain
View 0 - 0 0 0 0 0
94043
Mountain
View 0 - 2 13 514 25 216
94085 Sunnyvale 2
1) CCLC Preschool in California; 2)
KinderCare Sunnyvale 2 2 157 54 189
94086 Sunnyvale 0 - 3 17 1,277 64 399
94087 Sunnyvale 1 1) Cupertino Co-op Nursery School 1 30 1,969 44 733
94088 Sunnyvale 0 - 0 0 0 0 0
94089 Sunnyvale 1 1) California Young World 2 4 153 31 158
94301 Palo Alto 3
1) Neighborhood Infant-Toddler Center; 2)
CCLC Downtown Palo Alto; 3) Downtown
Children’s Center 0 11 330 0 124

60
Zip
Code City
Number of
Accredited
Sites in Zip
Code,
2017a Names of Accredited Sites, 2017a
Total
Number
of QRIS
Rated
Sites in
Zip Code,
2017b
Total
Number of
Licensed
Child Care
Centers in
Zip Code,
2014c
Licensed
Center
Capacity
(for 3 & 4-
year-olds)
in Zip Code,
2014c
Public TK
Enrollment,
2014-15 d
Public K
Enrollment,
2014-15 d
94303 Palo Alto 0 - 0 22 1,340 48 317
94304 Palo Alto 2
1) Whistle Stop Child Development Center;
2) CCLC at Stanford West 0 2 118 0 3
94305 Stanford 6
1) Bing Nursery School 2) Children’s Center
of the Stanford Community; 3) Rainbow
School; 4) Stanford Arboretum Children’s
Center; 5) Stanford Madera Grove
Children’s Center; 6) Stock Farm Road
Children’s Center 0 8 352 0 171
94306 Palo Alto 5
1) Barron Park Children’s Center; 2)
College Terrace Children’s Center; 3) Casa
dei Bambini; 4) Ellen Thacher Children’s
Center; 5) Sojourner Truth Child
Development Center 0 22 626 0 275
95002 Alviso 0 - 1 1 55 0 89
95008 Campbell 0 - 3 25 1,421 70 429
95009 Campbell 0 - 0 0 0 0 0
95011 Campbell 0 - 0 0 0 0 0
95013 Coyote 0 - 0 0 0 0 0
95014 Cupertino 2
1) Bright Horizons at Cupertino; 2)
KinderCare Learning Center 2 28 1,095 4 711
95015 Cupertino 0 - 0 0 0 0 0
95020 Gilroy 0 - 8 18 636 109 979
95021 Gilroy 0 - 0 0 0 0 0
95026 Holy City 0 - 0 0 0 0 0
95030 Los Gatos 0 - 0 2 59 15 87
95031 Los Gatos 0 - 0 0 0 0 0
95032 Los Gatos 0 - 0 16 917 30 253
95033 Los Gatos 0 - 0 0 0 9 79
95035 Milpitas 3
1) Cisco Family Connection; 2) KinderCare
Learning Center (Hillview Drive); 3) 3 33 1,878 147 864

61
Zip
Code City
Number of
Accredited
Sites in Zip
Code,
2017a Names of Accredited Sites, 2017a
Total
Number
of QRIS
Rated
Sites in
Zip Code,
2017b
Total
Number of
Licensed
Child Care
Centers in
Zip Code,
2014c
Licensed
Center
Capacity
(for 3 & 4-
year-olds)
in Zip Code,
2014c
Public TK
Enrollment,
2014-15 d
Public K
Enrollment,
2014-15 d
KinderCare Learning Center (South Abel
Street)
95036 Milpitas 0 - 0 1 22 0 0
95037 Morgan Hill 1 1) KinderCare Learning Center 1 20 706 107 562
95038 Morgan Hill 0 - 0 0 0 0 0
95044
Redwood
Estates 0 - 0 0 0 0 0
95046 San Martin 1 1 21 0 84
95050 Santa Clara 1 11 315 50 316
95051 Santa Clara 1 1) KinderCare Santa Clara 5 22 1,184 52 671
95053 Santa Clara 0 - 0 0 0 29 0
95054 Santa Clara 0 - 3 7 271 0 260
95055 Santa Clara 0 - 0 0 0 0 0
95056 Santa Clara 0 - 0 0 0 0 0
95070 Saratoga 1 1) Saint Andrew’s Pre-kindergarten 2 15 725 35 384
95101 San Jose 0 - 0 0 0 0 0
95102 San Jose 0 - 0 0 0 0 0
95110 San Jose 1 1) Tamien Child Care Center 4 6 249 19 439
95111 San Jose 0 - 12 7 230 126 817
95112 San Jose 1
1) Associated Students Child Development
Center, SJSU 8 19 773 136 593
95113 San Jose 0 - 0 0 0 0 0
95114 San Jose 0 - 0 0 0 0 0
95116 San Jose 0 - 7 18 620 122 938
95117 San Jose 0 - 2 11 439 26 263

62
Zip
Code City
Number of
Accredited
Sites in Zip
Code,
2017a Names of Accredited Sites, 2017a
Total
Number
of QRIS
Rated
Sites in
Zip Code,
2017b
Total
Number of
Licensed
Child Care
Centers in
Zip Code,
2014c
Licensed
Center
Capacity
(for 3 & 4-
year-olds)
in Zip Code,
2014c
Public TK
Enrollment,
2014-15 d
Public K
Enrollment,
2014-15 d
95118 San Jose 1 1) KinderCare Learning Center 5 16 616 118 571
95119 San Jose 1 1) Bright Horizons at San Jose 1 7 517 53 193
95120 San Jose 0 - 1 14 445 83 512
95121 San Jose 0 - 1 4 101 103 631
95122 San Jose 0 - 14 19 776 141 762
95123 San Jose 1 1) Green Valley Child Development Center 6 12 442 145 894
95124 San Jose 1 1) Discovery Parent Child Preschool 2 29 1,287 76 656
95125 San Jose 2
1) Explorer Preschool; 2) San Jose Parents’
Participating Nursery School 5 23 814 158 920
95126 San Jose 0 - 1 11 393 0 150
95127 San Jose 0 - 10 14 362 259 1,128
95128 San Jose 0 - 3 12 844 21 195
95129 San Jose 0 - 0 16 1,020 0 562
95130 San Jose 0 - 1 4 132 18 459
95131 San Jose 0 - 2 4 146 122 469
95132 San Jose 0 - 1 9 230 0 561
95133 San Jose 0 - 3 6 203 28 159
95134 San Jose 1 1) Cisco CCLC: Families at First 1 3 294 0 0
95135 San Jose 1 1) KinderCare Learning Center 0 10 469 49 204
95136 San Jose 0 - 6 13 590 49 333
95137 San Jose 0 - 0 0 0 0 0
95138 San Jose 0 - 0 4 37 0 135
95139 San Jose 0 - 0 3 34 0 70
95140
Mount
Hamilton 0 - 0 0 0 0 0
95141 San Jose 0 - 0 0 0 0 0

63
Zip
Code City
Number of
Accredited
Sites in Zip
Code,
2017a Names of Accredited Sites, 2017a
Total
Number
of QRIS
Rated
Sites in
Zip Code,
2017b
Total
Number of
Licensed
Child Care
Centers in
Zip Code,
2014c
Licensed
Center
Capacity
(for 3 & 4-
year-olds)
in Zip Code,
2014c
Public TK
Enrollment,
2014-15 d
Public K
Enrollment,
2014-15 d
95148 San Jose 0 - 3 5 154 97 642
95150 San Jose 0 - 0 0 0 0 0
95151 San Jose 0 - 0 0 0 0 0
95152 San Jose 0 - 0 0 0 0 0
95153 San Jose 0 - 0 0 0 0 0
95154 San Jose 0 - 0 0 0 0 0
95156 San Jose 0 - 0 0 0 0 0
95157 San Jose 0 - 0 0 0 0 0
95159 San Jose 0 - 0 0 0 0 0
95164 San Jose 0 - 0 0 0 0 0
95172 San Jose 0 - 0 0 0 0 0
95173 San Jose 0 - 0 0 0 0 0
Totals - 45 - 140 670 29,967 3.021 22,734 a Source: National Association for the Education of Young Children. (2017). Find NAEYC accredited programs. Washington, DC: Author. Retrieved 3/23/17 from: http://www.naeyc.org/families/search b Source: First 5 Santa Clara County, as of 2/2/2017. Additional data available from: First 5 Santa Clara. (2017). QRIS participant current rating by site. San Jose, CA: Author. Retrieved from: http://www.first5kids.org/early-learning/qris-list c Source: California Child Care Resource and Referral Network’s 2014 supply data shared with AIR on 5/5/17. Note: Zip codes in red italicized font had 0 (zero) need based on ACS 1-year estimates for children eligible for State Preschool. d Source: California Department of Education. (2015). Transitional kindergarten program participation (census day) , Sacramento, CA: Author. Retrieved 01/07/16 from: http://data1.cde.ca.gov/dataquest/tkreports/TkLevels.aspx?cdscode=43000000000000&year=2014-15. Note: Zip codes in red italicized font had 0 (zero) need based on ACS 1-year estimates for children eligible for State Preschool.

64
Examples of Key County Resources, Programs, and Initiatives That Address
Program Quality
QUALITY MATTERS
In 2012, Santa Clara County was one of 16 counties in California to receive a three-year
grant through the Federal Race to the Top Early Learning Challenge (RTT-ELC) to develop a
pilot QRIS. A QRIS serves four purposes: 1) it defines a common understanding of quality for
early care and education programs; 2) it measures programs against standards and gives
programs a quality rating; 3) it provides educators with training and support to achieve
higher levels of quality; and 4) it informs the community about the importance of high-quality
care and education for children.43
Early learning providers and programs that are part of Santa Clara County’s QRIS, QUALITY
MATTERS, are assessed based on quality elements in the following areas:
Child Observation: Teachers understand each child’s development and design daily
learning activities based on children’s needs.
Developmental and Health Screening: A close monitoring of child’s overall well-being
supports a child’s healthy development.
Effective Teacher-Child Interactions: Teachers’ positive relationships with children
promote a love of learning.
Ratios and Group Size: More teachers and smaller group sizes help spend more
quality time with individual children.
Environment: A child-focused environment allows children to learn and develop to
their fullest potential.
Staff Training and Education: A high-quality program includes well-trained directors
and teachers in child development and early learning.
Educare
Educare of California at Silicon Valley (Educare) opened in September 2015 on the campus
of Santee Elementary School and is part of San Jose’s Franklin-McKinley Children’s
Initiative. The site provides quality ECE for low-income children from birth to age 5, as well
as an FRC to offer resources and support for families and the greater community. This
comprehensive center also offers a professional development and research institute to
provide training for ECE professionals.44,45
43 First 5 Santa Clara County, as of 2/2/2017. Additional data available from: First 5 Santa Clara. (2017). QRIS participant current rating by site. San Jose, CA: Author. Retrieved from: http://www.first5kids.org/early-learning/qris-list 44 Educare California. (2015). Educare California at Silicon Valley opens to children, parents. San Jose, CA: Author. Retrieved 2/15/17 from: http://www.educareschools.org/educare-california-at-silicon-valley-opens-to-children-parents/ 45 Educare California. (2016). Educare California at Silicon Valley. San Jose, CA: Author. Retrieved 2/15/17 from: http://www.educareschools.org/schools/california-at-silicon-valley/.

65
ASAPconnect
The After School Assistance Providers Connect (ASAPconnect), a statewide project based out
of SCCOE, strives to improve program quality by building and strengthening a
comprehensive and coordinated technical assistance system for after-school and summer
providers. ASAPconnect works with Partnership for Children and Youth and other partners to
collaborate and promote the best methods for training, coaching, and facilitating Summer
Matters programs. ASAPconnect’s vision is to connect, serve, and inspire technical
assistance providers who support over 4,000 publicly funded expanded learning programs
across the state.46
The California Core Competencies for Before and After School Professionals (Core Competencies)
Core Competencies is one of the deliverables created through the Technical Assistance for
Program Effectiveness (TAPE) Project. The TAPE Project has been funded through the After
School Assistance Providers Connect (ASAPconnect) grant, with support from The David and
Lucile Packard Foundation and the California Department of Education (CDE) After School
Division. The Core Competencies provide a list of recommended, research-based knowledge
and skills for professionals in the After School Education and Safety program (ASES), 21st
Century Community Learning Centers (21st CCLC), and After School Safety and Enrichment
for Teens (ASSETs) Before and After School Programs. These state- and federally funded
programs serve preschool through 12th grade students and their families. The programs
receive technical assistance from the Regional After School Technical Assistance System
(RASTAS) and other service providers. The Core Competencies document applies to before-
and after-school program professionals and stakeholders who hold a variety of positions.47
46 David and Lucile Packard Foundation. (2016). What we’re doing: After school and summer enrichment: ASAPconnect. Los Altos, CA: Author. Retrieved 2/22/17 from: https://www.packard.org/what-we-fund/children-families-and-communities/what-were-doing/school-summer-enrichment// 47 ASAPconnect. (2011). California Core Competencies for Before and/or After School Professionals. San Jose, CA: Santa Clara County Office of Education.
66
Workforce Development
Credentials of Some Child Care Providers Has Improved
The 2010 ELMP set a goal that by 2017, at least 50 percent of the teachers/providers in
ECE have at least a bachelor’s degree, and that 30 percent of the assistant teachers have at
least an associate’s degree. Much of the data on the workforce qualifications of child care
staff is lacking or outdated; however, the county does have access to current data on the
credentials of some of its ECE professionals, largely because of the prioritization of higher
teacher qualifications among Head Start/Early Head Start and TK programs and for sites
participating in QUALITY MATTERS. Meeting federal requirements, four out of five Head Start
teachers and more than half of Early Head Start teachers have a bachelor’s degree. In the
TK program, all teachers must have at least a bachelor’s degree. And the higher rated
programs in QUALITY MATTERS typically have lead teachers who have a bachelor’s degree.
As shown in Exhibits A-22 and A-23, of the 100 Head Start and Early Head Start teachers in
2016, 80 percent had a bachelor’s degree or higher. Meanwhile, of the 116 staff employed
as Head Start and Early Head Start assistant teachers in 2016, the majority of assistant
teachers held either an associate’s degree (45 percent) or a Child Development Associate
(CDA) Credential (43 percent), and 12 percent had a bachelor’s degree.
Developing a strong and stable ECE workforce requires not only increasing teacher
qualifications but also compensation commensurate with higher qualifications. While Head
Start and Early Head Start programs have more than exceeded the 2010 ELMP goal
because of recent federal Head Start requirements, it is less clear whether pay increases
are commensurate with these increasing requirements. For example, as of July 2017, an
entry level (i.e., “Step One”) Head Start teacher with a bachelor’s degree in Santa Clara
County would only earn about $3,000 more per year than an entry level Head Start teacher
with an associate’s degree.48
48 Santa Clara County Office of Education. (2017). Santa Clara County Office of Education 2017-18 salary schedule. San Jose, CA: Author. Retrieved from: http://www.sccoe.org/depts/Human-Resources/classified/Documents/Rules/HS-EHS-SP-EDUCARE-220-day-12-months.pdf

67
Exhibit A-22. Credentials of Staff Serving as Head Start and Early Head Start Center-Based
Teachers in Santa Clara County, 2016
Total
Head
Start:
Preschoola
Early Head
Start:
Infant/Toddlerb
Total classroom teachers # 100 89 11
Classroom teachers with a BA or
higher
# 80 74 6
% 80% 83% 55%
Classroom teachers with an AA # 17 12 5
% 17% 13% 45%
Classroom teachers with a CDA # 3 3 0
% 3% 3% 0% a
Source: Office of Head Start Administration for Children and Families. (2016). 2015-2016 Head Start program information report 09CH9192-000 Santa Clara Office of Education. Washington, DC: U.S. Department of Health and Human Services. b
Source: Office of Head Start Administration for Children and Families. (2016). 2015-2016 Early Head Start program information report 09CH9192-200 Santa Clara Office of Education. Washington, DC: U.S. Department of Health and Human Services.
Exhibit A-23. Credentials of Staff Serving as Head Start and Early Head Start Center-Based
Assistant Teachers in Santa Clara County, 2016
Total
Head Start:
Preschoola
Early Head
Start:
Infant/Toddlerb
Total classroom assistant teachers # 116 97 19
Assistant teachers with a BA or
higher
# 14 14 0
% 12% 14% 0%
Assistant teachers with an AA # 52 33 19
% 45% 34% 100%
Assistant teachers with a CDA # 50 50 0
% 43% 52% 0% a
Source: Office of Head Start Administration for Children and Families. (2016). 2015-2016 Head Start program information report 09CH9192-000 Santa Clara Office of Education. Washington, DC: U.S. Department of Health and Human Services. b
Source: Office of Head Start Administration for Children and Families. (2016). 2015-2016 Early Head Start program information report 09CH9192-200 Santa Clara Office of Education. Washington, DC: U.S. Department of Health and Human Services.
Preschool Teachers’ Salaries Low Compared to Other Occupations
Overall, low salaries in the field of ECE pose the biggest barrier to increasing workforce
qualifications. The United States Bureau of Labor Statistics publishes average salaries for a
variety of occupations by geographical location. For example, in the San Jose-Sunnyvale-Santa Clara Metropolitan Area, the mean annual income across all occupations was
$78,620 as of May 2015; however, this salary measure varies greatly by occupation.49 As of
May 2015, on average, preschool teachers earned over $25,000 per year less than
kindergarten teachers and over $35,000 less per year than elementary school teachers.
Low compensation is one factor that heavily influences the recruitment and retention of a
qualified workforce.
49 United States Bureau of Labor Statistics. (2015). May 2015 Metropolitan and nonmetropolitan area occupational employment and wage estimates: San Jose-Sunnyvale-Santa Clara, CA. Washington, DC: United States Department of Labor. Retrieved from: http://www.bls.gov.

68
Exhibit A-24. Average Annual Salary of Workers in San Jose, Sunnyvale, and Santa Clara by
Occupation, May 2015
Occupation Annual Salary
All occupations $78,620
Education administrators, postsecondary $124,680
Education administrators, elementary and secondary school $115,960
Education teachers, postsecondary $92,060
Special education teachers, secondary school $76,880
Elementary school teachers, except special education $75,700
Secondary school teachers, except special and career/technical education $75,460
Middle school teachers, except special and career/technical education $73,400
Special education teachers, middle school $70,780
Kindergarten teachers, except special education $66,170
Special education teachers, kindergarten and elementary school $65,350
Education administrators, preschool and childcare center/program $64,290
Special education teachers, all other $62,050
Postal service mail carriers $54,170
Preschool teachers, except special education $40,170
Bus drivers, school or special client $37,070
Teacher assistants $31,540
Retail salespersons $29,740
Childcare workers $29,320
Waiters and waitresses $27,060 Source: United States Bureau of Labor Statistics. (2015). May 2015 Metropolitan and nonmetropolitan area occupational employment and wage estimates: San Jose-Sunnyvale-Santa Clara, CA. Washington, DC: United States Department of Labor. Retrieved 2/15/17 from: http://www.bls.gov.
Examples of Key County Resources, Programs, and Initiatives That Address
Early Care and Education Workforce Development
The Starting Smart and Strong Initiative
The Starting Smart and Strong Initiative, funded by the David and Lucile Packard
Foundation, is a 10-year, place-based initiative to develop an early learning network in three
Bay Area school district communities and scale up what works. The Packard Foundation
awarded one of its first three Starting Smart and Strong grants to the Franklin-McKinley
School District, which is working closely with community partners to lead and implement the
initiative in their communities.
The Packard-funded Early Learning Lab is working with each of the grantees on its
professional development efforts. In San Jose, Franklin-McKinley is partnering with Educare
of California at Silicon Valley, FIRST 5 Santa Clara, the Franklin-McKinley Children's Initiative
and SCCOE in implementing professional development models that incorporate the latest
ECE research to test and spread effective solutions within and beyond its community.
Teachers and administrators in Franklin-McKinley School District preschool and TK
classrooms, along with SCCOE Head Start and State Preschool classrooms, are working with
The Early Learning Lab to train teachers and caregivers of children and develop a learning

69
program. They are combining two distinct learning needs – social and emotional
development and early literacy – into one integrated teaching model. Teachers receive
intensive professional support while testing this new customized model that allows them to
simultaneously focus on two learning areas during the school day. The Lab also works with
administrators and families to ensure that the child’s development and learning is
supported in a comprehensive manner.50
The initiative strives to ensure all children grow up healthy and ready for kindergarten by
improving the quality of adult-child interactions across all settings where young children
learn and grow. The Packard Foundation is partnering with three California communities to
develop and test solutions that support parents, caregivers, and educators as they prepare
children to be healthy and ready for school with self-confidence and a love of learning. This
10-year initiative is bringing together public and private supporters to create a local
comprehensive early learning network in select California communities, and ultimately scale
what works.
The CARES Plus Program and Quality Matters
The Santa Clara CARES Plus Program (Comprehensive Approaches to Raising Educational
Standards) provided financial awards to ECE professionals based on their educational
achievement and the completion of professional development activities. These financial
stipends incentivized ECE professionals to further their education and enhance their
professional development.51 Although the program ended in 2016, during its 15 years of
operation, CARES provided financial incentives, training, professional advising, foreign
transcript translation and evaluation services, and other supports to thousands of ECE
professionals in the county. In addition, CARES was able to support two separate bachelor’s
degree cohorts at San Jose State University. The CARES initiative was supported over the
years through funding from FIRST 5 Santa Clara County, the California Department of
Education through the Local Early Education Planning Council (LPC), and First 5 California.52
The Quality Matters Stipend Program, funded by First 5 California, FIRST 5 Santa Clara
County, and the California Department of Education and operated by the WestEd E3
Institute, has recently replaced CARES. This program is designed to provide financial
incentives for program directors and teaching staff at QUALITY MATTERS sites in the county
to pursue professional development. Enrollment is open to any early educator that works at
a QUALITY MATTERS site or is currently participating in an IMPACT Quality Improvement
program, such as SEEDS, MyTeachstone, or Raising a Reader. Participants can opt for the
$600 college coursework stipend [complete a minimum of 3 semester units (4 quarter
units) toward a college degree or to obtain or upgrade a California Child Development Permit
or credential with a grade of “C” or better] or the $400 training option stipend (complete a
minimum of 21 hours of professional development during the program year).
50 The Early Learning Lab. (2017). Starting smart and strong. Oakland, CA: Author. Retrieved 2/25/17 from https://earlylearninglab.org/what-we-do/starting-smart-and-strong/. 51 WestEd E3 Institute and First 5 Santa Clara County. (2015). Santa Clara County CARES Plus fact sheet, 2015-2016. San Jose, CA: Author. Retrieved 2/28/17 from: http://www.e3institute.org/cs/e3/download/fsfile/2336/CARES%20Plus%20Y5%20Fact%20Sheet.pdf?x-r=pcfile_dpub 52 First 5 Santa Clara County. (2016). Letter from First 5 Santa Clara County. http://www.e3institute.org/cs/e3/download/fsfile/2355/CARES_Plus_End_letter.pdf?x-r=pcfile_dpub
70
Transitional Kindergarten
State-funded initiatives also support professional development opportunities. For example,
the TK Professional Development Reimbursement Program53 is a professional development
program that provides reimbursement to qualified TK educators. The program, funded by
California Department of Education/Early Education and Support Division (CDE/EESD)
through March 31, 2019, was in response to a mandate that all credentialed teachers who
were first assigned to a TK classroom after July 1, 2015, must have one of the following by
August 1, 2020: 1) at least 24 units in early childhood education, or childhood development,
or both; 2) as determined by the local educational agency employing the teacher,
professional experience in a classroom setting with preschool-age children that is
comparable to the 24 units of education; or 3) a child development teacher permit issued by
the Commission on Teacher Credentialing, with the goal of increasing understanding of early
childhood development and preschool instructional strategies among TK teachers. First
priority for funding goes to credentialed teachers assigned to a TK classroom after July 1,
2015, to increase their level of education in early education/child development. The second
priority goes to all TK teachers. The third priority goes to California State Preschool Program
(CSPP) teachers for professional development stipends for education expenses related to
professional development, including the costs of credit-bearing coursework in early
childhood education, child development, or both.
53 Santa Clara County Office of Education. (2017). Transitional kindergarten (TK) professional development reimbursement program. San Jose, CA: Author. Retrieved from: http://www.sccoe.org/depts/students/lpc/Pages/TK-Program.aspx

71
Summary and Conclusions From the State of the County Summary
Santa Clara County has made considerable progress in meeting the goals and milestones
set forth in the 2010 ELMP. These achievements are a result of the concerted and
dedicated efforts from county leaders, practitioners, policymakers, and the community, all of
whom have been integral to the county’s various ongoing and planned initiatives. The 2017
ELMP builds upon this progress and provides a framework for increasing access to quality
care and education for children and families and ensuring respect for and promotion of a
dedicated, highly qualified ECE workforce.
Access. Since 2010, addressing the need for licensed out-of-school time for children under
age 12 and licensed infant/toddler care has remained a challenge in Santa Clara County.
The county has increased the percentage of preschoolers served in child care settings since
2010, which is due, in large part, to the introduction of TK – but also to the reduction of
families in poverty and the historically low ceiling for subsidy eligibility.
A recently developed local child care subsidy pilot plan aims to provide a way to help
maximize allocated funding and efficiently use child care subsidy funds in order to better
serve the needs of more children and families in Santa Clara County. Although the increase
in subsidy eligibility from 70 percent SMI to 85 percent SMI will mean more families are
eligible, it also means that the reported unmet need for subsidized preschool is likely to
increase unless additional resources are provided. To address this need for additional
resources, the 2017 ELMP Access key goal is to expand local funding for ECE services. The
2017 ELMP also outlines goals to address barriers to access by enrolling all eligible children
in TK, increasing access to State Preschool programs, and increasing access to infant-
toddler care and paid family leave.
Articulation, Alignment, and Data Systems. The county has made some progress on
implementing developmental screenings and aligning standards and curriculum since the
2010 ELMP. Key county agencies have also been looking into ways to enhance data
integration between the ECE and the K-12 systems. However, this work on articulation,
alignment, and data systems in the county remains the exception and not the norm. The
2017 ELMP proposes to enhance work in this area through five concrete goals: expanding
school-provider networks; assigning SSIDs to 0-5 year-old children; providing parents with
school readiness and enrollment information; including ECE data in the developing
countywide, integrated data system; and promoting the use of validated school readiness
assessments.
Facilities. In 2010, the county set a goal to have a coordinated, integrated, sustainable
system that ensured the planning and funding needs were met for quality facilities for birth-
to-eight-year-olds. Since the last ELMP, the county has established an Early Learning
Facilities Coalition and made some progress in addressing child care deserts; however,
considerable work remains to be done. SCCOE has already begun work on one 2017
Facilities goal to create a countywide ECE facilities development plan; this contracted Early
Learning Facilities Study inventories resources, conducts asset mapping, and identifies
barriers and potential strategies to overcome them. Other 2017 ELMP goals specific to
Facilities include offering facilities training and technical assistance to providers, advocating

72
for sustainable sources of funding for ECE facilities, enhancing facilities licensing to improve
the quality of ECE facilities, and engaging the county’s cities as partners in ECE facilities
development.
Family Engagement. Over the past seven years, the county has made great strides toward
family engagement. For example, by creating and convening a “Family Engagement and
Leadership Working Committee,” it met its 2010 ELMP goal to establish a workgroup to help
inspire and support family engagement in children’s education and development. The
county’s Family Resource Centers also continue to promote family engagement. FIRST 5
Santa Clara’s hiring of a full-time Family Engagement Coordinator is another recent
development that highlights the county’s commitment to partnering with families. But the
county still needs to develop a shared definition of family engagement, adopt a common
family engagement framework, and create structures and processes that allow for sharing of
information and best practices. To address these needs, the 2017 ELMP outlines three
strategies: implement a countywide family engagement network, create and sustain a joint
schools-ECE family engagement collaborative, and launch a family engagement public
education campaign.
Program Quality. The county has done considerable work around addressing program quality
since 2010. Santa Clara County established and implemented its QRIS – QUALITY MATTERS
– in 2012, and as of early spring 2017, 140 programs in the county had been rated; more
than half of which were rated at the top two levels. In addition, 45 centers are accredited by
the NAEYC and 123 elementary schools have TK programs; NAEYC-accredited programs
meet some of the criteria for the highest ranked programs in QUALITY MATTERS, and TK
programs excel on the workforce qualification components of QUALITY MATTERS. Despite
this progress toward improving quality, most children still attend programs only required to
meet state licensing requirements, and the actual quality of most ECE programs, particularly
those serving infants and toddlers, is still unknown. To address these challenges, the 2017
ELMP outlines the following goals: expand participation in QUALITY MATTERS and other
quality accreditation programs, advocate for improved quality in TK programs, support ECE
programs in implementing quality improvement strategies, provide a common ECE program
quality data system, and assess the quality of OST time.
Workforce Development: The county has made progress toward achieving its goal of
addressing the educational qualifications of its ECE workforce since 2010, particularly in a
few settings. As of 2016, more than three quarters of Head Start teachers and over half of
Early Head Start teachers had a bachelor’s degree or higher. All TK teachers are required to
have at least a bachelor’s degree. And the higher rated programs in QUALITY MATTERS
typically have lead teachers with a bachelor’s degree. The introduction of Educare of
California at Silicon Valley in 2015 also impacted workforce development; Educare offers a
professional development and research institute to provide training for early childhood
professionals. But the county still does not have current, comprehensive data on the
qualifications of the workforce serving children in other subsidized settings and privately
funded programs. And although providers are expected to have more education, their
salaries lag far behind TK-12 teachers. The following 2017 goals address workforce
development: support re-opening ECE lab schools at community colleges, advocate for
worthy wages for ECE professionals, increase enrollment in the ECE workforce registry,
73
include ECE content in pre- and in-service elementary school administrator training, create a
Talent Pipeline Management Strategy for the ECE workforce, and build public understanding
and esteem for the ECE profession.
The 2017 ELMP offers a unique and exciting opportunity to revisit progress made since the
2010 ELMP – and to identify future goals and milestones for the county’s young children.
County stakeholders are committed to continuous improvement of its ECE system. When
asked about their greatest hopes for Santa Clara County’s birth-to-eight-year-olds, these
stakeholders shared their ambitious and optimistic hopes for the county’s youngest
residents. As one stakeholder noted,
Education is going through changes like it hasn’t seen in quite a while. The shift in
the economy from manufacturing to technology, just like before [with] the shift from
agricultural to manufacturing, has really shaken many things up, with education
probably being the biggest [thing]. So my greatest hope for children in this county is
that they can continue to go to school districts that harness what that future looks
like and take advantage of it. I think one of those areas is certainly in early childhood
education, largely just because of what we know today about its importance and the
role that it plays in the development of a young person’s learning capabilities. My
biggest hope for them is that – and my biggest fear would be that they not do that.
A second stakeholder said,
My greatest hope is that all children birth to five have options for high-quality
interactions, whether it’s with their informal care providers or whether it’s in a formal
setting – where parents feel supported and have the resources and information. And
that teachers and early learning providers have the training, the support, the
coaching, and the resources to provide children quality early learning experiences.
[My hope is] that these are adequately funded and that public systems will partner
and allocate resources to scale what works.

74
Section B: 2017 Goals and Implementation Plan

75
Section B: 2017 Goals and Implementation Plan
Section B builds upon the snapshot of the state of ECE in Santa Clara County as of 2017,
which is outlined in Section A of this document. It presents a roadmap for the future, with
goals, milestones, and actions addressing the needs of children birth to eight, their families,
and the early education providers who teach and care for them. The Plan addresses
strengths and challenges in six major areas of the ECE system – Access; Articulation,
Alignment, and Data Systems; Facilities; Family Engagement; Program Quality; and
Workforce Development.
Each focal area has several goals – including one or two key goals. Most of the goals have
two-, five-, and seven-year milestones. The two-year milestones include specific actions to
achieve the milestone; however, not all of the five- and seven-year milestones have actions,
to allow for changing circumstances and flexibility in achieving the goals within that
extended timeframe. Key goals are those that either (1) substantially affect multiple focus
areas, or (2) are necessary first steps to achieving other goals within or across focus areas.
The expectation is that these goals will be the focus of initial implementation efforts, and, in
some cases, the goals are already being acted upon. Key goals are presented in blue text in
the following tables.

76
Summary Table of Goals Exhibit B-1 presents a list of the 2017 ELMP goals for each of the six focal areas.
Exhibit B-1. 2017 ELMP Goals
ACCESS
Goal 1: Expand Local Funding for ECE Services
Goal 2: Enroll All Eligible Children In Transitional Kindergarten (TK)
Goal 3: Increase Access to State Preschool Programs
Goal 4: Increase Access to Infant-Toddler Care and Paid Family Leave
ARTICULATION, ALIGNMENT, AND DATA SYSTEMS
Goal 1: Expand School–ECE Provider Networks
Goal 2: Assign Unique Student Identification Numbers to 0-5 Year-Old Children
Goal 3: Provide Parents With School Readiness and Enrollment Information
Goal 4: Include ECE Data in the Developing Countywide Integrated Data System
Goal 5: Promote the Use of Validated School Readiness Assessments
FACILITIES
Goal 1: Offer Facilities Training and Technical Assistance (TTA) to Providers
Goal 2: Create a Countywide ECE Facilities Development Plan
Goal 3: Advocate for Sustainable Sources of Funding for ECE Facilities
Goal 4: Enhance Facilities Licensing to Improve the Quality of ECE Facilities
Goal 5: Engage Cities as Partners in ECE Facilities Development
FAMILY ENGAGEMENT
Goal 1: Implement a Countywide Family Engagement Framework
Goal 2: Create and Sustain a Joint Schools-ECE Family Engagement Collaborative
Goal 3: Launch a Family Engagement Public Education Campaign
PROGRAM QUALITY
Goal 1: Expand Participation in the Quality Rating and Improvement System (QUALITY
MATTERS) and Other Quality Accreditation Programs
Goal 2: Advocate for Improved Quality in Transitional Kindergarten Programs
Goal 3: Support ECE Programs in Implementing Quality Improvement Strategies
Goal 4: Provide a Common ECE Program Quality Data System
Goal 5: Assess the Quality of Out-of-School-Time (OST) Programs
WORKFORCE DEVELOPMENT
Goal 1: Support Re-opening ECE Lab Schools at Community Colleges
Goal 2: Advocate for Worthy Wages for ECE Professionals
Goal 3: Increase Enrollment in the ECE Workforce Registry
Goal 4: Include ECE Content in Pre- and In-Service Elementary School Administrator
Training
Goal 5: Create a Talent Pipeline Management Strategy for the ECE Workforce
Goal 6: Build Public Understanding and Esteem for the ECE Profession

77
Goals
Access
Status of Access
The 2010 plan set a goal of having a quality early education space for 70 percent of Santa
Clara County’s preschool population and 50 percent of its five- to eight-year-olds.
Technically, by 2014, the county had enough licensed physical center and family child care
spaces for 78 percent of the preschool age group, although not all of these spaces were
operating or available for enrollment, and the spaces did not necessarily meet quality
standards to promote child development or address the family’s needs in terms of location,
hours of service, or type of program. Based on parent responses to the 2014 American
Community Survey, actual enrollment in preschool is closer to 60 percent, with
approximately 30,000 of the nearly 50,000 three- and four-year-olds enrolled. In states that
provide universal access, typically no more than 75 percent participate. Hence, if universal
access to preschool – and enrollment of at least 37,500 three- and four-year-olds --is the
goal in Santa Clara County, there is currently a shortage of approximately 7,500 spaces.
One existing option for alleviating a portion of the shortage of preschool for four-year-olds is
to expand access to and enrollment in state-funded Transitional Kindergarten (TK). The
Kindergarten Readiness Act, which was passed in 2010, changed the entry date for
incoming kindergartners in California. The legislation also established the TK program, which
began in the 2012-13 school year. TK uses a modified kindergarten curriculum that is
designed to be age and developmentally appropriate for four-year-old children. A child is
eligible for TK if the child will have his or her fifth birthday between September 2 and
December 2 of the current school year. As of the 2014-15 school year, approximately 3,000
children were served in TK in 134 schools in the county’s 27 elementary school districts,
providing services to approximately half of the age-eligible children.54,55 However, as of
spring 2017, nearly half (123) of the 257 elementary schools did not yet offer a TK program,
and as many as 3,000 more four-year-olds are estimated to be eligible.
Licensed Out-of-School Time (OST) is available for about one in 10 children under age 12 in
the county, and the supply has decreased slightly since 2010. Separate data are not
available on the OST supply for children specifically in the five- to eight-year-old age group.
Moreover, many OST programs are not required to be licensed, and hence the real capacity
of after-school and summer programs for young school-age children in the county is
54 California Department of Education. (2015). Transitional kindergarten program participation (census day) , Sacramento, CA: Author. Retrieved 01/07/16. http://data1.cde.ca.gov/dataquest/tkreports/TkLevels.aspx?cdscode=43000000000000&year=2014-15 . 55 SCCOE includes 31 districts but 4 districts in the county only serve 9-12th grade students (i.e., Campbell Union High; Fremont Union High; Los Gatos-Saratoga Joint Union High; and Mountain View-Los Altos Union High).
ACCESS VISION STATEMENT
All children birth to age eight have access to high-quality ECE opportunities.

78
unknown, and there may be more capacity for this age group than the available data
suggest.
There is much less availability of infant/toddler care in Santa Clara County, with less than
one licensed space for every six children under three years old (licensed spaces for 11,250,
or 15 percent, of the 70,924 infants and toddlers, based on AIR’s Early Learning Needs
Assessment Tool in 2014). While these data, too, suggest a large shortage, family
preferences for home-based care for this age group may indicate that a range of options is
needed, including better access to paid family leave, improved access to licensed family
child care, and an expansion of center-based programs such as Early Head Start,
community-college-based facilities, and workplace-based facilities.
Real access to ECE, of course, requires not only an adequate supply of spaces but also the
ability to pay for the service. Prior to the proposed countywide implementation of the
increase in income eligibility to 85 percent of SMI, the maximum family income eligible for
subsidy (70 percent of SMI, or about $46,896 for a family of four prior to July 2017)56 for
Title 5 State Preschool did not portray a realistic picture of the level of need for financially
assisted participation in ECE programs in Santa Clara County. To be self-sufficient, a family
of four (two adults and two preschool-age children) in the county needs a much higher
annual income. Although the poverty threshold for a family of four in 2014 was only
$24,230, an estimated $90,750 was required for a family of two adults and two preschool-
age children to meet basic needs in Santa Clara County.57 As of 2012, only 70 percent of all
households in the county and 63 percent of households with children were estimated to be
living above the self-sufficiency standard.58 Furthermore, the proportion of households
meeting this self-sufficiency standard varies greatly, depending upon the race and ethnicity
of the household. For example, in 2012, while 81 percent of White and 77 percent of Asian
families were above the self-sufficiency standard, only 64 percent of Black and 41 percent
of Latino families were above it.
The county is now in the midst of developing and implementing a local county child care
subsidy pilot plan, which proposes raising the income eligibility for Title 5 programs from 70
percent of SMI (about $58,524 for a family of four, effective July 2017) to 85 percent of SMI
(about $71,065 for a family of four in 2017).59 Increasing the eligibility level may make
publicly subsidized ECE available to more families, but, without new resources, the increase
in eligibility is likely to outpace the available state funds, and could more than double the
number of unserved eligible preschool children, from 2,397 to 6,789.60
However, even increasing the income eligibility to 85 percent of SMI still does not make
preschool or child care affordable for many families. In 2015, according to the California
56 California Department of Education. (2016). Schedule of income ceilings for child care and development programs. Sacramento, CA: Author. Retrieved from: http://www.scusd.edu/sites/main/files/file-attachments/familyfeeschedjuly2014.pdf 57 Center for Women’s Welfare. (2015). Self-sufficiency standards. Seattle, WA: University of Washington. http://www.selfsufficiencystandard.org/self-sufficiency-standard-state 58 Center for Women’s Welfare. (2012). The Self-Sufficiency Standard by select household characteristics: California 2012. Retrieved from: http://www.insightcced.org/past-archives/insight-networks/building-economic-security-for-all-besa/californians-for-economic-security-cfes/the-self-sufficiency-standard-for-california/ 59 California Department of Education. (2017). Management bulletin 17-08. Sacramento, CA: Author. Retrieved from: http://www.cde.ca.gov/sp/cd/ci/mb1708.asp 60 See Exhibit A-5 in the State of the County Summary for more detail.

79
Child Care Resource and Referral Network, the average cost of full-day care in a licensed
center in Santa Clara County was $16,375 for an infant and $11,991 for a preschool-age
child – or 14 percent and 10 percent, respectively, of the median family income of
$120,125.61
According to the U.S. Department of Health and Human Services, child care is affordable
when a family pays no more than 7 percent of its income for child care.62 To make full-time
licensed care for one preschooler affordable on Santa Clara County, a family would have to
earn $171,300. For a median-income family in Santa Clara County, the average cost of
licensed care for two children can absorb about a quarter of their income, and many well-
known facilities with established reputations for quality charge far more.
Key Goal of Access
Expanding local funding for ECE services is a key goal for the countywide Early Learning
Master Plan (ELMP) because it addresses a major barrier to access – inadequate funding.
Existing state and federal funds for preschool are not sufficient to make preschool available
to all the low- and middle-income children who need it. Even if the county meets the goal of
increasing access to ECE by enrolling all eligible children in TK, and increasing access to the
California State Preschool program, there will still be thousands of additional spaces needed
to meet the goal of providing access to about 75 percent of the age group. Adding local
funds to address this gap and to help subsidize universal access to ECE will improve the
affordability of ECE programs for families and create socioeconomic diversity in preschool
classrooms. Expanding local funding for ECE services could also affect other aspects of the
ELMP. For example, Program Quality could be affected by ensuring that new or expanded
programs participate in QUALITY MATTERS, and a set-aside of this funding could be used to
support QUALITY MATTERS sustainability. Facilities could be affected by using a set-aside of
local initiative funds to provide facilities training and technical assistance for providers.
Workforce Development could also be affected by requiring programs to meet certain staff
qualification standards or enroll in California’s statewide ECE staff registry, and through
increased demand for trained and culturally competent staff as programs expand.
Given the magnitude of the existing unmet needs for low- and middle-income children, the
primary recommended method for increasing local funding is the passage of a local funding
initiative. To develop such an initiative, the ELMP also proposes the consideration of a
sliding fee scale, as is used in several other communities, such as Denver, Colorado, that
have implemented such initiatives.
The county also has several other opportunities to augment investments from the proposed
local funding initiative. First, the ELMP proposes that school districts use the state’s Local
Control Accountability Plan/Local Control Funding Formula (LCAP/LCFF) process to provide
or expand their existing ECE programs. Doing so will help build the case for both additional
local and state investments in ECE.
61 California Child Care Resource and Referral Network. (2015). 2015 California child care portfolio. San Francisco, CA: Author. Retrieved from: https://d3n8a8pro7vhmx.cloudfront.net/rrnetwork/pages/204/attachments/original/1456339909/Santa_Clara__County__2.23.2016.pdf?1456339909 62 United States Department of Health and Human Services. (2015). 45 CFR Part 98 Child Care and Development Fund (CCDF) Program; Proposed rule. (80)247. Retrieved from: https://www.gpo.gov/fdsys/pkg/FR-2015-12-24/pdf/2015-31883.pdf

80
Second, the ELMP urges school districts to use federal Every Student Succeeding Act (ESSA)
funds to support direct ECE service provision, professional development, and ECE to K-12
transition. Although ESSA is a federal program, school districts may determine whether and
how many of these funds to use for preschool-aged children. Some local universal preschool
initiatives across the nation, such as in Boston and Washington, DC, use ESSA funds to help
expand and improve preschool.63 Within California, some school districts, as in Elk Grove
(near Sacramento) and in Merced, have, over the last decade, used these funds to make
preschool accessible to virtually all students within specified schools, including those
children above the income eligibility requirements for other publicly subsidized programs.64
ESSA is more flexible than other public funds in supporting ECE programs. In school-wide
ESSA, the funds may be used for any child, regardless of family income. The only limitation is
that investing ESSA funds in preschool may require taking away resources currently invested
in older children. That said, because of abundant research that investing upfront in early
education is more effective than later compensatory efforts, allocating ESSA funds for early
childhood makes not only educational but also financial sense.
Third, the ELMP proposes that Santa Clara County examine the feasibility of using Pay for
Success (PFS) outcome-based contracting models to provide ECE services. Pay for Success
is a relatively recent funding innovation whereby private investors invest up-front for
promising social or educational programs, and government agencies return the money with
interest after the program begins to provide savings in other areas. In Salt Lake City, Utah,
Pay for Success, financed with $1 million by Goldman Sachs and J.B. Pritzker, helps support
a preschool initiative for disadvantaged children. Although the PFS model by itself may have
limitations as a primary or long-term funding source for preschool, it has helped build the
case for state investment in preschool. As of 2014, the Utah State Legislature, initially
reluctant to invest in preschool, has allocated an additional $3 million for the Salt Lake City
PFS initiative.65
Finally, the ELMP proposes that the county work with cities and library districts to expand
access to and improve the quality of existing recreational preschool, child care, early
literacy, and other ECE programs. City recreational programs and libraries represent a
substantial public resource for ECE programs, especially for after-school care for school-age
children.
63 Muenchow, S. and Weinberg, E. (2016). Ten questions local policymakers should ask about expanding access to preschool. San Mateo, CA: Author. Retrieved from: http://www.air.org/resource/ten-questions-local-policymakers-should-ask-about-expanding-access-preschool 64 Muenchow, S. (2004). Preschool for All: Step by step: A planning guide and toolkit. American Institutes for Research. Retrieved from: www.earlylearningsystems.org. 65 Muenchow, S. and Weinberg, E. (2016). Ten questions local policymakers should ask about expanding access to preschool. San Mateo, CA: Author. Retrieved from: http://www.air.org/resource/ten-questions-local-policymakers-should-ask-about-expanding-access-preschool

81
Access Goals, Milestones, and Actions
Key Goal 1: Expand Local Funding for ECE Services
Two-Year Milestone: A local funding initiative to support ECE services has been passed.
Actions:
• Create local needs assessment (e.g., for a variety of child ages, income levels).
• Develop sliding fee scale models and cost estimates.
• Determine funding mechanism and estimate funds generated.
• Identify opportunities and potential funding sources for braiding and blending funds to
support implementation.
• Create initiative partnership and infrastructure.
• Develop and execute campaign strategy.
Five-Year Milestone: Implementation of local initiative is ongoing.
Seven-Year Milestone: Implementation of local initiative is ongoing.
Two-Year Milestone: Three school districts have included ECE services in their Local
Control Accountability Plan (LCAP).
Actions:
• Advocate for districts to include ECE in their LCAP through the community input
process.
• Provide districts with template language to include in the LCAP.
•Monitor LCAP submissions for ECE content.
Five-Year Milestone: Five school districts have included ECE services in their LCAP.
Seven-Year Milestone: Ten school districts have included ECE services in their LCAP.
Two-Year Milestone: Three school districts have used Every Student Succeeding Act
(ESSA) funds to support ECE services.
Actions:
• Advocate for the inclusion of ECE in the California ESSA statewide plan.
• Provide specific content on ECE for districts during ESSA roll-out training.
• Advocate for districts to use ESSA funds to support ECE services.
Five-Year Milestone: Five school districts have used ESSA funds to support ECE services.
Seven-Year Milestone: Ten school districts have used ESSA funds to support ECE services.
Two-Year Milestone: The feasibility of using Pay For Success (PFS) to expand access to
preschool has been assessed.
Actions:
• Complete feasibility study of preschool PFS program in Santa Clara County.
• Disseminate feasibility study findings to key stakeholders.

82
Key Goal 1: Expand Local Funding for ECE Services
Five-Year Milestone: The preschool PFS program has been implemented in one school
district.
Seven-Year Milestone: The preschool program has been transitioned from PFS to
outcomes-based contract in a lead district and outcomes-based preschool services
contracts have been initiated in fast follower districts.
Two-Year Milestone: Cities and library districts have been supported in providing ECE
services.
Actions:
• Inventory existing programs and opportunities for expansion.
• Assess existing programs for quality and training needs.
• Advocate at city council and library district meetings for expanding ECE services and
improving quality.
Five-Year Milestone: Cities and library districts have been supported in providing ECE
services.
Seven-Year Milestone: Cities and library districts have been supported in providing ECE
services.
Goal 2: Enroll All Eligible Children in Transitional Kindergarten (TK) Two-Year Milestone: Countywide TK enrollment has increased to 4,000 children. Actions:
Identify school districts with lower TK enrollment than expected.
Identify district barriers to TK enrollment.
Identify schools in those districts with declining enrollment.
Advocate for increased TK enrollment in those schools.
Increase TK enrollment to 4,000 children. Five-Year Milestone: Countywide TK enrollment has increased to 5,000 children. Seven-Year Milestone: Countywide TK enrollment has increased to 25 percent of kindergarten
enrollment, for a total of approximately 6,000 children enrolled.
Goal 3: Increase Access to State Preschool Programs Two-Year Milestone: State Preschool program has expanded by 1,100 slots. Actions:
Increase eligibility threshold to 85 percent of the State Median Income.
Use the local child care pilot “slot pool” to fill available slots.
Create a centralized eligibility and wait list for ECE programs (0-5).
Encourage existing providers to contract for additional slots.
Develop and implement public awareness campaign of the new income eligibility
thresholds under the local subsidy pilot plan. Five-Year Milestone: State Preschool program has expanded by 2,100 slots. Seven-Year Milestone: N/A

83
Goal 4: Increase Access to Infant-Toddler Care and Paid Family Leave Two-Year Milestone: The number of families, and the ages of the children, needing infant-toddler
care on the centralized wait list has been determined. Actions:
Determine the current enrollment of infants and toddlers in Early Head Start (EHS)
and General Child Care (CCTR).
Create a centralized eligibility and wait list for ECE programs (ages 0-5).
Provide families with information on how to apply for federal Dependent Care Tax
Credit.
Explore the possibility of converting vacant Head Start slots to EHS slots.
Advocate for increased access to and use of parental leave.
Advocate for increased weighting for infant and toddler slots in state programs.
Determine the barriers to on-site child care programs for large employers. Five-Year Milestone: The number of infants/toddlers enrolled in publicly subsidized care has
increased by 100 percent. Seven-Year Milestone: The number of infants/toddlers enrolled in publicly subsidized care has
increased by 200 percent.

84
Articulation, Alignment, and Data Systems
Status of Articulation, Alignment, and Data Systems
The 2010 ELMP aimed for system-wide alignment from birth to third grade that includes
meaningful assessments, cross-communication, curriculum alignment, and the goal that all
children perform well in school. To that end, developmental screening has been
made available – if not uniformly institutionalized – for most children. Efforts have been
made to align standards and curriculum, and one school district has linked early care to its
elementary school database, though this remains the exception and not the norm.
Key Goals of Articulation, Alignment, and Data Systems
Articulation, Alignment, and Data Systems has two key goals – one specific to articulation
and alignment, and the second to data systems. An Early Learning Providers Network is a
key goal for the ELMP because participants can work to address the challenge that there is
currently no formal means of communication between ECE and K-12 public education.
Unique student identification numbers (i.e., CALPADS Statewide Student Identifiers [SSIDs]),
assigned at birth or at first contact with a public service/agency, is a second key goal for the
ELMP for two reasons. First, a lack of SSIDs limits the county’s ability to coordinate and align
services for children and families, as they may be served by multiple programs that are
unaware of each other’s impacts and requirements. Additionally, without this alignment,
there is no way to determine the benefit of each program and engage in continuous
improvement. Second, a unique identifier allows each student’s individual progress through
the ECE and K-12 education systems to be linked and understood – helping ECE
professionals and early elementary school grades share information and better serve the
children in their care.
ARTICULATION, ALIGNMENT, AND DATA SYSTEMS VISION STATEMENT
Children thrive in PreK to third grade classrooms that have seamless transitions and aligned
expectations. Each classroom environment respectfully recognizes where the children are
coming from and plans for children’s next steps. Alignment and articulation is fostered by
leadership and supported by systems.

85
Articulation, Alignment, and Data Systems Goals, Milestones, and Actions
Key Goal 1: Expand School- ECE Provider Networks
Two-Year Milestone: Early Learning Provider Networks (ELPNs) have been established in
at least four school districts.
Actions:
Identify one or more models for an ELPN that support partnering between districts,
ECE center-based providers, and licensed family child care home providers.
Develop training and technical assistance on implementation of an ELPN.
Begin roll-out in at least four school districts that have campus-located early
learning programs.
Five-Year Milestone: Early Learning Provider Networks have been established in at least
10 school districts.
Actions:
Continue roll-out in four additional school districts.
Include leaders of Title 5 and Title 22 programs in the networks.
Support the development of inter-district collaboration between provider networks
and leaders.
Seven-Year Milestone: Early Learning Provider Networks have been established in 90
percent of applicable districts countywide.
Key Goal 2: Assign Unique Student Identification Numbers to 0-5 Year-Old Children
Two-Year Milestone: Student identification numbers (SSIDs) have been assigned at entry
to all children in publicly subsidized preschool programs in the county.
Actions:
Evaluate the current SSID pilot to determine lessons learned and next steps.
Systematize and automate the process of assigning SSIDs to children in center-
based, publicly subsidized preschool programs.
Advocate at the state and local levels for funding to support this activity.
Five-Year Milestone: A pilot program assigning SSIDs to all children at birth or at first
contact with a public service agency has been initiated.
Actions:
Identify demonstration project partners (e.g., hospitals, libraries, service agencies).
Evaluate data system and provider needs.
Implement the demonstration project with key partners (e.g., assigning SSIDs at
Family Resource Centers [FRCs]).
Include participation in project partner programs in student data profiles, subject
to legal data protections.
Communicate with the California Department of Education the status of the
demonstration project.
Seven-Year Milestone: Universal assignment of SSIDs at birth or at first contact with a
public service agency has been initiated.
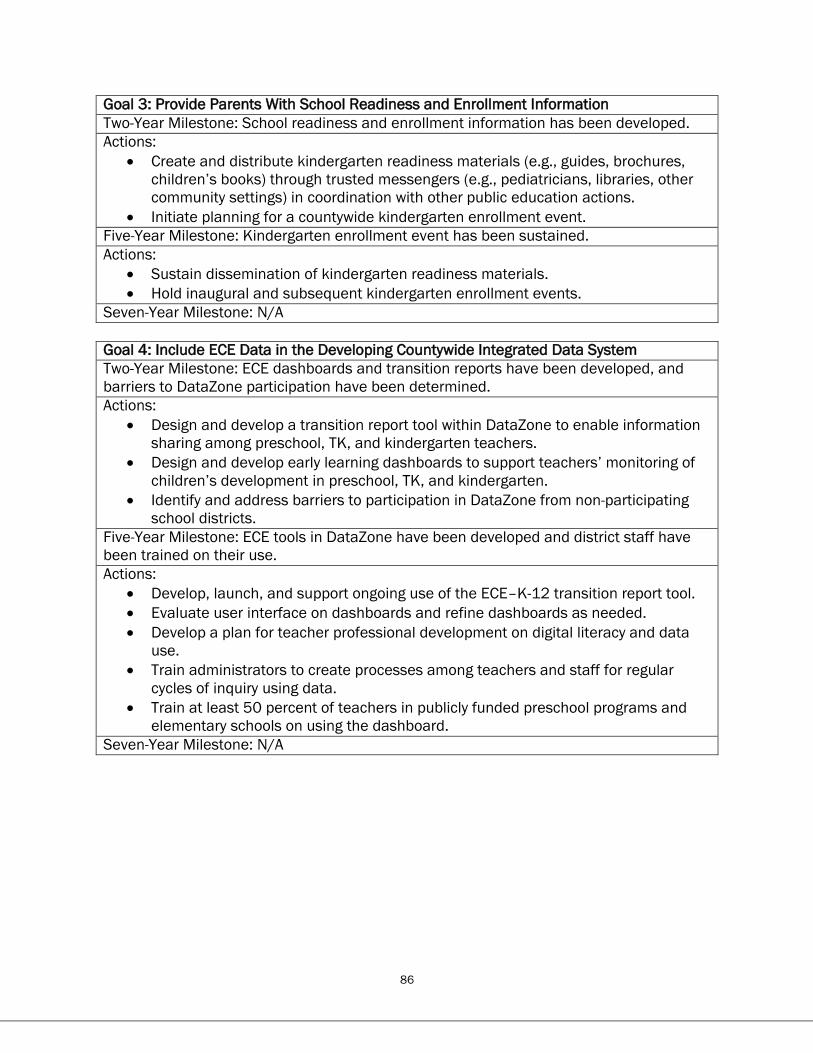
86
Goal 3: Provide Parents With School Readiness and Enrollment Information
Two-Year Milestone: School readiness and enrollment information has been developed.
Actions:
Create and distribute kindergarten readiness materials (e.g., guides, brochures,
children’s books) through trusted messengers (e.g., pediatricians, libraries, other
community settings) in coordination with other public education actions.
Initiate planning for a countywide kindergarten enrollment event.
Five-Year Milestone: Kindergarten enrollment event has been sustained.
Actions:
Sustain dissemination of kindergarten readiness materials.
Hold inaugural and subsequent kindergarten enrollment events.
Seven-Year Milestone: N/A
Goal 4: Include ECE Data in the Developing Countywide Integrated Data System
Two-Year Milestone: ECE dashboards and transition reports have been developed, and
barriers to DataZone participation have been determined.
Actions:
Design and develop a transition report tool within DataZone to enable information
sharing among preschool, TK, and kindergarten teachers.
Design and develop early learning dashboards to support teachers’ monitoring of
children’s development in preschool, TK, and kindergarten.
Identify and address barriers to participation in DataZone from non-participating
school districts.
Five-Year Milestone: ECE tools in DataZone have been developed and district staff have
been trained on their use.
Actions:
Develop, launch, and support ongoing use of the ECE–K-12 transition report tool.
Evaluate user interface on dashboards and refine dashboards as needed.
Develop a plan for teacher professional development on digital literacy and data
use.
Train administrators to create processes among teachers and staff for regular
cycles of inquiry using data.
Train at least 50 percent of teachers in publicly funded preschool programs and
elementary schools on using the dashboard.
Seven-Year Milestone: N/A

87
Goal 5: Promote the Use of Validated School Readiness Assessments
Two-Year Milestone: Districts have been encouraged to use validated school readiness
assessments (SRAs).
Actions:
Determine whether each district uses an SRA, and if so, determine which one.
Convene a multi-district workgroup to plan the shared, coordinated implementation
of an SRA with local ECE providers and other stakeholders.
Develop tools in DataZone to integrate the SRA with other ECE and early
elementary data and dashboards.
Five-Year Milestone: 33 percent of TK programs in the county have been using a common,
validated SRA, with data used to support early elementary instruction and ECE program
continuous improvement.
Seven-Year Milestone: 66 percent of TK programs in the county have been using a
common, validated SRA, with data used to support early elementary instruction and ECE
program continuous improvement.

88
Facilities
Status of Facilities
The 2010 ELMP set a goal that by 2017, there would be a coordinated, integrated and
sustainable system to ensure the planning and funding needs for quality ECE facilities for all
birth-to-eight-year-olds in Santa Clara County are met. The county established an Early
Learning Facilities Coalition to help ensure the development and maintenance of ECE
facilities in the first years after the development of the 2010 ELMP, and is now acting on the
primary facilities-related recommendation from that plan – namely, contracting for an Early
Learning Facilities Study to inventory resources, complete asset mapping, and list barriers
and potential strategies to overcome them. Although some progress in addressing child care
“deserts” has been made since the 2010 ELMP, much work remains to be done.
In addition to concerns about the number and location of ECE facilities, little is known about
their condition beyond licensure status in Santa Clara County. While state licensing
regulations cover child safety issues in ECE facilities, they do not address some of the
features of facilities known to affect program quality and child learning and development.
Finally, the cost of expanding or upgrading existing facilities and of constructing new
facilities is high, and there is no dedicated funding source to support facilities.
Key Goals for Facilities
There are two key goals for Facilities. First, there is a need for a countywide ECE facilities
technical assistance provider. Creating a structure to help create, expand, and improve ECE
facilities – and ultimately to manage new funds to support facilities -- is a key goal for the
ELMP for several reasons. Currently, there is no entity in charge of helping cities or
interested providers identify where new or expanded facilities are most needed. Zoning
requirements and fees differ in the county’s 15 different municipalities, and there is no
guidance available to either cities or providers on how to balance families’ interest in greater
access to high-quality ECE facilities with other citizen interests, such as limiting noise and
traffic congestion.
A second key goal is to develop a countywide ECE facilities development plan. Completing
the unmet need gap analysis for facilities, and developing a prioritized plan for new,
expanded, or renovated facilities, will guide any future investment in ECE facilities. A 2017
facilities study is mapping the location of 666 child care centers and 1,867 family child care
homes by zip code and proximity to elementary schools and transportation; this will identify
neighborhoods where new spaces may be most needed. Once this study is completed, it will
be important to drill down in the neighborhoods which appear to be lacking ECE facilities to
verify that the shortages are real. In addition, it will be important to develop a prioritized plan
for investments in new or expanded facilities. Because the primary focus of the facilities
FACILITIES VISION STATEMENT
There is a space that meets the quality, accessibility, and location needs of every child, birth
to age eight.

89
study has been on preschool and infant/toddler facilities, a separate study may be needed
to inform investments in school-age facilities.
Facilities Goals, Milestones, and Actions
Key Goal 1: Offer Facilities Training and Technical Assistance (TTA) to Providers
Two-Year Milestone: The business case for an ECE facilities TTA provider has been
developed.
Actions:
Secure the funding to develop the business case, which will include the “home” of
the TTA provider, the services it will offer to ECE providers, and a sustainable
funding plan.
Explore partnership/collaboration with the Low Income Investment Fund (LIIF)
around ECE facilities TTA provision.
Research the feasibility of a multi-county or regional structure for ECE facilities TTA
provision (e.g., a joint provider for San Mateo and Santa Clara Counties).
Research ways to provide bridge funds and TTA, such as business TTA by banks
and corporations.
Five-Year Milestone: The ECE facilities TTA provider has been operating and has expanded
its role into supporting the development of ECE facilities policies for cities.
Seven-Year Milestone: The ECE facilities TTA provider has been operating and has
expanded its role into managing local funds for new, expanded, and renovated facilities.
Key Goal 2: Create A Countywide ECE Facilities Development Plan
Two-Year Milestone: A countywide 0-5 ECE facilities plan has been developed.
Actions:
Complete the ECE Facilities Study and verify the level of apparent unmet need for
preschool programs and infant/toddler care in specific areas and age groups.
In areas with verified unmet need, interview existing providers – including family
child care providers – on renovation needs and interest in expansion to determine
demand for facilities.
Identify sites for new, expanded, and renovated facilities to meet this demand.
Develop a cost estimate for new, expanded, and renovated facilities.
Publicize the findings on the need for new, expanded, and renovated facilities as
part of a public education campaign to secure a long-term source of funds for ECE
programs that includes funds for facilities in coordination with other public
education actions.
Five-Year Milestone: N/A
Seven-Year Milestone: N/A

90
Goal 3: Advocate for Sustainable Sources of Funding for ECE Facilities
Two-Year Milestone: Initial advocacy efforts, aligned with the countywide ECE facilities
plan, have occurred.
Actions:
Advocate for a set-aside for facilities in the local funding initiative, including both
TTA and renovation/repair, expansion, and construction of facilities.
Identify existing resources among key stakeholders (e.g., one-time funds) that
could be used to support ECE facilities projects and infrastructure.
Advocate at the state level for reinstating funding for the Building Child Care
program and for improving the CDE/CDD revolving loan fund.
Advocate at local school boards for co-locating ECE centers on public school
campuses and including ECE in district facilities plans and bond measures.
Five-Year Milestone: N/A
Seven-Year Milestone: N/A
Goal 4: Enhance Facilities Licensing to Improve the Quality of ECE Facilities
Two-Year Milestone: The physical features of the existing facilities that most frequently
meet, those that most frequently exceed, and those that most frequently fail to meet
licensing requirements and “best practice” standards, have been determined.
Actions:
Analyze licensing citation data to determine the most frequent areas of deficiency.
Develop and conduct a provider facilities self-assessment to determine facilities
features that most often meet, exceed, or fail to meet “best practices” standards.
Advocate for creation of a pilot program to include facilities quality assessment as
part of the licensing process.
Five-Year Milestone: The licensing facilities quality assessment pilot has been conducted.
Seven-Year Milestone: The findings from the licensing facilities quality pilot have been
incorporated into the facilities licensing process.
Goal 5: Engage Cities as Partners in ECE Facilities Development
Two-Year Milestone: At least two cities in the county have included ECE in their zoning
plans.
Actions:
Advocate in all 15 cities in the county to include ECE language in planning
documents to promote more ECE-friendly zoning and permitting, and to require
that new development projects assess ECE needs and address them.
Assess the impacts of existing developer fees for ECE facilities and how to improve
on existing programs.
Advocate that cities in the county institute developer fees for ECE facilities.
Advocate that cities reinstate ECE coordinator positions.
Five-Year Milestone: At least six cities in Santa Clara County have included ECE in their
zoning plans, two have hired ECE coordinators, and two have taken steps toward
developer impact fees for ECE facilities.
Seven-Year Milestone: 90 percent of cities in Santa Clara County have included ECE in
their zoning plans, six have ECE coordinators, and two have instituted developer fees for
ECE.

91
Family Engagement
Status of Family Engagement
The 2010 ELMP set a goal of establishing a workgroup to help inspire and support family
engagement in each child’s education and development. The county has met that goal by
establishing a Family Engagement and Leadership Working Committee, which met several
times in the year following the 2010 plan and developed a logic model with specific goals.
Another part of engaging families is simply to ask them about, and listen to, their needs. In
2013, the Local Planning Council surveyed parents to determine the types of ECE they
prefer. A majority of working parents of infants and toddlers preferred informal
arrangements. Parents of preschoolers preferred some type of formal program, while the
picture was mixed for parents of school-age children. But for all age groups, it is not clear
that families, in their decision-making, can give priority to program quality. Other factors,
such as work hours and transportation, as well as the cost of care, influence their decisions.
It is also not clear that families, policymakers, and providers agree on the components of
quality. And many families may actually want a mixture of formal and informal
arrangements.
Key Goal of Family Engagement
The key goal for Family Engagement in 2017 is to implement the Strengthening Families
Family Engagement framework countywide. This framework, which provides a research-
informed approach to increase family strengths, enhance child development and reduce the
likelihood of child abuse and neglect, is based on engaging families, programs and
communities in building five protective factors. Comprehensive partnering among school,
family, and community members in support of education is critical in supporting student
achievement and closing the academic achievement gap. A common framework can provide
guidance to school district staff, families, and communities to support, plan, implement, and
evaluate strategies across multiple programs for effective family engagement.
FAMILY ENGAGEMENT VISION STATEMENT
The entire Santa Clara County community will be inspired and supported to create
partnerships where families are valued, nurtured, and engaged in children’s education and
healthy development. Every family will understand its importance in child development, and
the community will work together to increase the presence of protective factors in all
families, especially those under high stress.

92
Family Engagement Goals, Milestones, and Actions Key Goal 1: Implement a Countywide Family Engagement Framework
Two-Year Milestone: The “Strengthening Families” framework has been introduced and
initial implementation has occurred.
Actions:
Develop and implement a training and technical assistance plan for QUALITY
MATTERS providers that includes, but is not limited to, the Strengthening Families
Approach and Standards of Quality for Family Strengthening and Support.
Evaluate whether additional supports are required to meet the needs of Santa
Clara County’s diverse families and ensure all caregivers are engaged and
supported in their children’s development.
Train a cadre of local trainers on the Strengthening Families Approach, using a
“train the trainers” model.
Incorporate the Strengthening Families Approach into the QUALITY MATTERS
matrix.
Assess QUALITY MATTERS providers using a standardized assessment tool aligned
with the Strengthening Families Approach.
Five-Year Milestone: The Strengthening Families Approach has been incorporated in
provider practice.
Actions:
Develop and implement a training and technical assistance plan for non-QUALITY
MATTERS providers that includes, but is not limited to, the Strengthening Families
Approach and Standards of Quality for Family Strengthening and Support.
Assess non-QUALITY MATTERS providers using a standardized assessment tool
aligned with the Strengthening Families Approach.
Assist QUALITY MATTERS providers in using assessment outcomes for program
quality improvement.
Expand the cadre of local trainers on the Strengthening Families Approach, using a
“train the trainers” model.
Seven-Year Milestone: N/A
Goal 2: Create and Sustain a Joint Schools-ECE Family Engagement Collaborative
Two-Year Milestone: A Family Engagement Collaborative has been assembled and met at
least once.
Actions:
Identify a lead agency to facilitate the Collaborative.
Recruit members for the Collaborative, building on ELMP workgroup members and
representing all county stakeholders and key agencies.
Assemble the Collaborative.
Five-Year Milestone: Family Engagement Collaborative has met regularly, at least three
times per year.
Actions:
Convene the Family Engagement Collaborative at least three times per year to
facilitate the sharing of information and best practices across agencies.
Seven-Year Milestone: N/A

93
Goal 3: Launch a Family Engagement Public Education Campaign
Two-Year Milestone: A countywide definition of family engagement has been established,
informed by the ongoing implementation of the “Strengthening Families” framework.
Actions:
Develop a shared definition of family engagement and common vocabulary.
Identify tools and challenges (e.g., PSAs, pediatricians, corporations, other media).
Find partners (e.g., consider partnerships with the Silicon Valley Leadership Group
or Kaiser Permanente).
Determine the format of the public education campaign (e.g., consider non-TV
media like texting, podcasts, and social media).
Develop campaign content/messages, including "parents as children's first
teachers" and male and female examples.
Determine appropriate media outlets.
Five-Year Milestone: A public education campaign has been launched.
Actions:
Launch campaign in coordination with other public education actions.
Seven-Year Milestone: The effectiveness of the public education campaign has been
evaluated.
Actions:
Evaluate saturation of message and determine next steps.

94
Program Quality
Status of Program Quality
The 2010 ELMP set a goal of having 75 percent of Santa Clara County’s ECE programs
serving three- and four-year-olds participate in a Quality Rating and Improvement System
(QRIS). Santa Clara County has made great strides in establishing and implementing its
QRIS, QUALITY MATTERS … a STRONG START for kids (QUALITY MATTERS) to assess program
quality. Fifty-six percent of the assessed programs (78 of 140) are rated in the top 2 tiers of
QUALITY MATTERS; however, funding has only been sufficient to assess approximately 17
percent of all licensed centers and 2 percent of all licensed family child care homes in the
county. In addition, 45 centers are accredited by the NAEYC and 123 elementary schools
have TK programs; NAEYC-accredited programs meet some of the criteria for the highest
ranked programs in QUALITY MATTERS, and TK programs excel on the workforce
qualification components of QUALITY MATTERS. However, most children still attend
programs only required to meet state licensing requirements that are intended to protect
children’s safety but not to address program quality, and hence the actual quality of most
ECE programs, particularly those serving infants and toddlers, is still unknown.
Key Goal of Program Quality
Expanding QUALITY MATTERS establishes a common definition of quality and a progression
of standards leading to high quality for ECE settings across the county and builds upon
existing QUALITY MATTERS development and implementation efforts. Assessments of
program quality help guide investments to improve program quality and can also ensure
families are better informed consumers of ECE. Including other approaches to assessing
program quality, such as NAEYC accreditation, expands the range of programs that can be
recognized for working to improve their quality, may increase participation rates in quality
improvement efforts, and may limit expenses for duplicative assessments and thereby help
control the costs associated with QUALITY MATTERS.
PROGRAM QUALITY VISION STATEMENT
All Santa Clara County ECE providers will strive to ensure the delivery of quality ECE services in
Santa Clara County through ongoing quality rating and improvement efforts. Information about
the quality of afterschool settings will be collected and analyzed, and efforts are in place to
improve the quality of these settings. The public will be aware of the importance and utilization
of quality for care for children birth through eight years old.

95
Program Quality Goals, Milestones, and Actions Key Goal 1: Expand Participation in the Quality Rating and Improvement System (QUALITY
MATTERS) and Other Quality Accreditation Programs
Two-Year Milestone: All publicly subsidized preschool program providers have been
participating in QUALITY MATTERS and have received initial and first-follow-up QUALITY
MATTERS ratings.
Actions:
Promote participation in QUALITY MATTERS by supporting the roll-out of the
QUALITY MATTERS campaign.
Enroll all publicly contracted sites in the county in QUALITY MATTERS.
Complete QUALITY MATTERS initial and first-follow-up ratings of all publicly
contracted sites.
Analyze QUALITY MATTERS rating data to determine strengths and opportunities for
publicly subsidized programs to support ongoing program improvement.
Develop strategies to increase QUALITY MATTERS participation by non-public ECE
providers.
Consider linking the receipt of funds from the local funding initiative to
participation in QUALITY MATTERS, NAEYC, or equivalent quality accreditation.
Advocate for ongoing QUALITY MATTERS funding at the state/federal level.
Advocate for ongoing quality assessment funding carve-out in the local funding
initiative.
Secure diverse funding streams to support the operation of QUALITY MATTERS,
including local, state, and philanthropic funds.
Five-Year Milestone: Non-public programs have been participating in “QUALITY MATTERS”
and raising quality.
Actions:
Conduct a survey of a representative sample of non-public providers to determine
their degree of quality (e.g., teacher-child ratios, teacher qualifications).
Link family child care homes in the local funding initiative to hubs, such as Family
Resource Centers or school-ECE provider networks, that provide support to
improve quality (e.g., video coaching and access to screening and early
intervention services provided by schools).
Seven-Year Milestone: Parents have increased their use of quality measures to choose
programs.
Actions:
Measure the extent to which parents using non-public programs choose ECE
programs with higher quality ratings and incentivize parents to choose higher rated
programs.

96
Goal 2: Advocate for Improved Quality in Transitional Kindergarten Programs
Two-Year Milestone: Quality improvement efforts by TK programs have been supported.
Actions:
Survey TK programs on quality metrics.
Advocate at school districts for alignment between TK program features and
developmentally appropriate program quality standards.
Advocate at the state level for improved staff-child ratios in TK programs.
Advocate at the state level for ongoing funding of the California Preschool
Instructional Network (CPIN).
Support ongoing joint professional development for preschool and TK staff in “best
practices” such as Center on the Social and Emotional Foundations for Early
Learning (CSEFL), Guided Language Acquisition Design, and inclusive practices for
children with special needs.
Seven-Year Milestone: N/A
Goal 3: Support ECE Programs in Implementing Quality Improvement Strategies
Two-Year Milestone: Effective quality improvement strategies have been identified.
Actions:
Implement a survey to assess effective quality improvement strategies that are
used by Tier 4 and 5 programs participating in QUALITY MATTERS (e.g., through
Iowa’s “I” in QRIS Survey).
Develop a plan to share data on quality improvement strategies with other ECE
programs in the county.
Five-Year Milestone: A targeted coaching and technical assistance program for ECE
providers has been developed and implemented.
Actions:
Identify effective quality improvement strategies, using data from the quality
improvement analysis.
Develop a targeted coaching and technical assistance program for ECE providers.
Determine sustainable sources of funding for ongoing quality improvement efforts
Implement a targeted coaching and technical assistance program for ECE providers.
Conduct survey to assess change in use of effective quality improvement strategies.
Seven-Year Milestone: N/A
Goal 4: Provide a Common ECE Program Quality Data System
Two-Year Milestone: All QUALITY MATTERS programs have been using iPinwheel.
Actions:
Disseminate information about iPinwheel to QUALITY MATTERS program
participants.
Create a countywide program roll-out of iPinwheel.
Develop systems to import iPinwheel data into DataZone and include iPinwheel
data into early learning dashboards.
Advocate for including iPinwheel among requirements for programs participating in
the local funding initiative.
Advocate for sustained funding for program quality data systems at the state level.

97
Five-Year Milestone: Program use of iPinwheel has expanded.
Seven-Year Milestone: N/A
Goal 5: Assess the Quality of Out-of-School-Time (OST) Programs
Two-Year Milestone: The quality of existing OST programs has been assessed.
Actions:
Perform a landscape analysis to determine the number, size, location, and quality
of, and demand for, OST programs for children ages 5-8 in Santa Clara County.
Convene stakeholders to review the current understanding of quality in OST
programs, “best practices,” and the current state of OST programs in Santa Clara
County.
Implement a survey of OST programs to determine quality improvement (QI)
strategies in use.
Conduct baseline observations of OST programs to determine baseline quality.
Advocate for increased funding for OST programs and for quality set-asides in OST
funding at the state level.
Five-Year Milestone: N/A
Seven-Year Milestone: N/A

98
Workforce Development
Status of Workforce Development
The 2010 ELMP set a goal that by 2017, at least half of the teachers/providers in ECE have
at least a bachelor’s degree, and that 30 percent of the assistants have at least an
associate’s degree. In response to federal requirements, as of 2016, 83 percent of Head
Start teachers and 55 percent of Early Head Start teachers had a bachelor’s degree or
higher. In the Transitional Kindergarten program, all teachers must have at least a
bachelor’s degree, and the higher rated programs in QUALITY MATTERS typically have lead
teachers with a bachelor’s degree. Yet data are lacking on the qualifications of the
workforce serving children in other subsidized settings and privately funded programs.
Developing a strong and stable ECE workforce requires not only increasing teacher
qualifications but also compensation commensurate with higher qualifications. While Head
Start and Early Head Start programs have more than exceeded the 2010 ELMP goal
because of recent federal Head Start requirements, it is less clear whether pay increases
are commensurate with these increasing requirements. For example, as of July 2017, an
entry level (i.e., “Step One”) Head Start teacher with a bachelor’s degree in Santa Clara
County would only earn about $3,000 more per year than an entry level Head Start teacher
with an associate’s degree.66
Overall, low salaries in the field of ECE pose a substantial barrier to increasing workforce
qualifications. In the San Jose‐Sunnyvale‐Santa Clara Metropolitan Area, the mean annual
income across all occupations was $78,620 as of May 2015; however, this salary measure
varies greatly by occupation.67 As of May 2015, on average, preschool teachers earned over
$25,000 per year less than kindergarten teachers and over $35,000 less per year than
elementary school teachers. Low compensation is one factor that heavily influences the
recruitment and retention of a qualified workforce.
Key Goals of Workforce Development
There are two key goals for Workforce Development. The first key goal is reopening ECE lab
schools at community colleges to address the fact that not all entering ECE professionals
have the necessary levels of training and skills needed to support quality ECE programs.
Providing access to practicum opportunities at community colleges – the primary source of
training for new entrants into the ECE workforce – supports higher quality and consistency of
students’ initial hands-on training and experience. Many of these programs closed because
66 Santa Clara County Office of Education. (2017). Santa Clara County Office of Education 2017-18 Salary Schedule. San Jose, CA: Author. Retrieved from: http://www.sccoe.org/depts/Human-Resources/classified/Documents/Rules/HS-EHS-SP-EDUCARE-220-day-12-months.pdf 67 United States Bureau of Labor Statistics. (2015). May 2015 Metropolitan and nonmetropolitan area occupational employment and wage estimates: San Jose-Sunnyvale-Santa Clara, CA. Washington, DC: United States Department of Labor. Retrieved 2/15/17 from: http://www.bls.gov.
WORKFORCE VISION STATEMENT
Santa Clara County has a sufficient, stable, and diverse high-quality early learning workforce
with access to professional development supports and adequate compensation.

99
operations costs exceeded the reimbursement rates provided by the state, which made
them no longer financially viable. Changes in state funding, and the county’s local child care
funding pilot, have changed funding conditions and may allow these programs to reopen.
Reinstating ECE lab schools could affect other aspects of ELMP. For example, Facilities
would be impacted, as opening lab schools would increase the capacity of, and slots in,
quality facilities. Program Quality would be improved as a result of better pre-service training
– especially since implementation of the ELMP will require a larger ECE workforce.
The second key goal is perhaps the most challenging in the entire ELMP – that of improving
compensation for qualified teachers and caregivers in the ECE workforce. Low salaries in the
field of ECE pose the most significant barrier to providing the quality programs necessary to
support children and families. Low salaries make the profession less attractive to new
entrants and increase staff turnover. The cost of increased qualifications is often
unaffordable for staff. At the same time, substantial increases in ECE workforce
compensation can only be financed by higher parent fees, increasing the public expenditure
per child, and serving fewer children, or by significantly increasing public expenditures on
ECE. Given that quality ECE is currently unaffordable for most families in Santa Clara County,
and that there are already substantial access gaps, improving compensation for the ECE
workforce requires this final option. Compelling advocacy for worthy wages for ECE
professionals requires understanding both the costs and benefits of providing these wages,
and the costs and consequences of maintaining the status quo. Improving the current
situation will require a substantial and ongoing advocacy effort at the state level and will
require coordination with other advocates and key stakeholders.
Workforce Goals, Milestones, and Actions Key Goal 1: Support Re-opening ECE Lab Schools at Community Colleges
Two-Year Milestone: A plan to reinstate ECE lab schools has been developed.
Actions:
Determine the funds needed to re-establish at least one lab school on each
community college campus or to ensure that every community college is affiliated
with one.
Interview community college ECE departments at De Anza, Evergreen, Foothill,
Gavilan, Mission, San Jose City, West Valley, and Community College Division at the
state level, to identify barriers to reopening lab schools.
Assess the feasibility of community college–provider partnerships to reopen lab
schools and/or provide practicum sites for ECE students.
Develop a plan based on findings from the previous actions.
Five-Year Milestone: A plan to reinstate ECE lab schools has been implemented.
Actions:
Select community colleges/location(s).
Open an ECE lab school(s) in at least one community college.
Seven-Year Milestone: N/A

100
Key Goal 2: Advocate for Worthy Wages for ECE Professionals
Two-Year Milestone: A classification and compensation study and recommended salary
scale has been developed.
Actions:
Compare the upcoming Workforce Study conducted by Center for the Study of Child
Care Employment (expected around 2019) to the previous 2006 study to
determine changes.
Conduct a classification and compensation study to determine salary schedules for
QUALITY MATTERS-rated ECE programs in the county.
Analyze reasons for, and the cost of, employee turnover at ECE programs.
Develop a recommended ECE salary scale and determine its impact on ECE
programs and providers.
Convene a working group to identify and address compensation issues.
Five-Year Milestone: A state-level advocacy campaign, based on a local workforce
analysis, has been developed.
Actions:
Advocate for worthy wages through increased state funding for ECE programs.
Seven-Year Milestone: N/A
Goal 3: Increase Enrollment in the ECE Workforce Registry
Two-Year Milestone: Use of the ECE Workforce Registry has been incentivized.
Actions:
Determine ways to encourage/incentivize more educators/providers, including
those in the private sector, to use the California Early Care and Education
Workforce Registry.
Advocate for use of the Workforce Registry to be a prerequisite for receiving funds
from the local funding initiative.
Advocate for increased state funding of the Workforce Registry.
Advocate for all QUALITY MATTERS programs to enroll in the Workforce Registry.
Five-Year Milestone: All graduates of postsecondary ECE programs and all staff in QUALITY
MATTERS programs have been enrolled in the Workforce Registry.
Seven-Year Milestone: Staff in the majority of licensed ECE programs in the county have
been enrolled in the Workforce Registry.

101
Goal 4: Include ECE Content in Pre- and In-Service Elementary School Administrator
Training
Two-Year Milestone: ECE curriculum has been included in SCCOE’s Administrator
Credentialing program and an annual Early Learning Leadership Academy for elementary
school principals has been held.
Actions:
Develop and include an ECE module in the SCCOE Administrative Credential
training program.
Continue to offer the existing Early Learning Leadership Academy program
developed by Silicon Valley Community Foundation.
Evaluate program outcomes from the Early Learning Leadership Academy.
Five-Year Milestone: ECE curriculum in other credentialing programs in the county has
expanded.
Actions:
Share the curriculum with other Administrative Credential providers/expand
throughout the county.
Seven-Year Milestone: N/A
Goal 5: Create a Talent Pipeline Management Strategy for the ECE Workforce
Two-Year Milestone: A Talent Pipeline Management Strategy (TPMS) has been developed.
Actions:
Determine the total size of the early education workforce needed to serve both 1)
100% of children and 2) low-income children in Santa Clara County in high-quality
ECE programs.
Conduct a survey of undeclared freshmen in at least one university (e.g., San Jose
State University) to determine their attitudes towards ECE as a career.
Establish an Employer Collaborative (EC) consisting of representatives of institutes
of higher education, private ECE providers, and publicly funded ECE providers.
Identify the workforce factors or unfilled positions that are inhibiting providers from
expanding or improving the quality of their programs.
Determine what kinds of qualifications/skills are needed to fill those ECE provider
positions.
Examine where employers are getting their talent and whether those training and
education partners have the ability to fill the needed demand.
Determine how to use the TPMS data collected to encourage training partners to
become more responsive to employer needs.
Determine change in gap between workforce need and supply to establish whether
clearer, well-defined pathways for learner success have been created.
Five-Year Milestone: TPMS recommendations have been implemented.
Actions:
Modify existing pre-service training opportunities as required to meet the
recommendations of the TPMS recommendations.
Develop and pilot a database/tool to use countywide to post job opportunities/pay
scale (e.g., modeled after San Jose State University’s database) aligned with and
connected to the Workforce Registry.
Seven-Year Milestone: N/A
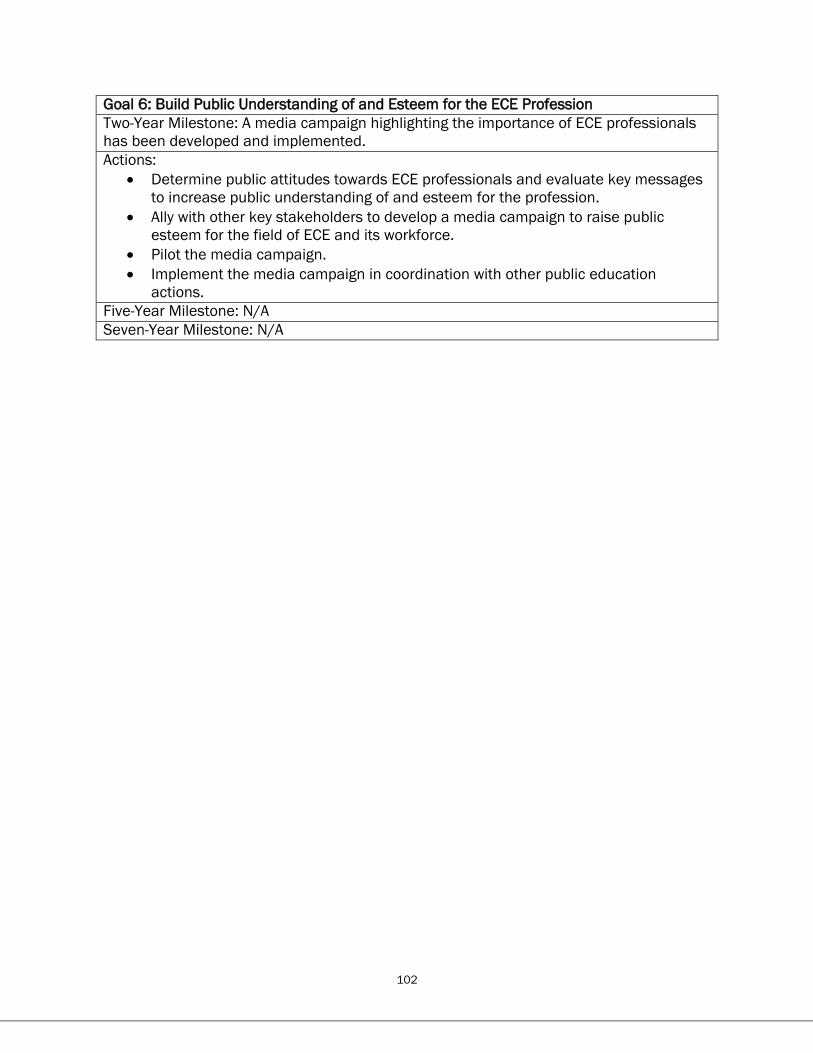
102
Goal 6: Build Public Understanding of and Esteem for the ECE Profession
Two-Year Milestone: A media campaign highlighting the importance of ECE professionals
has been developed and implemented.
Actions:
Determine public attitudes towards ECE professionals and evaluate key messages
to increase public understanding of and esteem for the profession.
Ally with other key stakeholders to develop a media campaign to raise public
esteem for the field of ECE and its workforce.
Pilot the media campaign.
Implement the media campaign in coordination with other public education
actions.
Five-Year Milestone: N/A
Seven-Year Milestone: N/A

103
References
American Institutes for Research. (2017). Early learning needs assessment tool. San Mateo,
CA: Author. www.elneedsassessment.org.
Anthony, J., Manship, K., Chandra, C., & Muenchow, S. (2009). Preschool supply and
demand in the state of California: An assessment of preschool enrollment in
publicly contracted and privately operated preschool programs. San Mateo, CA:
Author.
ASAPconnect. (2011). California core competencies for before and/or after school
professionals. Los Angeles County Office of Education, the Monterey County Office of
Education, the Sacramento County Office of Education, and the San Bernardino
County Superintendent of Schools Office. Retrieved from: http://assets-production-
webvanta-com.s3-us-west-
2.amazonaws.com/000000/22/64/original/pdf/TAPE%20Core%20Competencies_V
ersion1.pdf.
California Child Care Resource and Referral Network. (2015). 2015 California child care
portfolio. San Francisco, CA: Author. Retrieved from:
https://d3n8a8pro7vhmx.cloudfront.net/rrnetwork/pages/204/attachments/origina
l/1456339909/Santa_Clara__County__2.23.2016.pdf?1456339909.
California Child Care Resource and Referral Network. (2011). 2011 California child care
portfolio. San Francisco, CA: Author. Retrieved from:
http://d3n8a8pro7vhmx.cloudfront.net/rrnetwork/pages/88/attachments/original/
1387861343/2011-portfolio-combined.pdf?1387861343.
California Department of Education (2017). Management bulletin 17-08. Sacramento, CA:
Author. Retrieved from: http://www.cde.ca.gov/sp/cd/ci/mb1708.asp.
California Department of Education. (2017). RTT-ELC quality continuum framework rating
matrix quality continuum framework rating matrix with elements and points for
consortia common tiers 1, 3, and 4. Sacramento, CA: Author. Retrieved from:
http://www.cde.ca.gov/sp/cd/rt/caqrisratingmatrix.asp.
California Department of Education. (2017). Transitional Kindergarten FAQs. Sacramento,
CA: Author. Retrieved from:
http://www.cde.ca.gov/ci/gs/em/kinderfaq.asp#program.
California Department of Education. (2016). California Assessment of Student
Performance and Progress (CAASPP) data: CAASPP Research Files 2015-16.
Retrieved 1/6/17 from: http://caaspp.cde.ca.gov/sb2016/ResearchFileList.
California Department of Education. (2016). Enrollment by grade for 2015-16. County
enrollment by grade (with district data). Sacramento, CA: Author. Retrieved 2/17/16
from: http://data1.cde.ca.gov/dataquest/.

104
California Department of Education. (2016). Family fee schedule. Sacramento, CA: Author.
Retrieved from: https://www.mcs4kids.com/documents/famfeeschedule2016.pdf
California Department of Education (2016). Free or reduced-price meals county
summary (with district data) 2015-16. Sacramento, CA: Author. Retrieved
2/3/17 from:
http://data1.cde.ca.gov/dataquest/Cbeds2.asp?FreeLunch=on&cChoice=CoProf2&c
Year=2015-
16&TheCounty=43%2CSANTA%5ECLARA&cLevel=County&cTopic=Profile&myTimeFr
ame=S&submit1=Submit.
California Department of Education. (2015). Transitional kindergarten program
participation (census day). Sacramento, CA: Author. Retrieved from:
https://www.cde.ca.gov/ds/sd/sd/filestkdata.asp.
California Department of Education. (2014). CDD-801A monthly report, October 2014.
Sacramento, CA: Author.
California Department of Finance. (2014). Historical and projected state and county births,
1970–2023, with actual and projected fertility rates by mother’s age and
race/ethnicity, 2000–2023. Sacramento, CA: Author. Retrieved from:
http://www.dof.ca.gov/Forecasting/Demographics/projections/Historical_And_Proje
cted_Births/.
California Department of Social Services. (2017). All county letter (ACL) No. 16-70.
Sacramento, CA: Author. Retrieved from:
http://www.cdss.ca.gov/lettersnotices/EntRes/getinfo/acl/2016/16-70.pdf.
Center for Women’s Welfare. (2015). Self-sufficiency standards. Seattle, WA: University of
Washington. http://www.selfsufficiencystandard.org/self-sufficiency-standard-state.
Center for Women’s Welfare. (2012). The self-sufficiency standard by select household
characteristics: California 2012. Seattle, WA: University of Washington. Retrieved
from: http://www.insightcced.org/past-archives/insight-networks/building-economic-
security-for-all-besa/californians-for-economic-security-cfes/the-self-sufficiency-
standard-for-california/.
Children Now. (2013). 2012-13 California county scorecard. Oakland, CA: Author. Retrieved
from: http://scorecard.childrennow.org/resources/scorecard12_notes.pdf.
City of San Jose and Silicon Valley Community Foundation. (2016). My Brother’s Keeper:
San Jose working together to ensure boys and young men of color thrive: Local
action plan. San Jose, CA: Authors. Retrieved from:
https://www.siliconvalleycf.org/sites/default/files/publications/mbk-sj-report-and-
action-plan.pdf.
Community Child Care Council of Santa Clara County. (2017). Services overview. San Jose,
CA: Author. Retrieved from: http://www.4c.org/parent/.

105
David and Lucile Packard Foundation. (2016). What we’re doing: After school and summer
enrichment: ASAPconnect. Los Altos, CA: Author. Retrieved from:
https://www.packard.org/what-we-fund/children-families-and-communities/what-
were-doing/school-summer-enrichment/.
The Early Learning Lab. (2017). Starting smart and strong. Oakland, CA: Author. Retrieved
from: https://earlylearninglab.org/what-we-do/starting-smart-and-strong/.
Educare California. (2016). Educare California at Silicon Valley. San Jose, CA: Author.
Retrieved from: http://www.educareschools.org/schools/california-at-silicon-valley/.
Educare California. (2015). Educare California at Silicon Valley opens to children, parents.
San Jose, CA: Author. Retrieved from: http://www.educareschools.org/educare-
california-at-silicon-valley-opens-to-children-parents/.
Farrie, D. (2014). The Abbot preschool program: A 15-year progress report. Philadelphia, PA:
Education Law Center. Retrieved from:
http://www.edlawcenter.org/assets/files/pdfs/publications/AbbottPreschool15Year
ProgressReportMay2014.pdf.
First 5 Santa Clara. (2017). QRIS participant current rating by site. San Jose, CA: Author.
Retrieved from: http://www.first5kids.org/early-learning/qris-list.
First 5 Santa Clara County. (2016). Letter from First 5 Santa Clara County.
http://www.e3institute.org/cs/e3/download/fsfile/2355/CARES_Plus_End_letter.pd
f?x-r=pcfile_dpub.
Harder+Company. (2016). PreK-3rd grade alignment readiness in Santa Clara County: Brief
findings. San Mateo, CA: Silicon Valley Community Foundation Center for Early
Learning.
Health Trust. (2017). Family resource center initiative. San Jose, CA: Author. Retrieved from:
http://healthtrust.org/services/learning-together-initiative/.
Hill Scott, K. (2010). Santa Clara County early learning master plan. San Jose, CA: Santa
Clara County Office of Education; Los Altos, CA: David and Lucile Packard Foundation.
Retrieved from: http://www.sccoe.org/depts/students/early-learning-
services/Documents/Master_Plan.pdf
Manship, K., Holod, A., Quick, H., Ogut, B., Brodziak de los Reyes, I., Anthony, J., Jacobson
Chernoff, J., Hauser, A., Martin, A., Keuter, S., Vontsolos, E., Rein, E., & Anderson, E.
(2017). Transitional kindergarten in California: The impact of Transitional
kindergarten on English Learner students. San Mateo, CA: American Institutes for
Research. Retrieved from: http://www.air.org/resource/impact-transitional-
kindergarten-california-students.
Muenchow, S. (2004). Preschool for All: Step by step: A planning guide and toolkit. American
Institutes for Research. Retrieved from: www.earlylearningsystems.org.

106
Muenchow, S., & Weinberg, E. (2016). Ten questions local policymakers should ask about
expanding access to preschool. San Mateo, CA: Author. Retrieved from:
http://www.air.org/resource/ten-questions-local-policymakers-should-ask-about-
expanding-access-preschool.
Office of Assemblyman Rich Gordon. (2016). AB2368: Santa Clara County child care subsidy
pilot. Retrieved 2/27/16 from:
https://cappa.memberclicks.net/assets/PublicPolicy/2016/Legislation/ab%202368
%20fact%20sheet.pdf.
Office of Head Start Administration for Children and Families. (2016). 2015-2016 Head
Start program information report 09CH9192-000 Santa Clara Office of Education.
Washington, DC: U.S. Department of Health and Human Services.
Office of Head Start Administration for Children and Families. (2016). 2015-2016 Early
Head Start program information report 09CH9192-200 Santa Clara Office of
Education. Washington, DC: U.S. Department of Health and Human Services.
Office of Mayor Sam Liccardo, City of San José Silicon Valley Community Foundation, &
Applied Survey Research. (2015). My Brother’s Keeper: San José working together to
ensure boys and young men of color thrive: A policy and program review and a
framework for action. Retrieved from:
https://www.sanjoseca.gov/DocumentCenter/View/48175
Office of the Superintendent, Administrative Services of the Santa Clara County Office of
Education. (2013). 2013 Santa Clara County child care needs assessment. Santa
Clara, CA: Local Early Education Planning Council of Santa Clara County.
Santa Clara County Board of Supervisors. (2017). The county of Santa Clara California:
Report 85082. San Jose, CA: County of Santa Clara.
http://sccgov.iqm2.com/Citizens/Detail_LegiFile.aspx?Frame=&MeetingID=8495&M
ediaPosition=&ID=85082&CssClass.
Santa Clara County Office of Education. (2017). Santa Clara County Office of Education
2017-18 salary schedule. San Jose, CA: Author. Retrieved from:
http://www.sccoe.org/depts/Human-Resources/classified/Documents/Rules/HS-
EHS-SP-EDUCARE-220-day-12-months.pdf.
Santa Clara County Office of Education. (2017). Santa Clara County Office of Education
DataZone. San Jose, CA: Author. Retrieved from:
http://www.sccoe.org/depts/isc/ISC%20Resources/Santa%20Clara%20County%20
DW%20FAQ.pdf.
Santa Clara County Office of Education. (2017). Transitional kindergarten (TK) professional
development reimbursement program. San Jose, CA: Author. Retrieved from:
http://www.sccoe.org/depts/students/lpc/Pages/TK-Program.aspx.

107
Santa Clara County Office of Education. (2016). Together for kinder readiness. San Jose, CA:
Author. Retrieved from: http://www.sccoe.org/depts/students/early-learning-
services/Documents/Flyer%203%20LC%20-%20Symposium%20July%2019-21.pdf.
United States Bureau of Labor Statistics. (2015). May 2015 Metropolitan and
nonmetropolitan area occupational employment and wage estimates: San Jose-
Sunnyvale-Santa Clara, CA. Washington, DC: United States Department of Labor.
Retrieved 2/15/17 from: http://www.bls.gov.
United States Census Bureau. (2016). Annual estimates of the resident population: April 1,
2010 to July 1, 2015. Washington, DC: Author. Retrieved from:
http://factfinder.census.gov.
United States Department of Health and Human Services. (2015). 45 CFR Part 98 Child
Care and Development Fund (CCDF) program; Proposed rule. (80)247. Retrieved
from: https://www.gpo.gov/fdsys/pkg/FR-2015-12-24/pdf/2015-31883.pdf.
United States Department of Housing and Urban Development. (2017). Income limits.
Washington, DC: Author. Retrieved from:
https://www.huduser.gov/portal/datasets/il.html.
United States Department of Housing and Urban Development. (2014). Income limits.
Washington, DC: Author. Retrieved from:
https://www.huduser.gov/portal/datasets/il.html.
WestEd E3 Institute and First 5 Santa Clara County. (2015). Santa Clara County CARES Plus
fact sheet, 2015-2016. San Jose, CA: Author. Retrieved from:
http://www.e3institute.org/cs/e3/download/fsfile/2336/CARES%20Plus%20Y5%20
Fact%20Sheet.pdf?x-r=pcfile_dpub

108
Appendix

109
Exhibit C-1. Capacity, Population Estimates, and Enrollment in Licensed, Center-Based,
Subsidized Settings and TK Among Santa Clara County’s Young Children in 2010 and 2014a
2010 2014
Infant/
toddler
(0-2)
Preschool
(3-4)
5-year-
olds
6-12-
year-olds
Infant/
toddler
(0-2)
Preschool
(3-4)
5-year-
olds
6-12-
year-olds
Licensed Child Care Capacity
A Licensed Child Care
Capacityb 10,626 33,306 2,475 16,288 11,250 37,280 2,692 15,901
A(a) Licensed Child Care
Centersb 5,898 25,622 1,490 9,983 6,649 29,804 1,733 9,767
A(b) Licensed Family Child
Care Homesb 4,728 7,684 985 6,305 4,601 7,476 959 6,134
Number of Children
B Number of Children
B(a)
Based on Births as
reported by the
Department of Finance
(projected for 1-year-
olds in 2014)c
75,866 54,426 26,553 188,207 70,924 47,588 25,200 161,243
Number of Children Enrolled in Licensed, Center-based, Subsidized Settings and TK
C Title 5 State Preschool
Programd 62 4,711 0 0 0 4,196 69 0
D Title 5 Migrant Child
Care Programe 17 14 1 14 0 0 0 0
E Title 5 Severely
Handicapped Programf 0 0 0 0 0 0 0 0
F Title 5 Center-Basedg 551 74 265 1,162 434 79 173 818
G Title 5 Family Child
Care Home Networkh 61 179 10 25 117 120 9 14
H Early Head Start/Head
Starti 298 2,082 0 0 127 1,753 0 0
H(a) Received Head Start
funding onlyj 197 1,374 0 0 84 1,157 0 0
I TKk 0 0 0 0 0 3,006 0 0
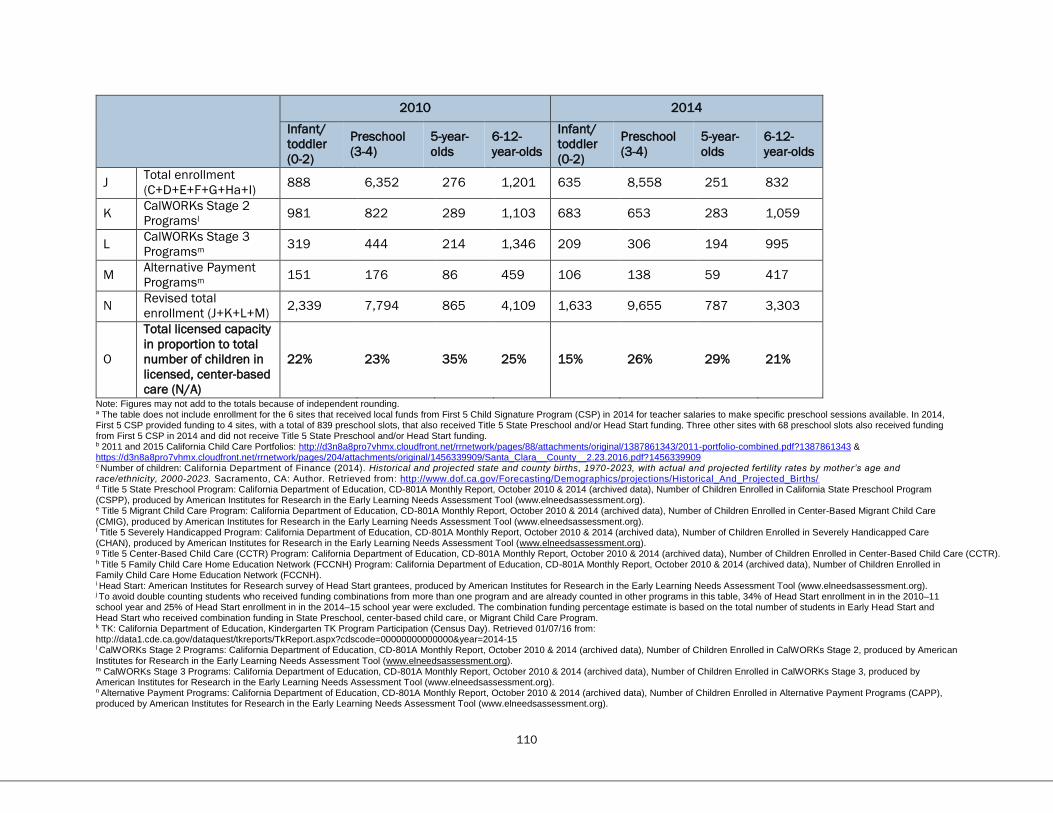
110
2010 2014
Infant/
toddler
(0-2)
Preschool
(3-4)
5-year-
olds
6-12-
year-olds
Infant/
toddler
(0-2)
Preschool
(3-4)
5-year-
olds
6-12-
year-olds
J Total enrollment
(C+D+E+F+G+Ha+I) 888 6,352 276 1,201 635 8,558 251 832
K CalWORKs Stage 2
Programsl 981 822 289 1,103 683 653 283 1,059
L CalWORKs Stage 3
Programsm 319 444 214 1,346 209 306 194 995
M Alternative Payment
Programsm 151 176 86 459 106 138 59 417
N Revised total
enrollment (J+K+L+M) 2,339 7,794 865 4,109 1,633 9,655 787 3,303
O
Total licensed capacity
in proportion to total
number of children in
licensed, center-based
care (N/A)
22% 23% 35% 25% 15% 26% 29% 21%
Note: Figures may not add to the totals because of independent rounding. a The table does not include enrollment for the 6 sites that received local funds from First 5 Child Signature Program (CSP) in 2014 for teacher salaries to make specific preschool sessions available. In 2014, First 5 CSP provided funding to 4 sites, with a total of 839 preschool slots, that also received Title 5 State Preschool and/or Head Start funding. Three other sites with 68 preschool slots also received funding from First 5 CSP in 2014 and did not receive Title 5 State Preschool and/or Head Start funding. b 2011 and 2015 California Child Care Portfolios: http://d3n8a8pro7vhmx.cloudfront.net/rrnetwork/pages/88/attachments/original/1387861343/2011-portfolio-combined.pdf?1387861343 & https://d3n8a8pro7vhmx.cloudfront.net/rrnetwork/pages/204/attachments/original/1456339909/Santa_Clara__County__2.23.2016.pdf?1456339909 c Number of children: California Department of Finance (2014). Historical and projected state and county births, 1970-2023, with actual and projected fertility rates by mother’s age and race/ethnicity, 2000-2023. Sacramento, CA: Author. Retrieved from: http://www.dof.ca.gov/Forecasting/Demographics/projections/Historical_And_Projected_Births/ d Title 5 State Preschool Program: California Department of Education, CD-801A Monthly Report, October 2010 & 2014 (archived data), Number of Children Enrolled in California State Preschool Program (CSPP), produced by American Institutes for Research in the Early Learning Needs Assessment Tool (www.elneedsassessment.org). e Title 5 Migrant Child Care Program: California Department of Education, CD-801A Monthly Report, October 2010 & 2014 (archived data), Number of Children Enrolled in Center-Based Migrant Child Care (CMIG), produced by American Institutes for Research in the Early Learning Needs Assessment Tool (www.elneedsassessment.org). f Title 5 Severely Handicapped Program: California Department of Education, CD-801A Monthly Report, October 2010 & 2014 (archived data), Number of Children Enrolled in Severely Handicapped Care (CHAN), produced by American Institutes for Research in the Early Learning Needs Assessment Tool (www.elneedsassessment.org). g Title 5 Center-Based Child Care (CCTR) Program: California Department of Education, CD-801A Monthly Report, October 2010 & 2014 (archived data), Number of Children Enrolled in Center-Based Child Care (CCTR). h Title 5 Family Child Care Home Education Network (FCCNH) Program: California Department of Education, CD-801A Monthly Report, October 2010 & 2014 (archived data), Number of Children Enrolled in Family Child Care Home Education Network (FCCNH). i Head Start: American Institutes for Research survey of Head Start grantees, produced by American Institutes for Research in the Early Learning Needs Assessment Tool (www.elneedsassessment.org). j To avoid double counting students who received funding combinations from more than one program and are already counted in other programs in this table, 34% of Head Start enrollment in in the 2010–11 school year and 25% of Head Start enrollment in in the 2014–15 school year were excluded. The combination funding percentage estimate is based on the total number of students in Early Head Start and Head Start who received combination funding in State Preschool, center-based child care, or Migrant Child Care Program. k TK: California Department of Education, Kindergarten TK Program Participation (Census Day). Retrieved 01/07/16 from: http://data1.cde.ca.gov/dataquest/tkreports/TkReport.aspx?cdscode=00000000000000&year=2014-15 l CalWORKs Stage 2 Programs: California Department of Education, CD-801A Monthly Report, October 2010 & 2014 (archived data), Number of Children Enrolled in CalWORKs Stage 2, produced by American Institutes for Research in the Early Learning Needs Assessment Tool (www.elneedsassessment.org). m CalWORKs Stage 3 Programs: California Department of Education, CD-801A Monthly Report, October 2010 & 2014 (archived data), Number of Children Enrolled in CalWORKs Stage 3, produced by American Institutes for Research in the Early Learning Needs Assessment Tool (www.elneedsassessment.org). n Alternative Payment Programs: California Department of Education, CD-801A Monthly Report, October 2010 & 2014 (archived data), Number of Children Enrolled in Alternative Payment Programs (CAPP), produced by American Institutes for Research in the Early Learning Needs Assessment Tool (www.elneedsassessment.org).

111
Exhibit C-2. Estimated Eligibility, Enrollment, and Unmet Need Among Santa Clara’s Three-
and Four-Year Olds in 2014 by City and Zip Codea
City/Zip Code
A. Need (Assuming 90%
Participation Rate)
B. Unmet Need (Based on
Enrollment in Programs
That Meet California’s Title
5 Child Development
Standards or the Federal
Head Start Performance
Standards)*
C. Percent Unmet Need
(Based on Enrollment in
Programs That Meet
California’s Title 5 Child
Development Standards or
the Federal Head Start
Performance Standards)*
3 4 3 & 4 3 4 3 & 4 3 4 3 & 4
Alviso 2 5 7 < 10 < 10 < 10 < 10 < 10 < 10
95002 2 5 7 < 10 < 10 < 10 < 10 < 10 < 10
Campbell 140 189 329 123 134 257 88% 71% 78%
95008 140 189 329 123 134 257 88% 71% 78%
95009 0 0 0 < 10 < 10 < 10 < 10 < 10 < 10
95011 0 0 0 < 10 < 10 < 10 < 10 < 10 < 10
Coyote 0 1 1 < 10 < 10 < 10 < 10 < 10 < 10
95013 0 1 1 < 10 < 10 < 10 < 10 < 10 < 10
Cupertino 3 202 205 < 10 191 191 < 10 95% 95%
95014 3 202 205 < 10 191 191 < 10 95% 95%
95015 0 0 0 < 10 < 10 < 10 < 10 < 10 < 10
Gilroy 182 529 711 67 252 319 37% 48% 45%
95020 182 529 711 67 252 319 37% 48% 45%
95021 0 0 0 < 10 < 10 < 10 < 10 < 10 < 10
Holy City 0 0 0 < 10 < 10 < 10 < 10 < 10 < 10
95026 0 0 0 < 10 < 10 < 10 < 10 < 10 < 10
Los Altos 64 57 121 64 43 107 100% 75% 88%
94022 30 25 55 30 11 41 100% 44% 75%
94024 34 32 66 34 32 66 100% 100% 100%
Los Gatos 33 146 179 29 115 143 88% 79% 80%
95030 0 43 43 < 10 30 30 < 10 70% 70%
95031 0 0 0 < 10 < 10 < 10 < 10 < 10 < 10
95032 6 86 92 < 10 70 70 < 10 81% 81%
95033 27 17 44 27 15 42 100% 88% 95%
Milpitas 94 32 126 52 < 10 52 55% < 10 55%
95035 94 32 126 52 < 10 52 55% < 10 55%
95036 0 0 0 < 10 < 10 < 10 < 10 < 10 < 10
Morgan Hill 145 420 565 118 274 392 81% 65% 69%
95037 145 420 565 118 274 392 81% 65% 69%
95038 0 0 0 < 10 < 10 < 10 < 10 < 10 < 10
Mount Hamilton 0 2 2 < 10 < 10 < 10 < 10 < 10 < 10
95140 0 2 2 < 10 < 10 < 10 < 10 < 10 < 10
Mountain View 121 102 223 69 31 100 57% 30% 45%
94035 0 0 0 < 10 < 10 < 10 < 10 < 10 < 10
94040 53 45 98 31 16 47 58% 36% 48%
94041 22 18 40 < 10 < 10 < 10 < 10 < 10 < 10
94042 0 0 0 < 10 < 10 < 10 < 10 < 10 < 10
94043 46 39 85 38 15 53 83% 38% 62%
Palo Alto 152 113 265 86 68 154 57% 60% 58%
94301 27 23 50 24 22 46 89% 96% 92%

112
City/Zip Code
A. Need (Assuming 90%
Participation Rate)
B. Unmet Need (Based on
Enrollment in Programs
That Meet California’s Title
5 Child Development
Standards or the Federal
Head Start Performance
Standards)*
C. Percent Unmet Need
(Based on Enrollment in
Programs That Meet
California’s Title 5 Child
Development Standards or
the Federal Head Start
Performance Standards)*
3 4 3 & 4 3 4 3 & 4 3 4 3 & 4
94303 59 35 94 < 10 < 10 < 10 < 10 < 10 < 10
94305 23 19 42 23 19 42 100% 100% 100%
94306 43 36 79 39 27 66 91% 75% 84%
Redwood Estates 0 0 0 < 10 < 10 < 10 < 10 < 10 < 10
95044 0 0 0 < 10 < 10 < 10 < 10 < 10 < 10
San Jose 2938 3414 6352 1633 927 2242 56% 27% 35%
95101 0 0 0 < 10 < 10 < 10 < 10 < 10 < 10
95102 0 0 0 < 10 < 10 < 10 < 10 < 10 < 10
95110 58 104 162 31 < 10 31 53% < 10 53%
95111 139 235 374 51 51 102 37% 22% 27%
95112 203 320 523 82 < 10 82 40% < 10 40%
95113 3 5 8 < 10 < 10 < 10 < 10 < 10 < 10
95114 0 0 0 < 10 < 10 < 10 < 10 < 10 < 10
95116 224 384 608 90 80 170 40% 21% 28%
95117 102 124 226 < 10 < 10 < 10 < 10 < 10 < 10
95118 58 57 115 37 < 10 37 64% < 10 64%
95119 26 0 26 17 < 10 17 65% < 10 65%
95120 97 0 97 95 < 10 95 98% < 10 98%
95121 117 206 323 85 119 204 73% 58% 63%
95122 183 374 557 < 10 < 10 < 10 < 10 < 10 < 10
95123 144 39 183 66 < 10 66 46% < 10 46%
95124 63 133 196 51 82 133 81% 62% 68%
95125 75 230 305 37 93 130 49% 40% 43%
95126 108 167 275 64 79 143 59% 47% 52%
95127 312 87 399 192 < 10 192 62% < 10 62%
95128 138 174 312 37 < 10 37 27% < 10 27%
95129 130 167 297 117 132 249 90% 79% 84%
95130 46 59 105 35 37 72 76% 63% 69%
95131 40 14 54 23 < 10 23 57% < 10 57%
95132 89 27 116 68 < 10 68 76% < 10 76%
95133 119 137 256 84 69 153 71% 50% 60%
95134 69 0 69 50 < 10 50 72% < 10 72%
95135 61 78 139 60 45 105 98% 58% 76%
95136 64 113 177 15 31 46 23% 27% 26%
95137 0 0 0 < 10 < 10 < 10 < 10 < 10 < 10
95138 58 74 132 54 59 113 93% 80% 86%
95139 17 0 17 16 < 10 16 94% < 10 94%
95141 0 0 0 < 10 < 10 < 10 < 10 < 10 < 10
95148 195 106 301 170 50 220 87% 47% 73%
95150 0 0 0 < 10 < 10 < 10 < 10 < 10 < 10
95151 0 0 0 < 10 < 10 < 10 < 10 < 10 < 10
95152 0 0 0 < 10 < 10 < 10 < 10 < 10 < 10

113
City/Zip Code
A. Need (Assuming 90%
Participation Rate)
B. Unmet Need (Based on
Enrollment in Programs
That Meet California’s Title
5 Child Development
Standards or the Federal
Head Start Performance
Standards)*
C. Percent Unmet Need
(Based on Enrollment in
Programs That Meet
California’s Title 5 Child
Development Standards or
the Federal Head Start
Performance Standards)*
3 4 3 & 4 3 4 3 & 4 3 4 3 & 4
95153 0 0 0 < 10 < 10 < 10 < 10 < 10 < 10
95154 0 0 0 < 10 < 10 < 10 < 10 < 10 < 10
95156 0 0 0 < 10 < 10 < 10 < 10 < 10 < 10
95157 0 0 0 < 10 < 10 < 10 < 10 < 10 < 10
95159 0 0 0 < 10 < 10 < 10 < 10 < 10 < 10
95161 0 0 0 < 10 < 10 < 10 < 10 < 10 < 10
95164 0 0 0 < 10 < 10 < 10 < 10 < 10 < 10
95172 0 0 0 < 10 < 10 < 10 < 10 < 10 < 10
95173 0 0 0 < 10 < 10 < 10 < 10 < 10 < 10
San Martin 20 59 79 < 10 33 33 < 10 56% 56%
95046 20 59 79 < 10 33 33 < 10 56% 56%
Santa Clara 502 21 523 443 < 10 443 88% < 10 88%
95050 165 0 165 141 < 10 141 85% < 10 85%
95051 220 21 241 197 < 10 197 90% < 10 90%
95053 10 0 10 10 < 10 10 100% < 10 100%
95054 107 0 107 95 < 10 95 89% < 10 89%
95055 0 0 0 < 10 < 10 < 10 < 10 < 10 < 10
95056 0 0 0 < 10 < 10 < 10 < 10 < 10 < 10
Saratoga 2 103 105 < 10 73 73 < 10 71% 71%
95070 2 103 105 < 10 73 73 < 10 71% 71%
Stanford 5 5 10 < 10 < 10 10 < 10 < 10 100%
94304 5 5 10 < 10 < 10 10 < 10 < 10 100%
Sunnyvale 161 339 500 93 138 231 58% 41% 46%
94085 24 51 75 < 10 < 10 < 10 < 10 < 10 < 10
94086 53 110 163 31 35 66 58% 32% 40%
94087 61 132 193 48 89 137 79% 67% 71%
94088 0 0 0 < 10 < 10 < 10 < 10 < 10 < 10
94089 23 46 69 14 14 28 61% 30% 41% a The table does not include enrollment for the 6 sites that received local funds from First 5 Child Signature Program (CSP) in 2014 for teacher salaries to make specific preschool sessions available. In 2014, First 5 CSP provided funding to 4 sites, with a total of 839 preschool slots, that also received Title 5 State Preschool and/or Head Start funding. Three other sites with 68 preschool slots also received funding from First 5 CSP in 2014 and did not receive Title 5 State Preschool and/or Head Start funding. b Source: American Community Survey, Public Use Microdata Sample (PUMS) one-year data file, 2014, produced by American Institutes for Research in the Early Learning Needs Assessment Tool (www.elneedsassessment.org * Children Enrolled in California State Preschool Program (CSPP), State Migrant (CMIG), Handicapped Child Care and Development (CHAN), Title 5 General Child Care and Development (CCTR), Title 5 Family Child Care Home Education Networks (CFCC), Head Start, and TK)

114
Exhibit C-3. Graphic of Methodology to Determine Child Care Demand in 2013 Local
Planning Council Needs Assessment68
68 Source: Liebig, G., Marquez, H., Sattler, B., & Carrig, S. (2008). Santa Clara County Early Care and Education Needs Assessment. Santa Clara, CA: Santa Clara County Office of Education.

115
Exhibit C-4. Methodology to Determine Child Care Demand in 2013 Local Planning Council
Needs Assessment69
Child Care Demand Methodology
For these estimates, child care demand is determined by combining local demographic
information with national child care use patterns from the National Survey of American
Families (NSAF), a comprehensive family survey that queried over 25,000 families.70 NSAF
included questions about each family’s child care use by type of care as well as general
demographic and social characteristics. The NSAF survey results show four family
characteristics are predictors of child care use: Child’s age, Income, Parent Workforce
Participation, and Ethnicity.
The demand estimates used the available national child care patterns rather than state
child care use data because the state level information had fewer records with less
statistically relevant findings by family sub-populations (e.g., Latino families with children
younger than two with incomes below 200 percent of the federal poverty level). In addition,
an analysis of the two data sources showed more differences in child care use among
subpopulations than geography. For example, Latino and African American child care use
patterns had statistically significant differences, while California families with infants and
toddlers and similar incomes had no statistical difference between families with toddlers
with similar incomes nationwide. This survey has not been repeated since 2002. While not
providing the level of detail of the NSAF study, BAE reviewed a time series of child care
usage data from Who's Minding the Kids? Child Care Arrangements, from the U.S. Census
Bureau, which uses data from the Survey of Income and Program Participation (SIPP), an
ongoing national survey. This provided data for several periods between 2002 and 2010,
which indicated that overall child care arrangements have not changed nationally in more
recent years.
Age
Child’s age clearly plays an integral role in determining whether a parent accesses care from
a family child care home (FCCH), a center-based program, or a before- and after-school
program. The younger the child, the more likely the parent does not access child care. Also,
families with infants and toddlers are more likely to use a FCCH compared to families with
preschool and school-aged children.
Income
A family’s income often determines its ability to provide child care outside the home and the
type of care they will access. Without subsidized care, affordability becomes a significant
barrier to child care.71 While families use an assortment of care options, the type of care
they choose depends partially on what they can afford and their work schedules. For
example, two-worker or single-parent working households depend more on care from
69 Source: Liebig, G., Marquez, H., Sattler, B., & Carrig, S. (2008). Santa Clara County Early Care and Education Needs Assessment. Santa Clara, CA: Santa Clara County Office of Education. 70 National Survey of American Families, Urban Institute, 2002. 71 Family income is separated by those earning below 200 percent of the federal poverty level and those earning equal to or above 200 percent of this level.

116
relatives (in or out of home) if their incomes are below 200 percent of the federal poverty
level.72 It may be that these lower income families simply prefer relative care, but it may also
be the result of the lower cost of relative care, a desire to provide some income to the
relative in the form of a subsidy payment, or a need for child care during the nontraditional
or varying hours often associated with lower-wage work. Also, families with all parents
working and incomes above 200 percent of the poverty level are more likely to send their
preschool-age children to center-based care settings than two-worker families below 200
percent of the poverty level.73
Workforce Participation
Families are significantly more likely to access child care when both parents or a single
parent are in the workforce than when one or more parent is not in the workforce. Some use
relative care, but working families with children are significantly less likely to use relative or
at-home based care compared to families with one or more parents not working.
Ethnicity
The NSAF data found child care use to vary among certain ethnic populations after
accounting for workforce participation, income and child age. For example, Latino children in
families with all parents working and with incomes below 200 percent of poverty are more
likely to access relative care than the Latino population overall. As another example, African
American families are more likely to use center-based care. The NSAF found similar child
care use patterns between Asian, Pacific Islander, and White families above and beyond the
effects of child age, income, and workforce participation. NSAF could not statistically
differentiate child care use patterns of Native Americans, Mixed-Race, or Other families with
children from national use patterns within the same family subpopulations. Thus, child care
use patterns described for these groups are based on child care use patterns for all families.
Estimate of Current Child Care Usage
Recognizing the importance of these four demographic predictors, this report applies local
demographic information regarding age, income, parent workforce participation, and
ethnicity to determine child care use in each county. The demand model cross-tabulates
individual records for each county from the Public Use Microdata Sample for the 2006-2010
American Community Survey conducted by the U.S. Census Bureau to the national child care
use patterns within each of the four demographic categories. This provides an estimate of
the proportions of current child care usage patterns in each County.
Accounting for Unmet Demand
After applying the child care use estimates by subpopulation, the model accounts for
additional child care demand by apportioning those households who would access child care
if an affordable and quality option were available to them. The National Household
Education Survey (NHES) queried families on whether they would access child care if an
72 National Survey of American Families, Urban Institute, 2002. 73 National Survey of American Families, Urban Institute, 2002.

117
affordable and quality option were available to them.74 Approximately half of families with
infants and toddlers, and incomes of less than 200 percent of poverty, said yes, while 26
percent of families with infants and toddlers with incomes above 200 percent of poverty
would do the same. The model then takes that portion of children currently not using family
child care or center care based on their age and family income, and redistributes that
portion based on existing use rates among family child and center-based care. In addition,
the model reapportions school-age children currently under “self-care” to before- and after-
school child care demand as these children are without parent or adult supervision beyond
school hours. The result is a better reflection of child care demand rather than estimates
based on families using child care.
The overall estimate then takes current estimated usage, and factors in this additional
demand to create a matrix estimating the proportions of child care demand by poverty level,
ethnicity, and labor force status. Then, this matrix is applied to recently released State
Department of Finance (DOF) population projections by age and ethnicity75 to estimate child
care demand by county for 2013, 2015, and 2020.
As a final step for Marin County, the African American population was combined with Native
American, Other, and Multiracial populations since the sample size from the American
Community Survey was not large enough statistically to show African Americans separately.
74 NHES specifically asks, "Some parents prefer to stay home to care for their children. Others choose to have care arrangements with someone other than a parent. If you could find high-quality, affordable child care by a relative, non-relative, or in a daycare or preschool program, would you choose to place child in one of these kinds of arrangements?” National Household Education Survey, United States Department of Education, 2002. As with the NSAF data, this survey, while repeated since 2002, did not ask this specific question in more recent years. 75 California Department of Finance. (2013). Report P-3: State and County Population Projections by Race/Ethnicity, Detailed Age, and Gender, 2010-2060. Sacramento, CA: Author.

118
Who We Are
Strong Start is a coalition of community leaders, early education providers, non-profit
organizations, elected officials, members of the business community, and other key
stakeholders who are committed to expanding access to high-quality early learning
opportunities for all children age 0 to 8 in Santa Clara County.
The coalition looks for local, state, and national solutions to help increase access to high-
quality early education and conducts advocacy efforts at the state level to encourage
increased investments in early learning.
Strong Start is an initiative of the Santa Clara County Office of Education (SCCOE) and builds
upon the strong leadership of its many partners in the field of early education.
County Board of Education
Michael Chang (President), Joseph Di Salvo, Darcie Green,
Rosemary Kamei (Vice President), Grace H. Mah, Claudia Rossi, Anna Song
County Superintendent of Schools
Jon R. Gundry
1290 Ridder Park Drive
San Jose, CA 95131-2305
www.sccoe.org


