@ SCG 2013
SCG Chemicals outlook hosted by SCBS
Mr. Cholanat Yanaranop
President
SCG Chemicals
Mr. Chaovalit Ekabut
VP-Finance and Investment & CFO, SCG
Mar 18th, 2014
1

- 2 -
Agenda
Where are we in the cycle?
New competing olefins supplies
Our strategies
2

The petrochemical cycle: 7-10 years
200
300
400
500
600
700
800
900
90 91 92 93 94 95 96 97 98 99 00 01 02 03 04 05 06 07 08 09 10 11 12 13 14
USD/ton
Asian crisis
Hamburger crisis
Eurozone crisis
HDPE – Naphtha gap history 1990-2014
3 Note: Prices refer to SEA regional prices
Trough Trough
Trough
200
600
1,000
1,400
1,800
2,200
HDPE
Naphtha
USD
/to
n
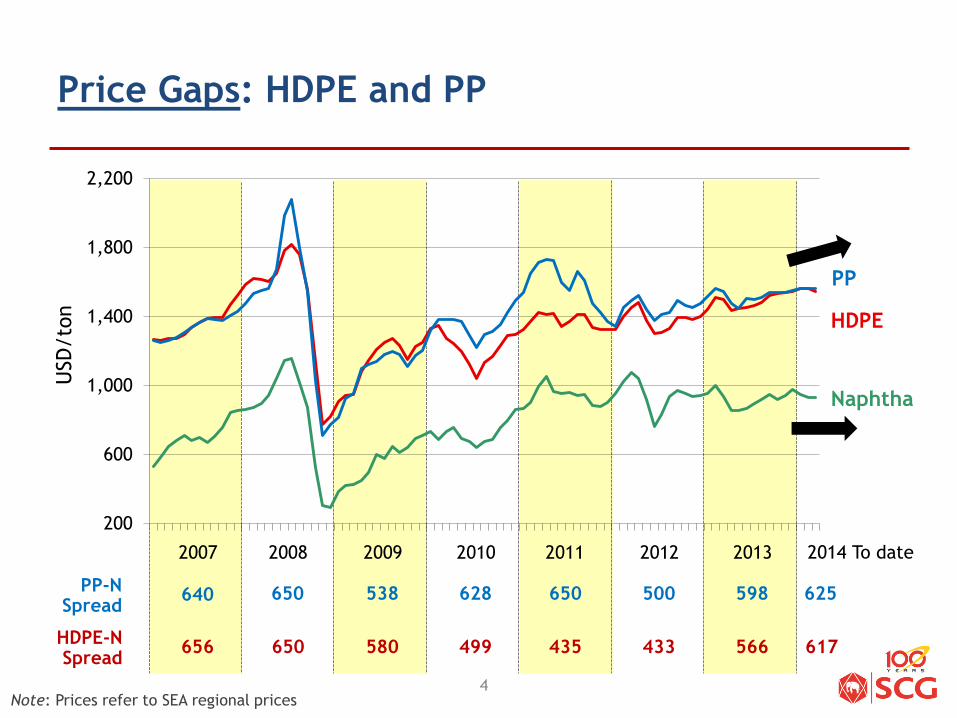
Price Gaps: HDPE and PP
Note: Prices refer to SEA regional prices
PP
PP-N Spread
HDPE-N Spread
625
617
4
2014 To date 2013 2012 2011 2010 2009 2008 2007
598 500
566 433 435 499 580
650 628 538 650
650 656
640
4
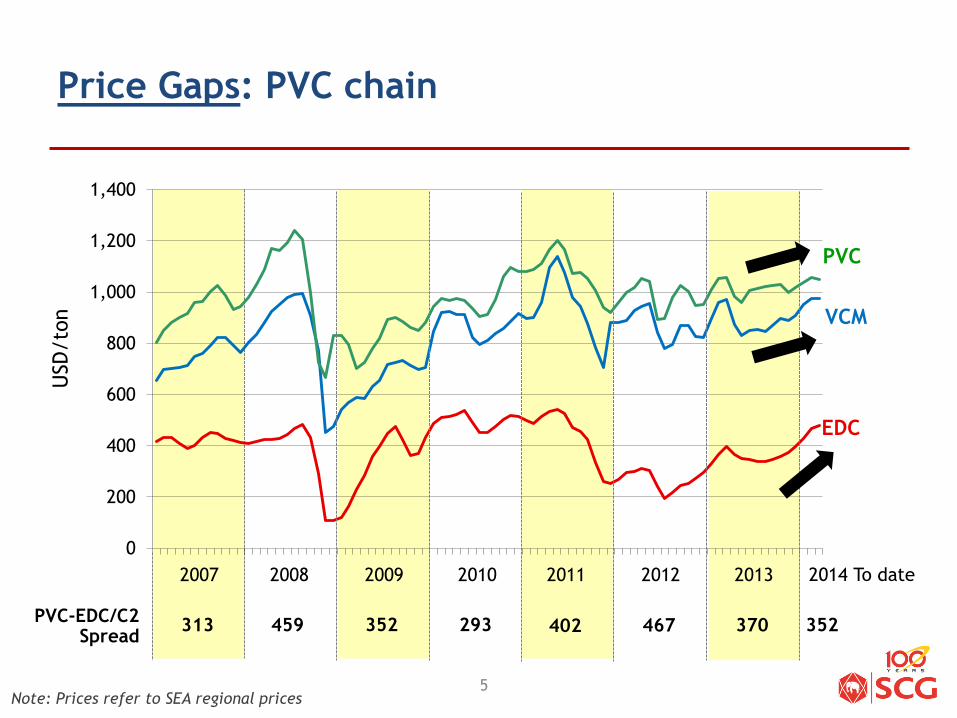
PVC
EDC
VCM
Note: Prices refer to SEA regional prices
Price Gaps: PVC chain U
SD
/to
n
PVC-EDC/C2 Spread
313 459 293
5
0
200
400
600
800
1,000
1,200
1,400
2014 To date 2013 2012 2011 2010 2009 2008 2007
352 402 467 370 352
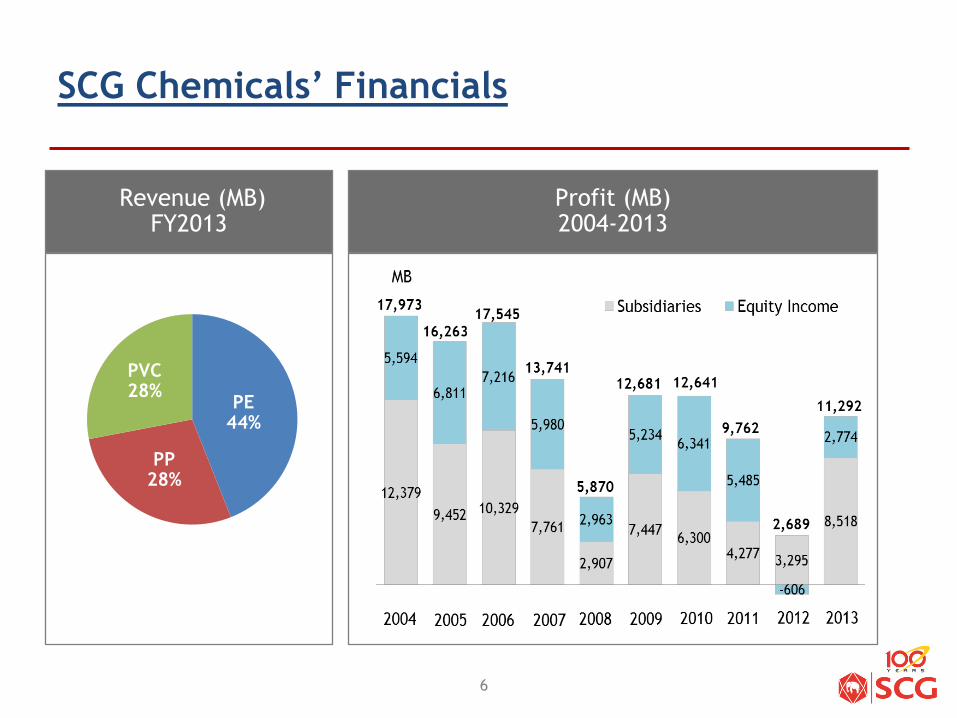
SCG Chemicals’ Financials
Revenue (MB) FY2013
PVC 28%
PE 44%
PP 28%
Profit (MB) 2004-2013
6
- 7 -
Agenda
Where are we in the cycle?
New competing olefins supplies
Our strategies
7

8
Chemicals feedstock
Pros
(+) Relatively cheaper feedstock
Pros
(+) Good yield of
ethylene (C2) and
propylene (C3)
(+) Lower price in
summer
Pros
(+) Wide product
variety, 50-60%
yield as by-
product
(non-ethylene, non-
propylene)
(+) Easy to transport
Ethane LPG Naphtha
Cons
(-) No product variety, only for ethylene (C2) production
(-) Subject to local availability, due to uneconomical bulk transportation
Cons
(-) High price and
limited supply in winter
Cons
(-) Relatively more
expensive
- 8 -
Coal
Cons
(-) High investment
(-) Environmental
concern; require
large supply of
water and high
CO2 emission
Pros
(+) Relatively
cheaper
feedstock
(+) Abundant of raw
material
- 9 -
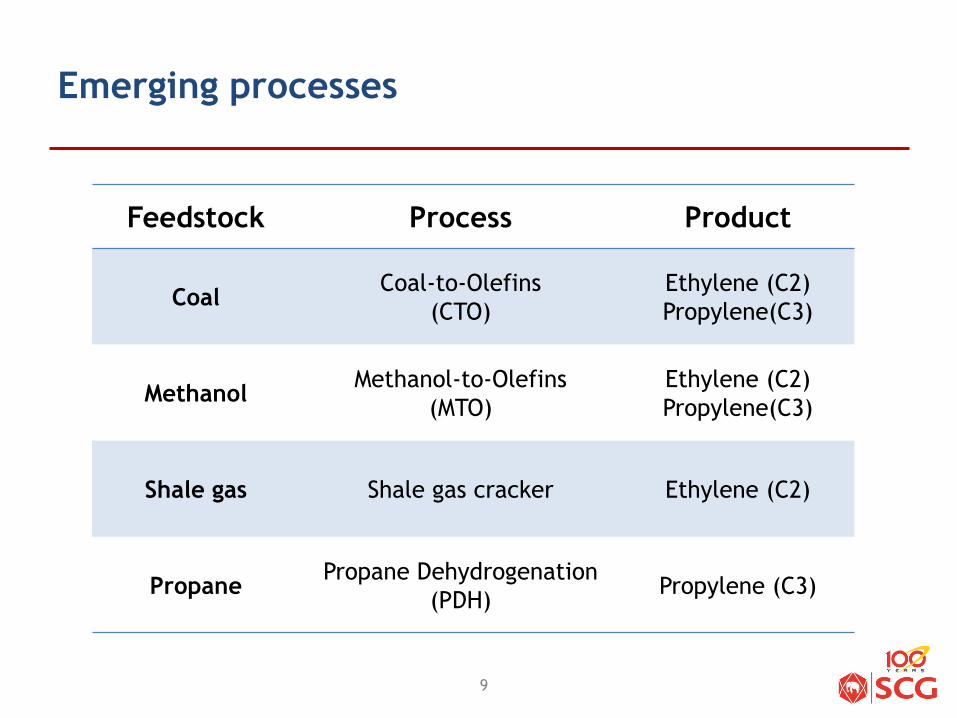
Feedstock Process Product
Coal Coal-to-Olefins
(CTO)
Ethylene (C2)
Propylene(C3)
Methanol Methanol-to-Olefins
(MTO)
Ethylene (C2)
Propylene(C3)
Shale gas Shale gas cracker Ethylene (C2)
Propane Propane Dehydrogenation
(PDH) Propylene (C3)
Emerging processes
9

Global ethylene capacity (2018): naphtha and conventional gas accounts for 91% of the capacity
Ethylene global capacity in 2018 by feedstock
Naphtha 48% Conventional
Gas 43%
Shale gas 4%
Coal & Methanol &Others 5%
Incremental Ethylene capacity
2014 – 2018 by region
16% 25%
32%
27%
Note: Operating rate of coastal capacity in China is
subject to seasonal feedstock availability
North America
Middle East
North East
Asia*
South East Asia
Europe & CIS
7%
31% 15%
14%
32%
10
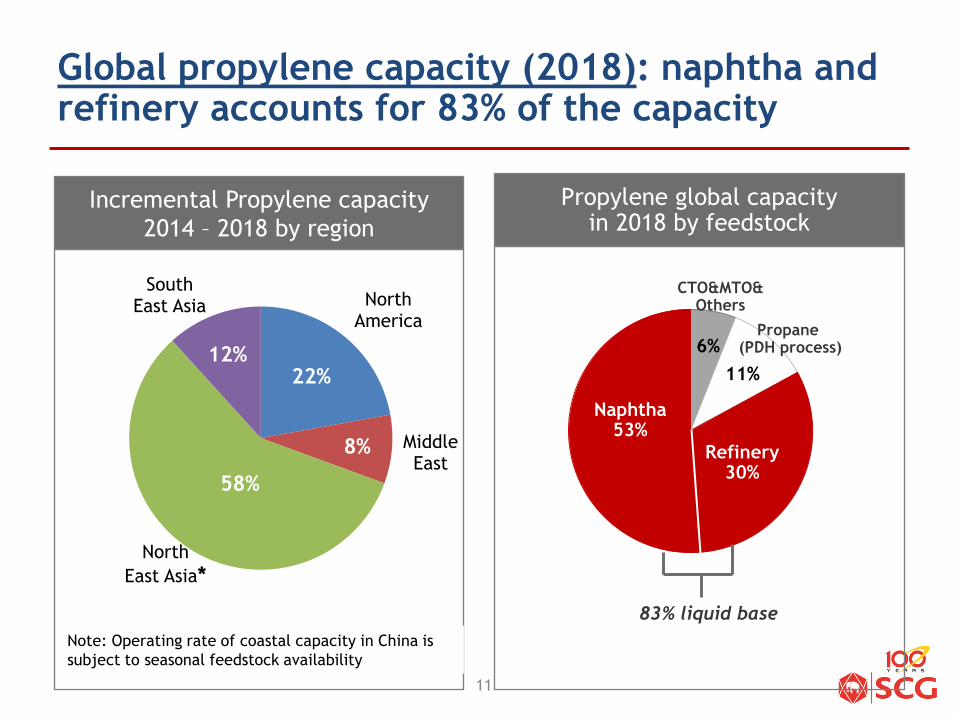
Propylene global capacity in 2018 by feedstock
Naphtha 53%
CTO&MTO& Others
83% liquid base
Refinery 30%
Propane (PDH process)
Global propylene capacity (2018): naphtha and refinery accounts for 83% of the capacity
11
11%
6%
Incremental Propylene capacity
2014 – 2018 by region
16%
30%
7% 47%
Note: Operating rate of coastal capacity in China is
subject to seasonal feedstock availability
North America
Middle East
North
East Asia*
South East Asia
22%
8%
58%
12%
3%
4% 4% 4% 4%
3%
8%
5%
1%
3% 3% 3%
2%
6%
0%
1%
2%
3%
4%
5%
6%
7%
8%
9%
2004 2005 2006 2007 2008 2009 2010 2011 2012 2013 2014 2015 2016 2017
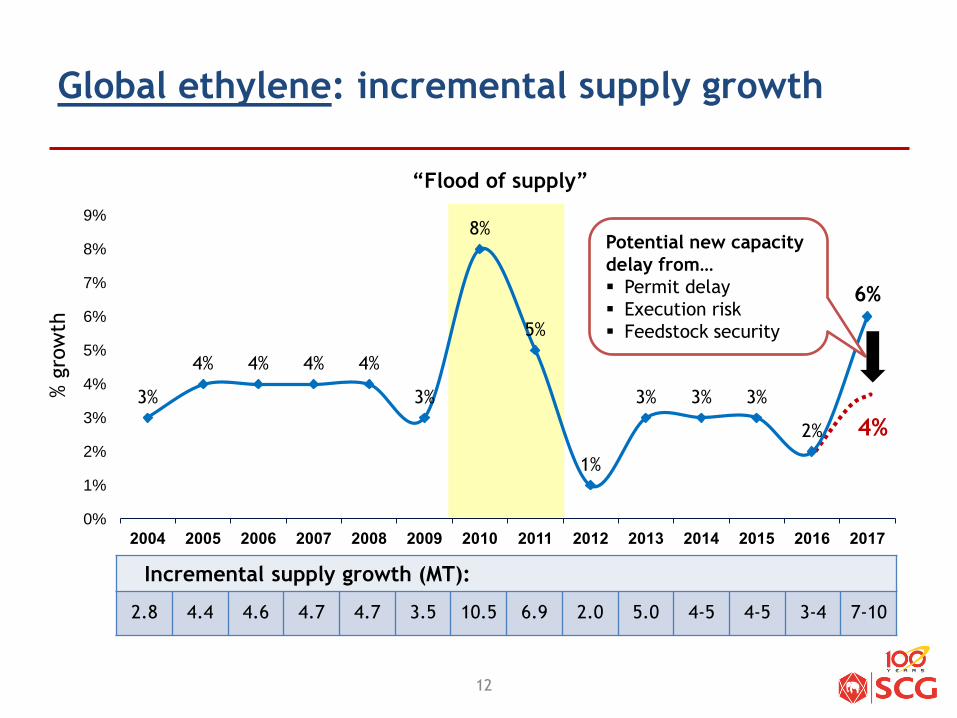
“Flood of supply”
Global ethylene: incremental supply growth
Potential new capacity
delay from…
Permit delay
Execution risk
Feedstock security
4%
% g
row
th
Incremental supply growth (MT):
2.8 4.4 4.6 4.7 4.7 3.5 10.5 6.9 2.0 5.0 4-5 4-5 3-4 7-10
12
- 13 -
Agenda
Where are we in the cycle?
New competing olefins supplies
Our strategies
13

Competitiveness and reduced commodities
effects through HVA (high value added products) and innovation
HVA = High value added products and services
5-10% higher margin
An element of services bundled
- 14 - 14
34% 38%
45% 50%
2010 2011 2012 2013 2010 2011 2012 2013
Note: HVA Sales from Subsidiaries + Associates (100% portion)
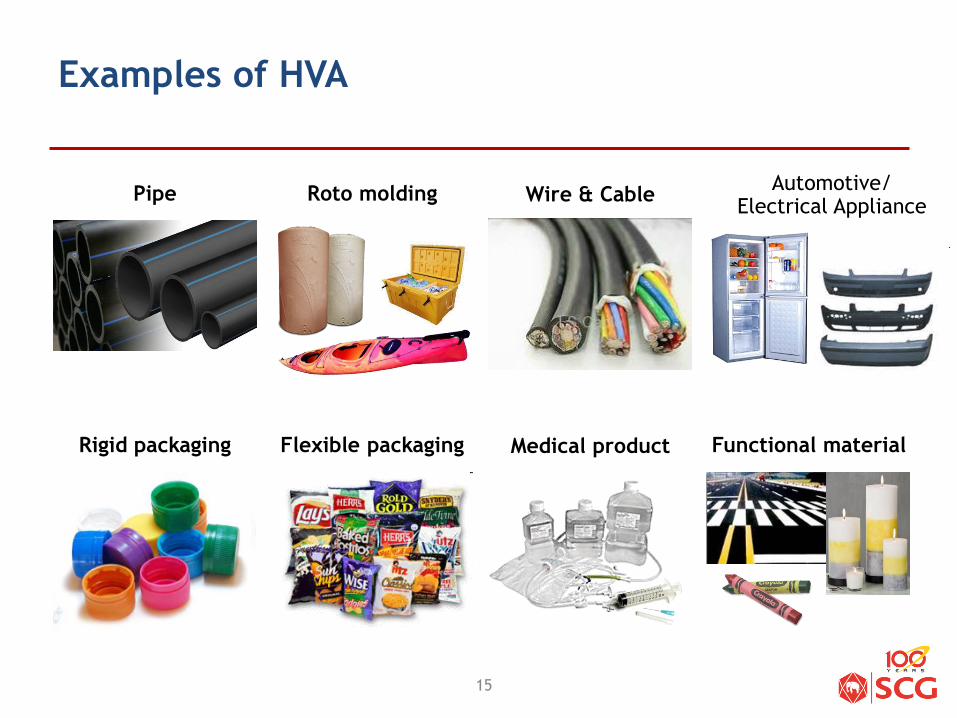
Examples of HVA
- 15 - 15
Pipe Roto molding Wire & Cable Automotive/
Electrical Appliance
Rigid packaging Flexible packaging Medical product Functional material
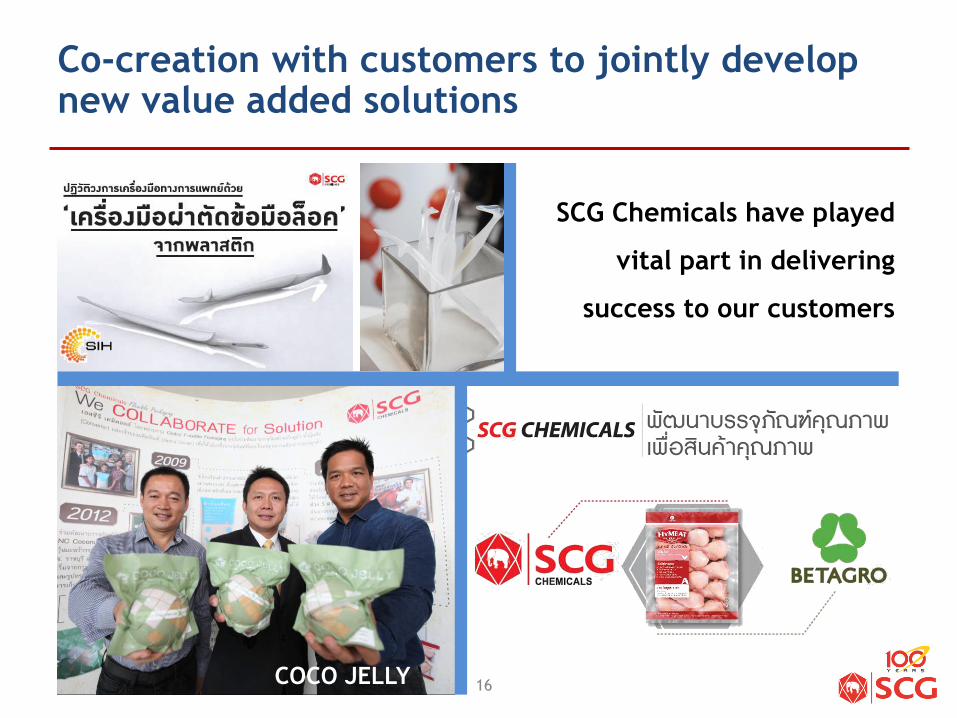
Co-creation with customers to jointly develop new value added solutions
SCG Chemicals have played
vital part in delivering
success to our customers
- 16 - COCO JELLY 16

+55% of PE/PP are exported to +110 countries
SCG Chemicals
Integrated and competitive operations.
Thailand
Integrated and competitive regional operations
Vietnam
Crackers
ROC (1999)
1.2 MT C2&C3
MOC (2010)
1.7MT C2&C3
Downstream
Subsidiaries Associates
PE
PP
PVC Others
Dow
Mitsui
Chemicals
Mitsubishi
Rayon
JSR
Indonesia
Cracker
CAP (1995)
0.9 MT C2&C3
CAP-Debot (Late-2015)
1.3 MT C2&C3
Cracker
Long Son
Petrochemical (LSP)
1.4 MT C2&C3
Status update • Signed long-term
feedstock agreement
• Signed land lease
advance agreement
• Appointed financial
advisor
• During bidding for
EPC and securing
necessary financing
Downstream
Subsidiaries Associates
PE
PP
SM BD
Michelin (Start up 2017)
17
THANK YOU
18


![VIII Seminário “Desenvolvimento ... - ibracon.org.br1].pdf · C1 C2 C3 C1 C2 C3 C1 C2 C3 C1 C2 C3 C1 C2 C3 C1 C2 C3 R EVEVC R EVEVC 91dias 300dias Volume Total Intrudido de Hg](https://cdn.vdocuments.net/doc/165x107/5c0a1db209d3f2411a8b59c1/viii-seminario-desenvolvimento-1pdf-c1-c2-c3-c1-c2-c3-c1-c2-c3-c1.jpg)

