SCITT ProgrammeMathematics Training
Session FiveCalculating with Fractions
Ratio and ProportionAlgebra
Statistics
Liz HillsMathematics Subject Leader St Mary’s Catholic Primary School SLE Newick Teaching School
Part One: Calculating with Fractions

Teachers must work hard to include a variety of classroom activities and teaching strategies, that focus on improving students’ conceptual understanding of fractions.
We define conceptual knowledge of fractions as knowledge of what fractions mean, for example their magnitudes and relations to physical quantities, an understanding of why arithmetic procedures with fractions are mathematically justified and why they yield the answers they do.
Such conceptual knowledge can be contrasted with procedural knowledge— the ability to execute a series of steps to solve a problem.
Teachers should focus on developing conceptual understanding along with procedural fluency.
One way to improve conceptual understanding is to use manipulatives and visual representations of fractions. Studies that have taught fraction arithmetic using visual representations of fractions have shown positive effects on students’ computational skills.
Many students’ errors with fraction arithmetic can be avoided if they estimate their answers before attempting to use a formal algorithm. Estimation of fractions, however, does not come easily to many students. By practising estimation, students improve both their knowledge of fraction magnitudes and their understanding of fraction arithmetic. Estimation forces students to think out their answers and focuses students on what it means to add or multiply fractions, rather than just following a memorized rule without understanding. When students are solving fraction arithmetic problems, they can be asked to estimate the answer and explain their reasoning before computing the answer. By checking if their computed answers are reasonable, students can recognize when they either used an incorrect computational procedure or made a mistake executing a correct procedure.
THE IMPORTANCE OF ESTIMATING WHEN CALCULATING WITH FRACTIONS

One estimation strategy is to use benchmarks.
Benchmarks should be fractions that students are comfortable with such as 0, 1/2 and 1.
Students can then decide whether any given fraction between 0 and 1 is closest to 0, 1/2 or 1.
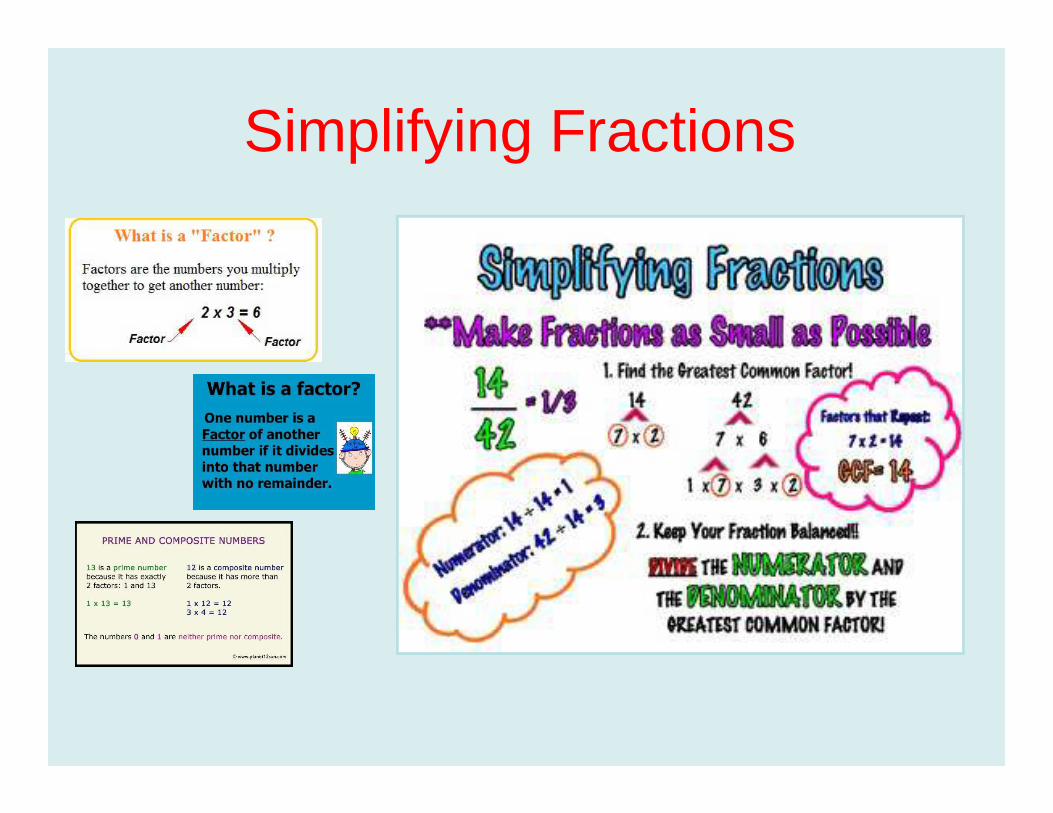
Simplifying Fractions
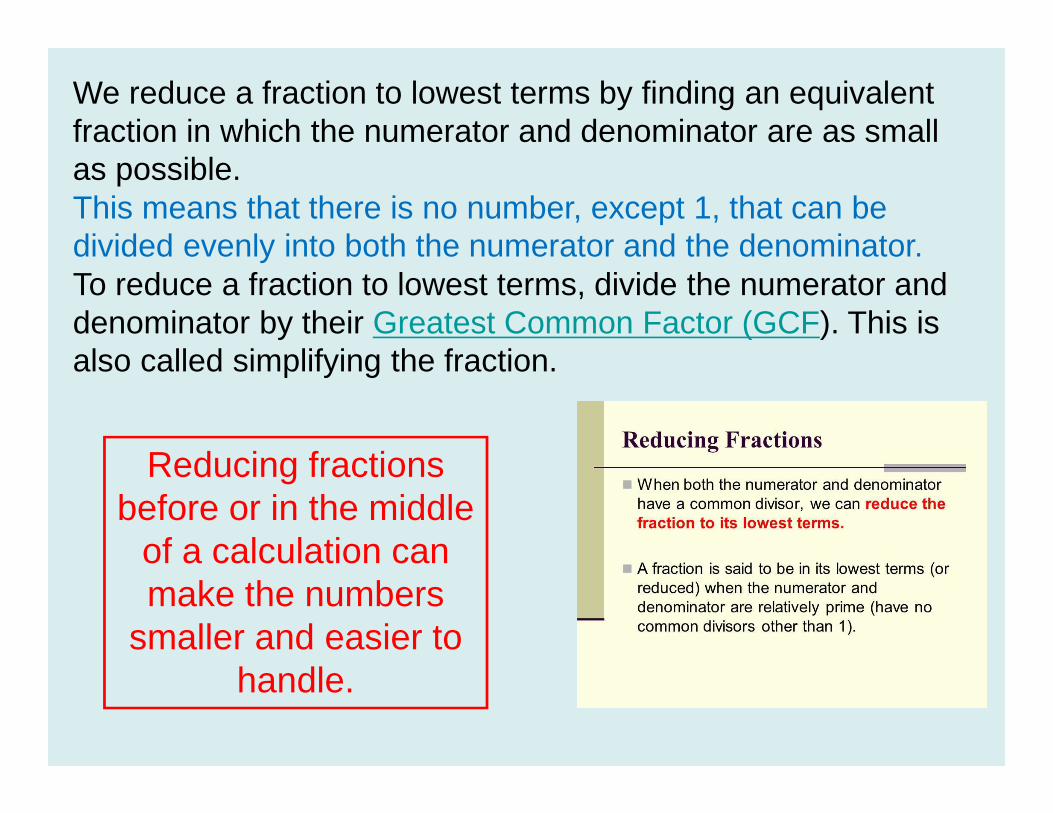
We reduce a fraction to lowest terms by finding an equivalent fraction in which the numerator and denominator are as small as possible.This means that there is no number, except 1, that can be divided evenly into both the numerator and the denominator.To reduce a fraction to lowest terms, divide the numerator and denominator by their Greatest Common Factor (GCF). This is also called simplifying the fraction.
Reducing fractions before or in the middle
of a calculation can make the numbers
smaller and easier to handle.
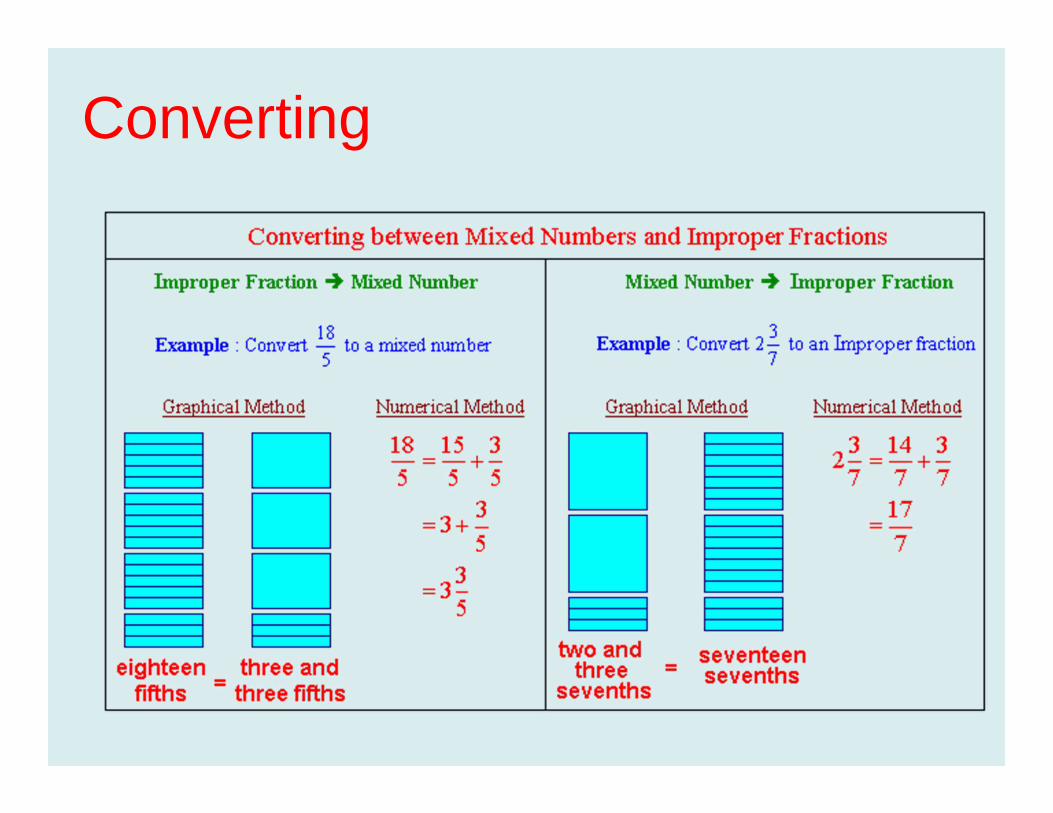
Converting
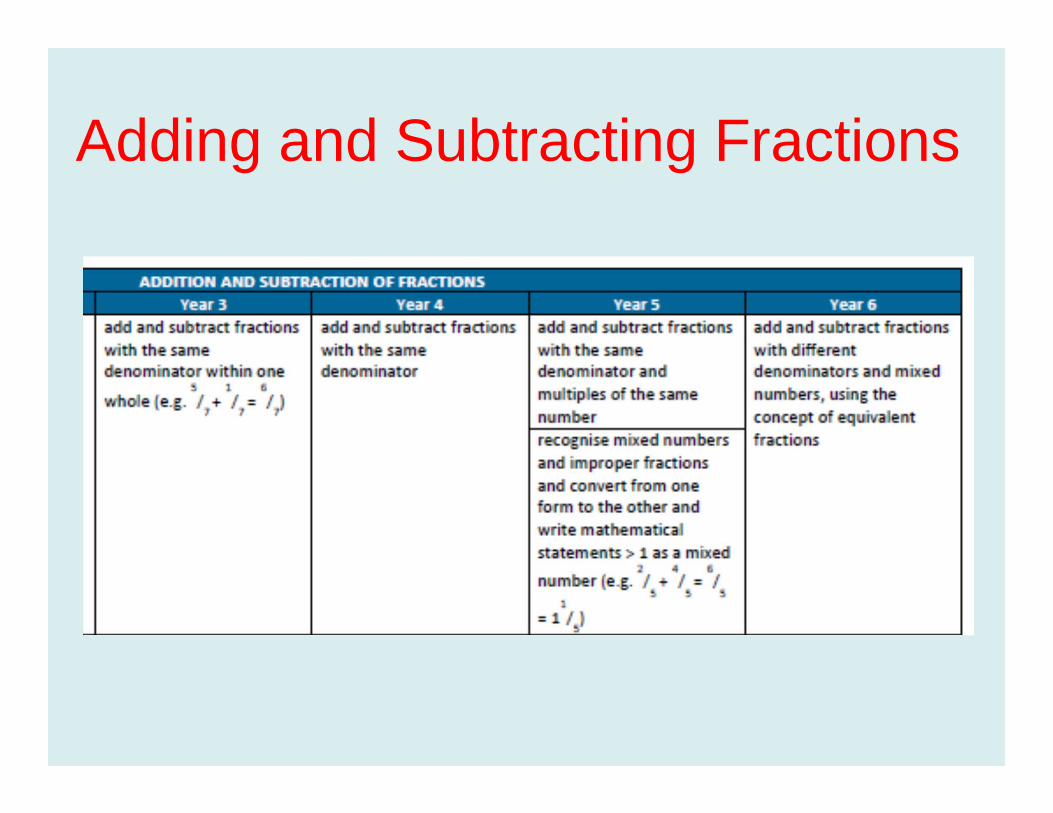
Adding and Subtracting Fractions

Adding and Subtracting
Fractions with the Same
Denominator
MISCONCEPTION:Treating fractions’ numerators and denominators as separate whole numbers is a common error. When asked to subtract fractions, students often subtract the numerators and then subtract the denominators.These students are failing to treat the fraction as a unified number and instead treat the numerator and denominator as separate whole numbers. Teachers can help students to overcome the misconception that this is an acceptable procedure by presenting meaningful problems in the classroom.
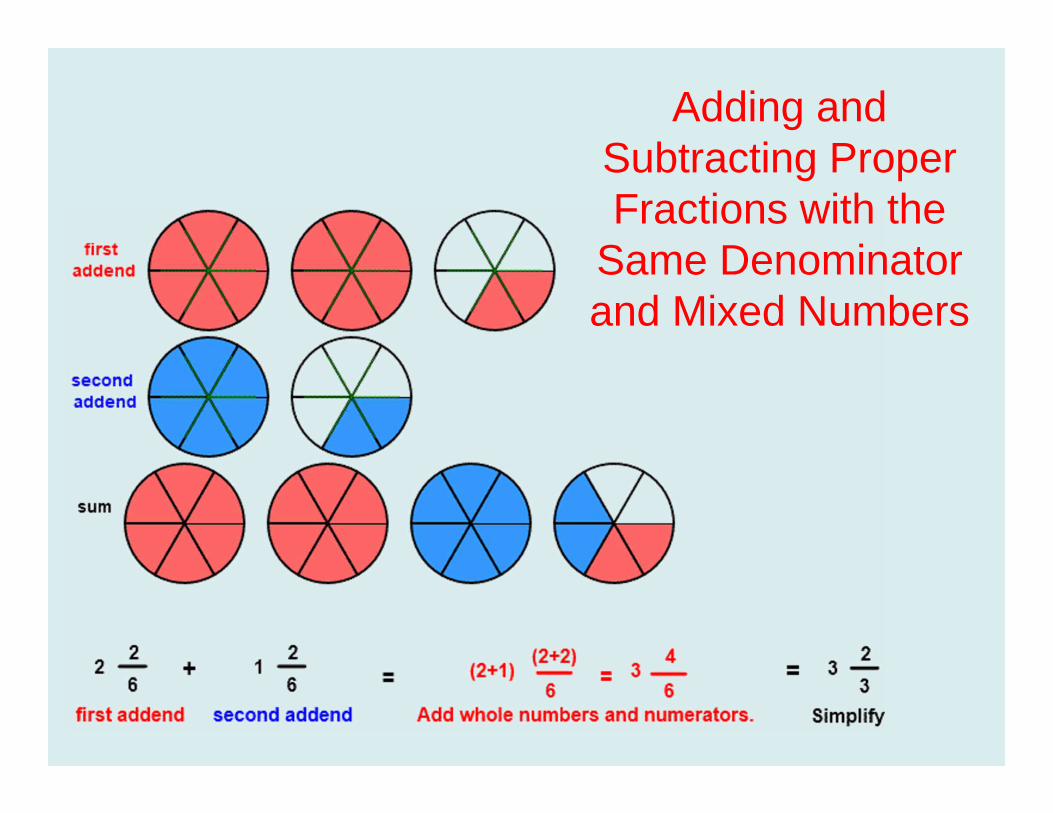
Adding and Subtracting Proper Fractions with the
Same Denominator and Mixed Numbers

MISCONCEPTION: Students often have difficulties solving problems with mixed numbers. Some students ignore the fractional parts and instead only focus on the whole number (e.g. 4 2/3 – 1 2/5 = 3). Others decide that the whole numbers in the problem must have the same denominator as the fractions (e.g. 3 – 2/5 = 3/5 – 2/5 = 1/5). A related misconception is adding the whole number to the numerator of the fractional part (e.g. 2 2/5 x 5/6 = 4/5 x 5/6 = 20/30). All of these errors reflect a fundamental misunderstanding of what mixed numbers are and of the magnitudes they represent. Teachers should be sure to use proper fractions, improper fractions and mixed numbers in the classroom, and to translate often between mixed numbers and improper fractions.
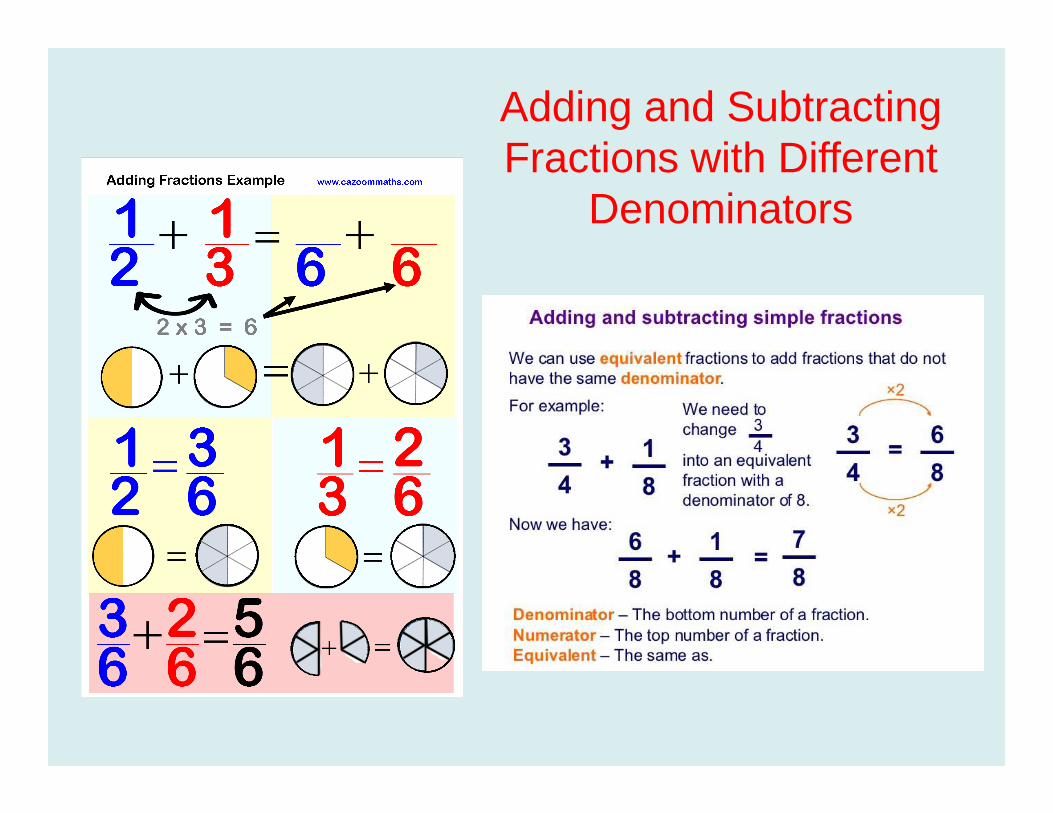
Adding and Subtracting Fractions with Different
Denominators
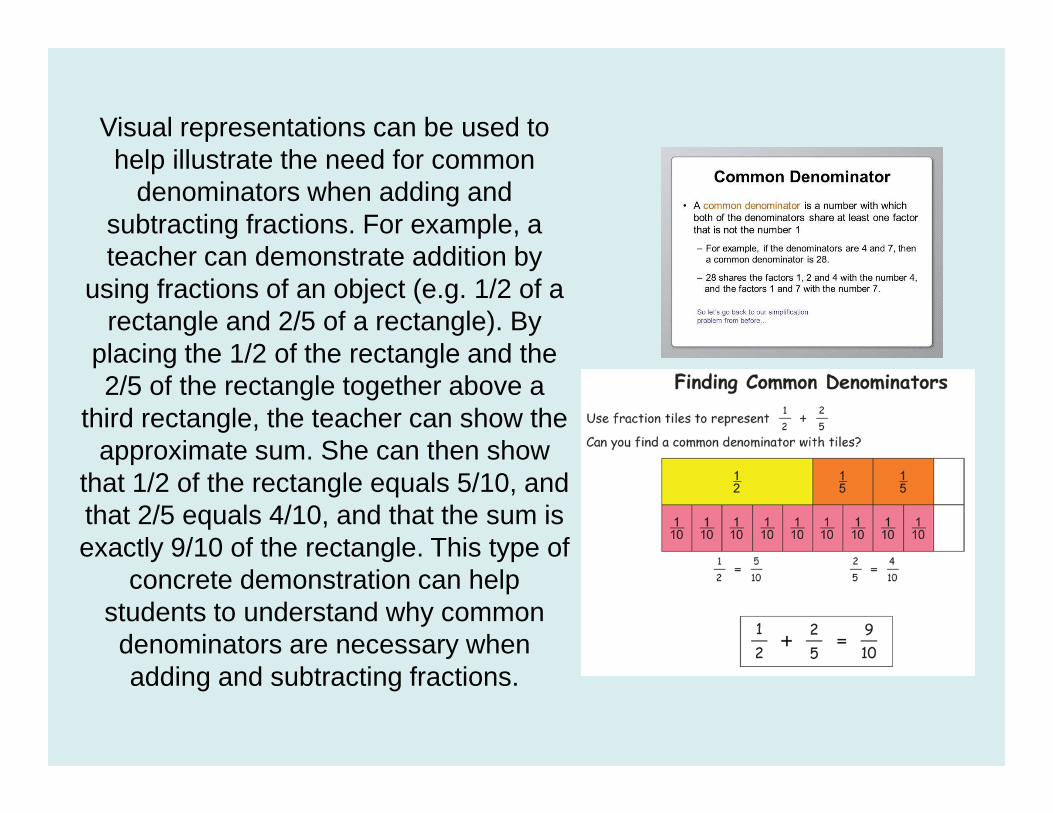
Visual representations can be used to help illustrate the need for common
denominators when adding and subtracting fractions. For example, a teacher can demonstrate addition by
using fractions of an object (e.g. 1/2 of a rectangle and 2/5 of a rectangle). By
placing the 1/2 of the rectangle and the 2/5 of the rectangle together above a
third rectangle, the teacher can show the approximate sum. She can then show
that 1/2 of the rectangle equals 5/10, and that 2/5 equals 4/10, and that the sum is exactly 9/10 of the rectangle. This type of
concrete demonstration can help students to understand why common denominators are necessary when adding and subtracting fractions.
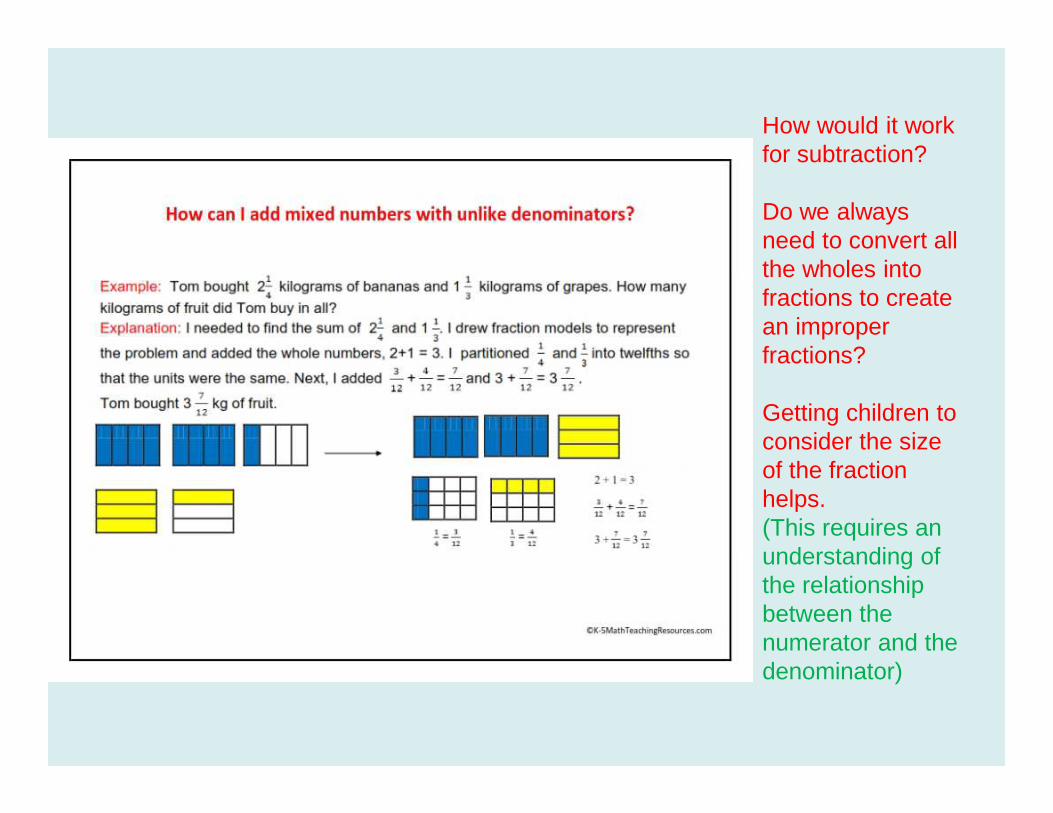
How would it work for subtraction?
Do we always need to convert all the wholes into fractions to create an improper fractions?
Getting children to consider the size of the fraction helps.(This requires an understanding of the relationship between the numerator and the denominator)

THREE BOX METHOD
Understanding this method relies on children having a
secure understanding of common
denominators and equivalent fractions.
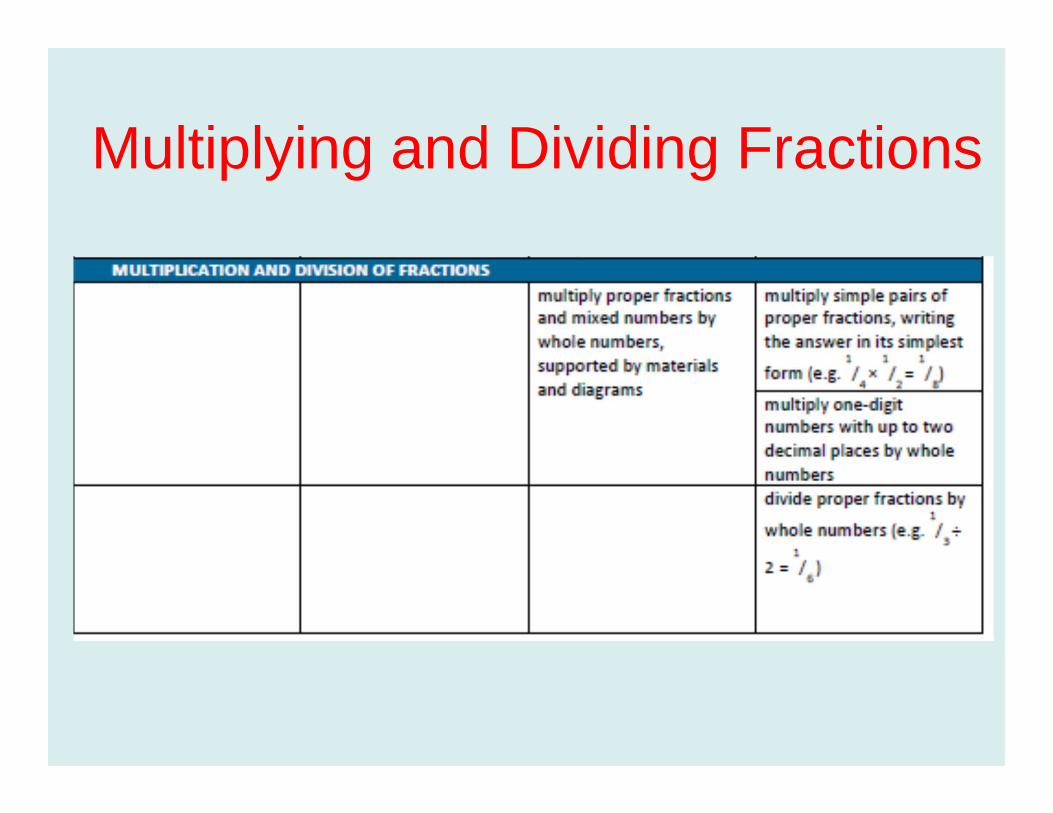
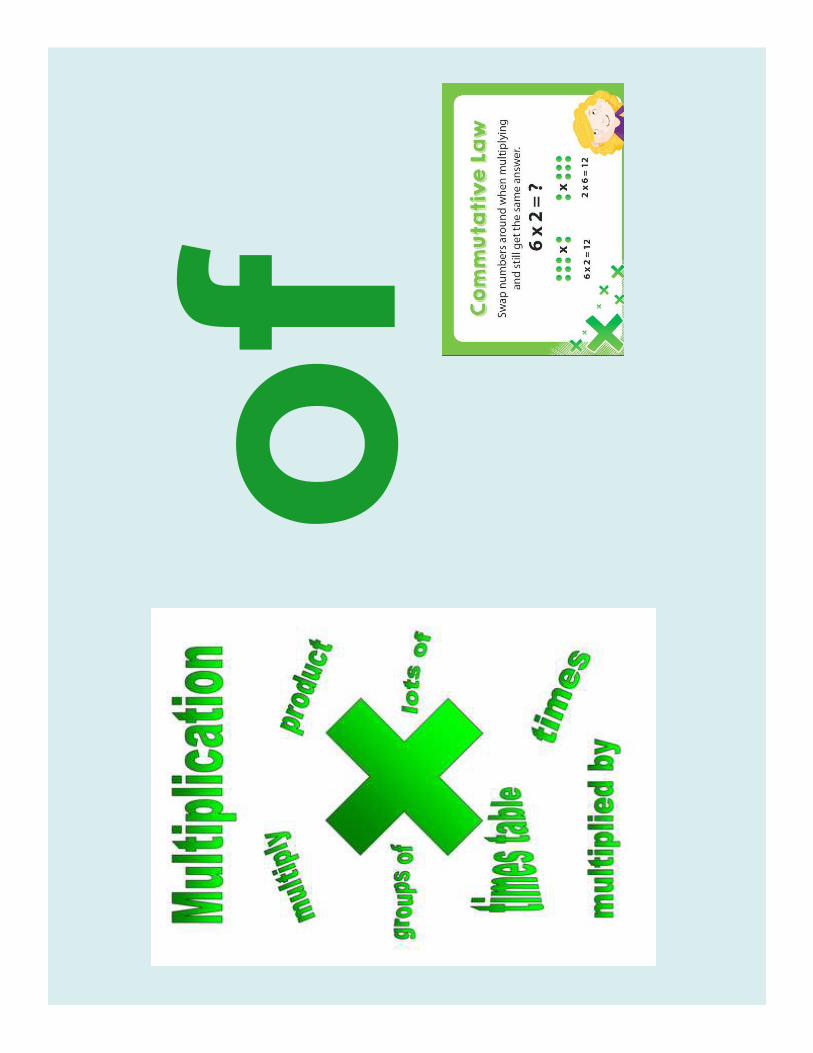
Multiplying and Dividing Fractions

Multiplication pictorial representations can help students understand how multiplying fractions involves finding a fraction of a fraction. For example, to illustrate ¼ times 2/3, a student can start with a rectangle, divide it into thirds vertically, and then shade 2/3 of the rectangle with vertical lines. She would then divide the rectangle into fourths/quarters with three horizontal lines, and shade ¼ of the already shaded area with horizontal lines. At the end, two of the twelve small rectangles would be shaded both horizontally and vertically. Visual representations of fractions help develop conceptual understanding of computational procedures.
1/4 x 2/3

A BIT OF A BITA PART OF A PARTA FRACTION OF A FRACTION
What happens to the product when the
multiplicands involve fractions?
Fractions offer students their first lesson that many properties that are true of whole numbers are not true for all numbers. For
example, with fractions, multiplication does not always lead to an answer larger than the multiplicands and division does not
always lead to an answer smaller than the dividend.
3/4 x 2/3
3/7 x 4/5
2/8 x 3/6
HAVE A GO – DRAW THE MODEL
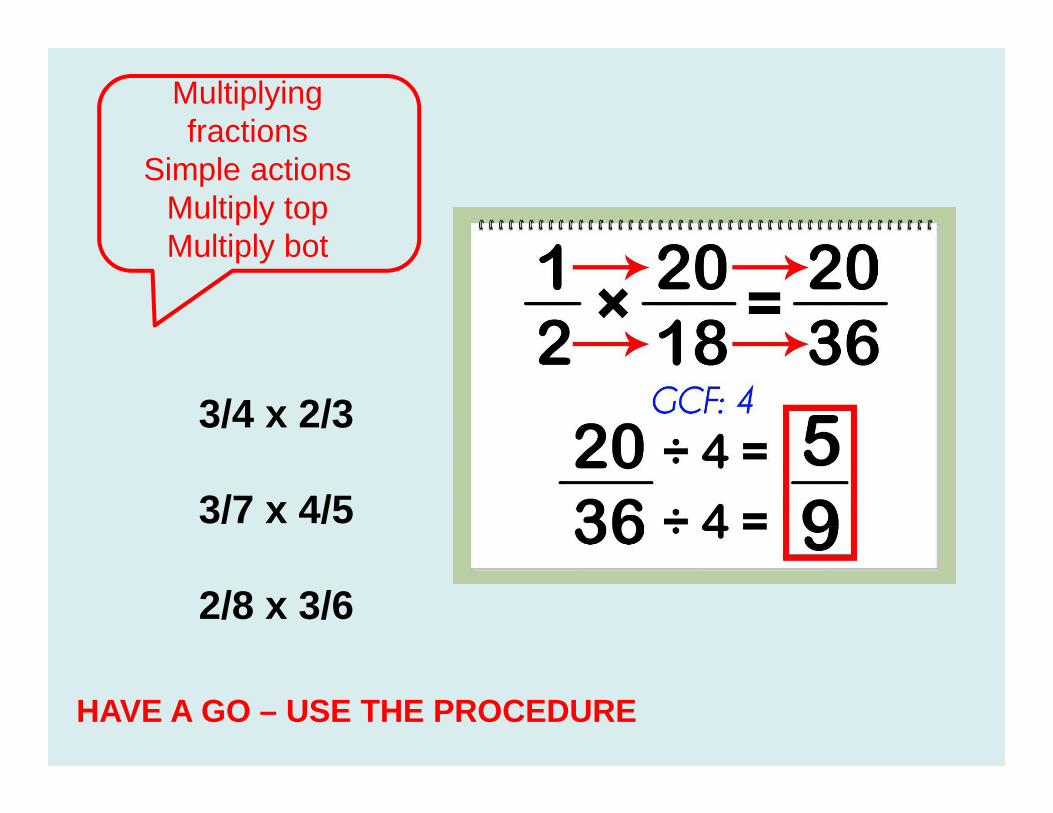
Multiplying fractions
Simple actionsMultiply topMultiply bot
3/4 x 2/3
3/7 x 4/5
2/8 x 3/6
HAVE A GO – USE THE PROCEDURE

Multiplying a Fraction and a Whole Number
Children need to understand multiplication as repeated
addition
As repeated addition children will see that they do not need to multiply the
denominators. (Identity property of 1)
SO…7 x 4
5 = 285 = 5 3
57 lots of 4/5
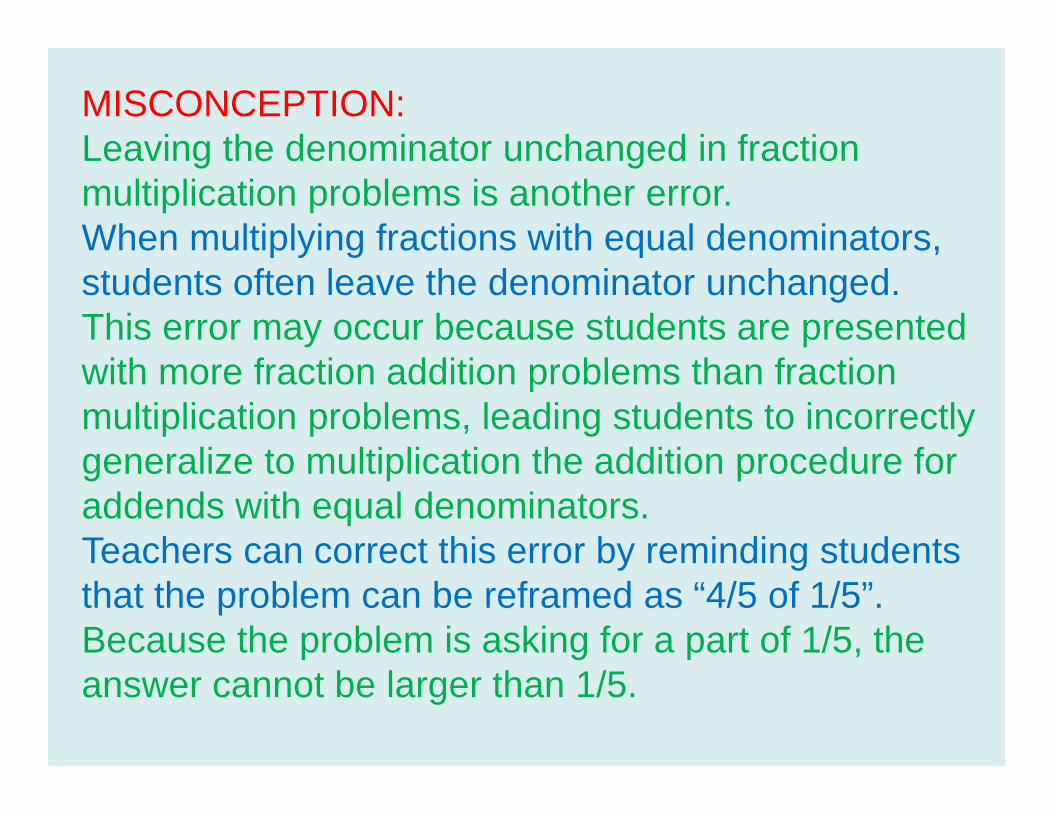
MISCONCEPTION: Leaving the denominator unchanged in fraction multiplication problems is another error. When multiplying fractions with equal denominators, students often leave the denominator unchanged.This error may occur because students are presented with more fraction addition problems than fraction multiplication problems, leading students to incorrectly generalize to multiplication the addition procedure for addends with equal denominators. Teachers can correct this error by reminding students that the problem can be reframed as “4/5 of 1/5”. Because the problem is asking for a part of 1/5, the answer cannot be larger than 1/5.
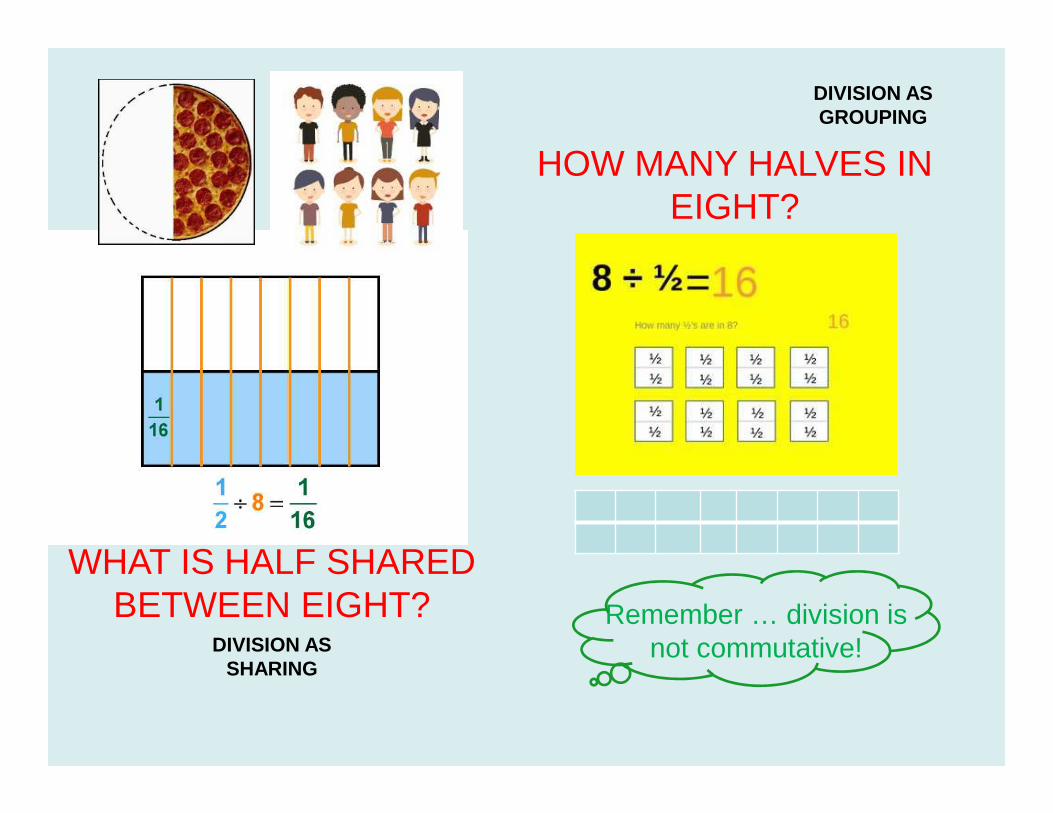
HOW MANY HALVES IN EIGHT?
WHAT IS HALF SHARED BETWEEN EIGHT? Remember … division is
not commutative!DIVISION AS SHARING
DIVISION AS GROUPING
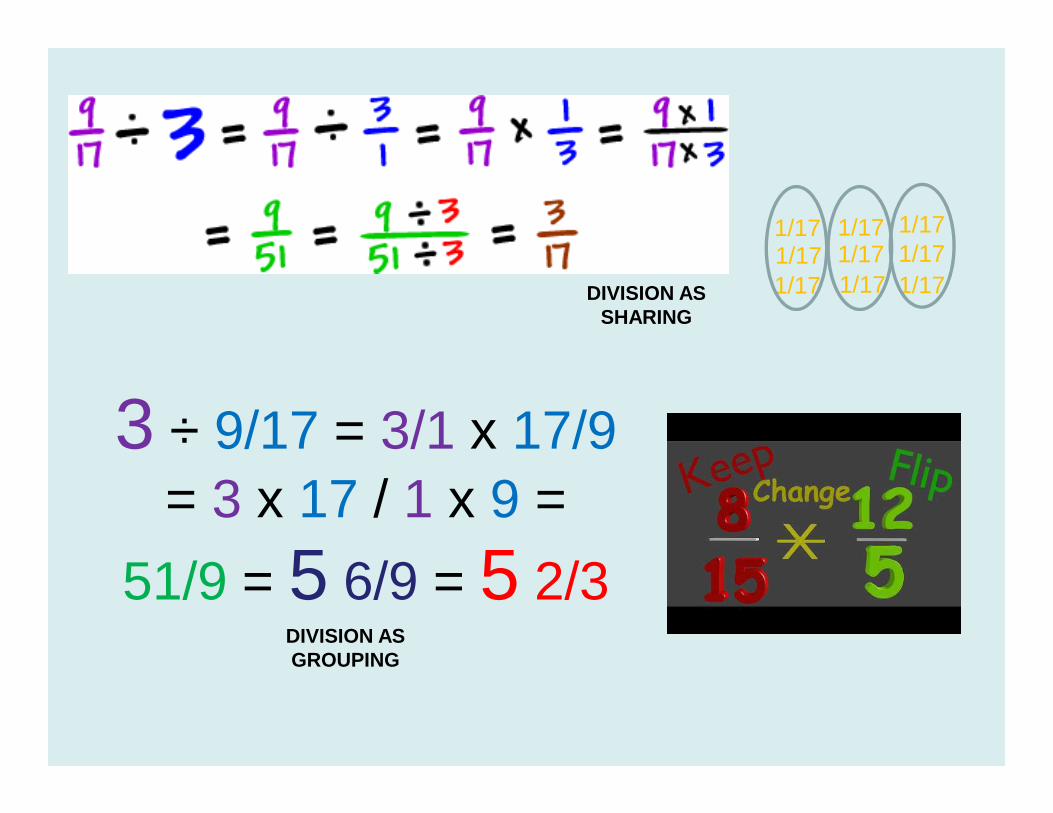
3 ÷ 9/17 = 3/1 x 17/9 = 3 x 17 / 1 x 9 =
51/9 = 5 6/9 = 5 2/3
1/171/17
1/17 1/171/171/17
1/171/171/17
DIVISION AS SHARING
DIVISION AS GROUPING

Part Two: Ratio and Proportion
A Whistle Stop Tour!
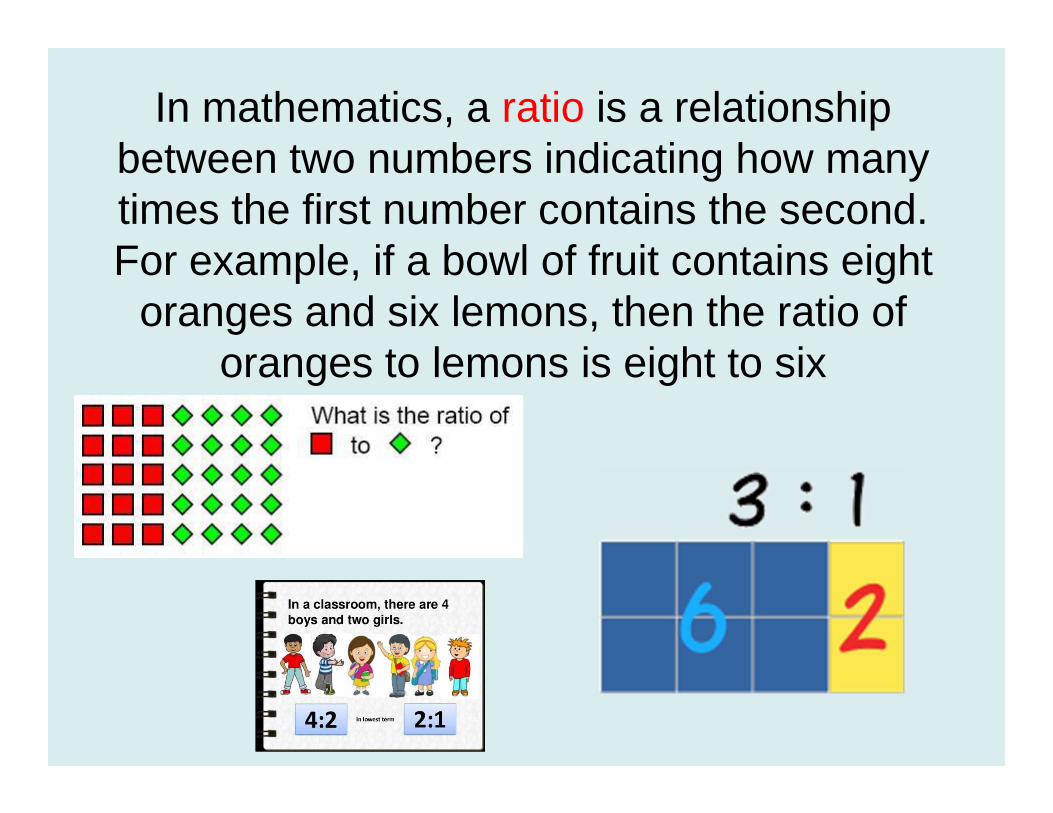
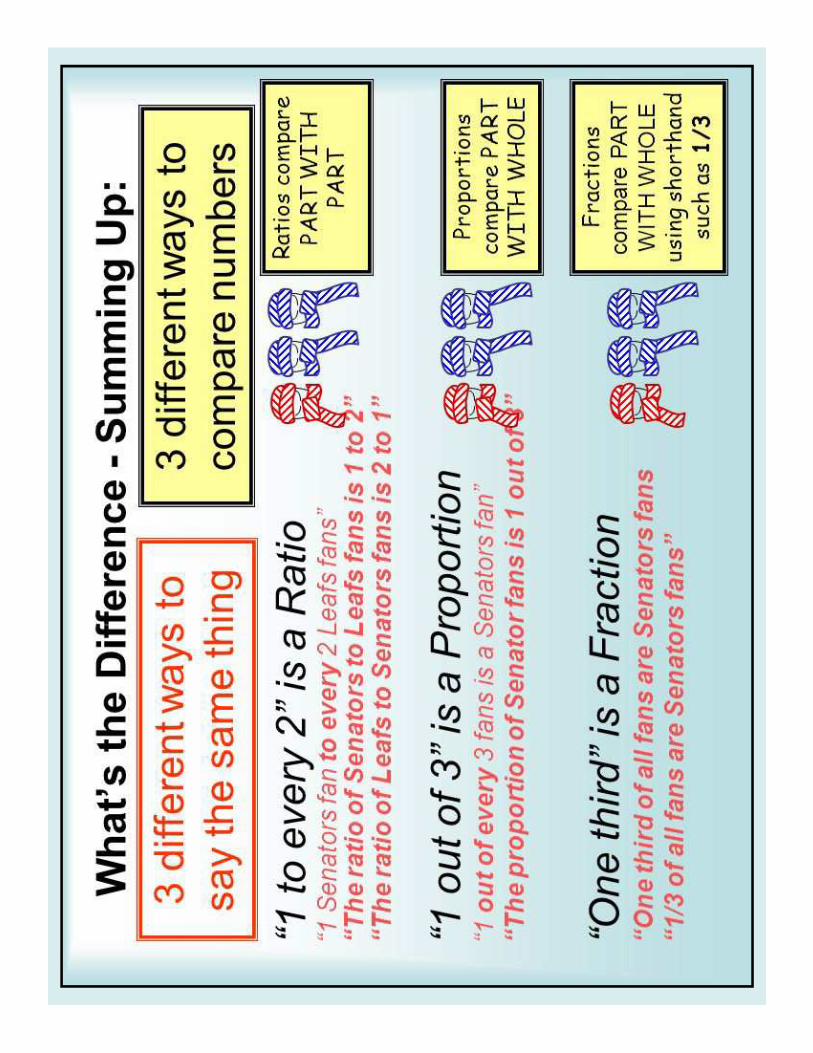
In mathematics, a ratio is a relationship between two numbers indicating how many times the first number contains the second. For example, if a bowl of fruit contains eight
oranges and six lemons, then the ratio of oranges to lemons is eight to six
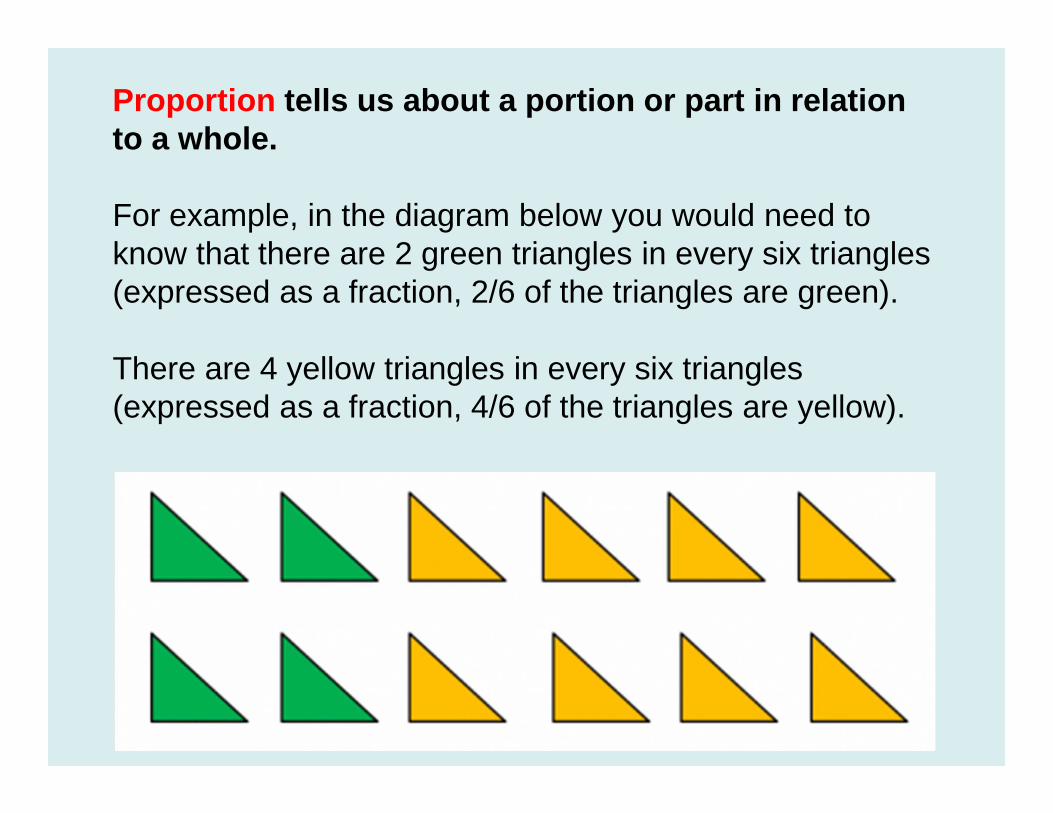
Proportion tells us about a portion or part in relation to a whole.
For example, in the diagram below you would need to know that there are 2 green triangles in every six triangles (expressed as a fraction, 2/6 of the triangles are green).
There are 4 yellow triangles in every six triangles (expressed as a fraction, 4/6 of the triangles are yellow).
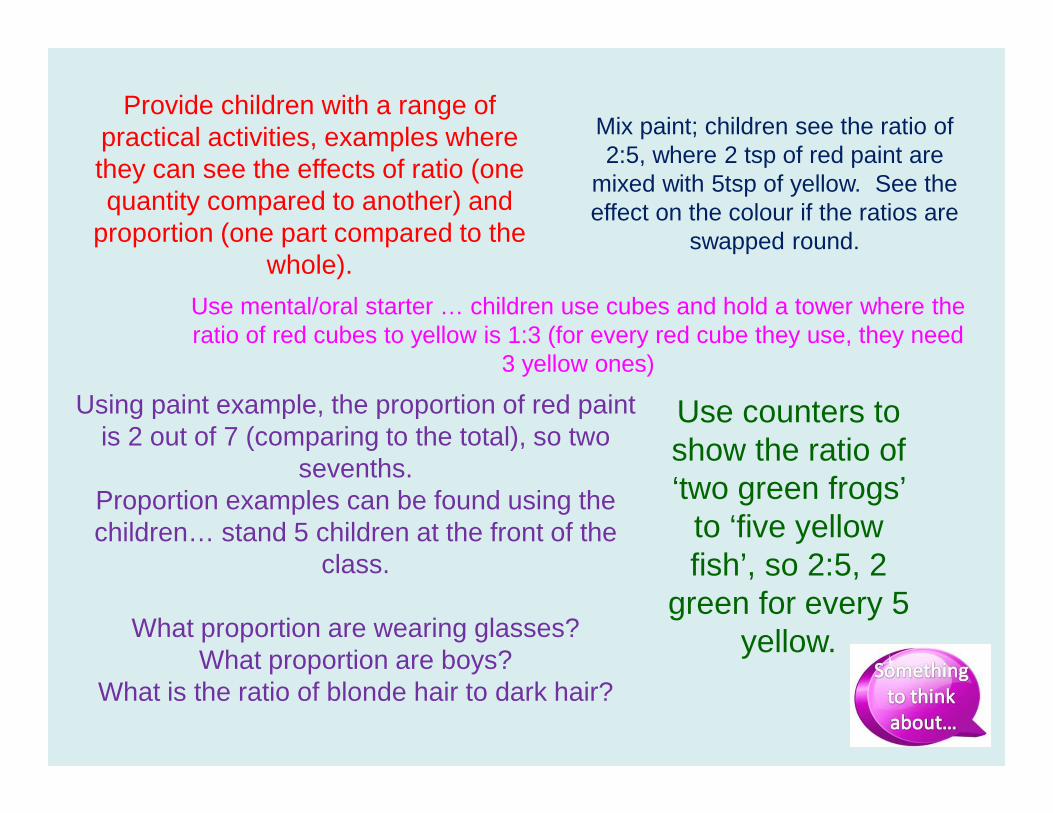
Provide children with a range of practical activities, examples where they can see the effects of ratio (one quantity compared to another) and
proportion (one part compared to the whole).
Using paint example, the proportion of red paint is 2 out of 7 (comparing to the total), so two
sevenths.Proportion examples can be found using the children… stand 5 children at the front of the
class.
What proportion are wearing glasses? What proportion are boys?
What is the ratio of blonde hair to dark hair?
Mix paint; children see the ratio of 2:5, where 2 tsp of red paint are
mixed with 5tsp of yellow. See the effect on the colour if the ratios are
swapped round.
Use counters to show the ratio of ‘two green frogs’
to ‘five yellow fish’, so 2:5, 2
green for every 5 yellow.
Use mental/oral starter … children use cubes and hold a tower where the ratio of red cubes to yellow is 1:3 (for every red cube they use, they need
3 yellow ones)

Jack and Jill share £28 in the ratio 5:2, how much does Jack receive?
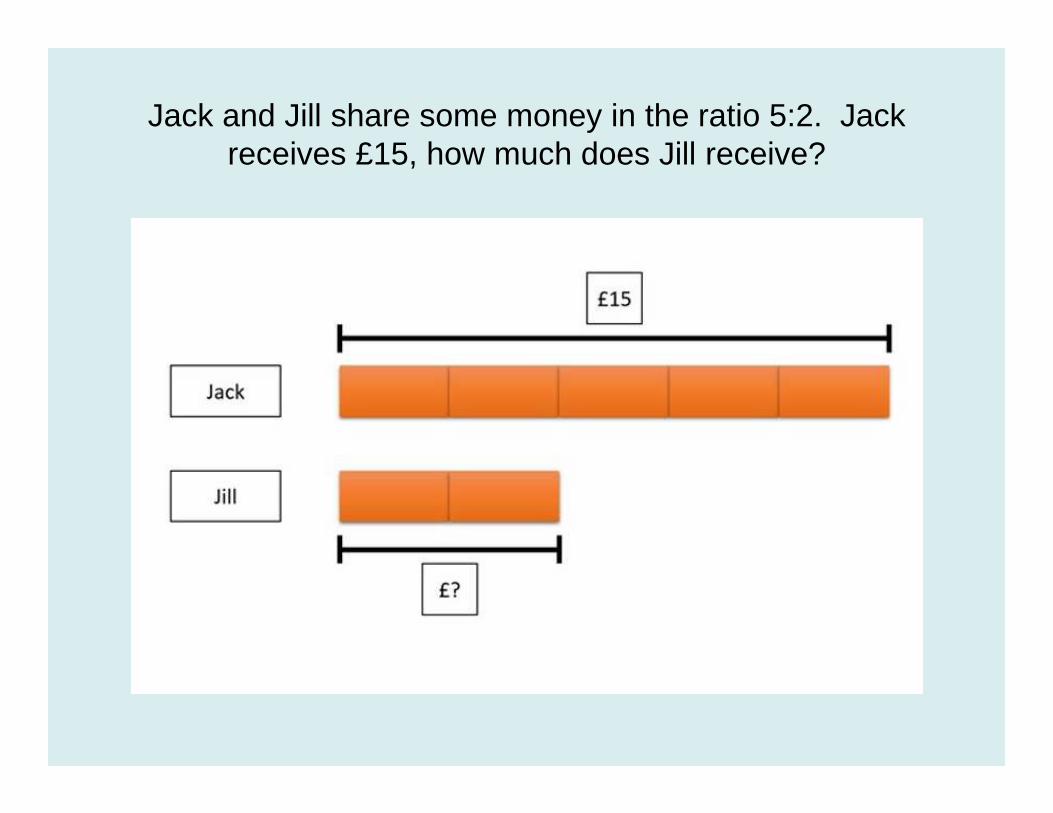
Jack and Jill share some money in the ratio 5:2. Jack receives £15, how much does Jill receive?

Jack and Jill share some money in the ratio 7:3. Jack gives £20 of his money to Jill, so now they have the same
amount each. How much money do they have altogether?
Part Three: Algebra
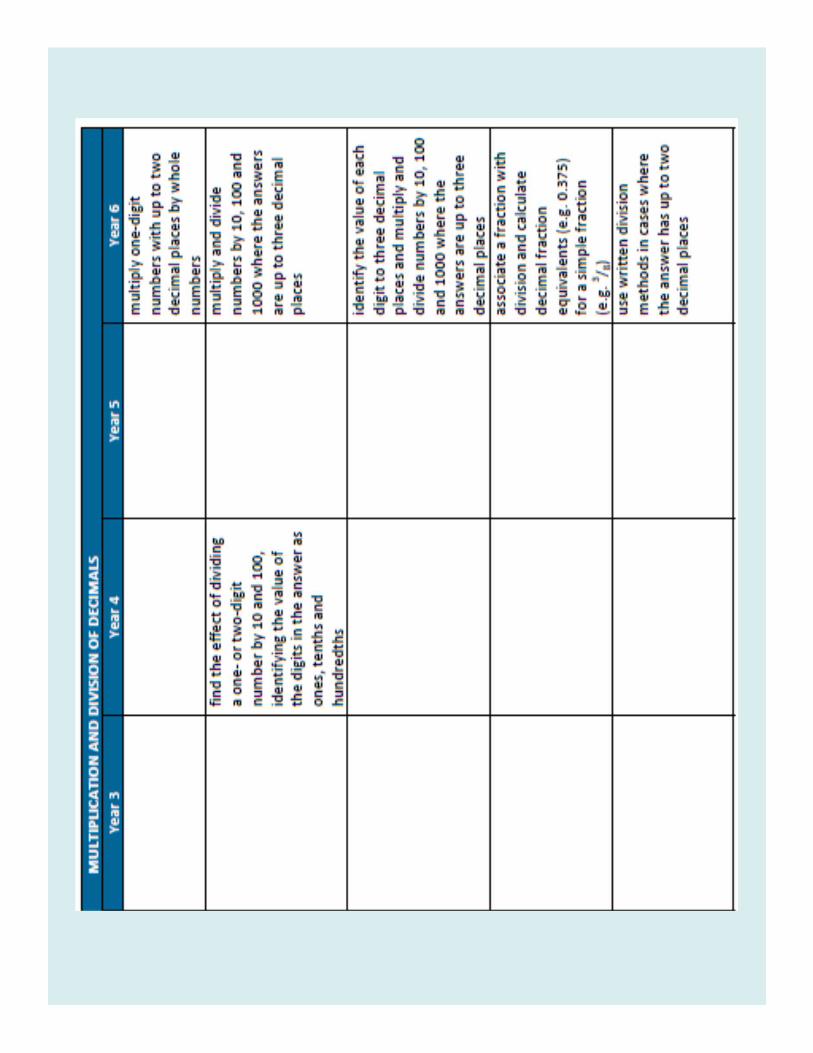
Making it a Whole School Journey
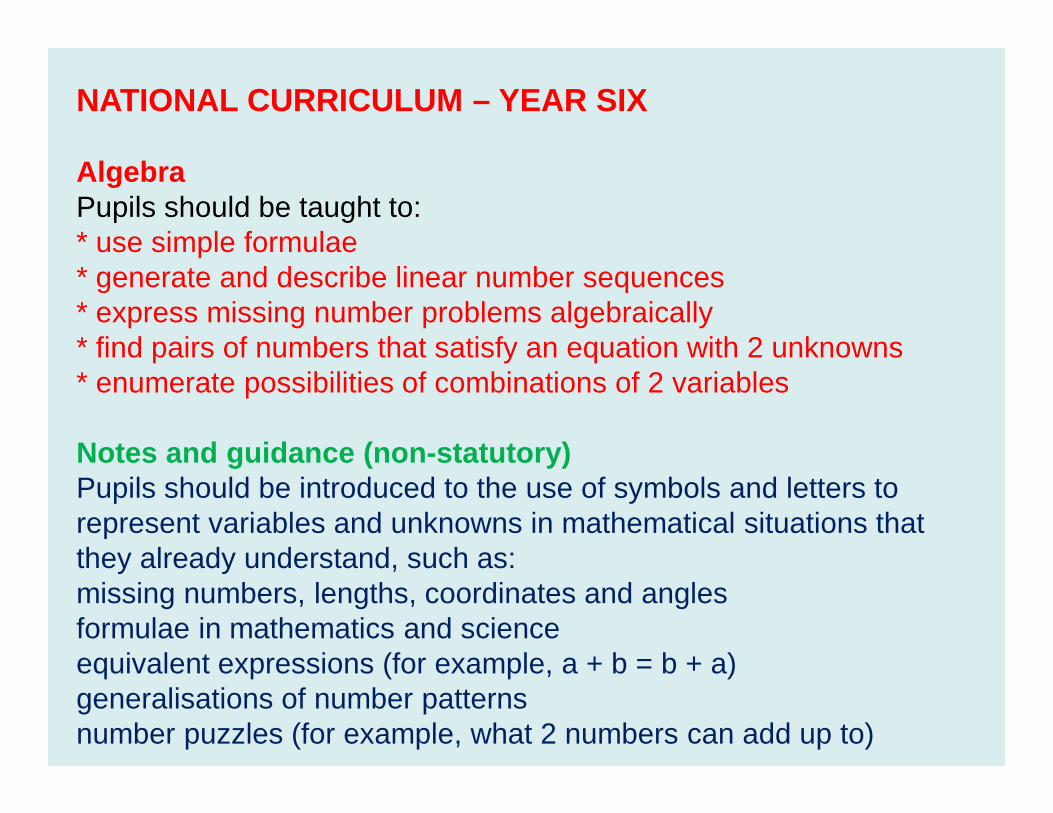
NATIONAL CURRICULUM – YEAR SIX
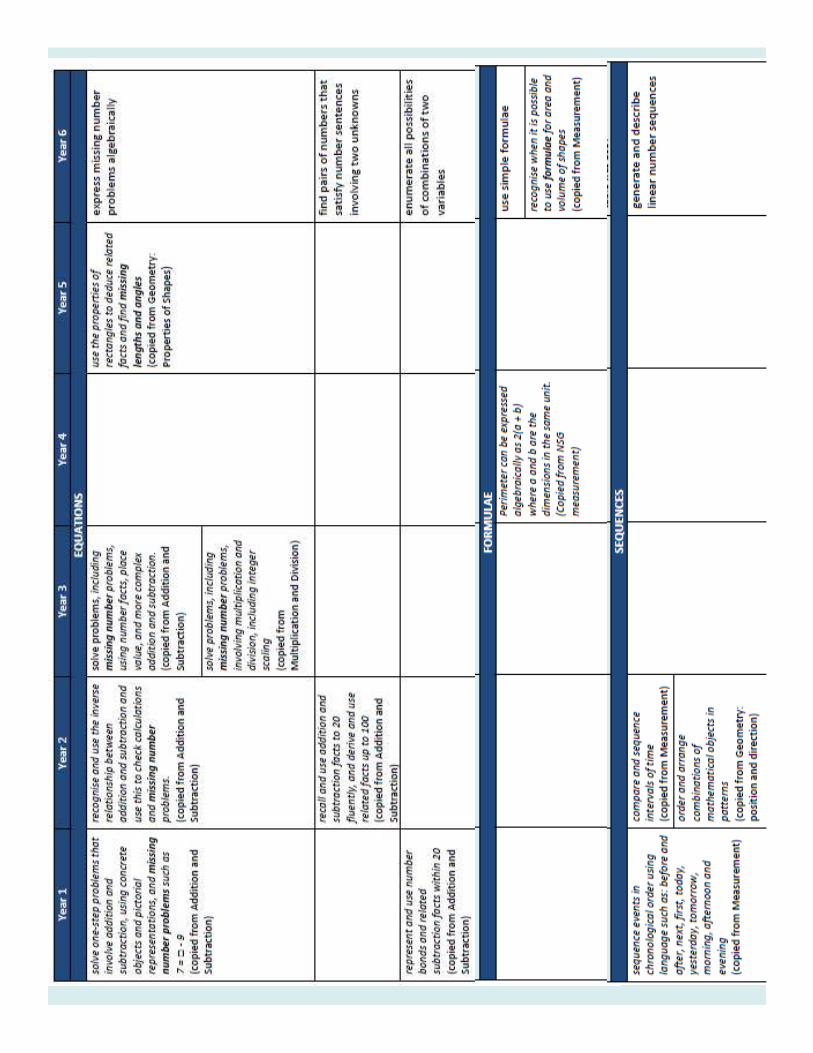
AlgebraPupils should be taught to:* use simple formulae* generate and describe linear number sequences* express missing number problems algebraically* find pairs of numbers that satisfy an equation with 2 unknowns* enumerate possibilities of combinations of 2 variables
Notes and guidance (non-statutory)Pupils should be introduced to the use of symbols and letters to represent variables and unknowns in mathematical situations that they already understand, such as:missing numbers, lengths, coordinates and anglesformulae in mathematics and scienceequivalent expressions (for example, a + b = b + a)generalisations of number patternsnumber puzzles (for example, what 2 numbers can add up to)
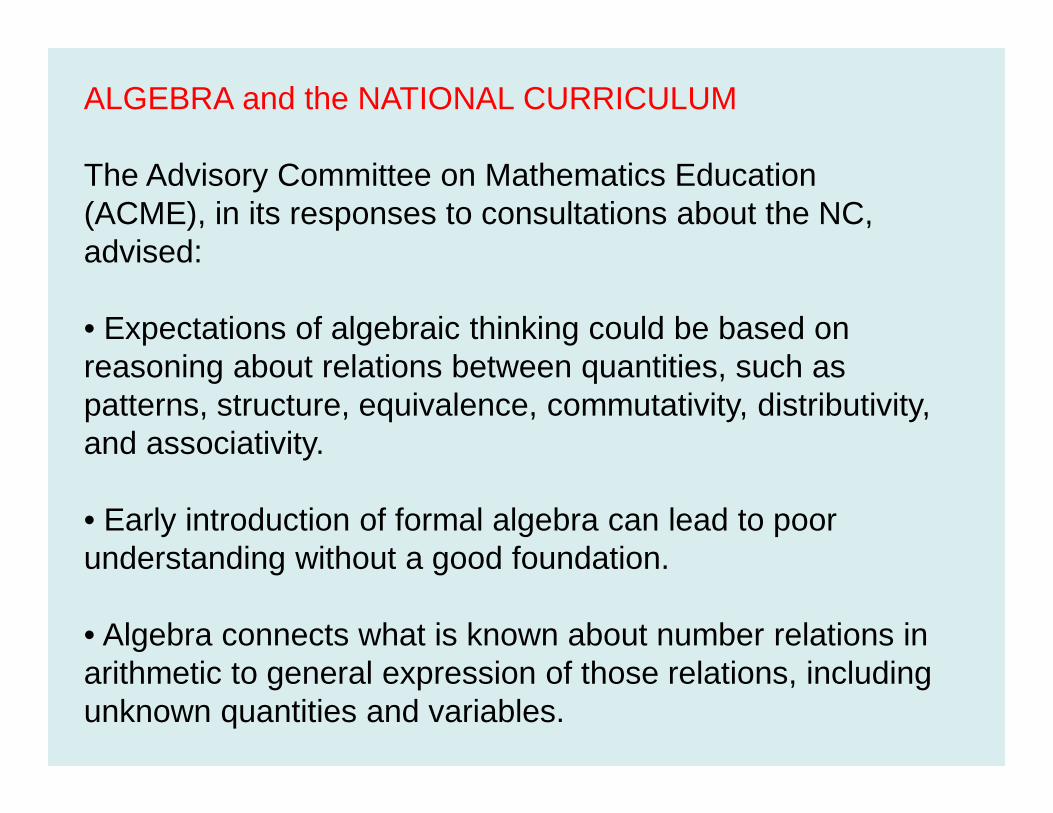
ALGEBRA and the NATIONAL CURRICULUM
The Advisory Committee on Mathematics Education (ACME), in its responses to consultations about the NC, advised:
• Expectations of algebraic thinking could be based on reasoning about relations between quantities, such as patterns, structure, equivalence, commutativity, distributivity, and associativity.
• Early introduction of formal algebra can lead to poor understanding without a good foundation.
• Algebra connects what is known about number relations in arithmetic to general expression of those relations, including unknown quantities and variables.

As the ACME made it clear to Government Ministers (during the development stage of the NC) that school algebra is founded on expressing structure, equivalence, and laws of combination of operations. These concepts emerge in early learning about number and arithmetic. Students' arithmetical competence and inventiveness depend on them, and they can develop further through mental methods and a range of spatial models for number.
Rather than being explicit about this as we would have wished, we ensured that there are indications throughout the primary curriculum in the guidance that can be read as directions to develop an algebraic, structural, understanding of number and arithmetic.
What's X Got to Do with It?Stage: 1, 2, 3 and 4
Algebra in the national curriculum
Anne Watson (Emeritus Professor of Mathematics Education, University of Oxford)
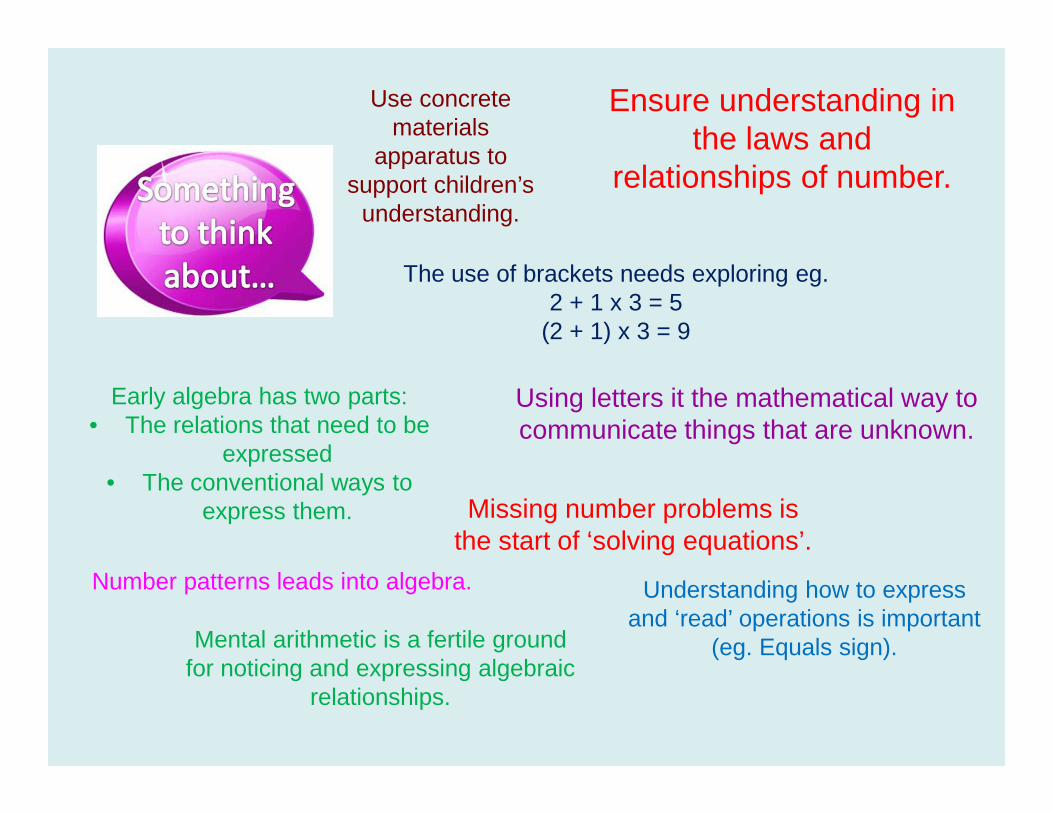
Ensure understanding in the laws and
relationships of number.
The use of brackets needs exploring eg. 2 + 1 x 3 = 5
(2 + 1) x 3 = 9
Number patterns leads into algebra.
Using letters it the mathematical way to communicate things that are unknown.
Early algebra has two parts: • The relations that need to be
expressed• The conventional ways to
express them.
Understanding how to express and ‘read’ operations is important
(eg. Equals sign).
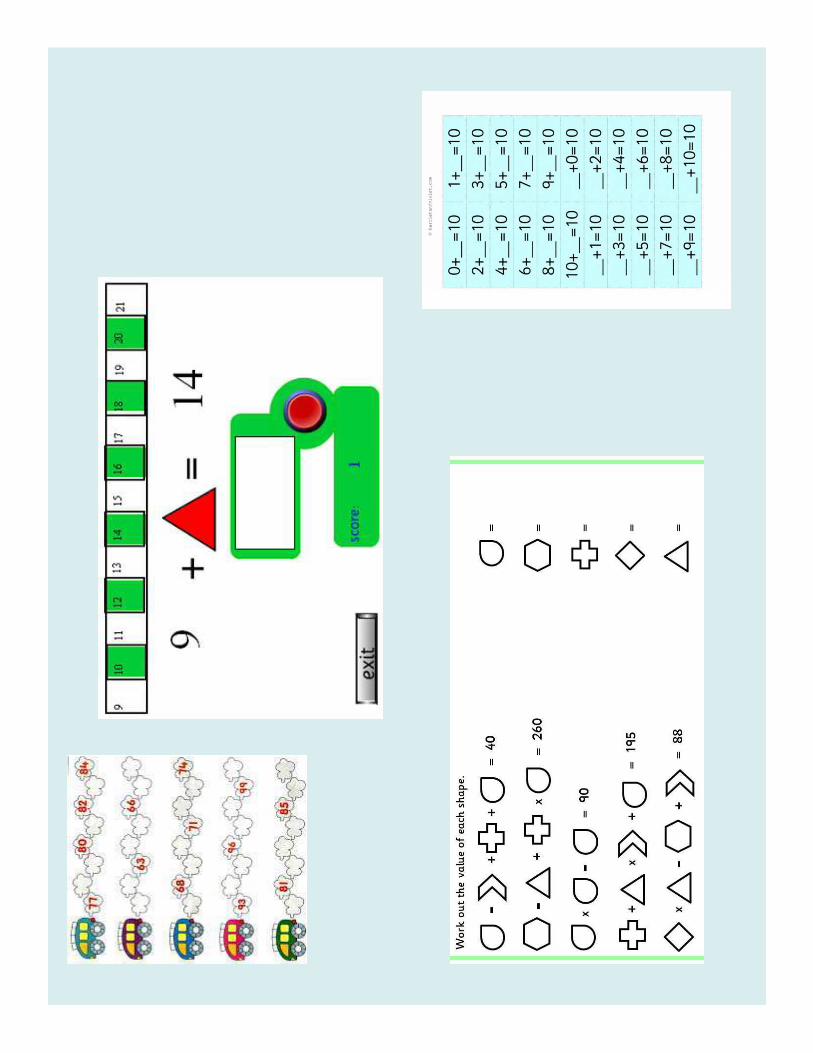
Missing number problems is the start of ‘solving equations’.
Use concrete materials
apparatus to support children’s
understanding.
Mental arithmetic is a fertile ground for noticing and expressing algebraic
relationships.


Part Four: Statistics
Progression across the Primary Phase


Tally ChartLine Graphs
BarPictogram
Interpret
Construct
Block Diagram
Table Category Data
Comparing
Question
Bar Charts
Discrete Data
Continuous Data
Time Graphs
Information
Timetables
Pie ChartsFrequency
MeanAverage
Axis / axesInterpret
HorizontalVertical
Intervals
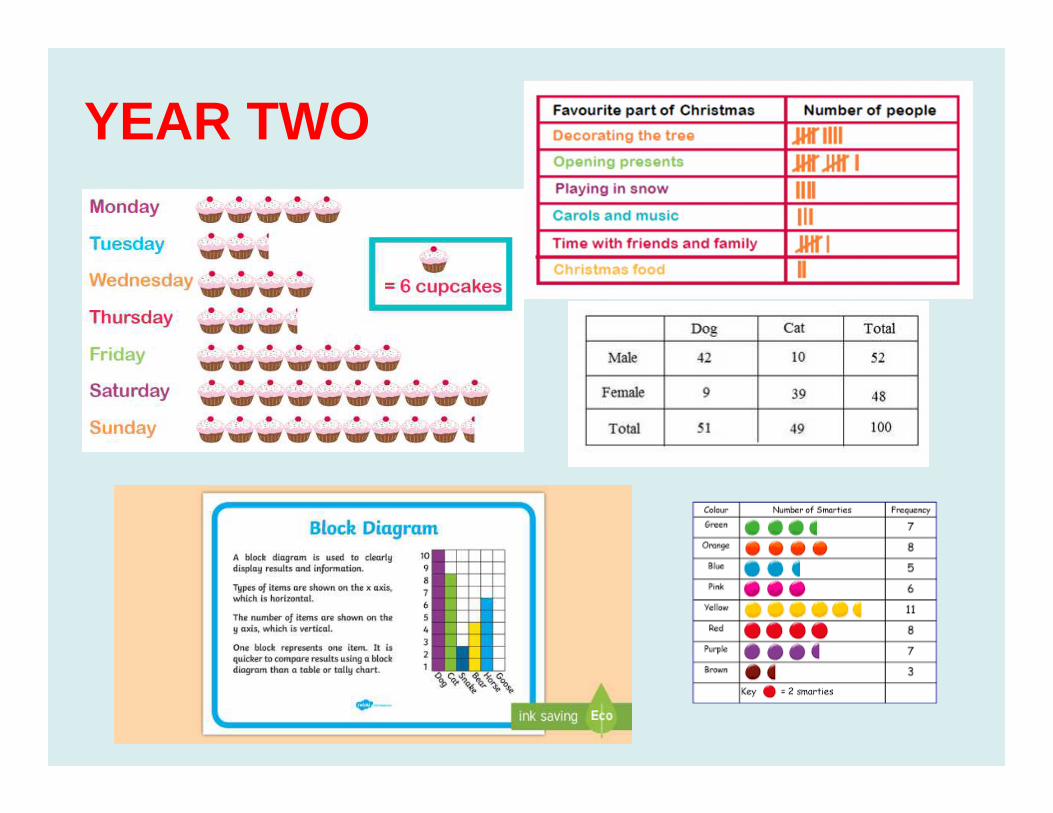
YEAR TWO

YEAR THREE

YEAR FOUR
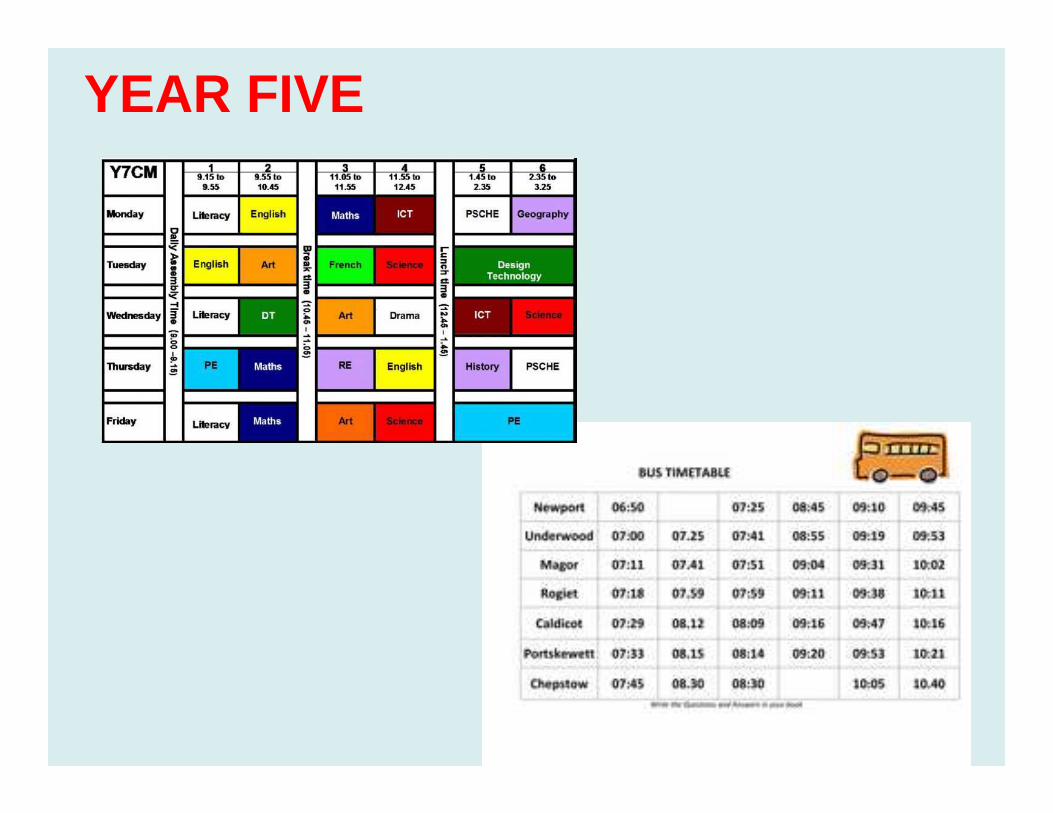
YEAR FIVE

YEAR SIX

YEAR SIX - AVERAGES
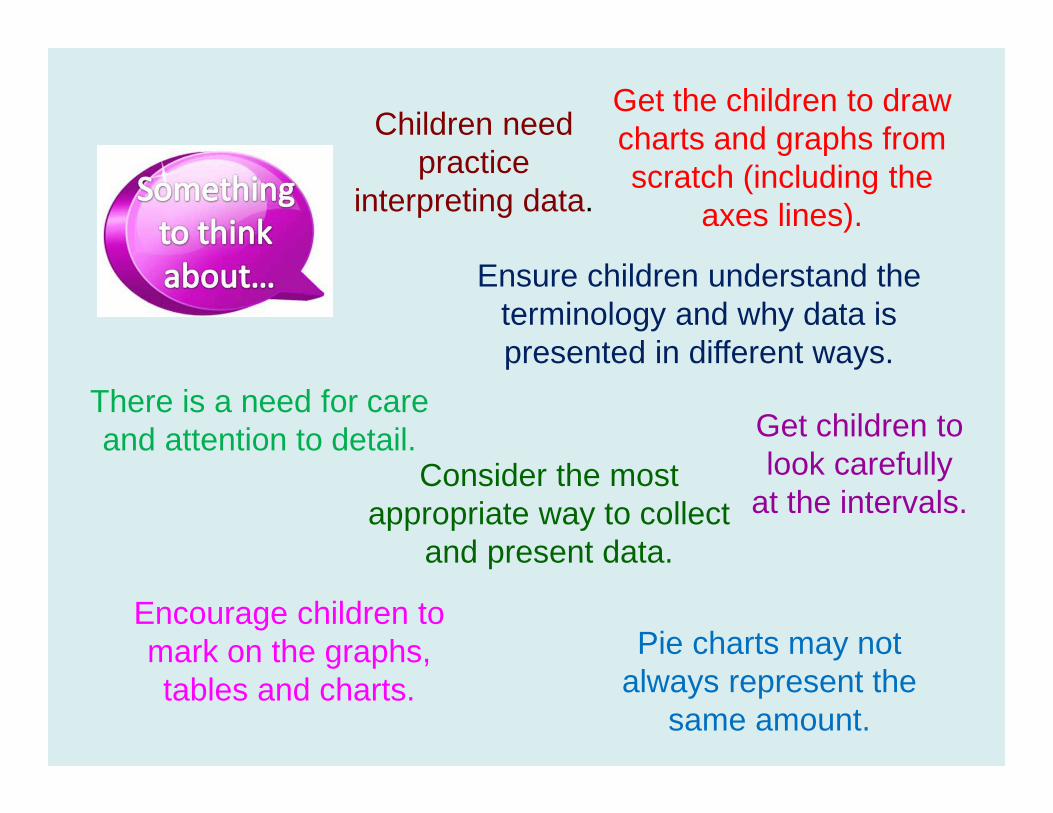
Get the children to draw charts and graphs from scratch (including the
axes lines).
Ensure children understand the terminology and why data is presented in different ways.
Encourage children to mark on the graphs, tables and charts.
Get children to look carefully
at the intervals.
There is a need for care and attention to detail.
Pie charts may not always represent the
same amount.
Consider the most appropriate way to collect
and present data.
Children need practice
interpreting data.


