
© Freddie MacCONFIDENTIAL 1
Seasoned Credit Risk Transfer Trust,
Series 2019-3 (“SCRT” 2019-3)
Investor Presentation
July 2019Information contained in this presentation is current as of August 2019.
For further information on this transaction see the SCRT 19-3 Offering
Circular on freddiemac.com
© Freddie MacCONFIDENTIAL 2
Disclaimer
Notice to all Investors:
This document is not an offer to sell any Freddie Mac securities. Offers for any given security are made only through applicable offering circulars and related supplements, which incorporate Freddie Mac’s
Annual Report on Form 10-K for the year ended December 31, 2018, filed with the SEC on February 14, 2019; all other reports Freddie Mac filed with the SEC pursuant to Section 13(a) of the Exchange Act
since December 31, 2018, excluding any information "furnished" to the SEC on Form 8-K; and all documents that Freddie Mac files with the SEC pursuant to Sections 13(a), 13(c) or 14 of the Exchange Act,
excluding any information “furnished” to the SEC on Form 8-K. Content in this presentation is not reflective of current market/spreads and is not indicative of any future Freddie Mac offerings. Please use this
deck for informational purposes only.
Notice to Canadian Investors:
The Presentation (the “Presentation”) is confidential and may not be reproduced or transferred, in whole or in part, to any other party that is not an employee, officer, director, or authorized agent of the recipient
without the express written consent of Freddie Mac. Each person accepting these materials agrees to return them promptly upon request.
The material provided herein is for informational purposes only and delivered solely as reference material with respect to the Seasoned Credit Risk Transfer Trust, Series 2019-3 Certificates (the “Certificates”).
The Presentation does not constitute an offer to sell or a solicitation of an offer to buy any securities. Any offering of securities will occur only in accordance with the terms and conditions set forth in an offering
circular (“Offering Circular”) or private placement memorandum (“Private Placement Memorandum”). Investors are strongly urged to carefully review the Offering Circular or Private Placement Memorandum
(including the risk factors described therein) and to discuss any prospective investment in the Certificates with their legal and tax advisers in order to make an independent determination of the suitability and
consequences of an investment.
No person has been authorized to give any information or to make any representation, warranty, statement or assurance not contained in the Offering Circular and, if given or made, such other information or
representation, warranty, statement or assurance must not be relied upon.
Prospective investors should inform themselves and take appropriate advice as to any applicable legal requirements and any applicable taxation and exchange control regulations in the countries of their
citizenship, residence or domicile which might be relevant to the subscription, purchase, holding, exchange, redemption or disposal of any Certificates.
Targets are objectives and should not be construed as providing any assurance or guarantee as to the results that may be realized in the future from investment in any asset or asset class described in the
Presentation. Please be advised that any targets shown in the Presentation are subject to change at any time and are current as of the date of this presentation only. In addition, the information contained
therein includes observations and/or assumptions and involves significant elements of subjective judgment and analysis. No representations are made as to the accuracy of such observations and assumptions
and there can be no assurances that actual events will not differ materially from those assumed. In the event any of the assumptions used in the Presentation do not prove to be true, results are likely to vary
substantially from those discussed therein.
A prospective investor in the Certificates must conduct its own independent review and due diligence to make its own assessment of the merits and risks of making an investment in, perform its own legal,
accounting and tax analysis and conclude that the investment in the Certificates (i) is fully consistent with the investor’s financial requirements and financial condition, investment objectives and risk tolerance;
(ii) complies and is fully consistent with all investment policies, guidelines and restrictions applicable to the investor; and (iii) is a fit, proper and suitable investment for the investor.

© Freddie MacCONFIDENTIAL 3
Disclaimer
Notice to all Investors:
The information contained in the attached materials (the “Information”) has been provided by Citigroup Global Markets Inc. (“Citigroup”) (a “Dealer”) and is preliminary and subject to change. The Information
does not include all of the information relating to the securities. As such, the Information may not reflect the impact of all structural characteristics of the securities. The assumptions underlying the Information,
including structure and the composition of the mortgage loan population for this transaction (“Mortgage Pool”), may be modified from time to time to reflect changed circumstances. This document may be
amended, superseded or replaced by subsequent term sheets, “roadshow” materials and/or updated pool information and will be superseded by the applicable Offering Circular or Private Placement
Memorandum, which will describe the final terms and conditions of the securities. Prospective purchasers are recommended to review the final Offering Circular or final Private Placement Memorandum, as
applicable, relating to the securities discussed in this communication. The final Offering Circular or final Private Placement Memorandum will contain data that is current as of its publication date and after
publication may no longer be complete or current. A final Offering Circular or final Private Placement Memorandum may be obtained from the joint bookrunner Citigroup by calling 1-800-831-9146.
The Information is preliminary and subject to final structural, accounting and legal review as well as final changes to the composition of the underlying mortgage loans. The analyses, calculations and valuations
herein are based on certain assumptions and data provided by third parties that may vary from the actual characteristics of the underlying mortgage loans relating to the Certificates. Neither the Dealers nor
Freddie Mac have verified these analyses, calculations or valuations. Material contained within the Information may also be based on assumptions regarding market conditions and other matters as reflected
herein, and such assumptions may not coincide with actual market conditions or events. Neither the Dealers nor Freddie Mac have undertaken to update or amend the Information since the date it was issued.
More current information may be available publicly from other sources.
The Certificates are being offered when, as and if issued. In particular, you are advised that these Certificates, and the underlying mortgage loans, are subject to modification or revision (including, among other
things, the possibility that one or more classes of Certificates may be split, combined, or eliminated), at any time prior to issuance or availability of the final Offering Circular or Private Placement Memorandum.
Any decision to invest in the Certificates described herein should be made after reviewing the final Offering Circular or Private Placement Memorandum, conducting such investigations as the investor deems
necessary and consulting the investor’s own legal, accounting, and tax advisors in order to make an independent determination of the suitability and consequences of an investment in the Certificates.
The investment described in this Presentation is a complex financial product. These Certificates are complex instruments intended for sale only to sophisticated investors who understand and assume the risks
involved with the purchase thereof. The risks associated with the Certificates may significantly reduce an investor’s expected yield and expected return of principal, and/or reduce an investor’s ability to sell or
obtain market value information about the Certificates. Investors should independently evaluate the risks associated with the Certificates and consult their own professional advisors. These risks may include,
but may not be limited to the following:
The performance of the underlying mortgage loans may be correlated with economic or other factors that may diminish the value of the Certificates.
The performance of the underlying mortgage loans and the value of the Certificates may be largely dependent on the quality of the origination, performance history, and servicing of the underlying
mortgage loans.
The value of the Certificates may be diminished by market conditions unrelated to the performance of the Certificates.
This document shall not constitute an underwriting commitment, an offer of financing, an offer to sell, or the solicitation of an offer to buy any Certificates described herein, which shall be subject to the Dealer’s
internal approvals. No transaction or services related thereto is contemplated without the Dealer’s subsequent formal agreement. The Dealers are not acting as a fiduciary, advisor or agent.
Prior to entering into any transaction, you should determine, without reliance upon the Dealers or their affiliates, the economic risks and merits, as well as the legal, tax and accounting characterizations and
consequences of the transaction, and independently determine that you are able to assume these risks. In this regard, by acceptance of these materials, you acknowledge that you have been advised that (a)
the Dealers are not in the business of providing legal, tax or accounting advice, (b) you understand that there may be legal, tax or accounting risks associated with the transaction, (c) you should receive legal,
tax and accounting advice from advisors with appropriate expertise, to assess relevant risks, and (d) you should apprise senior management in your organization as to the legal, tax and accounting advice (and,
if applicable, risks) associated with this transaction and the Dealers’ disclaimers as to these matters.
The Information may not be forwarded or provided by you to any other person. An investor or potential investor in the Certificates (and each employee, representative, or other agent of such person or entity)
may disclose to any and all persons, without limitation, the tax treatment and tax structure of the transaction (as defined in United States Treasury Regulation Section 1.6011-4) and all related materials of any
kind, including opinions or other tax analyses, that are provided to such person or entity. However, such person or entity may not disclose any other information relating to this transaction unless such
information is related to such tax treatment and tax structure.

© Freddie MacCONFIDENTIAL 4
Agenda
1. Program Summary
2. Transaction Timeline
3. Collateral Comparison and Structure
4. Historical Deal Performance and Model Data
5. Program Support
6. SCRT Transactions Re-Cap
7. Historical Cohort Performance
8. Modification Overviews
9. Data Stratifications
10. Collateral History by Group
11. Freddie Mac Key Contacts

© Freddie MacCONFIDENTIAL 5
1. Program Summary

© Freddie MacCONFIDENTIAL 6
Freddie Mac’s $2.2bn SCRT 2019-3 securitization is the company’s twelfth SCRT securitization and is backed by seasoned, 12+
months clean pay, re-performing single-family mortgage loans (“RPLs”)
The underlying mortgage loans (the “Mortgage Loans”) were either previously securitized in Freddie Mac Participation
Certificates (“PCs”) and bought out of the PCs by Freddie Mac, or retained by Freddie Mac in whole loan form
» Each Mortgage Loan was modified under either a GSE HAMP or GSE non-HAMP modification program
» All of the Mortgage Loans are re-performing and have been current based on the MBA method for at least the prior 12
months as of the Cut-Off Date
SCRT 2019-3 includes guaranteed senior certificates and non-guaranteed subordinate certificates, certain interest-only
certificates, a mortgage insurance certificate, and non-economic REMIC residual certificates
» The guaranteed senior certificates will be offered as either modifiable and combinable REMIC certificates (“MACR”) or
exchangeable certificates (pass-through, front and back-pay sequential, accretion directed, accrual, strip down and
interest only)
The Class M certificates are expected to be rated by DBRS, Inc. and Fitch Ratings, Inc.
Freddie Mac is not required to and will not retain credit risk pursuant to the Dodd Frank Credit Risk Retention Rule
Beginning with SCRT 2019-2, the Notional Principal Contract no longer applies to the Guaranteed Securities
SCRT Program Summary

© Freddie MacCONFIDENTIAL 7
As of March 31, 2019, Freddie Mac’s total retained portfolio balance was $218.9 billion, a large share of which is comprised of
Less Liquid Assets(1)
A significant portion of Less Liquid Assets are single-family residential mortgage loans, which are the focus of both loan sales and
securitization efforts
Freddie Mac has been actively reducing these assets via economically reasonable transactions
(1) Less Liquid Assets include single-family RPL, single-family seriously delinquent loans, multifamily unsecuritized mortgage loans not in the securitization pipeline, certain Freddie
Mac mortgage-related securities and non-agency mortgage-related securities not guaranteed by the GSEs
(2) Includes loans that are 30 and 60 days delinquent
(3) Source: Freddie Mac Annual Report on Form 10-Q for the quarters ended March 31, 2018 and March 31, 2019, respectively
Retained Portfolio and Less Liquid Assets
Description3/31/2018
($ in Billions)
3/31/2019
($ in Billions)Year over Year Change
($ in Billions)
Re-performing Loans and Performing
ModifiedLoans (2)(3) $45.8 $37.4 $(8.4)
Single-Family Unsecuritized Seriously
Delinquent Loans(3) $11.0 $8.6 $(2.4)
Total $56.8 $46.0 $(10.8)

© Freddie MacCONFIDENTIAL 8
PCs - Fully Guaranteed Securitizations
R, M and H Pools
$28.7 billion settled since 2011
Primarily 12+ months clean pay history
Serviced to Freddie Mac Guide
No forborne UPB
No servicing change
SCRT - RPL Senior/Sub
Guaranteed Seniors/ Non-guaranteed Subs
$20.3 billion settled since Q4 2016
Primarily 12+ months clean pay history
Not serviced to Freddie Mac Guide
Includes forborne UPB
Freddie Mac selects servicer for trust
NPL Sales
SPO and EXPO Offerings
$7.8 billion settled since 2014
Primarily 12+ months delinquent
Not serviced to Freddie Mac Guide
Includes forborne UPB
NPL buyer selects servicer
SLST - RPL Structured Sales
Guaranteed Seniors/ Non-guaranteed Subs
$4.3 billion settled since Q4 2016
Primarily inconsistent pay RPLs and moderately DQ NPLs
Not serviced to Freddie Mac Guide
Includes forborne UPB
Buyer of subs selects servicer for the trust
Freddie Mac Seasoned and Legacy Loan ActivityApproximately $58 Billion from 2011 through June 2019
Source: Freddie Mac Press Releases on FreddieMac.com
© Freddie MacCONFIDENTIAL 9
2. Transaction Timeline

© Freddie MacCONFIDENTIAL 10
Transaction Timeline
Key Dates
July 22nd to July 31st Roadshow/Conference Calls
August 5th Announce Transaction
August 8th Expecting Pricing Date
August 14th Expecting Closing Date
August 26th First Distribution Date
July 2019 August 2019
S M T W T F S S M T W T F S
1 2 3 4 5 6 1 2 3
7 8 9 10 11 12 13 4 5 6 7 8 9 10
14 15 16 17 18 19 20 11 12 13 14 15 16 17
21 22 23 24 25 26 27 18 19 20 21 22 23 24
28 29 30 31 25 26 27 28 29 30 31
Holidays Marketing
Roadshow/Conference Calls Expected Pricing Date
Pre-marketing Expected Closing Date
First Distribution Date

© Freddie MacCONFIDENTIAL 11
3. Collateral Comparison and Structure

© Freddie MacCONFIDENTIAL 12
The assets of the Trust are three groups of seasoned, fixed-rate and step-rate, first lien re-performing Mortgage Loans
Structure consists of three separate groups of senior certificates and subordinate certificates that are cross-collateralized across all
groups:
» The Trust will issue guaranteed senior certificates and guaranteed interest only certificates (together, the "Guaranteed
Certificates") each backed primarily by one of the three loan groups:
» The Trust will also issue classes of non-guaranteed subordinate certificates (“Subordinate Certificates”), which will serve as
credit enhancement for the Guaranteed Certificates, and classes of non-guaranteed interest-only certificates (together with
the guaranteed interest-only certificates, the "IO Certificates")
Freddie Mac will guarantee the timely payment of principal (other than the IO Certificates) and the timely payment of interest on the
Guaranteed Certificates, including payment in full by the Stated Final Distribution Date
Specialized Loan Servicing LLC (“SLS”) is the current servicer of the Mortgage Loans and following the Closing Date will service the
Mortgage Loans in accordance with a pooling and servicing agreement. The Mortgage Loans were transferred to SLS no later than
January 2019
SCRT 2019-3 Overview
Group H Group M Group M55
Step-rate modified loans that
have not made a final payment
at their final rate
Fixed-rate and step-rate
modified loans which have
made at least one payment at
their final rate
Fixed-rate and step-rate
modified loans which have
made at least one payment at
their final rate
May or may not include forborne principal
May or may not include forborne principal
No forborne principal
No cap on note rate
Note rate < 5.50% with no
forbearance and
any note rate with forbearance
Note rate > 5.50%

© Freddie MacCONFIDENTIAL 13
(1) Note rates are weighted by interest bearing unpaid principal balance only
(2) Note rate multiplied by the ratio of the aggregate unpaid interest bearing balance over the aggregate unpaid principal balance
(3) Weighted average of the fixed-rate or maximum step-rate over the life of each Mortgage Loan
(4) Modification date excludes any deferred payment modification
(5) Updated LTVs estimated based on the most recent FHFA Home Price Index values available as of the Cut-Off Date
(6) Fixed-rate Loans include step-rate loans that have reached their final step rate and have made at least one payment at such rate
(7) Group M Loans include (i) loans with forbearance and any note rate and (ii) loans with no forbearance and a note rate less than or equal to 5.50%
(8) Group M55 Loans have a note rate greater than 5.50% and have no initial forbearance
Collateral Characteristics SCRT 19-2 vs SCRT 19-3
SCRT 2019-3 Pool Collateral SCRT 2019-2 Pool Collateral
Aggregate
Group H
(Step-rate
Loans)
Group M
(Fixed-rate
Loans)(6)(7)
Group M55
(Fixed-rate
Loans) (6)(8)
Aggregate
Group H
(Step-rate
Loans)
Group M
(Fixed-rate
Loans)(6)(7)
Group M55
(Fixed-rate
Loans) (6)(8)
Ge
ne
ral
As of Date 6/30/2019 6/30/2019 6/30/2019 6/30/2019 3/31/2019 3/31/2019 3/31/2019 3/31/2019
% Modified 100% 100% 100% 100% 100% 100% 100% 100%
Loan Count 13,018 559 10,412 2,047 12,406 891 10,158 1,357
Total UPB (incl. forborne UPB) in millions of USD $2,246 $110 $1,920 $216 $2,411 $185 $2,067 $158
Forborne UPB in millions of USD $236 $12 $224 $0 $302 $17 $285 $0
% UPB Forborne 11% 11% 12% 0% 13% 9% 14% 0%
% of Loans with a Forbearance UPB 41% 57% 45% 0% 54% 49% 58% 0%
Avg. Loan Size in thousands of USD $173 $196 $184 $106 $194 $208 $204 $117
No
te R
ate
Weighted Average Note Rate at Origination(1) 5.81% 6.11% 5.72% 6.34% 6.22% 6.26% 6.19% 6.43%
Weighted Average Current Note Rate(1) 4.46% 2.68% 4.33% 6.29% 4.34% 2.58% 4.33% 6.34%
Weighted Average Effective Note Rate(2) 3.99% 2.38% 3.82% 6.29% 3.80% 2.35% 3.73% 6.34%
Weighted Average Terminal Note Rate(1)(3) 4.53% 4.09% 4.33% 6.29% 4.45% 3.99% 4.33% 6.34%
Weighted Average Terminal Effective Note Rate(2)(3) 4.05% 3.63% 3.82% 6.29% 3.89% 3.63% 3.73% 6.34%
Te
rm / L
TV
/ C
red
it S
co
re Weighted Average Loan Age from Origination (mos) 141 161 137 173 147 153 145 169
Weighted Average Loan Age from Modification (mos)(4) 61 57 62 55 66 54 68 54
Weighted Average Remaining Maturity (mos) 384 364 386 376 394 366 396 401
Weighted Average LTV at Origination 81% 75% 82% 76% 79% 75% 80% 74%
Weighted Average Updated LTV (FHFA Indexed)(5) 62% 60% 64% 48% 68% 66% 69% 50%
Weighted Average AVM Current LTV 66% 64% 68% 50% 74% 72% 76% 53%
% of Loans with AVM Current LTV >105% 4% 5% 4% 1% 9% 10% 9% 1%
Non-Zero Weighted Average Credit Score at Origination 694 696 696 676 689 692 690 671
Non-Zero Weighted Average Current Credit Score 674 673 676 651 675 671 677 649
Pa
y H
isto
ry /
Mo
dif
ica
tio
ns
Average Number of Months Clean Pay History 42 42 43 31 43 36 45 27
% of Loans with 12+ Months Clean Pay History 100% 100% 100% 100% 100% 100% 100% 100%
% of Loans with 24+ Months Clean Pay History 52% 69% 53% 39% 62% 65% 63% 48%
% of Loans with 36+ Months Clean Pay History 39% 57% 40% 25% 41% 40% 43% 16%
% of Loans modified within 24 Months 28% 2% 28% 37% 13% 3% 13% 18%
% of Loans modified between 25 to 36 Months 9% 9% 9% 10% 12% 14% 11% 22%

© Freddie MacCONFIDENTIAL 14
Indicative SCRT 2019-3 Transaction Structure
Note: The Trust will also issue Residual Certificates and a Class of Mortgage Insurance Certificate (the “Class MI Certificate”) that will receive certain proceeds from mortgage
insurance policies, which Certificate will be retained by Freddie Mac. However, the Class MI Certificate will not represent interests in any REMIC. The Class MI Certificate is not
offered hereby.
Freddie Mac provides certain representations and warranties on the Mortgage Loans
Securitization
Trust
Mortgage
Loans
An election will be
made to treat the pool
of Mortgage Loans as
a REMIC
Mortgage
Loans
transferred
Servicer
The Servicer will service the Mortgage Loans according to the Pooling and Servicing Agreement
Class
MA, MV
and MZ
Certificates*
Class
HA, HV
and HZ
Certificates*
Trust issues classes of Non-Guaranteed Certificates
Trust issues classes of Guaranteed Certificates
Class B Certificates*
Class M Certificates
Class A-IO Certificates*
Class B-IO Certificates*
Class XS-IO Certificates*
Class M55D
Certificates*
*Exchangeable Certificates are illustrated here;
MACR Certificates will also be issued

© Freddie MacCONFIDENTIAL 15
Preliminary SCRT 2019-3 Capital Structure
(1) Only Guaranteed Pass-Through Certificates are included in the Guaranteed Class
Section
(2)
(3) Class Coupons described in more detail in the term sheet and offering materials
(4) MACR Certificates
Transaction Structure(1)
Loan
GroupClass
Maximum Initial Class
Principal or
Initial Class
Notional Amount
Approximate
Initial Class
Coupon
Initial Credit
Enhancement
WAL
(years)(2)
Stated Final
Distribution
Date
Principal
Window
(months)(2)
Expected Ratings
DBRS / Fitch
H HT(4) $99,746,000 3.000% 9.00% 7.41 October 2058 1 – 289 Guaranteed
M MT(4) $1,747,024,000 3.500% 9.00% 7.74 October 2058 1 – 299 Guaranteed
M55 M55D $196,876,000 4.000% 9.00% 4.42 October 2058 1 - 206 Guaranteed
Mezzanine M $72,988,000 4.750%(3) 5.75% 8.58 October 2058 77 – 135 [B(low)(sf) / B-(sf)]
Sub PO B $129,131,518 0.000%(5) 0.00% 22.95 October 2058 135 – 469 NR / NR
Excess Servicing IO XS-IO $2,245,765,518 0.065%(3) N/A 8.34 October 2058 N/A NR / NR
Senior IO A-IO $2,043,646,000 0.201%(3) N/A 7.41 October 2058 N/A NR / NR
Sub IO B-IO $202,119,518 2.010%(3) N/A 17.76 October 2058 N/A NR / NR
Sub + IO BBIO(4)(7) $129,131,518 3.146%(3) 0.00% 22.95 October 2058 135 – 469 NR / NR
Sub + IO BX(4)(6) $129,131,518 6.333%(3) 0.00% 22.95 October 2058 135 – 469 NR / NR
Sub + IO + Ex. Serv. BXS(4)(8) $129,131,518 7.464%(3) 0.00% 22.95 October 2058 135 – 469 NR / NR
Total $2,245,765,518
Pricing Assumptions CPR CDR Severity
Group H Ramp from 5% to
8% CPR over 24
months
Ramp from 0%
to 1% over 36
months
25%Group M
Group M55 15% CPR
(5) The Class B Certificates are principal only certificates
(6) The Class BX Certificates are a combination of the Class B, Class A-IO and Class B-IO
Certificates
(7) The Class BBIO Certificates are a combination of the Class B and Class B-IO Certificates
(8) The Class BXS Certificates are a combination of the Class B, Class A-IO, Class B-IO and
Class XS-IO Certificates
Note: On the Closing Date, investors will pay 43 days of Accrued Interest, calculated on the issuance Unpaid Principal Balance and
the initial Class Coupon for the related security purchased

© Freddie MacCONFIDENTIAL 16
Preliminary Guaranteed Senior Offerings
(1)
(2) MACR Certificates
Loan
GroupClass
Maximum Initial
Class Principal or
Initial Class
Notional Amount
Approximate
Initial Class
Coupon
Initial Credit
Enhancement
WAL
(years)(1)
Stated Final
Distribution
Date
Principal
Window
(months)(1)Class Type
H HT(2) $99,746,000 3.000% 9.00% 7.41 October 2058 1 – 289 Pass-through
H HA $74,810,000 3.000% 9.00% 4.54 October 2058 1 – 135 Sequential
H HB(2) $24,936,000 3.000% 9.00% 16.00 October 2058 135 – 289 Sequential
H HV $12,468,000 3.000% 9.00% 9.66 October 2058 1 – 158 Sequential
H HZ $12,468,000 3.000% 9.00% 17.36 October 2058 158 – 289 Sequential
M MT(2) $1,747,024,000 3.500% 9.00% 7.74 October 2058 1 – 299 Pass-through
M MA $1,310,268,000 3.500% 9.00% 4.76 October 2058 1 – 141 Sequential
M MA1(2) $1,310,268,000 3.000% 9.00% 4.76 October 2058 1 – 141 Sequential, Strip Down
M MA2(2) $1,310,268,000 3.250% 9.00% 4.76 October 2058 1 – 141 Sequential, Strip Down
M MA-IO(2) $187,181,142 3.500% N/A 4.76 October 2058 N/A Interest Only
M MB(2) $436,756,000 3.500% 9.00% 16.68 October 2058 141 – 299 Sequential
M MV $218,378,000 3.500% 9.00% 9.30 October 2058 1 – 159 Sequential
M MZ $218,378,000 3.500% 9.00% 17.79 October 2058 159 – 299 Sequential
M55 M55D $196,876,000 4.000% 9.00% 4.42 October 2058 1 – 206 Pass-through
M55 M55E(2) $196,876,000 3.500% 9.00% 4.42 October 2058 1 – 206 Pass-through, Strip Down
M55 M55G(2) $196,876,000 3.000% 9.00% 4.42 October 2058 1 – 206 Pass-through, Strip Down
M55 M55I(2) $35,795,636 5.500% N/A 4.42 October 2058 N/A Interest Only
Total $2,043,646,000
Pricing Assumptions CPR CDR Severity
Group H Ramp from 5% to
8% CPR over 24
months
Ramp from 0%
to 1% over 36
months
25%Group M
Group M55 15% CPR
Note: On the Closing Date, investors will pay 43 days of Accrued Interest, calculated on the issuance Unpaid Principal
Balance and the initial Class Coupon for the related security purchased

© Freddie MacCONFIDENTIAL 17
SCRT 2019-3 Guaranteed Certificates
Note: All percentages are approximate
(1) MACR Certificates
(2) Exchangeable Certificates
(3) Accretion Directed (“AD”) Certificates
HT(1)
3.00%
Pass-Through
HB(1)
3.00%
Back-Pay (25%)
HA(2)
3.00%
Front-Pay (75%)
HZ(2)
3.00%
Accrual (50%)
HV(2)(3)
3.00%
AD (50%)
MT(1)
3.50%
Pass-Through
MB(1)
3.50%
Back-Pay (25%)
MA(2)
3.50%
Front-Pay (75%)
MZ(2)
3.50%
Accrual (50%)
MV(2)(3)
3.50%
AD (50%)
Group H Certificates Group M Certificates
© Freddie MacCONFIDENTIAL 18
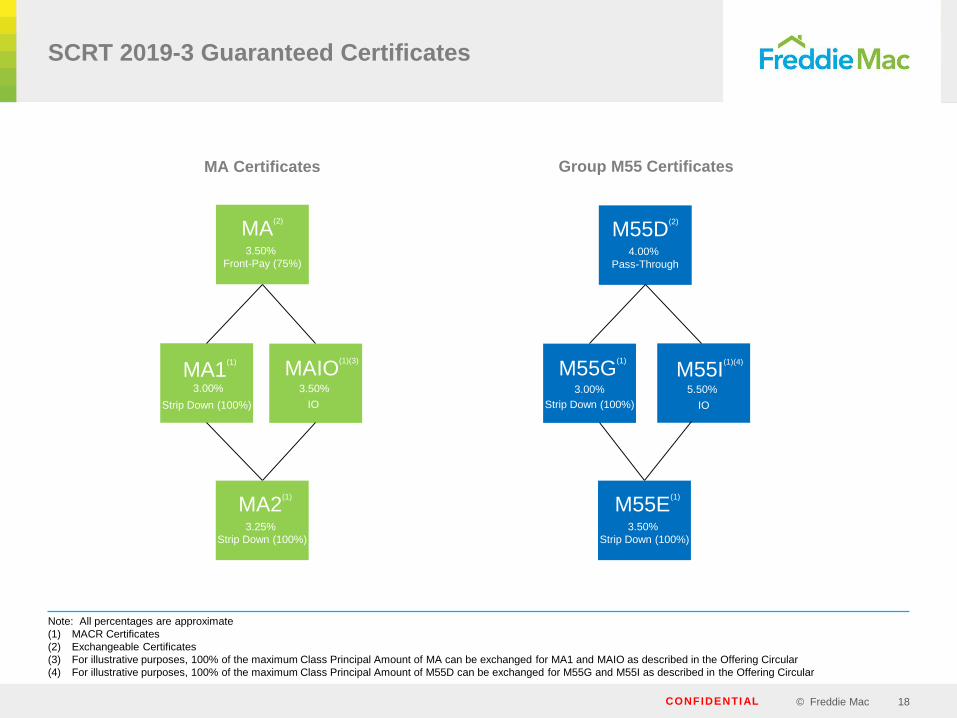
SCRT 2019-3 Guaranteed Certificates
Note: All percentages are approximate
(1) MACR Certificates
(2) Exchangeable Certificates
(3) For illustrative purposes, 100% of the maximum Class Principal Amount of MA can be exchanged for MA1 and MAIO as described in the Offering Circular
(4) For illustrative purposes, 100% of the maximum Class Principal Amount of M55D can be exchanged for M55G and M55I as described in the Offering Circular
MA(2)
3.50%
Front-Pay (75%)
MA1(1)
3.00%
Strip Down (100%)
MAIO(1)(3)
3.50%
MA Certificates
MA2(1)
3.25%
Strip Down (100%)
M55D(2)
4.00%
Pass-Through
M55G(1)
3.00%
Strip Down (100%)
M55I(1)(4)
5.50%
IO
Group M55 Certificates
M55E(1)
3.50%
Strip Down (100%)
IO

© Freddie MacCONFIDENTIAL 19
BBIO(1)
3.146%(3)
SCRT 2019-3 Non-Guaranteed Certificates
Note: All percentages are approximate
(1) MACR Certificates
(2) Exchangeable Certificates
(3) Approximate initial class coupon for the first distribution date
(4) Only the Class BXS will be offered
BXS(1)(4)
7.464%(3)
BX(1)
6.333%(3)
XS-IO(2)
0.065%(3)
Excess Servicing
B-IO(1)
2.010%(3)
B(2)
0.000%
PO
A-IO(2)
0.201%(3)
BXS Certificates

© Freddie MacCONFIDENTIAL 20
Item Description SCRT 18-1 SCRT 18-2 SCRT 18-3 SCRT 18-4 SCRT 19-1 SCRT 19-2 SCRT 19-3
Initial Credit
Enhancement
Initial Subordination Percentage 10.00% 8.00% 7.75% 7.75% 9.25% 10.25% 9.00%
Class M subordination percentage 6.00% 4.75% 4.50% 4.50% 5.50% 6.25% 5.75%
Trigger DescriptionImpact of
trigger fail
Minimum Credit
Enhancement
Test
The Subordination Percentage is
greater than or equal to the stated
amount; and
Principal pays
sequential17.50% 15.00% 15.00% 15.00% 16.50% 18.00% 16.50%
If the sum of the Class M and
Class B Certificates exceeds the
stated amount
Principal pays
sequential3.00% of the Cut-Off Date UPB
4.00% of the
Cut-Off Date UPB
Aged
Securitization
Test
The stated classes are
outstanding; and
Principal pays
sequentialClass M
The Distribution Date is less than
or equal to the stated number of
months from the closing date
Principal pays
sequential180 Months
Delinquency
Test
The Distressed Principal Balance is
less than the stated percentage
times the excess of the
outstanding aggregate Class
Principal Amount of the
Subordinate Certificates over the
aggregate Realized Losses or the
Non-Current Mortgage Loan
Percentage is less than the stated
percentage of the current Credit
Enhancement (“CE”)
Principal pays
sequential50%
Cumulative
Loss Test
A test that will be satisfied if the
cumulative Realized Losses, as a
percentage of the aggregate
Unpaid Principal Balance of the
Mortgage Loans as of the Cut-Off
Date, does not exceed the
percentage indicated.
Principal pays
sequential
Clean-Up Call
Deal called according to provisions
of the Pooling and Servicing
Agreement
n/a 10%
SCRT Deal Triggers and Initial Credit Enhancement
Distribution Date occurring in the period Percentage
Months 1 to 24 1.20%
Months 25 to 36 1.80%
Months 37 to 48 2.40%
Months 49 to 60 3.00%
Months 61 to 72 3.60%
Months 73 to 84 4.20%
Months 85 to 96 4.80%
Months 97 to 108 5.40%
Months 109 + 6.00%

© Freddie MacCONFIDENTIAL 21
Collateral Characteristics-Program History
SCRT Pool Comparison
2017-1 2017-2 2017-3 2017-4 2018-1 2018-2 2018-3 2018-4 2019-1 2019-2 2019-3
Ge
ne
ral
As of Date 3/31/2017 6/30/2017 8/31/2017 10/31/2017 1/31/2018 4/30/2018 6/30/2018 9/30/2018 1/31/2019 3/31/2019 6/30/2019
% Modified 100% 100% 100% 100% 100% 100% 100% 100% 100% 100% 100%
Loan Count 4,361 9,939 7,176 9,977 10,983 8,628 11,716 9,782 12,185 12,406 13,018
Total UPB (incl. forborne UPB) in millions of USD $1,115 $2,475 $1,707 $1,852 $1,832 $1,592 $2,324 $1,952 $2,097 $2,411 $2,246
Forborne UPB in millions of USD $249 $488 $375 $76 $192 $170 $296 $258 $256 $302 $236
% UPB Forborne 22% 20% 22% 4% 11% 11% 13% 13% 12% 13% 11%
% of Loans with a Forbearance UPB 93% 91% 93% 14% 46% 45% 55% 57% 49% 54% 41%
Avg. Loan Size in thousands of USD $256 $249 $238 $186 $167 $185 $198 $200 $172 $194 $173
No
te R
ate
Weighted Average Note Rate at Origination(1) 6.43% 6.43% 6.36% 6.32% 6.15% 6.00% 6.12% 6.24% 6.13% 6.22% 5.81%
Weighted Average Current Note Rate(1) 3.69% 3.52% 4.10% 4.04% 4.29% 4.15% 4.10% 4.17% 4.40% 4.34% 4.46%
Weighted Average Effective Note Rate(2) 2.87% 2.83% 3.20% 3.87% 3.84% 3.71% 3.58% 3.62% 3.86% 3.80% 3.99%
Weighted Average Terminal Note Rate (1)(3) 4.51% 4.28% 4.46% 4.47% 4.58% 4.50% 4.39% 4.39% 4.50% 4.45% 4.53%
Weighted Average Terminal Effective Note Rate(2)(3) 3.51% 3.44% 3.48% 4.28% 4.10% 4.02% 3.83% 3.81% 3.96% 3.89% 4.05%
Te
rm / L
TV
/ C
red
it S
co
re Weighted Average Loan Age from Origination (mos) 121 125 126 130 137 139 137 143 150 147 141
Weighted Average Loan Age from Modification (mos)(4) 67 58 65 62 60 64 66 71 70 66 61
Weighted Average Remaining Maturity (mos) 408 415 411 349 389 378 379 377 385 394 384
Weighted Average LTV at Origination 77% 80% 81% 78% 81% 80% 78% 78% 79% 79% 81%
Weighted Average Updated LTV (FHFA Indexed)(5) 81% 87% 82% 69% 70% 67% 67% 66% 64% 68% 62%
Weighted Average AVM Current LTV 88% 92% 89% 72% 75% 69% 69% 71% 71% 74% 66%
% of Loans with AVM Current LTV >105% 17% 24% 21% 4% 11% 6% 7% 8% 7% 9% 4%
Non-Zero Weighted Average Credit Score at Origination 702 698 697 691 694 695 698 695 686 689 694
Non-Zero Weighted Average Current Credit Score 691 681 688 675 673 677 689 691 672 675 674
Pa
y H
isto
ry /
Mo
dif
ica
tio
ns
Average Number of Months Clean Pay History 58 51 56 51 49 51 56 58 47 43 42
% of Loans with 12+ Months Clean Pay History 100% 100% 100% 100% 100% 100% 100% 100% 100% 100% 100%
% of Loans with 24+ Months Clean Pay History 92% 86% 92% 87% 73% 83% 87% 88% 63% 62% 52%
% of Loans with 36+ Months Clean Pay History 77% 73% 80% 63% 60% 66% 75% 75% 49% 41% 39%
% of Loans modified within 24 Months 4% 7% 1% 8% 18% 10% 4% 5% 9% 13% 28%
% of Loans modified between 25 to 36 Months 6% 8% 3% 10% 7% 9% 7% 6% 11% 12% 9%
Servicer SPS Nationstar Nationstar Nationstar SLS SLS SPS SPS SLS SPS SLS
(1) Note rates are weighted by interest bearing unpaid principal balance only
(2) Calculated as the note rate multiplied by the ratio of the aggregate unpaid interest bearing balance over the aggregate unpaid principal balance
(3) Calculated as the weighted average of the fixed-rate or maximum step-rate over the life of each Mortgage Loan
(4) Modification date is based on the later of deferred payment modification and non-deferred payment modification for deals up to and including SCRT 2018-4. Beginning with SCRT 2019-1, modification date excludes any
deferred payment modifications
(5) The updated LTVs were estimated based on the most recent FHFA Home Price Index values available as of the Cut-Off Date

© Freddie MacCONFIDENTIAL 22
4. Historical Deal Performance and Model Data

© Freddie MacCONFIDENTIAL 23
SCRT 2019-3 Projected VPR Performance by Group
Note: SCRT Pricing Speed, Bloomberg and Yield Book Model VPRs begin in month 1 of the transaction
(1) Excludes scheduled cashflow from HAMP incentive payments.
Yield Book Model Bloomberg Model SCRT Pricing Speed
Pricing Assumptions CPR CDR Severity
Group H Ramp from 5% to
8% CPR over 24
months
Ramp from 0%
to 1% over 36
months
25%Group M
Group M55 15% CPR
Group H(1) Group M
Group M55
0
5
10
15
Rate
%
0
5
10
15
Rate
%
0
5
10
15
20
25
Rate
%

© Freddie MacCONFIDENTIAL 24
SCRT Historical Performance by Group
Source: Bloomberg
(1) 1 Month VPR is weighted by the aggregate unpaid principal balance of the mortgage loans as of the prior month
(2) Group M > SCRT 2017-3 1 Month VPR includes Group M45 1 Month VPR
(3) Group M55 1 Month VPR includes Group M60 1 Month VPR
Apr-17 May-17 Jun-17 Jul-17 Aug-17 Sep-17 Oct-17 Nov-17 Dec-17 Jan-18 Feb-18 Mar-18 Apr-18 May-18 Jun-18 Jul-18 Aug-18 Sep-18 Oct-18 Nov-18 Dec-18 Jan-19 Feb-19 Mar-19 Apr-19 May-19 Jun-19
Group H </= SCRT 2017-3 4.4 4.3 6.9 5.5 4.0 4.7 5.7 6.4 4.1 4.3 2.9 3.8 4.1 4.3 4.5 4.5 4.8 3.3 3.6 3.7 2.3 2.9 2.0 3.3 4.3 4.2 4.6
Group H > SCRT 2017-3 10.3 9.3 10.7 3.5 7.0 5.0 7.0 6.8 5.2 7.1 5.7 5.0 5.0 4.4 4.4 4.6 4.9 5.3 6.5
Group M </= SCRT 2017-3 4.5 2.6 4.0 4.2 2.4 4.6 3.6 5.4 3.8 4.4 2.2 1.7 3.5 3.9 3.0 5.5 4.5 2.2 3.1 2.2 2.8 3.9 2.5 2.5 3.4 4.4 3.9
Group M > SCRT 2017-3(2) 14.7 11.8 10.7 8.1 7.2 7.5 8.9 8.8 9.8 7.9 6.6 6.7 5.6 5.1 4.9 4.2 5.5 6.4 5.8
Group M55(3) 11.5 20.5 16.5 16.5 11.3 11.1 15.5 12.1 11.3 14.1 13.5 10.6 10.1 10.5 12.5 11.0 9.9 10.4 10.7
0.00
5.00
10.00
15.00
20.00
25.00
Rate
%
Group H </= SCRT 2017-3 Group H > SCRT 2017-3 Group M </= SCRT 2017-3 Group M > SCRT 2017-3(2) Group M55(3)
1 Month VPR

© Freddie MacCONFIDENTIAL 25
SCRT Historical Performance
Source: Bloomberg
1 Month VPR
1 Month VPR
0.00
2.00
4.00
6.00
8.00
10.00
12.00
14.00
Rate
%
SCRT 2016-1 SCRT 2017-1 SCRT 2017-2 SCRT 2017-3
0.00
2.00
4.00
6.00
8.00
10.00
12.00
14.00
Rate
%
SCRT 2017-4 SCRT 2018-1 SCRT 2018-2 SCRT 2018-3 SCRT 2018-4 SCRT 2019-1 SCRT 2019-2
© Freddie MacCONFIDENTIAL 26
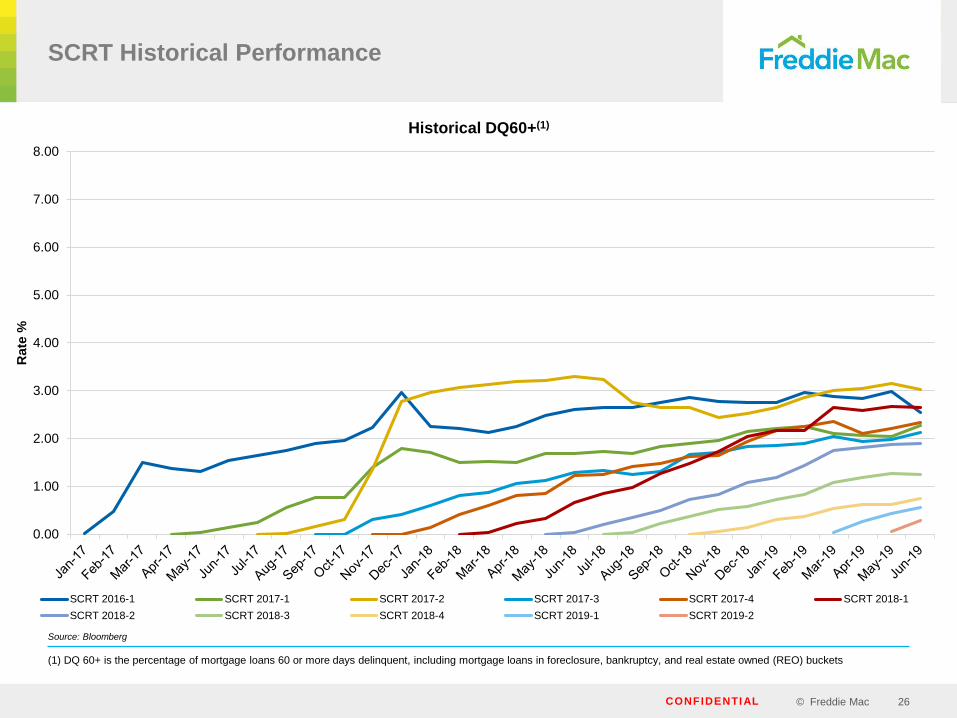
SCRT Historical Performance
Source: Bloomberg
Historical DQ60+(1)
0.00
1.00
2.00
3.00
4.00
5.00
6.00
7.00
8.00
Rate
%
SCRT 2016-1 SCRT 2017-1 SCRT 2017-2 SCRT 2017-3 SCRT 2017-4 SCRT 2018-1
SCRT 2018-2 SCRT 2018-3 SCRT 2018-4 SCRT 2019-1 SCRT 2019-2
(1) DQ 60+ is the percentage of mortgage loans 60 or more days delinquent, including mortgage loans in foreclosure, bankruptcy, and real estate owned (REO) buckets

© Freddie MacCONFIDENTIAL 27
SCRT Forbearance Recovery(1)
IB UPB
= 86%
FB UPB
= 14%
Recovery
of IB UPB
= 83%
Severity
on IB UPB
= 17% Total
Average
Severity
= 31%
All SCRT Issued
(LTV(6) = 77)
IB UPB
= 78%
FB UPB
= 22%
SCRT Liquidated Loans
(LTV(6) = 109)
Severity
on FB UPB
= 78%
(1) Based on issuance data and post-issuance remittance data available up to June 2019 Distribution
(2) Includes Principal Forbearance Loss
(3) Includes Subsequent Gains/Losses
(4) Assumes recovery proceeds are applied to interest bearing UPB then applied to forbearance UPB
(5) Total Forbearance Recovery = (e + k + r - q) / (d + j + q + r)
(6) Weighted average AVM LTV at issuance
SCRT Issuance
a Total UPB 20,291,180,155
b Forbearance UPB 2,856,895,322
c % UPB Forborne 14%
Prepaid in Full
d Forbearance UPB(2) 106,336,471
e Forbearance Collected 106,336,471
f Forbearance Recovery 100%
Liquidated
g Interest Bearing UPB 13,841,794
h Interest Bearing Collected(3)(4) 11,436,999
i Severity on Interest Bearing UPB(4) 17%
j Forbearance UPB 3,994,128
k Forbearance Collected(3)(4) 886,365
l Severity on Forbearance UPB(4) 78%
m Total UPB 17,835,921
n Severity on Total UPB 31%
Modified Post-Closing
o Forbearance UPB at Issuance 19,664,392
p Post-Closing Additional Forbearance 3,247,709
q Forbearance Forgiven 550,083
r Forbearance moved to Interest Bearing 2,375,712
s Post-Mod Forbearance UPB 19,986,307
Total
t Forbearance Recovery(5) 96%

© Freddie MacCONFIDENTIAL 28
5. Program Support

© Freddie MacCONFIDENTIAL 29
Financing
» Freddie Mac can offer repo financing for SCRT pass-through and front and back pay sequential tranches to approved counterparties
» Contact: Carmino Santomaro at 571-382-5701
» Bank of New York recently has re-classified SCRT Guaranteed Certificates as “Agency MBS” now making them eligible for financing
under the BNY Mellon MBS Tri-party Repo
» SCRT Guaranteed Securities are acceptable collateral to pledge to the FHLB – Chicago, Pittsburgh and New York
Models & Data Vendors
» Bloomberg:
» Natively supports pricing speed: 100 PPS: through the API and BDP
“SCRT 19-3 HA <mtge> YT NEW 90/I/100PPS <go>”
» Model projections: BTM will call a version of the Bloomberg Transition Model fit to similar collateral
To bring up model projections directly (as advised by Bloomberg):
For the collateral, enter “SCRT 19-3 M [H] [M55] <mtge> BCMV <go>”
» Yield Book
» Prepay Model: Model V21.4 fits for voluntary prepayment speeds to production
Model V99 uses the same prepayment model and adds a non-agency CRT roll rate model for credit
» Analytics: Agency OAS is available through the GUI and YB add-in
» Loan-Level Data (Post-Issuance)
» US Bank Trust Gateway: Provides monthly loan-level remittance data
» https://pivot.usbank.com/
» CoreLogic: Redistributes loan-level remittance data
» 1010data: Redistributes loan-level remittance data in the form of an aggregated dataset (stacked for each deal and month)
» https://www.1010data.com/industries/financial-services/fixed-income/
» SCRT/SLST dataset path: pub.fin.risk_share.fhlmc_rpl.monthly
» f
SCRT Program Support

© Freddie MacCONFIDENTIAL 30
As Guarantor we may:
Oversee and audit the servicing of the Mortgage
Loans
Monitor remittance data and request additional
documentation to evaluate servicer compliance,
as needed
Enforce corrective servicing action and servicing
remedies as necessary
Freddie Mac has engaged Wilmington Trust as the Trust
Agent on all SCRT Transactions to date. Wilmington Trust
will engage an independent reviewer to review and
enforce representations and warranties on any Mortgage
Loan for which a breach review trigger has occurred.
A breach review trigger occurs on any mortgage
loan if, during the warranty period the mortgage
loan is liquidated or modified
The warranty period ends August 12, 2022
SCRT Credit Features
Category Minimum Sample Size
Regulatory Compliance 10%
Pay History* 10%
Tax and Title Review 100%
Modification Data 100%
BPO Review 20%
Credit Ratings Upgrades
Third Party Due Diligence
*Minimum of 24 months Pay History reviewed
Transaction ClassRating
AgencyInitial Rating New Rating Effective Date
2018-3 M Fitch B- (sf) B (sf)
5/21/20192017-4 M Fitch B- (sf) B (sf)
2017-3
M-2 Fitch B- (sf) B (sf)
M-2 DBRS B (sf) B high (sf)
4/10/2019
M-1 DBRS BB high (sf) BBB low (sf)
2017-2M-2 DBRS B low (sf) B (sf)
M-1 DBRS BB (sf) BB high (sf)
2017-1
M-2 DBRS B (sf) B high (sf)
M-1 DBRS BB high (sf) BBB low (sf)
M-1 Moody's Ba3 (sf) Ba1 (sf) 1/30/2019
2016-1M-2 DBRS B low (sf) B high (sf) 4/10/2019
M-1 DBRS BBB low (sf) BBB (sf) 9/24/2018

© Freddie MacCONFIDENTIAL 31
Third Party Servicer
Servicer can’t acquire lender placed insurance from affiliate
If Servicer obtains property valuation, preservation or disposition
services from affiliate, the Servicer may not receive incentive based
compensation and the costs of services must be reasonable and market
Cap on Advances
Any advance amount exceeding a cap will require advance notice to the
Guarantor and the Trustee and non-objection from the Guarantor in
order to be reimbursable
Valuation Requirements
Servicer must comply with the valuation waterfall below when
determining the valuation to be used in evaluating loss mitigation
alternatives
» Step 1: Obtain BPO and Home Value Explorer® (“HVE®”)
valuations
» Step 2: If the BPO value is within +/- 15% of the HVE® value,
then the Servicer must use the BPO valuation
» Step 3: If an HVE® value is not available or the BPO value is
outside +/- 15% of the HVE® value, then the Servicer must obtain
a second BPO value from a non-affiliated broker
» Step 4: If the Servicer is required to order a second BPO
valuation, the Servicer must use the higher of the two BPO
valuations
Modification and Loss Mitigation
Eligibility
To be eligible, borrower must be 60+ days delinquent or have
provided sufficient information on loss mitigation application and
Servicer determines that the borrower is at risk of imminent default
Limits
Any modification would need to meet following criteria:
» No more than 1 modification every 12 months, and
no more than 2 total after the Closing Date
» No principal forgiveness for any loan where resulting
post-mod MTMLTV(1) (using interest bearing balance)
is less than 105%
» No principal forbearance for any loan where resulting
post-mod MTMLTV(1) (using interest bearing balance)
is less than 80%
No short payoff (including forbearance amounts) unless eligibility
criteria above is met and the Servicer determines such action to be
in the best interest of certificateholders
Servicer may not solicit performing borrowers for loss mitigation
Servicing Loss Mitigation Framework
(1) MTMLTV is the mark to market loan-to-value ratio based on the interest bearing unpaid principal balance of the related loan and the current market value of the related mortgaged property as described in
the Valuation Requirements section.

© Freddie MacCONFIDENTIAL 32
6. SCRT Transactions Re-cap

© Freddie MacCONFIDENTIAL 33
SCRT Transaction Issuance History
SCRT 2019-1 Syndicated Classes (Pricing Date: 3/7/2019)
ClassInitial Class
Principal Amount
Approximate
Initial Class Coupon
Initial Credit
Enhancement
WAL(1)
(years)Spread or Proceeds(1) Ratings
DBRS/Fitch
HT $95,000,000 3.000% 9.25% 7.50 1-14 back of FG 3.0 Guaranteed
HA $44,387,000 3.000% 9.25% 4.56 83 / I Guaranteed
HB $14,795,000 3.000% 9.25% 16.32 105 / I Guaranteed
MT $385,000,000 3.500% 9.25% 7.86 1-04 back of FG 3.5 Guaranteed
MA $904,336,000 3.500% 9.25% 4.80 90 / I Guaranteed
MB $61,094,000 3.500% 9.25% 17.04 105 / I Guaranteed
MV $120,175,000 3.500% 9.25% 9.39 95 / I Guaranteed
MZ $120,175,000 3.500% 9.25% 18.15 115 / I Guaranteed
M55D $157,879,000 4.000% 9.25% 4.44 90 / I Guaranteed
M $78,630,000 4.750% 5.50% 8.76 350 / N B (low) (sf) / B-sf
BXS $115,323,000 5.573% 0.00% 22.87 $41mm NR / NR
Total $2,096,794,000
Note: Totals include only bonds sold at issuance; excludes any Freddie Mac retention
(1) sd Pricing Assumptions CPR CDR Severity
Group H Ramp from 5% to 8%
CPR over 24 months
Ramp from 0% to
1% over 36
months
25%Group M
Group M55 15% CPR
SCRT 2019-2 Syndicated Classes (Pricing Date: 5/8/2019)
ClassInitial Class
Principal Amount
Approximate
Initial Class Coupon
Initial Credit
Enhancement
WAL(1)
(years)Spread or Proceeds(1) Ratings
DBRS/Fitch
HT $43,254,000 3.000% 10.25% 7.30 1-13 back of FG 3.0 Guaranteed
HA $92,249,000 3.000% 10.25% 4.47 85 / I Guaranteed
HB $10,250,000 3.000% 10.25% 15.81 105 / I Guaranteed
HV $10,250,000 3.000% 10.25% 9.62 95 / I Guaranteed
HZ $10,250,000 3.000% 10.25% 17.14 115 / I Guaranteed
MT $327,361,000 3.500% 10.25% 7.83 0-16 back of FG 3.5 Guaranteed
MA $1,146,000,000 3.500% 10.25% 4.82 85 / I Guaranteed
MB $191,000,000 3.500% 10.25% 16.88 105 / I Guaranteed
MV $95,499,000 3.500% 10.25% 9.40 90 / I Guaranteed
MZ $95,499,000 3.500% 10.25% 17.94 117 / I Guaranteed
M55D $142,064,000 4.000% 10.25% 4.46 0-16 up from FG 4.0 Guaranteed
M $96,431,000 4.750% 6.25% 8.56 330 / I B(low)(sf) / B-sf
BXS $150,674,000 4.497% 0.00% 23.28 $50mm NR / NR
Total $2,400,000,000

© Freddie MacCONFIDENTIAL 34
SCRT Transaction Issuance History
SCRT 2018-3 Syndicated Classes (Pricing Date: 8/9/2018)
ClassInitial Class
Principal Amount
Approximate
Initial Class Coupon
Initial Credit
Enhancement
WAL(1)
(years)Spread or Proceeds(1) Ratings
DBRS/Fitch
HT $42,525,000 3.000% 7.75% 7.77 1-10 back of FG 3.0 Guaranteed
HA $448,816,000 3.000% 7.75% 4.67 85 / I Guaranteed
HZ $74,802,500 3.000% 7.75% 18.59 103 / I Guaranteed
MT $25,000,000 3.500% 7.75% 7.98 1-02 back of FG 3.5 Guaranteed
MA $1,041,281,000 3.500% 7.75% 4.81 80 / I Guaranteed
MB $40,000,000 3.500% 7.75% 17.48 100 / I Guaranteed
MZ $153,546,000 3.500% 7.75% 18.68 110 / I Guaranteed
M55D $89,364,000 4.000% 7.75% 4.57 80 / I Guaranteed
M $75,523,000 4.750% 4.50% 10.16 225 / N B (low) (sf) / B-sf
BX $104,569,000 2.275% 0.00% 22.15 $34mm NR / NR
Total $2,095,426,500
Note: Totals include only bonds sold at issuance; excludes any Freddie Mac retention
(1) s Pricing Assumptions CPR CDR Severity
Group H Ramp from 5% to 8%
CPR over 24 months
Ramp from 0% to
1% over 36
months
25%Group M
Group M55 15% CPR
SCRT 2018-4 Syndicated Classes (Pricing Date: 11/8/2018)
ClassInitial Class
Principal Amount
Approximate
Initial Class Coupon
Initial Credit
Enhancement
WAL(1)
(years)Spread or Proceeds(1) Ratings
DBRS/Fitch
HT $47,560,000 3.000% 7.75% 7.81 1-12 back of FG 3.0 Guaranteed
HA $242,400,000 3.000% 7.75% 4.69 95 / I Guaranteed
HB $30,000,000 3.000% 7.75% 17.18 110 / I Guaranteed
HV $25,400,000 3.000% 7.75% 9.91 95 / I Guaranteed
HZ $25,400,000 3.000% 7.75% 18.67 115 / I Guaranteed
MT $114,588,000 3.500% 7.75% 7.98 1-04 back of FG 3.5 Guaranteed
MA $931,127,000 3.500% 7.75% 4.81 95 / I Guaranteed
MB $136,775,000 3.500% 7.75% 17.48 110 / I Guaranteed
MV $86,800,000 3.500% 7.75% 9.40 95 / I Guaranteed
MZ $86,800,000 3.500% 7.75% 18.68 115 / I Guaranteed
M55D $73,907,000 4.000% 7.75% 4.16 90 / I Guaranteed
M $63,442,000 4.750% 4.50% 10.17 260 / N B (low) (sf) / B-sf
BXS $87,842,000 4.017% 0.00% 22.09 $27.5mm NR / NR
Total $1,952,041,000

© Freddie MacCONFIDENTIAL 35
100 PPS BTM YB
Deal Spread Investors New Unique Tranche Format MV (mm) $ PX* Investors New Unique
16-1 475 7 7 7 B+BIO Auction 11.0 11.8 19.2 1 1 1 4.6 2.6 3.3
17-1 475 3 1 8 B+BIO Dealer 12.0 10.8 21.4 1 1 2 4.1 2.9 2.1
17-2 385 8 3 11 B+BIO Syndicated 50.0 20.2 11.4 4 3 5 4.1 3.4 3.3
17-3 310 12 5 16 B+BIO Syndicated 40.0 23.4 9.5 5 3 8 4.1 2.8 2.9
17-4 260 10 1 17 B+BIO Syndicated 37.0 40.0 8.7 4 0 8 1.4 1.8 0.7
18-1 210 8 0 17 BX Syndicated 60.0 54.6 7.4 6 1 9 1.7 2.2 1.2
18-2 225 5 0 17 BX Syndicated 37.0 48.9 7.5 4 0 9 1.8 3.0 1.0
18-3 225 5 0 17 BX Syndicated 34.0 32.5 8.8 4 0 9 1.8 2.2 0.9
18-4 260 4 2 19 BXS Syndicated 27.5 31.3 9.7 2 0 9 1.8 2.2 1.6
19-1 350 9 1 20 BXS Syndicated 41.0 35.6 10.7 1 0 9 1.8 2.4 1.7
19-2 330 11 2 22 BXS Syndicated 50.0 33.2 10.8 4 2 11 1.8 2.9 2.5
Yield Cumu. Net Loss Rate (CNLR)
Second Loss First Loss Collateral
475 475
385
310260
210 225 225260
350 330
0
100
200
300
400
500
0
2
4
6
8
10
12
14
16-1 17-1 17-2 17-3 17-4 18-1 18-2 18-3 18-4 19-1 19-2
Spre
ad in
Bas
is P
oint
s
Co
un
t
Second Loss
Investors New Spread (RHS)
19.221.4
11.49.5 8.7
7.4 7.58.8 9.7 10.7 10.8
0
3
6
9
12
15
18
21
24
0
1
2
3
4
5
6
7
8
16-1 17-1 17-2 17-3 17-4 18-1 18-2 18-3 18-4 19-1 19-2
Bon
d Eq
uiva
len
t Yi
eld
Coun
t
First Loss
Investors New Yield (RHS)
SCRT Credit Tranches at Pricing
* Total Market Value ("MV") divided by Class B balance
Sources:
(1) 100 PPS via Intex CDI (Pricing-Closing Info collateral mode)
(2) BTM via Bloomberg BCMV page at 100 BTM (19-2: as of 6/18/2019; prior to 19-2: as of 4/16/2019, using oldest available collateral)
(3) YB via Yield Book v21.4 model (19-2: as of 5/2019 remit, assuming 6/18/2019 settle; prior to 19-2: as of 3/2019 remit, assuming 4/16/2019 settle)

© Freddie MacCONFIDENTIAL 36
SCRT Investor Types(1)
Guaranteed Certificates (Inclusive of MACRs) Non-Guaranteed Certificates
(1) As determined by Market Value and reflected as of issuance for all SCRT transactions from SCRT 2017-1 to SCRT 2019-2
Bank/Credit Union, 24.1%
Dealer, 16.2%Money Manager, 48.5%
Insurance Company,
7.8%
REIT, 1.9%
Hedge Fund, 1.4% Dealer, 1.0%
Money Manager, 29.9%
Insurance Company, 1.3%REIT, 17.4%
Hedge Fund, 30.3%
Private Equity, 20.1%
© Freddie MacCONFIDENTIAL 37
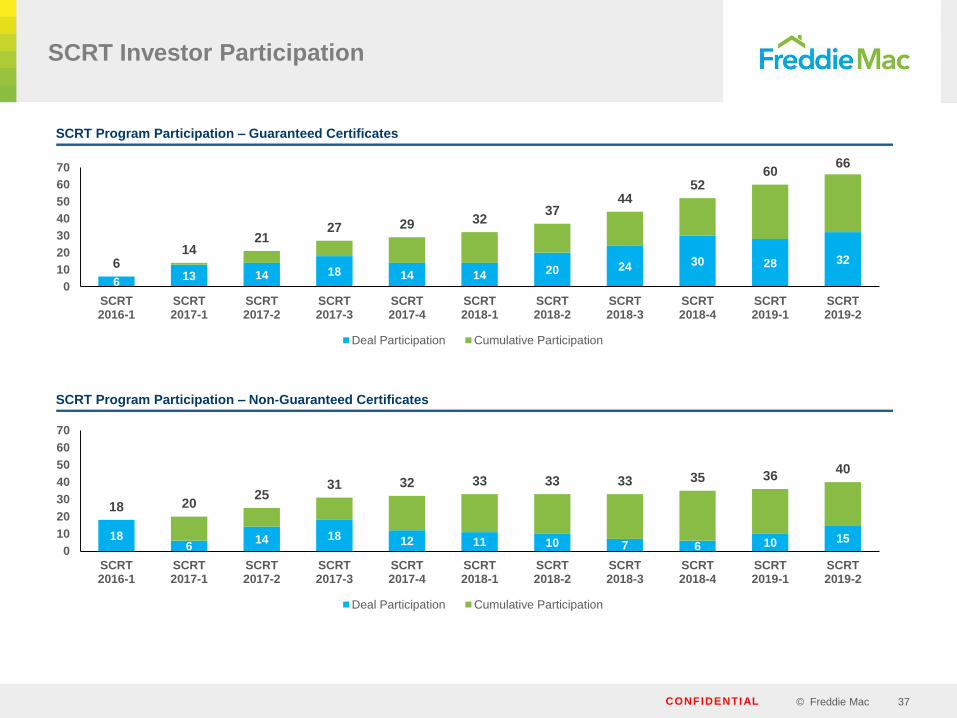
SCRT Investor Participation
SCRT Program Participation – Guaranteed Certificates
SCRT Program Participation – Non-Guaranteed Certificates
613 14 18 14 14 20 24 30 28 32614
2127 29 32
3744
5260
66
0
10
20
30
40
50
60
70
SCRT2016-1
SCRT2017-1
SCRT2017-2
SCRT2017-3
SCRT2017-4
SCRT2018-1
SCRT2018-2
SCRT2018-3
SCRT2018-4
SCRT2019-1
SCRT2019-2
Deal Participation Cumulative Participation
186
14 18 12 11 10 7 6 10 15
18 2025
31 32 33 33 33 35 3640
0
10
20
30
40
50
60
70
SCRT2016-1
SCRT2017-1
SCRT2017-2
SCRT2017-3
SCRT2017-4
SCRT2018-1
SCRT2018-2
SCRT2018-3
SCRT2018-4
SCRT2019-1
SCRT2019-2
Deal Participation Cumulative Participation

© Freddie MacCONFIDENTIAL 38
7. Historical Cohort Performance

© Freddie MacCONFIDENTIAL 39
0
1
2
3
4
5
6
7
WA
C R
ate
%
Effective WAC (Fixed)(2)(3)
Fixed-FB Fixed Low to Mid Rate-NoFB Fixed High Rate-NoFB PMMS
0
5
10
15
20
25
30
Pre
pa
ym
en
t R
ate
%
Payoff Rate (Fixed)(1)(2)
Fixed-FB Fixed Low to Mid Rate-NoFB Fixed High Rate-NoFB
Cohort Historical Payoff Rate
by Rate Group and Forbearance*
*Cohort based on Freddie Mac historical data set as of 3/31/2015
(1) Weighted by aggregate UPB of the mortgage loans as of the prior month
(2) Loans were 12+ months performing as of March 2015 and excludes repurchases and RPL sales. (Any loan identified in the data set as a whole loan sale with a prior delinquency status of current or 1 – 5
months delinquent)
(3) Calculated as note rate multiplied by the ratio of the aggregate interest bearing balance over the aggregate UPB
(4) Loans were modified and have a note rate <= 5.50% as of March 2015 and no Forbearance
(5) Loans were modified and have a note rate > 5.50% as of March 2015 and no Forbearance
(6) PMMS: Freddie Mac’s Primary Mortgage Market Survey
(4) (5)
(4) (5)
0
1
2
3
4
5
6
7
WA
C R
ate
%
Effective WAC (Step)(2)(3)
Step-FB Step-NoFB PMMS
0
5
10
15
20
25
30
Pre
pa
ym
en
t R
ate
%
Payoff Rate (Step)(1)(2)
Step-FB Step-NoFB
(6) (6)

© Freddie MacCONFIDENTIAL 40
Cohort Historical Payoff Rate
by Clean Pay History
(1) Weighted by aggregate UPB of the mortgage loans as of the prior month
(2) Loans were 12+ months performing as of March 2015, and excludes repurchases and RPL sales. (Any loan identified in the data set as a whole loan sale with a prior delinquency status of current or 1 - 5
months delinquent)
(3) Calculated as note rate multiplied by the ratio of the aggregate interest bearing balance over the aggregate UPB
(4) PMMS: Freddie Mac’s Primary Mortgage Market Survey
0
1
2
3
4
5
WA
C R
ate
%
Effective WAC (Fixed)(2)(3)
12-23 Months Clean Pay 24-35 Months Clean Pay 36+ Months Clean Pay PMMS
0
5
10
15
20
25
30
Pa
yo
ff R
ate
%
Payoff Rate (Fixed)(1)(2)
12-23 Months Clean Pay 24-35 Months Clean Pay 36+ Months Clean Pay
0
1
2
3
4
5
WA
C R
ate
%
Effective WAC (Step)(2)(3)
12-23 Months Clean Pay 24-35 Months Clean Pay 36+ Months Clean Pay PMMS
0
5
10
15
20
25
30
Pa
yo
ff R
ate
%
Payoff Rate (Step)(1)(2)
12-23 Months Clean Pay 24-35 Months Clean Pay 36+ Months Clean Pay
(4) (4)

© Freddie MacCONFIDENTIAL 41
Historical Cohort Collateral Characteristics
by Rate Group and Forbearance
(1) Cohort is as of 3/31/15 and constructed from Freddie Mac's Single-Family Loan-Level Dataset, with certain assumptions.
(2) Note rates are weighted by unpaid interest bearing balance only
(3) Note rate multiplied by the ratio of the aggregate unpaid interest bearing balance over the aggregate unpaid principal balance of the mortgage loans as of the prior month
(4) Updated LTVs were estimated based on the FHFA Home Price Index values available at that time
(5) Loans were modified, have a note rate <= 5.50% as of March 2015 and no Forbearance
(6) Loans were modified, have a note rate > 5.50% as of March 2015 and no Forbearance
Fixed Rate Modified Loan Cohorts(1) Step Rate Modified Loan Cohorts(1)
With ForbearanceLow to Mid Rates &
without Forbearance(5)
High Rates & without
Forbearance(6)With Forbearance Without Forbearance
Ge
ne
ral
As of Date 3/31/2015 3/31/2015 3/31/2015 3/31/2015 3/31/2015
% Modified 100% 100% 100% 100% 100%
Count 10,418 32,353 9,423 14,495 42,046
Total UPB (incl. forborne UPB) in millions $2,118 $6,078 $1,312 $3,211 $7,999
Forborne UPB in millions $481 $0 $0 $699 $0
% UPB Forborne 23% 0% 0% 22% 0%
% of Loans with a Forbearance Modification 100% 0% 0% 100% 0%
Avg. Loan Size in thousands $203 $188 $139 $222 $190
No
te
Ra
te
Weighted Average Note Rate at Origination(2) 6.19 6.00 6.35 6.22 6.18
Weighted Average Current Note Rate(2) 4.40 4.41 6.20 2.17 2.58
Weighted Average Effective Note Rate(3) 3.40 4.41 6.20 1.70 2.58
LT
V/C
red
it S
co
re
Weighted Average Loan Age from Origination (mos) 97 100 119 101 103
Weighted Average Age Since Modification (mos) 24 37 53 46 47
Weighted Average Remaining Maturity (mos) 455 420 359 434 304
Weighted Average LTV at Origination 83 79 77 76 76
Weighted Average Updated LTV (FHFA Indexed)(4) 100 80 72 84 75
Weighted Average Credit Score at Origination 696 692 681 705 700
Pa
y
His
tory
Avg Number of Months Clean Pay History 23 32 38 41 42
% of Loans at Least 12 Months Clean Pay History 100% 100% 100% 100% 100%
% of Loans at Least 24 Months Clean Pay History 45% 57% 67% 82% 83%
% of Loans at Least 36 Months Clean Pay History 2% 34% 51% 63% 64%

© Freddie MacCONFIDENTIAL 42
Historical Cohort Collateral Characteristics
by Clean Pay History
(1) Cohort is as of 3/31/15 and constructed from Freddie Mac's Single-Family Loan-Level Dataset, with certain assumptions.
(2) Note rates are weighted by unpaid interest bearing principal balance only
(3) Note rate multiplied by the ratio of the aggregate unpaid interest bearing balance over the aggregate unpaid principal balance
(4) The updated LTVs were estimated based on the FHFA Home Price Index values available at that time
Fixed Rate Cohorts(1) Step Rate Cohorts(1)
Modified Loans
Current for
12-23 Months
Modified Loans
Current for
24-35 Months
Modified Loans
Current for
36+ Months
Modified Loans
Current for
12-23 Months
Modified Loans
Current for
24-35 Months
Modified Loans
Current for
36+ Months
Ge
ne
ral
As of Date 3/31/2015 3/31/2015 3/31/2015 3/31/2015 3/31/2015 3/31/2015
% Modified 100% 100% 100% 100% 100% 100%
Count 22,342 13,667 16,185 9,659 10,560 36,322
Total UPB (incl. forborne UPB) in millions $4,196 $2,565 $2,748 $1,943 $2,150 $7,116
Forborne UPB in millions $258 $216 $7 $111 $123 $465
% UPB Forborne 6% 8% 0% 6% 6% 7%
% of Loans with a Forbearance Modification 28% 36% 1% 29% 30% 28%
Avg. Loan Size in thousands $188 $188 $170 $201 $204 $196
No
te
Ra
te
Weighted Average Note Rate at Origination(2) 6.03 6.12 6.13 6.18 6.17 6.20
Weighted Average Current Note Rate(2) 4.47 4.76 4.87 2.37 2.29 2.57
Weighted Average Effective Note Rate(3) 4.20 4.36 4.85 2.24 2.16 2.41
LT
V/C
red
it S
co
re
Weighted Average Loan Age from Origination (mos) 98 101 109 104 103 102
Weighted Average Age Since Modification (mos) 24 34 56 33 37 53
Weighted Average Remaining Maturity (mos) 443 423 381 350 349 336
Weighted Average LTV at Origination 80 79 78 75 75 77
Weighted Average Updated LTV (FHFA Indexed)(4) 85 85 78 80 79 77
Weighted Average Credit Score at Origination 690 694 691 692 700 705
Pa
y
His
tory
Avg. Number of Months Clean Pay History 17 29 53 17 30 51
% of Loans at Least 12 Months Clean Pay History 100% 100% 100% 100% 100% 100%
% of Loans at Least 24 Months Clean Pay History 0% 100% 100% 0% 100% 100%
% of Loans at Least 36 Months Clean Pay History 0% 0% 100% 0% 0% 100%

© Freddie MacCONFIDENTIAL 43
0.0
1.0
2.0
3.0
4.0
5.0
6.0
7.0
D90
+ R
ate
%
On-going D90+ Rate(2)
Fixed Low to Mid Rate or w/FB Fixed High Rate-NoFB Step
0.0
0.5
1.0
1.5
2.0
2.5
3.0
3.5
4.0
Liq
uid
ati
on
Rate
%
Liquidation Rate(1)(2)(3)
Fixed Low to Mid Rate or w/FB Fixed High Rate-NoFB Step
Cohort Historical Credit Performance
by Rate Group and Forbearance
(1) Weighted by the total UPB
(2) Loans were 12+ months performing as of March 2015; Repurchases and RPL sales excluded. An RPL sale is defined as any loan identified in the data set as a whole loan sale with a prior delinquency status
of current or one to five months delinquent
(3) Liquidation rates exclude any Freddie Mac NPL sales
(4) Loans were modified and have a rate less than or equal to 5.50% (as of March 2015) or have initial forbearance
(5) Loans were modified and have a rate greater than 5.50% (as of March 2015 ) without Forbearance
(6) Excludes Deferred Payment Modifications (“DPM”). With a DPM, the monthly P&I, interest rate and term to maturity are unchanged; the delinquent payments are capitalized into a non-interest bearing
principal balance that is due upon the earlier of the maturity date or payoff. To qualify for a DPM, the borrower must be at least 30 days DQ but less than 90 days DQ at time of evaluation
(4) (5)
(4) (5)
0.0
0.5
1.0
1.5
2.0
2.5
3.0
3.5
Rate
%
NPL Sale Rate
Fixed Low to Mid Rate or w/FB Fixed High Rate-NoFB Step
0.0
1.0
2.0
3.0
4.0
5.0
6.0
Mo
dif
ica
tio
n R
ate
%
Rate of Subsequent Modifications(6)
Fixed Low to Mid Rate or w/FB Fixed High Rate-NoFB Step(4) (5)
(4) (5)

© Freddie MacCONFIDENTIAL 44
Cohort Historical Credit Performance
by Clean Pay History
(1) Weighted by aggregate UPB
(2) Loans were 12+ months performing as of March 2015; Repurchases and RPL sales excluded. An RPL sale is defined as any loan identified in the data set as a whole loan sale with a prior delinquency status
of current or one to five months delinquent
(3) Liquidation rates exclude any Freddie Mac NPL sales
(4) Excludes Deferred Payment Modifications
0.0
1.0
2.0
3.0
4.0
5.0
6.0
7.0
D90
+ R
ate
%
On-going D90+ Rate(2)
12-23 Months Clean Pay 24-35 Months Clean Pay 36+ Months Clean Pay
0.0
0.5
1.0
1.5
2.0
2.5
Liq
uid
ati
on
Rate
%
Liquidation Rate(1)(2)(3)
12-23 Months Clean Pay 24-35 Months Clean Pay 36+ Months Clean Pay
0.0
0.5
1.0
1.5
2.0
2.5
Rate
%
NPL Sale Rate
12-23 Months Clean Pay 24-35 Months Clean Pay 36+ Months Clean Pay
0.0
1.0
2.0
3.0
4.0
5.0
6.0
Mo
dif
ica
tio
n R
ate
%
Rate of Subsequent Modification(4)
12-23 Months Clean Pay 24-35 Months Clean Pay 36+ Months Clean Pay

© Freddie MacCONFIDENTIAL 45
0
5
10
15
20
25
30
35
40
0
2
4
6
8
10
12
14
16
Rate
%
Rat
e %
2% Step Rate Mods12-23 months Performing as of September 2011
Effective WAC (LHS) Portfolio on-going D90+ Rate (LHS) Liquidation Rate (LHS)
Payoff Rate FB Loans (LHS) Modification Rate (annualized, LHS) Payoff Rate No FB Loans (RHS)
Step Rate Modifications Performance
(1)
(1) Excludes Deferred Payment Modifications (“DPM”). In a DPM, the monthly P&I, interest rate and maturity date are unchanged; any delinquent payments are capitalized into a non-interest bearing balance
that is due upon the earlier of maturity date or payoff. Borrowers must be at least 30 days delinquent, but less than 90 days delinquent to qualify for a DPM, at time of evaluation.

© Freddie MacCONFIDENTIAL 46
Parameters for Step Rate Modification
RPLs in Freddie Mac’s Single-Family Loan-
Level Dataset (the “Dataset”) were used to
create cohorts to demonstrate how step-rate
loans perform as they season and the rates
step up
All loans in the Dataset were full
documentation, fixed-rate, fully-
amortizing loans at time of origination.
No interest-only loans, affordable
mortgage program loans or FHA/VA
loans are included
The population includes only loans
modified to a rate of 2%, and loans
performing for 12 – 23 months, as of
September 2011
(1) Cohort is constructed from Freddie Mac's Single-Family Loan-Level Dataset, with certain assumptions. Loan Types of step or fixed rate are as of September 2011
(2) Denotes rates that are weighted by unpaid interest bearing principal balance only
(3) Calculated as the interest rate multiplied by the ratio of the aggregate unpaid interest bearing balance over the aggregate unpaid principal balance
(4) The updated LTVs were estimated based on the available FHFA Home Price Index values available at that time
Step Rate Cohorts(1)
Forbearance No Forbearance Total
Ge
ne
ral
As of Date 9/1/2011 9/1/2011 9/1/2011
% Modified 100% 100% 100%
Count 6,570 10,982 17,552
Total UPB (incl. forborne UPB) in millions $1,502 $2,302 $3,804
Forborne UPB in millions $362 $0 $362
% UPB Forborne 24% 0% 10%
% of Loans with a Forbearance Modification 100% 0% 39%
Avg. Loan Size in thousands $229 $210 $217
No
te
Ra
te
Weighted Average Note Rate at Origination(2) 6.25 6.18 6.20
Weighted Average Current Note Rate(2) 2.00 2.00 2.00
Weighted Average Effective Note Rate(3) 1.52 2.00 1.81
LT
V/C
red
it S
co
re
Weighted Average Loan Age from Origination (mos) 59 62 61
Weighted Average Age Since Modification (mos) 18 18 18
Weighted Average Remaining Maturity (mos) 461 359 400
Weighted Average LTV at Origination 78 77 77
Weighted Average Updated LTV (FHFA Indexed)(4) 108 101 104
Weighted Average Credit Score at Origination 703 706 705
Pa
y
His
tory
Avg Number of Months Clean Pay History 17 17 17
% of Loans at Least 12 Months Clean Pay History 100% 100% 100%
% of Loans at Least 24 Months Clean Pay History 0% 0% 0%
% of Loans at Least 36 Months Clean Pay History 0% 0% 0%
© Freddie MacCONFIDENTIAL 47
8. Modification Overviews
HAMP Modification Overview
Standard and Streamlined Modification Overview
Flex Modification Overview

© Freddie MacCONFIDENTIAL 48
HAMP Modification Overview
Home Affordable Modification Program (“HAMP”), designed to help financially struggling homeowners, was announced on
March 4, 2009. HAMP was effective for mortgages originated on or prior to January 1, 2009. The deadline for borrower applications
expired on December 30, 2016. While program performance and borrower incentives are still being managed, no new modifications
are being settled.
Mechanics of the HAMP program
Step 1: All arrearages, including past due interest, escrow advances, and servicer advances of amounts secured by the
mortgage are added to the borrower’s outstanding balance. This is known as capitalization.
Step 2: Solve for a payment that achieves a housing debt-to-income ratio for the borrower of 31% by adjusting terms of the
mortgage in the following order until the ratio is achieved
» First, incrementally reduce the rate to no lower than 2%
The rate will step up by up to 1% per year beginning in the 6th year after modification until the loan reaches
the PMMS® (1) rate at the time of the modification
» Second, incrementally extend the maturity out to a maximum term of 40 years
» Third, incrementally forbear an amount of the loan balance scheduled to be due at maturity. Forbearance amounts are
non-amortizing and bear no interest
Forbearance amount cannot exceed a limit(2)
Forbearance amount will not be forgiven under this modification’s terms
Step 3: Eligible borrowers who make timely payments will receive a ‘Pay for Performance’ incentive from either Freddie Mac
or Treasury(3)
» $1,000 per year for 5 years and $5,000 in the 6th year is used to pay down borrower principal balances, which, for
loans in SCRT will be realized by investors as a curtailment; generally applied first to interest bearing UPB
(1) PMMS® is the Freddie Mac Primary Mortgage Market Survey ®
(2) For trial period plan evaluations conducted on or after 12/1/2009, forbearance is limited to the greater of (i) 30% of the aggregate unpaid principal balance of the mortgage loan
including the capitalization of arrearages or (ii) an amount resulting in a modified interest-bearing balance that would create a mark-to-market LTV Ratio equal to 100%
(3) Eligible borrowers received at least a 6% payment reduction and were never 90 or more days delinquent post-modification

© Freddie MacCONFIDENTIAL 49
Standard and Streamlined Modification Overview
Standard and Streamlined Modifications, designed to help financially struggling homeowners, were announced on
September 12, 2011, and March 27, 2013, respectively. While Trial Plans and official Mods continue into 2018, the deadline for
Borrower evaluations under these programs expired on September 30, 2017.
These modifications focused on a favorable P&I payment with the overall goal of reducing the borrower’s P&I payment below the
current contractual P&I. Borrower may have been previously modified, but not more than two times. Available for both occupied and
non-occupied properties.
Mechanics of Standard & Streamlined Modifications
Step 1: All arrearages, including past due interest, escrow advances, and servicer advances of amounts secured by the mortgage
are added to the borrower’s outstanding balance. This is known as capitalization and creates the Post Capitalized Unpaid
Principal Balance (UPB).
Step 2: Determine the Post Capitalized MTMLTV which is the Post Capitalized UPB divided by the current FMV
Step 3A: If the Post Capitalized MTMLTV ratio was <80% we offered the borrower a modification with term extension. The term
was extended to 480 months. In some instances, under ARM and Step Rate mortgages, we would also set/adjust the rate to the
current PMMS®(1) interest rate in effect at modification to avoid future payment shock. The term could be shorter (240 or 360
months) if requested by the borrower and certain financial conditions were met.
Step 3B: If the Post Capitalized MTMLTV ratio was >80%, solve for a sustainable payment by adjusting terms of the mortgage
» First, set/adjust the rate to the PMMS®(1) interest rate
» Second, extend the amortization term to 480 months from the modification effective date
» Third, if the Post Capitalized MTMLTV was greater than 115%, forbear an amount of principal which was the lesser of
(i) an amount which creates an interest bearing MTMLTV of 115% or (ii) 30% of the Post Capitalized UPB
Step 4: After steps 3A and 3B, the borrower was offered the modification if the modified P&I payment was the same or lower than
the borrower’s existing contractual P&I payment. Standard Modification the modified payment had to result in a housing to income
ratio that was between 10-55%.
(1) PMMS® is the Freddie Mac Primary Mortgage Market Survey ®

© Freddie MacCONFIDENTIAL 50
Flex Modification Overview
Beginning in October, 2017, Freddie Mac Flex Modification ("Flex Modification”) replaced the previously available Standard and
Streamlined Modification to help financially struggling borrowers qualify for modifications in a changing housing market.
Mechanics of Flex Modification
Step 1: All arrearages, including past due interest, escrow advances, and servicer advances of amounts secured by the mortgage
are added to the borrower’s outstanding balance. This is known as capitalization and creates the Post Capitalized Unpaid
Principal Balance (UPB).
Step 2: Determine the Post Capitalized MTMLTV which is the Post Capitalized UPB divided by the current FMV
Step 3a: If MTMLTV is ≥ 80%:
» Reset interest rate at lower of (i) current rate, if fixed or maximum step-rate, if step and (ii) PMMS rate
» Extend the amortization term to 480 months from the modification effective date
» Forbear principal for any amount above 100% MTMLTV (up to a 30% forbearance cap)
Step 3b: If Step 3a did not achieve a 20% payment reduction and the borrower is ≥ 90 days delinquent
» Forbear the amount needed to (i) achieve 20% payment reduction, (ii) achieve MTMLTV = 80% or (iii) the forbearance cap
is hit. Offer the modification if the resulting payment is less than the borrower’s pre-modification P&I.
Step 3c: If Step 3a did not achieve both (i) a 20% payment reduction and (ii) a post-modification housing expense-to-income
(“PMHTI”) ratio ≤ 40% and the borrower is < 90 days delinquent
» Forbear the amount needed to (i) achieve 20% payment reduction and PMHTI ≤ 40%, (ii) achieve MTMLTV = 80% or (iii)
the forbearance cap is hit. Offer the modification if the resulting payment is less than the borrower’s pre-modification P&I.
Step 4: If MTMLTV is < 80%
» For step rate loans only, reset interest rate at lowest of maximum step-rate or PMMS rate
» Extend the amortization term to 480 months from the modification effective date
» No forbearance is permitted
NOTE: Loans that are less than 90 days delinquent at the time of evaluation must be fully underwritten (no streamlined offering) and if
less than 60 days delinquent, an imminent default determination must be completed, using PMHTI and the borrower must occupy the
property as their primary residence.

© Freddie MacCONFIDENTIAL 51
9. Data Stratifications

© Freddie MacCONFIDENTIAL 52
Data Stratifications (as of June 30, 2019)Aggregate
Product Type(1)
Unpaid Principal Balance ($)
AVM Current Loan-to-Value Ratio (%)
Current Mortgage Rate (%)
Current Credit Score
(1) Product Type is based on step or fixed rate at time of modification
(2) Weighted Average Current Mortgage Rate is weighted by the interest bearing unpaid principal
balance only
Number of Mortgage Loans Aggregate Unpaid Principal
Balance ($)
Aggregate Unpaid Principal
Balance (%)
Fixed-Rate 9,135 1,505,450,900.89 67.04
Step-Rate 3,883 740,314,617.50 32.96
Total: 13,018 2,245,765,518.39 100.00
Number of Mortgage
Loans
Aggregate Unpaid Principal
Balance ($)
Aggregate Unpaid Principal
Balance (%)
0.01 to 50,000.00 944 31,313,892.05 1.39
50,000.01 to 100,000.00 2,609 199,675,632.08 8.89
100,000.01 to 150,000.00 2,735 340,709,560.40 15.17
150,000.01 to 200,000.00 2,293 398,164,805.67 17.73
200,000.01 to 250,000.00 1,633 365,952,162.32 16.30
250,000.01 to 300,000.00 1,204 328,888,351.12 14.64
300,000.01 to 350,000.00 803 258,882,117.35 11.53
350,000.01 to 400,000.00 519 193,082,686.74 8.60
400,000.01 to 450,000.00 166 69,347,047.17 3.09
450,000.01 to 500,000.00 55 26,041,137.30 1.16
Greater than or equal to 500,000.01 57 33,708,126.19 1.50
Total: 13,018 2,245,765,518.39 100.00
Min UPB ($) 5,267.28
Max UPB ($) 821,746.58
Average UPB ($) 172,512.33
Number of Mortgage Loans Aggregate Unpaid Principal
Balance ($)
Aggregate Unpaid Principal
Balance (%)
Less than or equal to 50 4,505 530,178,291.88 23.61
51 to 60 2,241 380,942,045.02 16.96
61 to 70 2,306 449,881,107.18 20.03
71 to 80 1,789 372,695,504.46 16.60
81 to 90 1,102 250,898,772.61 11.17
91 to 100 552 130,462,670.39 5.81
101 to 110 254 62,887,189.13 2.80
111 to 120 127 34,441,223.30 1.53
121 to 130 71 15,883,646.97 0.71
131 to 140 28 6,580,677.55 0.29
141 to 150 18 5,311,315.09 0.24
Greater than or equal to 151 25 5,603,074.81 0.25
Total: 13,018 2,245,765,518.39 100.00
Min AVM CLTV (%) 2
Max AVM CLTV (%) 385
WA AVM CLTV (%) 66
Number of Mortgage Loans Aggregate Unpaid Principal
Balance ($)
Aggregate Unpaid Principal
Balance (%)
Less than or equal to 2.500 320 57,275,764.48 2.55
2.501 to 3.000 356 66,544,751.41 2.96
3.001 to 3.500 789 145,432,556.24 6.48
3.501 to 4.000 2,903 570,002,435.12 25.38
4.001 to 4.500 2,187 405,079,420.94 18.04
4.501 to 5.000 3,479 643,622,519.31 28.66
5.001 to 5.500 932 141,031,430.28 6.28
5.501 to 6.000 786 99,042,273.17 4.41
6.001 to 6.500 568 63,033,286.51 2.81
6.501 to 7.000 402 35,708,523.91 1.59
7.001 to 7.500 141 10,097,847.37 0.45
7.501 to 8.000 70 4,257,859.67 0.19
8.001 to 8.500 47 2,604,062.83 0.12
8.501 to 9.000 28 1,474,838.05 0.07
9.001 to 9.500 4 240,400.78 0.01
9.501 to 10.000 3 239,256.79 0.01
10.001 to 10.500 2 43,313.99 0.00
10.501 to 11.000 1 34,977.54 0.00
Total: 13,018 2,245,765,518.39 100.00
Min Current Rate (%) 2.000
Max Current Rate (%) 10.625
WA Current Rate(2) (%) 4.458
Number of Mortgage
Loans
Aggregate Unpaid Principal
Balance ($)
Aggregate Unpaid Principal
Balance (%)
Not Available 205 27,585,259.33 1.23
401 to 450 7 936,107.35 0.04
451 to 500 117 17,492,427.49 0.78
501 to 550 581 87,512,240.59 3.90
551 to 600 1,402 212,437,117.29 9.46
601 to 650 2,805 450,453,571.30 20.06
651 to 700 3,806 666,836,853.75 29.69
701 to 750 2,501 477,366,557.77 21.26
751 to 800 1,340 259,994,723.61 11.58
801 to 850 254 45,150,659.91 2.01
Total: 13,018 2,245,765,518.39 100.00
Min Current Credit Score 431
Max Current Credit Score 825
Non-Zero WA Current Credit Score 674

© Freddie MacCONFIDENTIAL 53
Data Stratifications (as of June 30, 2019)Aggregate
Loan Age from Modification (months)(1)
Remaining Term (months)
Geographic Concentration of the Mortgaged Properties (State)
Number of Mortgage Loans Aggregate Unpaid Principal
Balance ($)
Aggregate Unpaid Principal
Balance (%)
1 to 12 285 44,785,174.82 1.99
13 to 24 3,556 576,771,583.73 25.68
25 to 36 1,172 199,331,322.92 8.88
37 to 48 798 131,083,863.82 5.84
49 to 60 735 129,785,317.16 5.78
61 to 72 1,163 220,210,376.96 9.81
73 to 84 1,331 260,836,901.06 11.61
85 to 96 758 139,624,008.88 6.22
97 to 108 1,332 232,258,368.57 10.34
109 to 120 1,602 285,565,226.42 12.72
121 or greater 286 25,513,374.05 1.14
Total: 13,018 2,245,765,518.39 100.00
Min Mod Age (months) 9
Max Mod Age (months) 287
WA Mod Age (months) 61
Number of Mortgage
Loans
Aggregate Unpaid Principal
Balance ($)
Aggregate Unpaid Principal
Balance (%)
Less than or equal to 120 380 20,183,063.88 0.90
121 to 180 482 42,798,703.48 1.91
181 to 240 1,198 161,972,774.40 7.21
241 to 300 654 104,286,549.08 4.64
301 to 360 853 158,720,626.31 7.07
361 to 372 1,132 232,846,327.02 10.37
373 to 384 799 159,224,612.40 7.09
385 to 396 578 118,990,055.10 5.30
397 to 408 1,063 217,401,723.88 9.68
409 to 420 998 195,933,727.27 8.72
421 to 432 671 121,173,460.49 5.40
433 to 444 698 120,584,203.44 5.37
445 to 456 1,203 208,910,153.43 9.30
457 to 468 2,261 375,060,367.89 16.70
469 to 480 48 7,679,170.32 0.34
Total: 13,018 2,245,765,518.39 100.00
Min Remaining Term (months) 9
Max Remaining Term (months) 471
WA Remaining Term (months) 384
Number of Mortgage Loans Aggregate Unpaid Principal
Balance ($)
Aggregate Unpaid Principal
Balance (%)
Florida 2,320 387,108,106.97 17.24
California 1,459 351,386,679.33 15.65
New York 597 156,265,147.51 6.96
Illinois 896 153,520,410.88 6.84
New Jersey 556 124,977,862.71 5.57
Minnesota 510 81,081,604.14 3.61
Texas 605 71,211,392.86 3.17
Georgia 497 71,204,158.55 3.17
Maryland 323 69,645,249.18 3.10
Arizona 427 68,346,756.23 3.04
Pennsylvania 398 55,521,569.19 2.47
Nevada 271 54,387,618.59 2.42
Washington 259 49,384,483.03 2.20
Virginia 247 49,249,129.30 2.19
North Carolina 352 44,413,576.79 1.98
Other 3,301 458,061,773.13 20.40
Total: 13,018 2,245,765,518.39 100.00
Number of Mortgage Loans Aggregate Unpaid Principal
Balance ($)
Aggregate Unpaid Principal
Balance (%)
Purchase 4,586 810,743,815.42 36.10
No Cash-Out Refinance 4,577 767,080,004.91 34.16
Cash-Out Refinance 3,850 667,677,141.99 29.73
Unspecified Refinance 5 264,556.07 0.01
Total: 13,018 2,245,765,518.39 100.00
Property Type at Origination
Number of Mortgage Loans Aggregate Unpaid Principal
Balance ($)
Aggregate Unpaid Principal
Balance (%)
Single-Family 9,733 1,652,590,776.97 73.59
Planned Unit Development 2,086 411,789,361.12 18.34
Condominium 919 151,015,661.37 6.72
Manufactured Housing 272 28,919,641.72 1.29
Leasehold 7 1,385,041.46 0.06
Cooperative 1 65,035.75 0.00
Total: 13,018 2,245,765,518.39 100.00
Loan Purpose at Origination
(1) Modification date excludes any deferred payment modification

© Freddie MacCONFIDENTIAL 54
Data Stratifications (as of June 30, 2019)Group H
Product Type(1)
Unpaid Principal Balance ($)
AVM Current Loan-to-Value Ratio (%)
Current Mortgage Rate (%)
Current Credit Score
(1) Product Type is based on step or fixed rate at time of modification
(2) Weighted Average Current Mortgage Rate is weighted by the interest bearing unpaid principal
balance only
Number of Mortgage Loans Aggregate Unpaid Principal
Balance ($)
Aggregate Unpaid Principal
Balance (%)
Step-Rate 559 109,611,203.56 100.00
Total: 559 109,611,203.56 100.00
Number of Mortgage
Loans
Aggregate Unpaid Principal
Balance ($)
Aggregate Unpaid Principal
Balance (%)
0.01 to 50,000.00 40 1,347,146.21 1.23
50,000.01 to 100,000.00 94 7,105,442.28 6.48
100,000.01 to 150,000.00 94 11,560,124.79 10.55
150,000.01 to 200,000.00 88 15,083,109.84 13.76
200,000.01 to 250,000.00 73 16,412,477.55 14.97
250,000.01 to 300,000.00 71 19,363,990.57 17.67
300,000.01 to 350,000.00 44 14,212,701.85 12.97
350,000.01 to 400,000.00 25 9,280,759.75 8.47
400,000.01 to 450,000.00 13 5,545,897.65 5.06
450,000.01 to 500,000.00 6 2,830,828.83 2.58
Greater than or equal to 500,000.01 11 6,868,724.24 6.27
Total: 559 109,611,203.56 100.00
Min UPB ($) 5,892.82
Max UPB ($) 737,383.67
Average UPB ($) 196,084.44
Number of Mortgage Loans Aggregate Unpaid Principal
Balance ($)
Aggregate Unpaid Principal
Balance (%)
Less than or equal to 50 244 34,017,774.74 31.03
51 to 60 91 18,721,281.32 17.08
61 to 70 80 19,097,700.35 17.42
71 to 80 56 13,617,761.10 12.42
81 to 90 42 10,579,019.28 9.65
91 to 100 23 6,458,444.89 5.89
101 to 110 8 2,199,425.71 2.01
111 to 120 9 2,785,463.66 2.54
121 to 130 2 370,936.11 0.34
131 to 140 1 457,389.15 0.42
141 to 150 1 389,951.41 0.36
Greater than or equal to 151 2 916,055.84 0.84
Total: 559 109,611,203.56 100.00
Min AVM CLTV (%) 2
Max AVM CLTV (%) 158
WA AVM CLTV (%) 64
Number of Mortgage Loans Aggregate Unpaid Principal
Balance ($)
Aggregate Unpaid Principal
Balance (%)
Less than or equal to 2.500 231 43,654,925.02 39.83
2.501 to 3.000 261 54,196,121.09 49.44
3.001 to 3.500 20 3,611,098.67 3.29
3.501 to 4.000 41 7,400,400.55 6.75
4.001 to 4.500 6 748,658.23 0.68
Total: 559 109,611,203.56 100.00
Min Current Rate (%) 2.000
Max Current Rate (%) 4.375
WA Current Rate(2) (%) 2.677
Number of Mortgage
Loans
Aggregate Unpaid Principal
Balance ($)
Aggregate Unpaid Principal
Balance (%)
Not Available 15 3,187,349.21 2.91
451 to 500 3 825,862.34 0.75
501 to 550 22 3,474,551.96 3.17
551 to 600 57 9,553,270.10 8.72
601 to 650 117 20,536,258.69 18.74
651 to 700 169 32,215,059.29 29.39
701 to 750 145 32,691,509.07 29.82
751 to 800 25 6,116,879.04 5.58
801 to 850 6 1,010,463.86 0.92
Total: 559 109,611,203.56 100.00
Min Current Credit Score 454
Max Current Credit Score 814
Non-Zero WA Current Credit Score 673
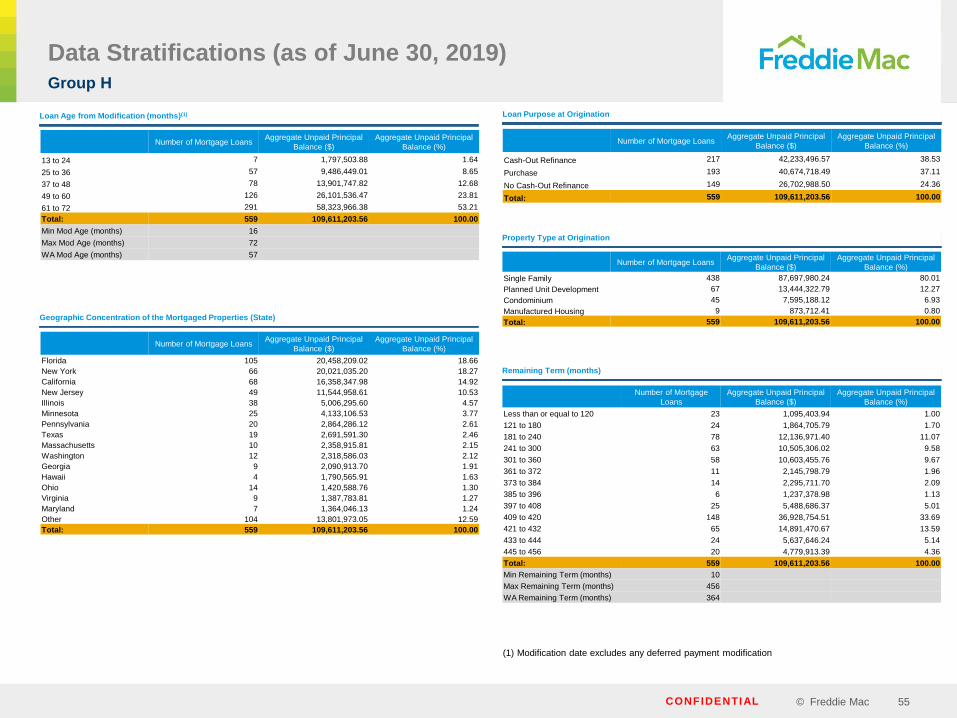
© Freddie MacCONFIDENTIAL 55
Data Stratifications (as of June 30, 2019)Group H
Loan Age from Modification (months)(1)
Remaining Term (months)
Loan Purpose at Origination
Property Type at Origination
Geographic Concentration of the Mortgaged Properties (State)
Number of Mortgage Loans Aggregate Unpaid Principal
Balance ($)
Aggregate Unpaid Principal
Balance (%)
13 to 24 7 1,797,503.88 1.64
25 to 36 57 9,486,449.01 8.65
37 to 48 78 13,901,747.82 12.68
49 to 60 126 26,101,536.47 23.81
61 to 72 291 58,323,966.38 53.21
Total: 559 109,611,203.56 100.00
Min Mod Age (months) 16
Max Mod Age (months) 72
WA Mod Age (months) 57
Number of Mortgage
Loans
Aggregate Unpaid Principal
Balance ($)
Aggregate Unpaid Principal
Balance (%)
Less than or equal to 120 23 1,095,403.94 1.00
121 to 180 24 1,864,705.79 1.70
181 to 240 78 12,136,971.40 11.07
241 to 300 63 10,505,306.02 9.58
301 to 360 58 10,603,455.76 9.67
361 to 372 11 2,145,798.79 1.96
373 to 384 14 2,295,711.70 2.09
385 to 396 6 1,237,378.98 1.13
397 to 408 25 5,488,686.37 5.01
409 to 420 148 36,928,754.51 33.69
421 to 432 65 14,891,470.67 13.59
433 to 444 24 5,637,646.24 5.14
445 to 456 20 4,779,913.39 4.36
Total: 559 109,611,203.56 100.00
Min Remaining Term (months) 10
Max Remaining Term (months) 456
WA Remaining Term (months) 364
Number of Mortgage Loans Aggregate Unpaid Principal
Balance ($)
Aggregate Unpaid Principal
Balance (%)
Cash-Out Refinance 217 42,233,496.57 38.53
Purchase 193 40,674,718.49 37.11
No Cash-Out Refinance 149 26,702,988.50 24.36
Total: 559 109,611,203.56 100.00
Number of Mortgage Loans Aggregate Unpaid Principal
Balance ($)
Aggregate Unpaid Principal
Balance (%)
Single Family 438 87,697,980.24 80.01
Planned Unit Development 67 13,444,322.79 12.27
Condominium 45 7,595,188.12 6.93
Manufactured Housing 9 873,712.41 0.80
Total: 559 109,611,203.56 100.00
Number of Mortgage Loans Aggregate Unpaid Principal
Balance ($)
Aggregate Unpaid Principal
Balance (%)
Florida 105 20,458,209.02 18.66
New York 66 20,021,035.20 18.27
California 68 16,358,347.98 14.92
New Jersey 49 11,544,958.61 10.53
Illinois 38 5,006,295.60 4.57
Minnesota 25 4,133,106.53 3.77
Pennsylvania 20 2,864,286.12 2.61
Texas 19 2,691,591.30 2.46
Massachusetts 10 2,358,915.81 2.15
Washington 12 2,318,586.03 2.12
Georgia 9 2,090,913.70 1.91
Hawaii 4 1,790,565.91 1.63
Ohio 14 1,420,588.76 1.30
Virginia 9 1,387,783.81 1.27
Maryland 7 1,364,046.13 1.24
Other 104 13,801,973.05 12.59
Total: 559 109,611,203.56 100.00
(1) Modification date excludes any deferred payment modification
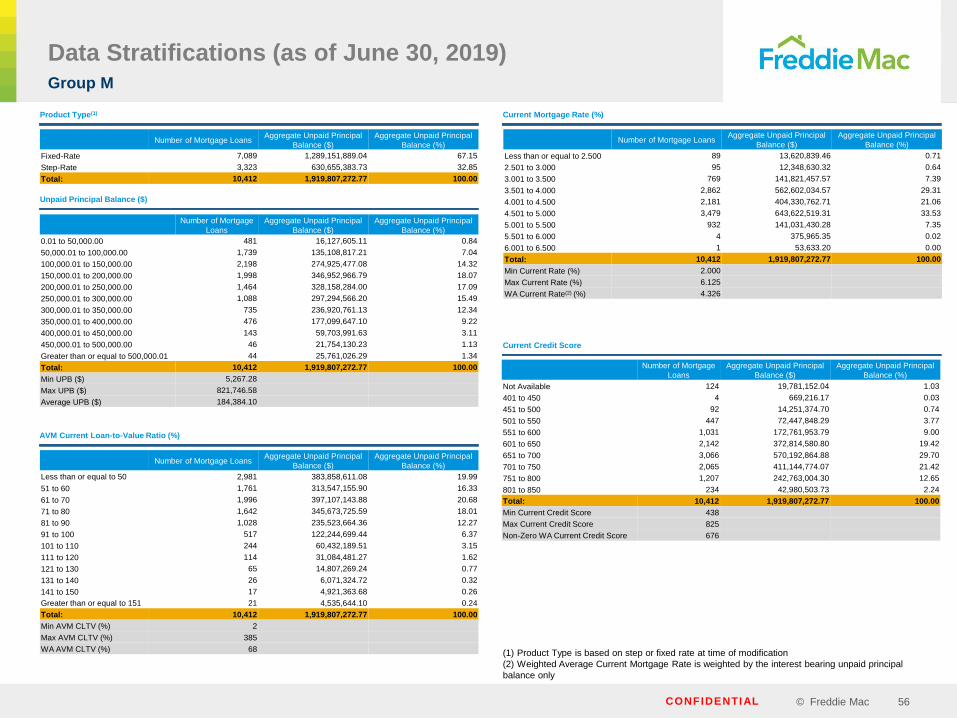
© Freddie MacCONFIDENTIAL 56
Data Stratifications (as of June 30, 2019)Group M
Product Type(1)
Unpaid Principal Balance ($)
AVM Current Loan-to-Value Ratio (%)
Current Mortgage Rate (%)
Current Credit Score
(1) Product Type is based on step or fixed rate at time of modification
(2) Weighted Average Current Mortgage Rate is weighted by the interest bearing unpaid principal
balance only
Number of Mortgage Loans Aggregate Unpaid Principal
Balance ($)
Aggregate Unpaid Principal
Balance (%)
Fixed-Rate 7,089 1,289,151,889.04 67.15
Step-Rate 3,323 630,655,383.73 32.85
Total: 10,412 1,919,807,272.77 100.00
Number of Mortgage
Loans
Aggregate Unpaid Principal
Balance ($)
Aggregate Unpaid Principal
Balance (%)
0.01 to 50,000.00 481 16,127,605.11 0.84
50,000.01 to 100,000.00 1,739 135,108,817.21 7.04
100,000.01 to 150,000.00 2,198 274,925,477.08 14.32
150,000.01 to 200,000.00 1,998 346,952,966.79 18.07
200,000.01 to 250,000.00 1,464 328,158,284.00 17.09
250,000.01 to 300,000.00 1,088 297,294,566.20 15.49
300,000.01 to 350,000.00 735 236,920,761.13 12.34
350,000.01 to 400,000.00 476 177,099,647.10 9.22
400,000.01 to 450,000.00 143 59,703,991.63 3.11
450,000.01 to 500,000.00 46 21,754,130.23 1.13
Greater than or equal to 500,000.01 44 25,761,026.29 1.34
Total: 10,412 1,919,807,272.77 100.00
Min UPB ($) 5,267.28
Max UPB ($) 821,746.58
Average UPB ($) 184,384.10
Number of Mortgage Loans Aggregate Unpaid Principal
Balance ($)
Aggregate Unpaid Principal
Balance (%)
Less than or equal to 50 2,981 383,858,611.08 19.99
51 to 60 1,761 313,547,155.90 16.33
61 to 70 1,996 397,107,143.88 20.68
71 to 80 1,642 345,673,725.59 18.01
81 to 90 1,028 235,523,664.36 12.27
91 to 100 517 122,244,699.44 6.37
101 to 110 244 60,432,189.51 3.15
111 to 120 114 31,084,481.27 1.62
121 to 130 65 14,807,269.24 0.77
131 to 140 26 6,071,324.72 0.32
141 to 150 17 4,921,363.68 0.26
Greater than or equal to 151 21 4,535,644.10 0.24
Total: 10,412 1,919,807,272.77 100.00
Min AVM CLTV (%) 2
Max AVM CLTV (%) 385
WA AVM CLTV (%) 68
Number of Mortgage Loans Aggregate Unpaid Principal
Balance ($)
Aggregate Unpaid Principal
Balance (%)
Less than or equal to 2.500 89 13,620,839.46 0.71
2.501 to 3.000 95 12,348,630.32 0.64
3.001 to 3.500 769 141,821,457.57 7.39
3.501 to 4.000 2,862 562,602,034.57 29.31
4.001 to 4.500 2,181 404,330,762.71 21.06
4.501 to 5.000 3,479 643,622,519.31 33.53
5.001 to 5.500 932 141,031,430.28 7.35
5.501 to 6.000 4 375,965.35 0.02
6.001 to 6.500 1 53,633.20 0.00
Total: 10,412 1,919,807,272.77 100.00
Min Current Rate (%) 2.000
Max Current Rate (%) 6.125
WA Current Rate(2) (%) 4.326
Number of Mortgage
Loans
Aggregate Unpaid Principal
Balance ($)
Aggregate Unpaid Principal
Balance (%)
Not Available 124 19,781,152.04 1.03
401 to 450 4 669,216.17 0.03
451 to 500 92 14,251,374.70 0.74
501 to 550 447 72,447,848.29 3.77
551 to 600 1,031 172,761,953.79 9.00
601 to 650 2,142 372,814,580.80 19.42
651 to 700 3,066 570,192,864.88 29.70
701 to 750 2,065 411,144,774.07 21.42
751 to 800 1,207 242,763,004.30 12.65
801 to 850 234 42,980,503.73 2.24
Total: 10,412 1,919,807,272.77 100.00
Min Current Credit Score 438
Max Current Credit Score 825
Non-Zero WA Current Credit Score 676

© Freddie MacCONFIDENTIAL 57
Data Stratifications (as of June 30, 2019)Group M
Loan Age from Modification (months)(1)
Remaining Term (months)
Loan Purpose at Origination
Property Type at Origination
Geographic Concentration of the Mortgaged Properties (State)
Number of Mortgage Loans Aggregate Unpaid Principal
Balance ($)
Aggregate Unpaid Principal
Balance (%)
1 to 12 228 38,668,244.90 2.01
13 to 24 2,816 501,060,749.21 26.10
25 to 36 908 167,806,070.93 8.74
37 to 48 562 100,241,270.62 5.22
49 to 60 455 85,004,250.04 4.43
61 to 72 769 149,640,505.41 7.79
73 to 84 1,287 255,756,285.54 13.32
85 to 96 698 132,049,091.50 6.88
97 to 108 1,156 211,000,235.15 10.99
109 to 120 1,441 266,917,927.86 13.90
121 or greater 92 11,662,641.61 0.61
Total: 10,412 1,919,807,272.77 100.00
Min Mod Age (months) 9
Max Mod Age (months) 171
WA Mod Age (months) 62
Number of Mortgage
Loans
Aggregate Unpaid Principal
Balance ($)
Aggregate Unpaid Principal
Balance (%)
Less than or equal to 120 257 15,425,591.62 0.80
121 to 180 293 29,999,157.38 1.56
181 to 240 862 124,874,728.21 6.50
241 to 300 505 85,077,907.04 4.43
301 to 360 699 137,026,261.50 7.14
361 to 372 1,047 219,527,478.98 11.43
373 to 384 688 143,748,702.24 7.49
385 to 396 546 113,657,140.00 5.92
397 to 408 997 207,360,423.25 10.80
409 to 420 734 144,790,766.10 7.54
421 to 432 459 88,688,607.68 4.62
433 to 444 542 99,065,085.43 5.16
445 to 456 974 181,205,856.83 9.44
457 to 468 1,770 322,676,268.96 16.81
469 to 480 39 6,683,297.55 0.35
Total: 10,412 1,919,807,272.77 100.00
Min Remaining Term (months) 9
Max Remaining Term (months) 471
WA Remaining Term (months) 386
Number of Mortgage Loans Aggregate Unpaid Principal
Balance ($)
Aggregate Unpaid Principal
Balance (%)
Purchase 3,580 689,068,106.29 35.89
No Cash-Out Refinance 3,831 678,064,650.56 35.32
Cash-Out Refinance 2,999 552,507,516.81 28.78
Unspecified Refinance 2 166,999.11 0.01
Total: 10,412 1,919,807,272.77 100.00
Number of Mortgage Loans Aggregate Unpaid Principal
Balance ($)
Aggregate Unpaid Principal
Balance (%)
Single Family 7,661 1,396,255,781.33 72.73
Planned Unit Development 1,772 365,237,887.49 19.02
Condominium 789 134,754,063.85 7.02
Manufactured Housing 185 22,427,125.18 1.17
Leasehold 5 1,132,414.92 0.06
Total: 10,412 1,919,807,272.77 100.00
Number of Mortgage Loans Aggregate Unpaid Principal
Balance ($)
Aggregate Unpaid Principal
Balance (%)
Florida 1,921 337,459,767.71 17.58
California 1,289 318,802,135.85 16.61
Illinois 790 142,549,454.04 7.43
New York 424 119,173,679.78 6.21
New Jersey 436 102,811,355.34 5.36
Minnesota 431 70,356,645.34 3.66
Arizona 379 63,721,925.94 3.32
Georgia 426 62,430,444.63 3.25
Maryland 279 62,375,350.32 3.25
Nevada 253 52,089,029.81 2.71
Texas 360 48,872,542.87 2.55
Pennsylvania 290 44,088,928.40 2.30
Washington 209 42,258,761.12 2.20
Virginia 197 42,075,468.18 2.19
Massachusetts 181 38,457,590.38 2.00
Other 2,547 372,284,193.06 19.39
Total: 10,412 1,919,807,272.77 100.00
(1) Modification date excludes any deferred payment modification
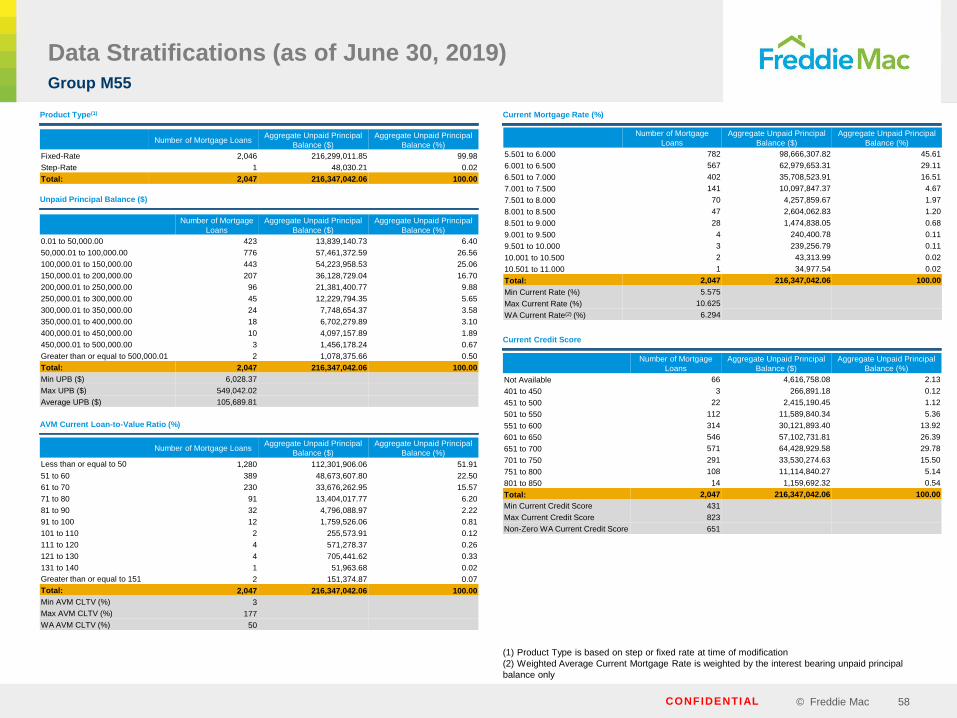
© Freddie MacCONFIDENTIAL 58
Number of Mortgage
Loans
Aggregate Unpaid Principal
Balance ($)
Aggregate Unpaid Principal
Balance (%)
5.501 to 6.000 782 98,666,307.82 45.61
6.001 to 6.500 567 62,979,653.31 29.11
6.501 to 7.000 402 35,708,523.91 16.51
7.001 to 7.500 141 10,097,847.37 4.67
7.501 to 8.000 70 4,257,859.67 1.97
8.001 to 8.500 47 2,604,062.83 1.20
8.501 to 9.000 28 1,474,838.05 0.68
9.001 to 9.500 4 240,400.78 0.11
9.501 to 10.000 3 239,256.79 0.11
10.001 to 10.500 2 43,313.99 0.02
10.501 to 11.000 1 34,977.54 0.02
Total: 2,047 216,347,042.06 100.00
Min Current Rate (%) 5.575
Max Current Rate (%) 10.625
WA Current Rate(2) (%) 6.294
Data Stratifications (as of June 30, 2019)Group M55
Product Type(1)
Unpaid Principal Balance ($)
AVM Current Loan-to-Value Ratio (%)
Current Mortgage Rate (%)
Current Credit Score
(1) Product Type is based on step or fixed rate at time of modification
(2) Weighted Average Current Mortgage Rate is weighted by the interest bearing unpaid principal
balance only
Number of Mortgage Loans Aggregate Unpaid Principal
Balance ($)
Aggregate Unpaid Principal
Balance (%)
Fixed-Rate 2,046 216,299,011.85 99.98
Step-Rate 1 48,030.21 0.02
Total: 2,047 216,347,042.06 100.00
Number of Mortgage
Loans
Aggregate Unpaid Principal
Balance ($)
Aggregate Unpaid Principal
Balance (%)
0.01 to 50,000.00 423 13,839,140.73 6.40
50,000.01 to 100,000.00 776 57,461,372.59 26.56
100,000.01 to 150,000.00 443 54,223,958.53 25.06
150,000.01 to 200,000.00 207 36,128,729.04 16.70
200,000.01 to 250,000.00 96 21,381,400.77 9.88
250,000.01 to 300,000.00 45 12,229,794.35 5.65
300,000.01 to 350,000.00 24 7,748,654.37 3.58
350,000.01 to 400,000.00 18 6,702,279.89 3.10
400,000.01 to 450,000.00 10 4,097,157.89 1.89
450,000.01 to 500,000.00 3 1,456,178.24 0.67
Greater than or equal to 500,000.01 2 1,078,375.66 0.50
Total: 2,047 216,347,042.06 100.00
Min UPB ($) 6,028.37
Max UPB ($) 549,042.02
Average UPB ($) 105,689.81
Number of Mortgage
Loans
Aggregate Unpaid Principal
Balance ($)
Aggregate Unpaid Principal
Balance (%)
Not Available 66 4,616,758.08 2.13
401 to 450 3 266,891.18 0.12
451 to 500 22 2,415,190.45 1.12
501 to 550 112 11,589,840.34 5.36
551 to 600 314 30,121,893.40 13.92
601 to 650 546 57,102,731.81 26.39
651 to 700 571 64,428,929.58 29.78
701 to 750 291 33,530,274.63 15.50
751 to 800 108 11,114,840.27 5.14
801 to 850 14 1,159,692.32 0.54
Total: 2,047 216,347,042.06 100.00
Min Current Credit Score 431
Max Current Credit Score 823
Non-Zero WA Current Credit Score 651
Number of Mortgage Loans Aggregate Unpaid Principal
Balance ($)
Aggregate Unpaid Principal
Balance (%)
Less than or equal to 50 1,280 112,301,906.06 51.91
51 to 60 389 48,673,607.80 22.50
61 to 70 230 33,676,262.95 15.57
71 to 80 91 13,404,017.77 6.20
81 to 90 32 4,796,088.97 2.22
91 to 100 12 1,759,526.06 0.81
101 to 110 2 255,573.91 0.12
111 to 120 4 571,278.37 0.26
121 to 130 4 705,441.62 0.33
131 to 140 1 51,963.68 0.02
Greater than or equal to 151 2 151,374.87 0.07
Total: 2,047 216,347,042.06 100.00
Min AVM CLTV (%) 3
Max AVM CLTV (%) 177
WA AVM CLTV (%) 50

© Freddie MacCONFIDENTIAL 59
Data Stratifications (as of June 30, 2019)Group M55
Geographic Concentration of the Mortgaged Properties (State)
Number of Mortgage Loans Aggregate Unpaid Principal
Balance ($)
Aggregate Unpaid Principal
Balance (%)
Florida 294 29,190,130.24 13.49
Texas 226 19,647,258.69 9.08
New York 107 17,070,432.53 7.89
California 102 16,226,195.50 7.50
New Jersey 71 10,621,548.76 4.91
Pennsylvania 88 8,568,354.67 3.96
Georgia 62 6,682,800.22 3.09
Minnesota 54 6,591,852.27 3.05
North Carolina 72 6,458,835.08 2.99
Illinois 68 5,964,661.24 2.76
Maryland 37 5,905,852.73 2.73
Virginia 41 5,785,877.31 2.67
Missouri 64 5,738,971.78 2.65
Washington 38 4,807,135.88 2.22
Ohio 68 4,210,531.77 1.95
Other 655 62,876,603.39 29.06
Total: 2,047 216,347,042.06 100.00
Loan Age from Modification (months)(1)
Number of Mortgage Loans Aggregate Unpaid Principal
Balance ($)
Aggregate Unpaid Principal
Balance (%)
1 to 12 57 6,116,929.92 2.83
13 to 24 733 73,913,330.64 34.16
25 to 36 207 22,038,802.98 10.19
37 to 48 158 16,940,845.38 7.83
49 to 60 154 18,679,530.65 8.63
61 to 72 103 12,245,905.17 5.66
73 to 84 44 5,080,615.52 2.35
85 to 96 60 7,574,917.38 3.50
97 to 108 176 21,258,133.42 9.83
109 to 120 161 18,647,298.56 8.62
121 or greater 194 13,850,732.44 6.40
Total: 2,047 216,347,042.06 100.00
Min Mod Age (months) 11
Max Mod Age (months) 287
WA Mod Age (months) 55
Remaining Term (months)
Number of Mortgage Loans Aggregate Unpaid Principal
Balance ($)
Aggregate Unpaid Principal
Balance (%)
Less than or equal to 120 100 3,662,068.32 1.69
121 to 180 165 10,934,840.31 5.05
181 to 240 258 24,961,074.79 11.54
241 to 300 86 8,703,336.02 4.02
301 to 360 96 11,090,909.05 5.13
361 to 372 74 11,173,049.25 5.16
373 to 384 97 13,180,198.46 6.09
385 to 396 26 4,095,536.12 1.89
397 to 408 41 4,552,614.26 2.10
409 to 420 116 14,214,206.66 6.57
421 to 432 147 17,593,382.14 8.13
433 to 444 132 15,881,471.77 7.34
445 to 456 209 22,924,383.21 10.60
457 to 468 491 52,384,098.93 24.21
469 to 480 9 995,872.77 0.46
Total: 2,047 216,347,042.06 100.00
Min Remaining Term (months) 12
Max Remaining Term (months) 469
WA Remaining Term (months) 376
Loan Purpose at Origination
Number of Mortgage Loans Aggregate Unpaid Principal
Balance ($)
Aggregate Unpaid Principal
Balance (%)
Purchase 813 81,000,990.64 37.44
Cash-Out Refinance 634 72,936,128.61 33.71
No Cash-Out Refinance 597 62,312,365.85 28.80
Unspecified Refinance 3 97,556.96 0.05
Total: 2,047 216,347,042.06 100.00
Number of Mortgage Loans Aggregate Unpaid Principal
Balance ($)
Aggregate Unpaid Principal
Balance (%)
Single Family 1,634 168,637,015.40 77.95
Planned Unit Development 247 33,107,150.84 15.30
Condominium 85 8,666,409.40 4.01
Manufactured Housing 78 5,618,804.13 2.60
Leasehold 2 252,626.54 0.12
Co-operative 1 65,035.75 0.03
Total: 2,047 216,347,042.06 100.00
Property Type at Origination
(1) Modification date excludes any deferred payment modification

© Freddie MacCONFIDENTIAL 60
10. Collateral History by Group

© Freddie MacCONFIDENTIAL 61
Collateral Characteristics Comparison – Group H
SCRT Group H
Description 2017-1 2017-2 2017-3 2017-4 2018-1 2018-2 2018-3 2018-4 2019-1 2019-2 2019-3
Ge
ne
ral
As of Date 3/31/2017 6/30/2017 8/31/2017 10/31/2017 1/31/2018 4/30/2018 6/30/2018 9/30/2018 1/31/2019 3/31/2019 6/30/2019
% Modified 100% 100% 100% 100% 100% 100% 100% 100% 100% 100% 100%
Loan Count 3,620 5,779 2,511 3,635 2,380 2,038 3,177 1,772 871 891 559
Total UPB (incl. forborne UPB) in millions of USD $952 $1,520 $628 $745 $466 $426 $695 $402 $170 $185 $110
Forborne UPB in millions of USD $216 $278 $128 $53 $70 $49 $94 $57 $18 $17 $12
% UPB Forborne 23% 18% 20% 7% 15% 11% 13% 14% 11% 9% 11%
% of Loans with a Forbearance UPB 95% 92% 93% 22% 72% 55% 64% 66% 57% 49% 57%
Avg. Loan Size in thousands of USD $263 $263 $250 $205 $196 $209 $219 $227 $195 $208 $196
No
te R
ate
Weighted Average Note Rate at Origination(1) 6.44% 6.40% 6.34% 6.31% 6.20% 6.16% 6.21% 6.27% 6.23% 6.26% 6.11%
Weighted Average Current Note Rate(1) 3.58% 2.95% 3.41% 3.01% 2.91% 2.71% 2.97% 2.83% 2.64% 2.58% 2.68%
Weighted Average Effective Note Rate(2) 2.77% 2.41% 2.71% 2.80% 2.47% 2.40% 2.57% 2.43% 2.36% 2.35% 2.38%
Weighted Average Terminal Note Rate (1)(3) 4.55% 4.17% 4.35% 4.11% 4.08% 4.02% 3.96% 3.91% 3.96% 3.99% 4.09%
Weighted Average Terminal Effective Note Rate(2)(3) 3.52% 3.41% 3.47% 3.82% 3.47% 3.56% 3.42% 3.35% 3.54% 3.63% 3.63%
Te
rm / L
TV
/ C
red
it S
co
re Weighted Average Loan Age from Origination (mos) 121 125 127 131 141 143 142 144 153 153 161
Weighted Average Loan Age from Modification (mos)(4) 71 62 69 61 59 57 64 62 54 54 57
Weighted Average Remaining Maturity (mos) 404 411 405 327 389 365 372 376 372 366 364
Weighted Average LTV at Origination 77% 78% 78% 77% 78% 77% 73% 75% 75% 75% 75%
Weighted Average Updated LTV (FHFA Indexed)(5) 80% 83% 76% 70% 69% 66% 65% 68% 63% 66% 60%
Weighted Average AVM Current LTV 86% 87% 82% 74% 74% 68% 68% 73% 70% 72% 64%
% of Loans with AVM Current LTV >105% 15% 18% 13% 7% 12% 7% 7% 11% 9% 10% 5%
Non-Zero Weighted Average Credit Score at Origination 703 703 705 699 704 704 702 701 691 692 696
Non-Zero Weighted Average Current Credit Score 695 687 693 681 683 682 691 692 668 671 673
Pa
y H
isto
ry /
Mo
dif
ica
tio
ns
Average Number of Months Clean Pay History 62 55 59 52 53 51 57 56 39 36 42
% of Loans with 12+ Months Clean Pay History 100% 100% 100% 100% 100% 100% 100% 100% 100% 100% 100%
% of Loans with 24+ Months Clean Pay History 95% 91% 93% 93% 87% 91% 92% 92% 67% 65% 69%
% of Loans with 36+ Months Clean Pay History 83% 80% 83% 74% 77% 78% 84% 83% 48% 40% 57%
% of Loans modified within 24 Months 1% 2% 1% 2% 6% 5% 1% 1% 4% 3% 2%
% of Loans modified between 25 to 36 Months 3% 5% 4% 6% 6% 8% 4% 4% 14% 14% 9%
Servicer SPS Nationstar Nationstar Nationstar SLS SLS SPS SPS SLS SPS SLS
(1) Note rates are weighted by interest bearing unpaid principal balance only
(2) Calculated as the note rate multiplied by the ratio of the aggregate unpaid interest bearing balance over the aggregate unpaid principal balance
(3) Calculated as the weighted average of the fixed-rate or maximum step-rate over the life of each Mortgage Loan
(4) Modification date is based on the later of deferred payment modification and non-deferred payment modification for deals up to and including SCRT 2018-4. Beginning with SCRT 2019-1, modification date excludes any
deferred payment modifications
(5) The updated LTVs were estimated based on the most recent FHFA Home Price Index values available as of the cut-off date

© Freddie MacCONFIDENTIAL 62
Collateral Characteristics Comparison – Group M
SCRT Group M
Description 2017-1 2017-2 2017-3 2017-4 2018-1 2018-2 2018-3 2018-4 2019-1 2019-2 2019-3
Ge
ne
ral
As of Date 3/31/2017 6/30/2017 8/31/2017 10/31/2017 1/31/2018 4/30/2018 6/30/2018 9/30/2018 1/31/2019 3/31/2019 6/30/2019
% Modified 100% 100% 100% 100% 100% 100% 100% 100% 100% 100% 100%
Loan Count 741 4,160 4,665 2,808 4,469 5,464 7,642 7,111 9,600 10,158 10,412
Total UPB (incl. forborne UPB) in millions of USD $163 $955 $1,079 $574 $871 $1,023 $1,532 $1,470 $1,753 $2,067 $1,920
Forborne UPB in millions of USD $33 $210 $247 $23 $123 $121 $202 $201 $238 $285 $224
% UPB Forborne 20% 22% 23% 4% 14% 12% 13% 14% 14% 14% 12%
% of Loans with a Forbearance UPB 82% 90% 93% 17% 57% 47% 55% 58% 54% 58% 45%
Avg. Loan Size in thousands of USD $220 $230 $231 $204 $195 $187 $200 $207 $183 $204 $184
No
te R
ate
Weighted Average Note Rate at Origination(1) 6.37% 6.48% 6.38% 6.20% 6.03% 5.92% 6.05% 6.20% 6.08% 6.19% 5.72%
Weighted Average Current Note Rate(1) 4.31% 4.46% 4.52% 4.10% 4.18% 4.46% 4.44% 4.38% 4.34% 4.33% 4.33%
Weighted Average Effective Note Rate(2) 3.44% 3.48% 3.49% 3.94% 3.59% 3.93% 3.86% 3.78% 3.75% 3.73% 3.82%
Weighted Average Terminal Note Rate (1)(3) 4.31% 4.46% 4.52% 4.10% 4.18% 4.46% 4.44% 4.38% 4.34% 4.33% 4.33%
Weighted Average Terminal Effective Note Rate(2)(3) 3.44% 3.48% 3.49% 3.94% 3.59% 3.93% 3.86% 3.78% 3.75% 3.73% 3.82%
Te
rm / L
TV
/ C
red
it S
co
re Weighted Average Loan Age from Origination (mos) 121 124 125 126 129 135 133 140 147 145 137
Weighted Average Loan Age from Modification (mos)(4) 40 53 62 56 54 66 69 73 71 68 62
Weighted Average Remaining Maturity (mos) 434 423 414 389 417 385 382 380 387 396 386
Weighted Average LTV at Origination 80% 82% 82% 80% 84% 81% 80% 79% 80% 80% 82%
Weighted Average Updated LTV (FHFA Indexed)(5) 89% 92% 85% 72% 77% 69% 68% 67% 66% 69% 64%
Weighted Average AVM Current LTV 99% 100% 93% 75% 82% 71% 71% 72% 73% 76% 68%
% of Loans with AVM Current LTV >105% 33% 35% 26% 3% 14% 7% 7% 7% 8% 9% 4%
Non-Zero Weighted Average Credit Score at Origination 694 689 693 690 697 694 697 695 688 690 696
Non-Zero Weighted Average Current Credit Score 669 672 685 671 671 678 690 692 674 677 676
Pa
y H
isto
ry /
Mo
dif
ica
tio
ns
Average Number of Months Clean Pay History 34 46 53 47 46 52 57 59 49 45 43
% of Loans with 12+ Months Clean Pay History 100% 100% 100% 100% 100% 100% 100% 100% 100% 100% 100%
% of Loans with 24+ Months Clean Pay History 74% 79% 92% 79% 67% 80% 86% 87% 64% 63% 53%
% of Loans with 36+ Months Clean Pay History 40% 62% 78% 52% 53% 62% 72% 74% 50% 43% 40%
% of Loans modified within 24 Months 18% 15% 1% 17% 25% 12% 5% 5% 9% 13% 28%
% of Loans modified between 25 to 36 Months 26% 12% 3% 17% 10% 8% 8% 7% 11% 11% 9%
Servicer SPS Nationstar Nationstar Nationstar SLS SLS SPS SPS SLS SPS SLS
(1) Note rates are weighted by interest bearing unpaid principal balance only
(2) Calculated as the note rate multiplied by the ratio of the aggregate unpaid interest bearing balance over the aggregate unpaid principal balance
(3) Calculated as the weighted average of the fixed-rate or maximum step-rate over the life of each Mortgage Loan
(4) Modification date is based on the later of deferred payment modification and non-deferred payment modification for deals up to and including SCRT 2018-4. Beginning with SCRT 2019-1, modification date excludes any deferred
payment modifications
(5) The updated LTVs were estimated based on the most recent FHFA Home Price Index values available as of the Cut-Off Date
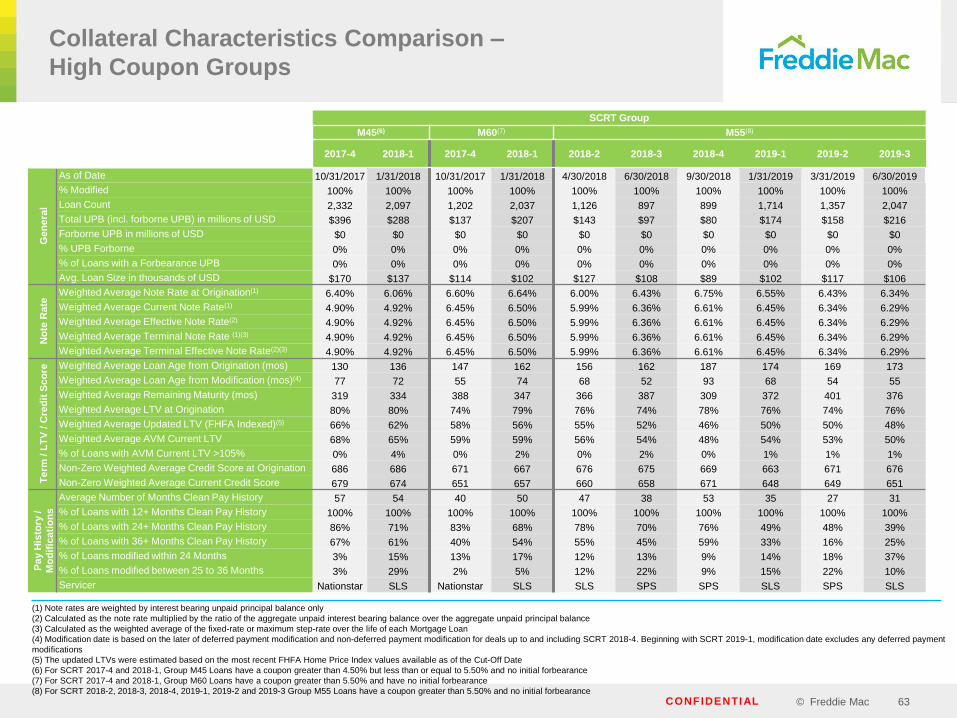
© Freddie MacCONFIDENTIAL 63
Collateral Characteristics Comparison –
High Coupon Groups
SCRT Group
M45(6) M60(7) M55(8)
Description 2017-4 2018-1 2017-4 2018-1 2018-2 2018-3 2018-4 2019-1 2019-2 2019-3
Ge
ne
ral
As of Date 10/31/2017 1/31/2018 10/31/2017 1/31/2018 4/30/2018 6/30/2018 9/30/2018 1/31/2019 3/31/2019 6/30/2019
% Modified 100% 100% 100% 100% 100% 100% 100% 100% 100% 100%
Loan Count 2,332 2,097 1,202 2,037 1,126 897 899 1,714 1,357 2,047
Total UPB (incl. forborne UPB) in millions of USD $396 $288 $137 $207 $143 $97 $80 $174 $158 $216
Forborne UPB in millions of USD $0 $0 $0 $0 $0 $0 $0 $0 $0 $0
% UPB Forborne 0% 0% 0% 0% 0% 0% 0% 0% 0% 0%
% of Loans with a Forbearance UPB 0% 0% 0% 0% 0% 0% 0% 0% 0% 0%
Avg. Loan Size in thousands of USD $170 $137 $114 $102 $127 $108 $89 $102 $117 $106
No
te R
ate
Weighted Average Note Rate at Origination(1) 6.40% 6.06% 6.60% 6.64% 6.00% 6.43% 6.75% 6.55% 6.43% 6.34%
Weighted Average Current Note Rate(1) 4.90% 4.92% 6.45% 6.50% 5.99% 6.36% 6.61% 6.45% 6.34% 6.29%
Weighted Average Effective Note Rate(2) 4.90% 4.92% 6.45% 6.50% 5.99% 6.36% 6.61% 6.45% 6.34% 6.29%
Weighted Average Terminal Note Rate (1)(3) 4.90% 4.92% 6.45% 6.50% 5.99% 6.36% 6.61% 6.45% 6.34% 6.29%
Weighted Average Terminal Effective Note Rate(2)(3) 4.90% 4.92% 6.45% 6.50% 5.99% 6.36% 6.61% 6.45% 6.34% 6.29%
Te
rm / L
TV
/ C
red
it S
co
re Weighted Average Loan Age from Origination (mos) 130 136 147 162 156 162 187 174 169 173
Weighted Average Loan Age from Modification (mos)(4) 77 72 55 74 68 52 93 68 54 55
Weighted Average Remaining Maturity (mos) 319 334 388 347 366 387 309 372 401 376
Weighted Average LTV at Origination 80% 80% 74% 79% 76% 74% 78% 76% 74% 76%
Weighted Average Updated LTV (FHFA Indexed)(5) 66% 62% 58% 56% 55% 52% 46% 50% 50% 48%
Weighted Average AVM Current LTV 68% 65% 59% 59% 56% 54% 48% 54% 53% 50%
% of Loans with AVM Current LTV >105% 0% 4% 0% 2% 0% 2% 0% 1% 1% 1%
Non-Zero Weighted Average Credit Score at Origination 686 686 671 667 676 675 669 663 671 676
Non-Zero Weighted Average Current Credit Score 679 674 651 657 660 658 671 648 649 651
Pa
y H
isto
ry /
Mo
dif
ica
tio
ns
Average Number of Months Clean Pay History 57 54 40 50 47 38 53 35 27 31
% of Loans with 12+ Months Clean Pay History 100% 100% 100% 100% 100% 100% 100% 100% 100% 100%
% of Loans with 24+ Months Clean Pay History 86% 71% 83% 68% 78% 70% 76% 49% 48% 39%
% of Loans with 36+ Months Clean Pay History 67% 61% 40% 54% 55% 45% 59% 33% 16% 25%
% of Loans modified within 24 Months 3% 15% 13% 17% 12% 13% 9% 14% 18% 37%
% of Loans modified between 25 to 36 Months 3% 29% 2% 5% 12% 22% 9% 15% 22% 10%
Servicer Nationstar SLS Nationstar SLS SLS SPS SPS SLS SPS SLS
(1) Note rates are weighted by interest bearing unpaid principal balance only
(2) Calculated as the note rate multiplied by the ratio of the aggregate unpaid interest bearing balance over the aggregate unpaid principal balance
(3) Calculated as the weighted average of the fixed-rate or maximum step-rate over the life of each Mortgage Loan
(4) Modification date is based on the later of deferred payment modification and non-deferred payment modification for deals up to and including SCRT 2018-4. Beginning with SCRT 2019-1, modification date excludes any deferred payment
modifications
(5) The updated LTVs were estimated based on the most recent FHFA Home Price Index values available as of the Cut-Off Date
(6) For SCRT 2017-4 and 2018-1, Group M45 Loans have a coupon greater than 4.50% but less than or equal to 5.50% and no initial forbearance
(7) For SCRT 2017-4 and 2018-1, Group M60 Loans have a coupon greater than 5.50% and have no initial forbearance
(8) For SCRT 2018-2, 2018-3, 2018-4, 2019-1, 2019-2 and 2019-3 Group M55 Loans have a coupon greater than 5.50% and no initial forbearance

© Freddie MacCONFIDENTIAL 64
11. Freddie Mac Key Contacts

© Freddie MacCONFIDENTIAL 65
Freddie Mac Key Contacts
Team Member Email Address Business Phone
Mike Hutchins
Executive Vice President
Head of Investments and Capital Markets
[email protected] 571-382-3660
John Glessner
Senior Vice President
Asset Liability Management and Treasurer
[email protected] 571-382-5915
Terin Vivian
Head of Loan Portfolio [email protected] 571-382-5835
Sally Baker
Securitization Programs [email protected] 571-382-5667
Bob Perret
SCRT [email protected] 571-382-1860
Diana Kim
SCRT [email protected] 571-382-5976
Michael Lam
[email protected] 571-382-4465
Jie Bai
Data and [email protected] 571-382-4687
Sally Au-Yeung
Data and [email protected] 571-382-5896
Lenore Kelly
Legal [email protected] 703-903-3366
Carmino Santomaro
Structured [email protected] 571-382-5701
Freddie Mac Investor Inquiry [email protected]


