1
Self-healing, stretchable and robust interpenetrating network hydrogels
Laura J. Macdougall,a Maria M. Pérez-Madrigal, d Joshua E. Shaw,b Maria Inam,a Judith A. Hoyland,b,c Rachel
O’Reillyd Stephen M. Richardsonb and Andrew P. Dove *d
a Department of Chemistry, University of Warwick, Coventry, CV4 7AL, UK
b Division of Cell Matrix Biology and Regenerative Medicine, School of Biological Sciences, Faculty of Biology,
Medicine and Health, Manchester Academic Health Science Centre, University of Manchester, Manchester
M13 9PL, UK
c NIHR Manchester Biomedical Research Centre , Central Manchester Foundation Trust, Manchester Academic
Health Science Centre, Manchester, United Kingdom
d School of Chemistry, University of Birmingham, Edgbaston, Birmingham, B15 2TT, UK
Contents
1. Materials and Methods ..................................................................................................................2
1.1 Instrumental methods ..................................................................................................................2
1.2 Synthesis of alkyne and thiol precursors ......................................................................................2
1.3 Hydrogel fabrication .....................................................................................................................3
1.3.1 PEG/Natural polymer hydrogel fabrication ...............................................................................3
2. Hydrogel Characterization ..........................................................................................................4
2.1Gel fraction (GF) and equilibrium water content (EWC) ...............................................................4
2.2 Rheological Testing.......................................................................................................................5
2.3 Uniaxial compressive tests ...........................................................................................................5
2.4 Uniaxial tensile tests.....................................................................................................................5
2.5 Cryogenic Scanning Electron Microscopy .....................................................................................5
2.6 Swelling and degradation studies.................................................................................................6
2.7 Mesh Size Calculations .................................................................................................................6
3. Biocompatibility studies and 3D cell encapsulation ...................................................................6
4. Supplementary Data.......................................................................................................................8
4.1 Optimization of interpenetrating networks (IPN) (PEG/Alginate system)....................................8
4.2 PEG/Natural polymer hydrogel characterization........................................................................12
4.3 Tensile characterization ..........................................................................................................14
4.4 Rheology characterization ..........................................................................................................14
4.5 Self-healing properties of the PEG/Natural Polymer hydrogels .................................................15
4.6 Biocompatibility of the PEG/Natural Polymer hydrogel materials .............................................16
5. References ................................................................................................................................16
Electronic Supplementary Material (ESI) for Biomaterials Science.This journal is © The Royal Society of Chemistry 2018
2
1. Materials and Methods
4-arm PEG-tetrahydroxyl (molar mass 2.0 kg mol-1) was purchased from JenKem Technology, USA. Sodium
alginate (Cat. no. W201502, 12-40 kDa), chitosan (Cat. no. 448869, 50-190 kDa), and gelatin (Cat. no. 48724, 50-
100 kDa) were obtained from Sigma-Aldrich USA. Heparin (Cat. no. AC411210010, 12-15 kDa) was obtained from
ACROS Organics, while hyaluronic acid (sodium salt; low molecular weight 40-50 kDa) was purchased from
Carbosynth. All other reagents were purchased from Sigma Aldrich or Fisher Scientific and used without
purification.
1.1 Instrumental methods1H NMR spectra were recorded on a Bruker DPX-400 spectrometer at 293 K. Chemical shifts are reported as δ in
parts per million (ppm) and referenced to the chemical shift of the residual solvent resonances (CDCl3: 1H δ =
7.26 ppm; (CD3)2CO: 1H δ = 2.05 ppm).
Size exclusion chromatography (SEC) was used to determine the molar masses and molar mass distributions
(dispersities, ÐM) of the synthesized polymers. SEC conducted in chloroform (CHCl3) (0.5% NEt3) used a Varian
PL-SEC 50 system equipped with 2 × PLgel 5 μM MIXED-D columns in series and a differential refractive index
(RI) detector at a flow rate 1.0 mL min-1. The system was calibrated against a Varian Polymer Laboratories Easi-
Vial poly(styrene) (PS) standard and analysed by the software package Cirrus v3.3.
SEC conducted in N,N-dimethyl formamide (DMF) (5 mM NH4BF4) used a Varian PL-SEC 50 system equipped with
2 × PLgel 5 μM MIXED-C + guard columns in series and a differential refractive index (RI) detector at a flow rate
of 1.0 mL min-1. The systems were calibrated against Varian Polymer Laboratories Easi-Vial linear poly(methyl
methacrylate) (PMMA) standards and analyzed by the software package Cirrus v3.3.
Rheological testing was carried out using an Anton Parr MCR 302 rheometer equipped with parallel plate
configuration with a diameter of 50 mm. A Peltier system was used to maintain the temperature at 20 °C
throughout the study. Data was analyzed using RheoCompass software.
Compression and tensile testing was carried out using single column universal materials testing machine M100-
1CT Testometric with a load cell of 5 kN. Data was analyzed using Wintest analysis software.
Cryogenic scanning electron microscopy (cryo-SEM) was performed on ZEISS SUPRA 55-VP equipped with cold
stage and sample preparation chamber.
Evaluation of cell viability during 3D cell encapsulation experiments was carried out using a Leica SP5 Inverted
microscope. Staining for live cells (Calcein, λEx. = 495 nm, λEm. = 515 nm) was excited with a 488 nm laser, while
staining for dead cells (Ethidium homodimer, λEx = 528 nm, λEm = 617 nm) was excited with a 514 nm laser.
3
1.2 Synthesis of alkyne and thiol precursors
Synthesis of 4-arm alkyne-functionalized PEG. To as suspension of 4-arm PEG2kOH (molar mass 2.0 kg.mol-1, 10
g, 5 mmol) in benzene (75 mL) and toluene (75 mL), was added 2 drops of concentrated H2SO4. The solution was
heated to 80 °C with stirring to obtain a clear homogenous solution. To this solution, propiolic acid (2.8 g, 40
mmol) was added and the solution was heated to reflux under Dean-Stark conditions. After no more water was
collected in the condenser (ca. 20 h) the solution was allowed to cool to room temperature and the solvents
were removed in vacuo. The resultant oil was dissolved in CH2Cl2 (100 mL) and washed with saturated NaHCO3
solution (20 mL) and brine (20 mL). The organic phase was dried (MgSO4) and stirred with charcoal (ca. 0.1 g) for
30 minutes at 40 °C. The solution was filtered through Celite® 545 and solvent was evaporated to collect product
as a clear to light yellow oil (Yield 6.1 g, 61%). 1H NMR ((CD3)2CO, 400 MHz): δ 4.32-4.35 (t, 3JHH = 8 Hz, -CH2OCO-),
3.90 (s, -CH≡CC(O)O-), 3.72-3.74 (m, -OCH2CH2O-), 3.6 (s, CCH2O); 1H NMR spectroscopy indicated ca. 93%
conversion of the hydroxyl group to propiolate group. SEC (DMF): Mn = 5.9 kg.mol-1 (ÐM = 1.08).
Synthesis of difunctional linear thiol-functionalized PEG (4 kg mol-1). In a typical esterification, as stated in the
above procedure, difunctional linear PEG4kOH (molar mass 4.0 kg.mol-1, 10 g, 2.5 mmol) was esterified with 3-
mercaptopropionic acid (2 equivalents per arm/ 0.5 kg mol-1) to collect the product as a white solid.
PEG4k(SH)2 (Yield 8.7 g, 83%). 1H NMR (CDCl3, 400 MHz): δ 4.25-4.27 (t, 3JHH = 8, -CH2OCO-), 3.65 (m, -OCH2CH2O-),
2.74-2.79 (q, 3JHH = 12, -OCCH2CH2SH), 2.66-2.69 (t, 3JHH =12, -OCCH2CH2SH), 1.65-1.69 (t, 3JHH = 8, -SH), 1H NMR
spectroscopy indicated ca. >99% conversion of the hydroxyl group to mercaptopropionate group. SEC (CHCl3):
Mn = 6.9 kg.mol-1 (ÐM = 1.10).
1.3 Hydrogel fabrication
A 1:1 molar ratio of alkyne group to thiol group was used for all gelations by thiol-yne chemistry, the precursor
content was kept at 8 wt%. In a typical procedure for making a single thiol-yne PEG gel, PEG4k-(SH)2 (32.2 mg,
7.7 10-3 mmol) was dissolved in 250 µL PBS pH 7.4 solution. A separate solution of PEG2k(C CH)4 (8.5 mg, × ≡
3.85 10-3 mmol) in 250 µL PBS pH 7.4 solution. The two solutions were mixed together on a vortex mixer for ×
5 s. The mixture was then injected into a mold suitable for the chosen analysis.
1.3.1 PEG/Natural polymer hydrogel fabrication
For the incorporation of a natural polymer into the thiol-yne PEG system the natural polymers were mixed in
solution with a single PEG precursor. In a typical procedure:
PEG/Alginate hydrogel Sodium alginate (21 mg, 1 wt%) in PBS (917 µL) was heated to 70°C and stirred for 20
minutes to dissolve. The solution was then left to cool to room temperature. In separate vials PEG2k(C CH)4 ≡
(32.6 mg, 1.48 10-2 mmol) was dissolved in PBS (509 µL) and CaCO3 (5.3 mg, 5.27 10-2 mmol) was dissolved × ×
in PBS (51 µL) The alginate, CaCO3 and PEG alkyne were then added together and vortexed. The PEG4k-(SH)2
(129.7 mg, 2.95 10-2 mmol) dissolved in PBS (509 µL) was then mixed with D-(+)-Glucono-1,5-lactone (GDL) ×
4
(18.8 mg, 0.11 mmol) dissolved in PBS (51 µL). The PEG thiol/GDL vial was then added to the PEG alkyne/
Alginate/ CaCo3 vial and mixed together on a vortex mixer for 10 s. The mixture was then injected into a mould
suitable for the chosen analysis.
PEG/Chitosan hydrogels Chitosan (20.7 mg, 1 wt%) was dissolved in 0.1 Molar hydrochloride acid (1 mL) and
added to PEG2k(C CH)4 (32.6 mg, 1.48 10-2 mmol) dissolved in PBS (334 µL) and mixed. PEG4k-(SH)2 (127.8 ≡ ×
mg, 2.91 10-2 mmol) was dissolved in PBS (334 µL) and added to glycerol phosphate (GP) (103.5 mg, 5 wt%) ×
in PBS (334 µL). The two solutions were then mixed together on a vortex mixer for 10 s. The mixture was then
injected into a mold suitable for the chosen analysis.
PEG/Gelatin hydrogels Gelatin (from porcin skin) (21 mg, 1 wt%) in PBS (1 mL) was heated to 70 °C for 20 minutes
to dissolve. The solution was allowed to cool slightly and added to PEG2k(C CH)4 (32.6 mg, 1.48 10-2 mmol) ≡ ×
dissolved in PBS (509 µL) and mixed. The Gelatin/PEG alkyne solution was then added to PEG4k-(SH)2 (129.7 mg,
2.95 10-2 mmol) dissolved in PBS (509 µL) mixed together on a vortex mixer for 10 s. The mixture was then ×
injected into a mold suitable for the chosen analysis.
PEG+Hyaluronic acid hydrogels Hyaluronic acid (HA) (20.7 mg, 1 wt%) was dissolved in PBS (1 mL) and added to
PEG2k(C CH)4 (32.1 mg, 1.46 10-2 mmol) dissolved in PBS (502 µL) and mixed. The HA/PEG alkyne solution ≡ ×
was then added to the PEG4k-(SH)2 (127.8 mg, 2.91 10-2 mmol) dissolved in PBS (502 µL) mixed together on a ×
vortex mixer for 10 s. The mixture was then injected into a mold suitable for the chosen analysis.
PEG+Heparin hydrogels Heparin (sodium salt) (20.7 mg, 1wt%) was dissolved in PBS (1 mL) and added to PEG2k(C
CH)4 (32.1 mg, 1.46 10-2 mmol) dissolved in PBS (502 µL) and mixed. The HA/PEG alkyne solution was then ≡ ×
added to the PEG4k-(SH)2 (127.8 mg, 2.91 10-2 mmol) dissolved in PBS (502 µL) mixed together on a vortex ×
mixer for 10 s. The mixture was then injected into a mold suitable for the chosen analysis.
2. Hydrogel Characterization
2.1Gel fraction (GF) and equilibrium water content (EWC)
Hydrogels were fabricated as stated in the above procedure. To determine the gel fraction (GF) the hydrogels
were lyophilized and their weights (Wg) recorded. The hydrogels were then allowed to swell in deionized water
for 3 days, with frequent changes in water to extract unreacted polymers. The hydrogels were then lyophilized
and their weights (Wr) were recorded again. All measurements were repeated in triplicate. The gel fraction was
expressed as:
𝐺𝑒𝑙 𝐹𝑟𝑎𝑐𝑡𝑖𝑜𝑛 (%) = 𝑊𝑟
𝑊𝑔 × 100 % (1)
To determine the equilibrium water content (EWC) the prepared hydrogels were allowed to swell in PBS solution
for 1 day so that swelling could reach equilibrium. The surface water was then removed with soft tissue paper
and the weights recorded (Ws). The hydrogels were then lyophilized and the weights recorded (Wd). All
measurements were repeated in triplicate. The equilibrium water content was expressed as:
5
𝐸𝑊𝐶 (%) = 𝑊𝑠 ‒ 𝑊𝑑
𝑊𝑑 × 100% (2)
2.2 Rheological Testing
All rheology was performed on an Anton Parr MCR 302 rheometer fitted with a parallel plate configuration
(diameter of 50 mm) at 20 °C. In a typical rheological test for gelation kinetics, PEG1k-(SH)2 (56.8 mg, 4.83 ×
10-2 mmol) and PEG2k-(C CH)4 (53.3 mg, 2.41 10-2 mmol) were dissolved in separate solutions of 500 µL ≡ ×
PBS pH 7.4. The two solutions were drawn up in a 1 mL syringe and injected on to the lower plate, at 20 °C. The
upper plate was immediately lowered to a plate separation of 0.5 mm and the measurement was started. A
frequency of 5 Hz and a strain of 5% was applied to minimize interference with the gelation process and keep
the measurement within the linear viscoelastic region. The normal force was also kept constant at 0 N. The
gelation kinetics was characterized by the evolution of storage moduli (G’) and loss moduli (G”) as a function of
time. The gel point was determined by the cross-over between the G’ and G”. A point was recorded each second
until the G’ and G” plateaued. The amplitude sweeps were carried out on the gel formed from this experiment.
The amplitude sweep applied a constant frequency of 10 rad s-1 and the strain was ramped logarithmically from
0.01% to 100%. The normal force was kept constant at 0 N and 6 points were recorded for each decade. All
measurements were repeated in triplicate and representative charts are shown.
2.3 Uniaxial compressive tests
All uniaxial compressive testing was performed on a Testometric M100-1CT universal mechanical testing
instrument fitted with a load cell of 1 kN. Hydrogel samples were prepared with a 2 mL syringe to give a
cylindrical shape with a diameter of 9 mm and length of 4 mm. Samples were left to cure for 1 h after forming,
to ensure the crosslinking reaction was complete before being tested. A preload force of 0.1 N was set and each
test was carried out at a compression velocity of 5 mm min-1. Each hydrogel was subject to 95% strain in order
to determine the ultimate compressive stress and strain. All compression tests were repeated 10 times and an
average of the data was taken to find the ultimate compressive stress and strain. Data was analyzed using
Wintest analysis software.
2.4 Uniaxial tensile tests
All uniaxial tensile testing was performed on a Testometric M100-1CT universal mechanical testing instrument
fitted with a load cell of 1 kN. Hydrogel samples were prepared in dog bone molds (250 µL per sample,
dimensions L=6.7 mm, W=3 mm, D= 2 mm), covered and left to cure for 7 h. Each hydrogel was then removed
and clamped into the tensile holders and subjected to a rate of elongation of 5 mm/min until the sample failed.
All tensile tests were repeated at least 10 times and an average of the data was taken to find the ultimate tensile
stress and strain. Data was analyzed using Wintest analysis software.
6
2.5 Cryogenic Scanning Electron Microscopy
Cryogenic scanning electron microscopy (cryoSEM) was performed on ZEISS SUPRA 55-VP equipped with cold
stage and sample preparation chamber. In a typical procedure, a hydrogel sample was formed in situ on a stub
and the top layer was sliced off. The stub was placed in a pre-frozen stub adaptor and frozen in liquid nitrogen
(-195 °C) which was obtained by placing the sample in liquid nitrogen under vacuum. The stub was then
transferred to the cold stage (at -125 °C) of the preparation chamber connecting to the SEM chamber. The frozen
sample was surface fractured and sublimated at -95 °C for 15 min to reveal the cross-sectional surface. The
temperature was then brought down to -125 °C and the sample was sputter coated with platinum before being
transferred under vacuum into the SEM chamber, which was kept at -186 °C for imaging. The accelerating
voltage was set at 2 kV to avoid burning the sample.
2.6 Swelling and degradation studies
Hydrogels were fabricated as stated in the above procedure and left to cure for 1 h at room temperature. The
prepared gels were then placed in PBS solution pH 7.4 and incubated at 37 °C in an orbital shaker-incubator
(Model ES-20, Grant Instruments (Cambridge) Ltd.) with a shaking speed of 80 rpm. The PBS solution was
replaced regularly to remove unreacted PEG precursors and to prevent the build-up of solute concentration. At
pre-set time intervals, the hydrogels were removed, gently blotted dry and the weight was recorded. The
swelling factor (SF) and degradation was monitored by the percentage of weight of the hydrogel at each time
point (t) compared to the weight before submersion which is defined as:
𝑆𝑤𝑒𝑙𝑙𝑖𝑛𝑔 𝐹𝑎𝑐𝑡𝑜𝑟 (%) = 𝑊𝑡
𝑊0 × 100% (3)
where is the weight measured at specific time point and is the initial wet weight before immersed (after 𝑊𝑡 𝑊0
1 h).
2.7 Mesh Size CalculationsFlory-Rehner calculations were used to determine each thiol-yne PEG hydrogel mesh size ( ).1, 2§
§ = 𝑣 ‒ 1/32 (�̅�2
0)1/2
Where = 0.04 to 0.2 for PEG3 and = the root-mean-square end-to-end distance of the polymer chain in the 𝑣2 �̅�0
unperturbed state
3. Biocompatibility studies and 3D cell encapsulation
The Y201 hTERT-immortalised human clonal mesenchymal stem cell (MSC) line (a kind gift from Prof Paul
Genever, University of York) was cultured in MEM-α medium supplemented with 10% v/v FCS, 1%
penicillin/streptomycin, 10 µM Asc-2-phos, and 5 mL Glutamax. For 3D cell encapsulation, hydrogels (n=4) were
prepared in PBS in 24-well cell culture inserts with a 0.4 μm pore PET membrane. Specifically, 400000 cells per
gel were suspended with the thiol-terminated PEG precursor solution, followed by addition of the alkyne and
7
mixing. Then, 100 μL of the solution was added into the inserts and let to gel. After 10 mins, fresh media was
added on top (100 μL) and around the hydrogel (900 μL), and cells were incubated up to 3 days. Cell viability
was assessed using alamarBlue® viability assay at different time points (i.e. 24, 48, and 72 h) according to the
manufacturer’s recommendations. Fluorescence was measured using a BioTek FLx800 plate reader (λEx. = 540
nm, λEm. = 590 nm). Cell viability was also assessed on day 1 (24 hours) and day 3 (72 h) using Live/DeadTM
Viability/Cytotoxicity Kit (Invitrogen), including calcein AM for live cells (λEx. = 495, λEm. = 515) and ethidium
homodimer for dead cells (λEx. = 528, λEm. = 617). The staining solution was prepared by adding 0.5 μL of calcein
AM and 2 μL of ethidium homodimer to 1 mL of PBS. On the day of assay, hydrogels were washed with PBS, and
the staining solution was added around (350 μL) and on top (150 μL) of the gels, which were then incubated for
30 minutes. Fluorescence imaging in three-dimensions was conducted with a Leica TCS SP5 AOBS Inverted
confocal microscope. Z-stacks with an average thickness of 200 µm were collected from different zones of each
sample, and the images were processed using ImageJ software (1.51u).
8
4. Supplementary Data
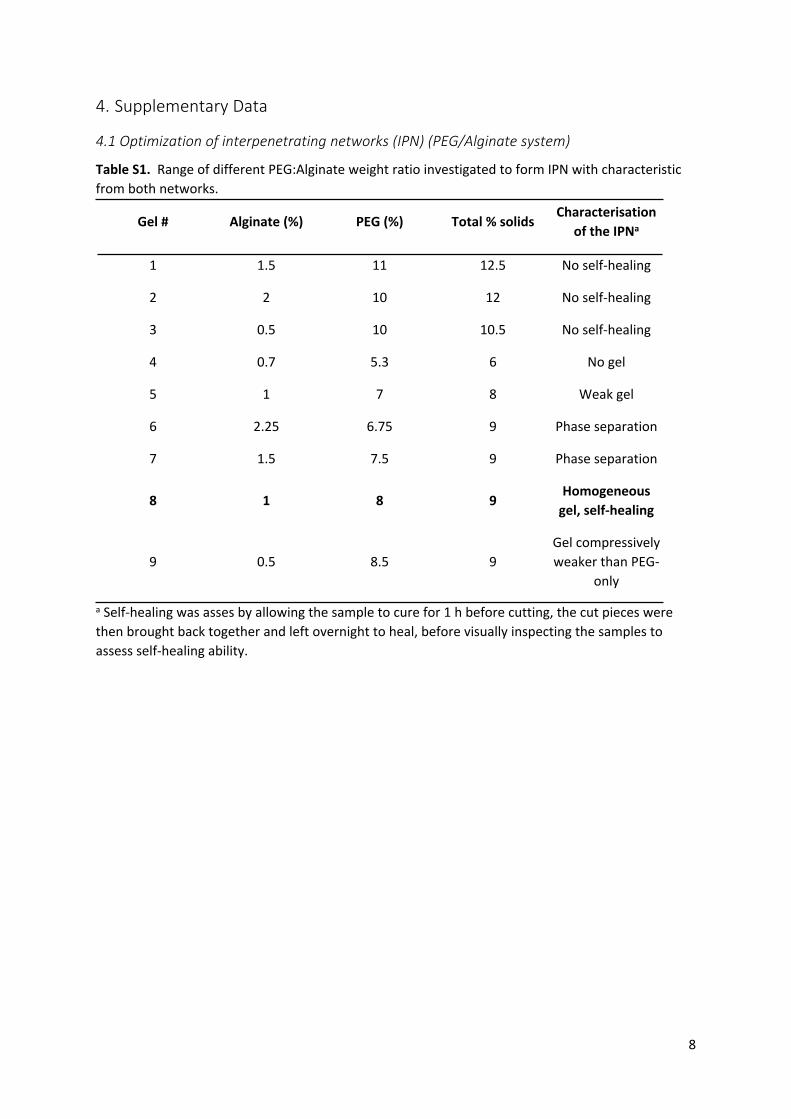
4.1 Optimization of interpenetrating networks (IPN) (PEG/Alginate system)
Table S1. Range of different PEG:Alginate weight ratio investigated to form IPN with characteristic from both networks.
Gel # Alginate (%) PEG (%) Total % solidsCharacterisation
of the IPNa
1 1.5 11 12.5 No self-healing
2 2 10 12 No self-healing
3 0.5 10 10.5 No self-healing
4 0.7 5.3 6 No gel
5 1 7 8 Weak gel
6 2.25 6.75 9 Phase separation
7 1.5 7.5 9 Phase separation
8 1 8 9Homogeneous
gel, self-healing
9 0.5 8.5 9Gel compressively weaker than PEG-
only
a Self-healing was asses by allowing the sample to cure for 1 h before cutting, the cut pieces were then brought back together and left overnight to heal, before visually inspecting the samples to assess self-healing ability.
9
1
10
100
1000
10000
0.1 1 10 100
G'a
nd G"
(Pa)
Frequency (rad s-1)
= G”
= G’
= PEG/Alginate without CaCO3
= PEG/Alginate
= 8% PEG alkyne/ 1% Alginate= 1% Alginate
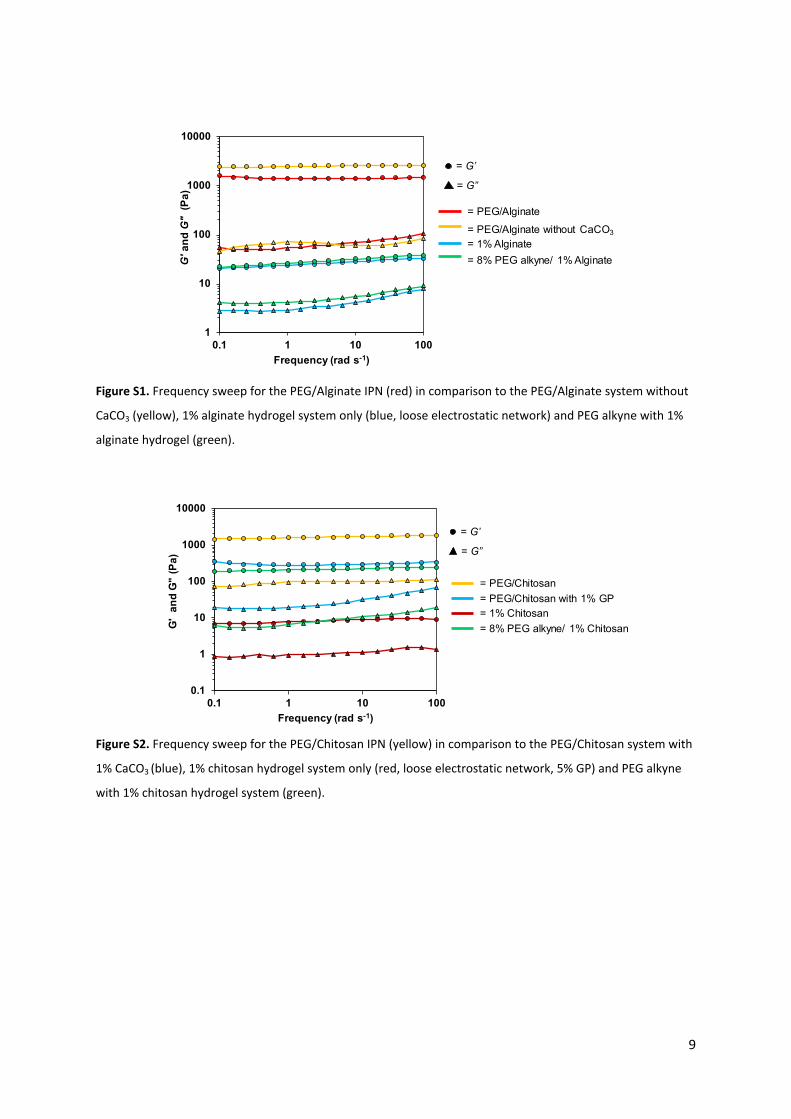
Figure S1. Frequency sweep for the PEG/Alginate IPN (red) in comparison to the PEG/Alginate system without
CaCO3 (yellow), 1% alginate hydrogel system only (blue, loose electrostatic network) and PEG alkyne with 1%
alginate hydrogel (green).
0.1
1
10
100
1000
10000
0.1 1 10 100
G'
and
G"
(Pa)
Frequency (rad s-1)
= PEG/Chitosan with 1% GP= PEG/Chitosan
= 8% PEG alkyne/ 1% Chitosan= 1% Chitosan
= G”
= G’
Figure S2. Frequency sweep for the PEG/Chitosan IPN (yellow) in comparison to the PEG/Chitosan system with
1% CaCO3 (blue), 1% chitosan hydrogel system only (red, loose electrostatic network, 5% GP) and PEG alkyne
with 1% chitosan hydrogel system (green).
10
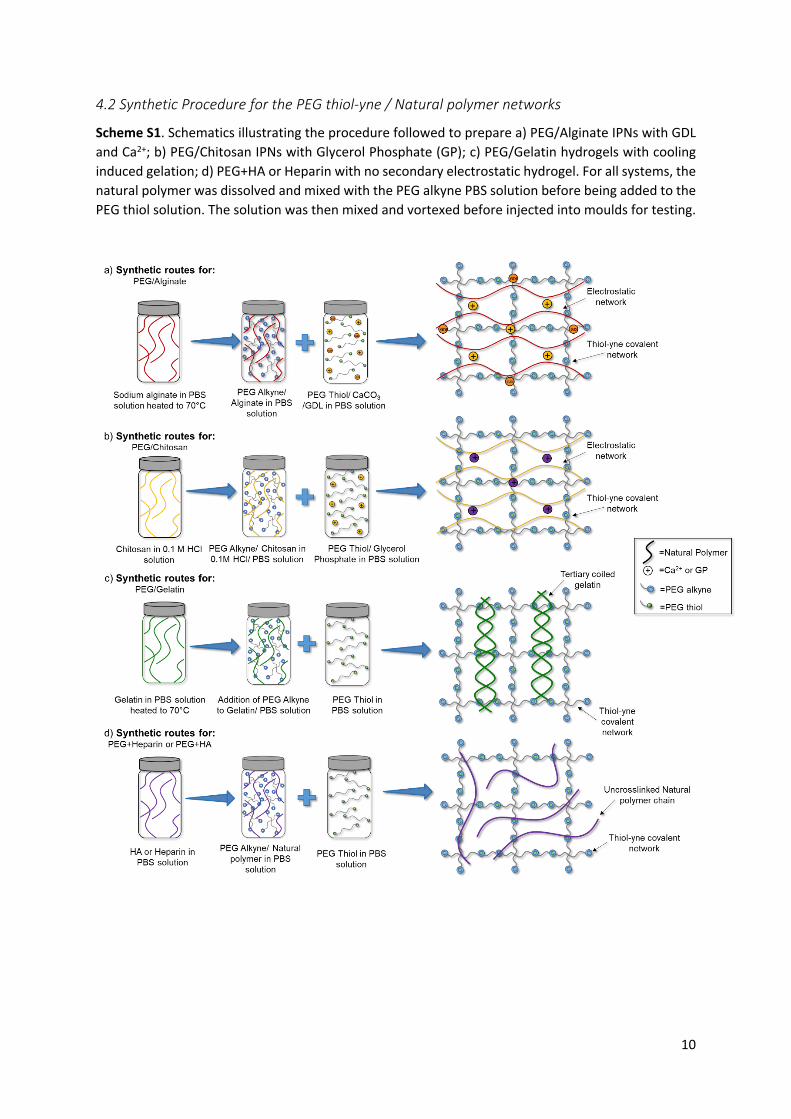
4.2 Synthetic Procedure for the PEG thiol-yne / Natural polymer networks
Scheme S1. Schematics illustrating the procedure followed to prepare a) PEG/Alginate IPNs with GDL and Ca2+; b) PEG/Chitosan IPNs with Glycerol Phosphate (GP); c) PEG/Gelatin hydrogels with cooling induced gelation; d) PEG+HA or Heparin with no secondary electrostatic hydrogel. For all systems, the natural polymer was dissolved and mixed with the PEG alkyne PBS solution before being added to the PEG thiol solution. The solution was then mixed and vortexed before injected into moulds for testing.
11
Table S2. Synthetic details for the preparation of the PEG/Natural polymer hydrogels.
PEG/Natural Polymera
AlkynePBS solution
ThiolPBS solution
Synthetic details
PEG/Alginate
Alginate
CaCO3 (0.2 wt%)
d-(+)-glucono-1,5-lactone (GDL) (1 wt%)
Alginate in PBS solution and heated to 70 °C to dissolved then added to PEG alkyne
solution
PEG/Chitosan ChitosanGlycerol Phosphate
(GP) (5 wt%)
Chitosan dissolved in 0.1 M HCl before addition to PEG alkyne
solution
PEG/Gelatin Gelatin -Gelatin heated to 70 °C to
dissolve before addition to PEG alkyne solution
PEG/Heparin Heparin - No additional required
PEG/HA HA - No additional required
a All PEG/Natural polymer networks were made at 8 wt%:1 wt%(PEG:Natural polymer) ratio
4.3 PEG/Natural polymer hydrogel characterization
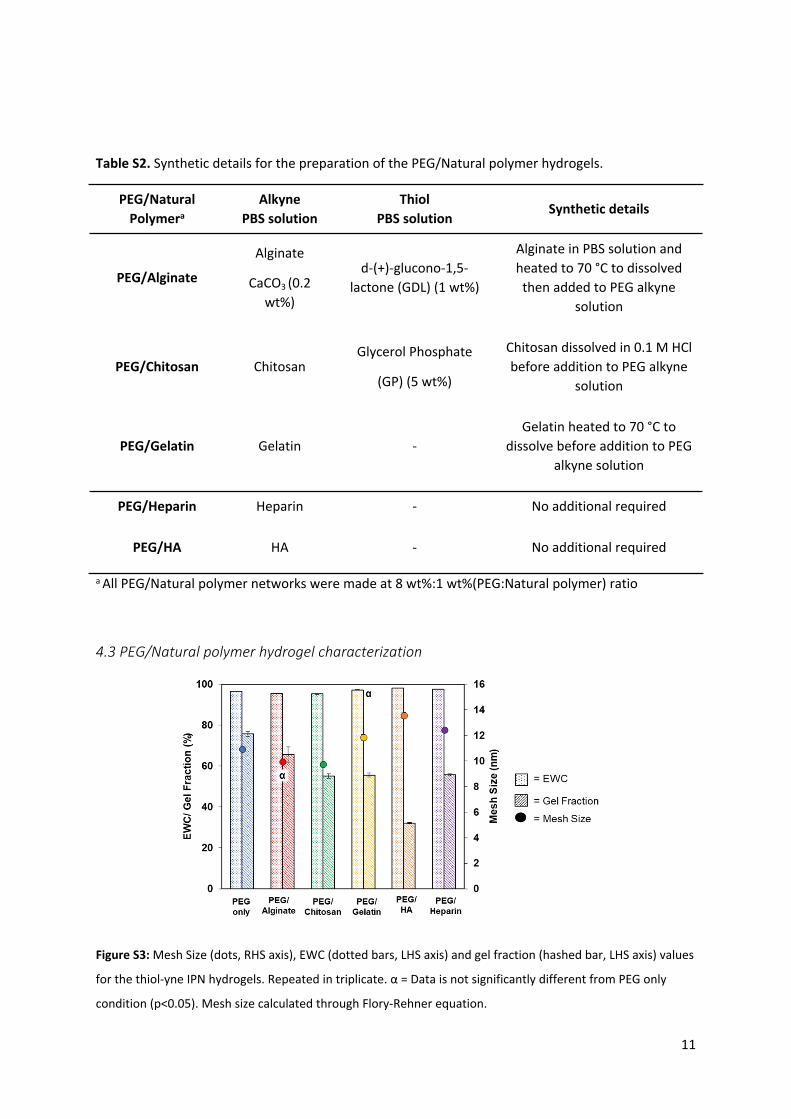
Figure S3: Mesh Size (dots, RHS axis), EWC (dotted bars, LHS axis) and gel fraction (hashed bar, LHS axis) values
for the thiol-yne IPN hydrogels. Repeated in triplicate. α = Data is not significantly different from PEG only
condition (p<0.05). Mesh size calculated through Flory-Rehner equation.
12
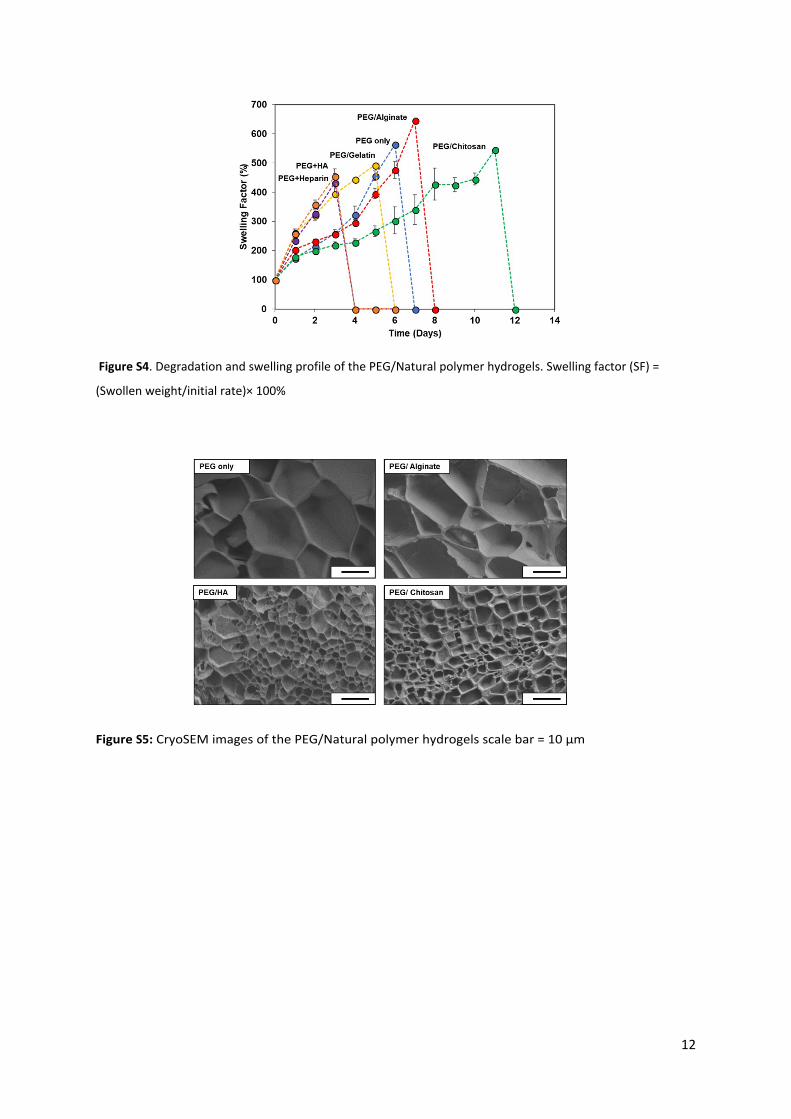
Figure S4. Degradation and swelling profile of the PEG/Natural polymer hydrogels. Swelling factor (SF) =
(Swollen weight/initial rate)× 100%
Figure S5: CryoSEM images of the PEG/Natural polymer hydrogels scale bar = 10 μm
13
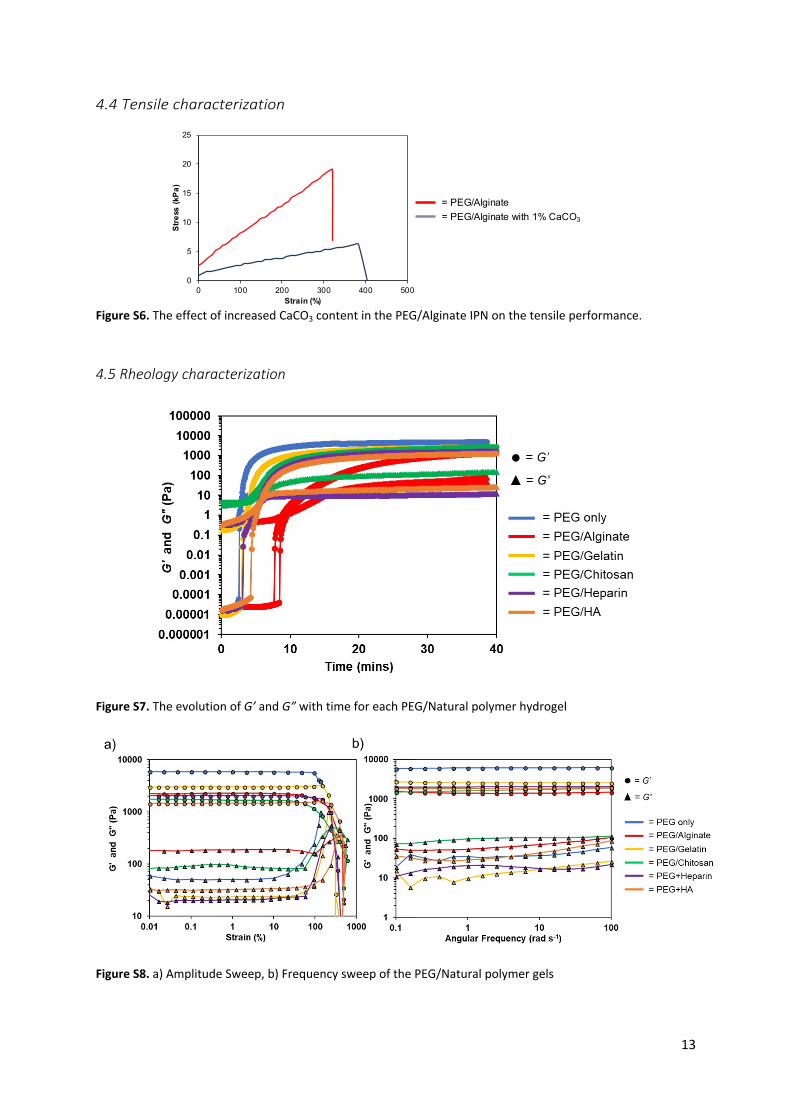
4.4 Tensile characterization
Figure S6. The effect of increased CaCO3 content in the PEG/Alginate IPN on the tensile performance.
4.5 Rheology characterization
Figure S7. The evolution of G’ and G” with time for each PEG/Natural polymer hydrogel
Figure S8. a) Amplitude Sweep, b) Frequency sweep of the PEG/Natural polymer gels
0
5
10
15
20
25
0 100 200 300 400 500
Stre
ss (
kPa)
Strain (%)
= PEG/Alginate with 1% CaCO3
= PEG/Alginate
14
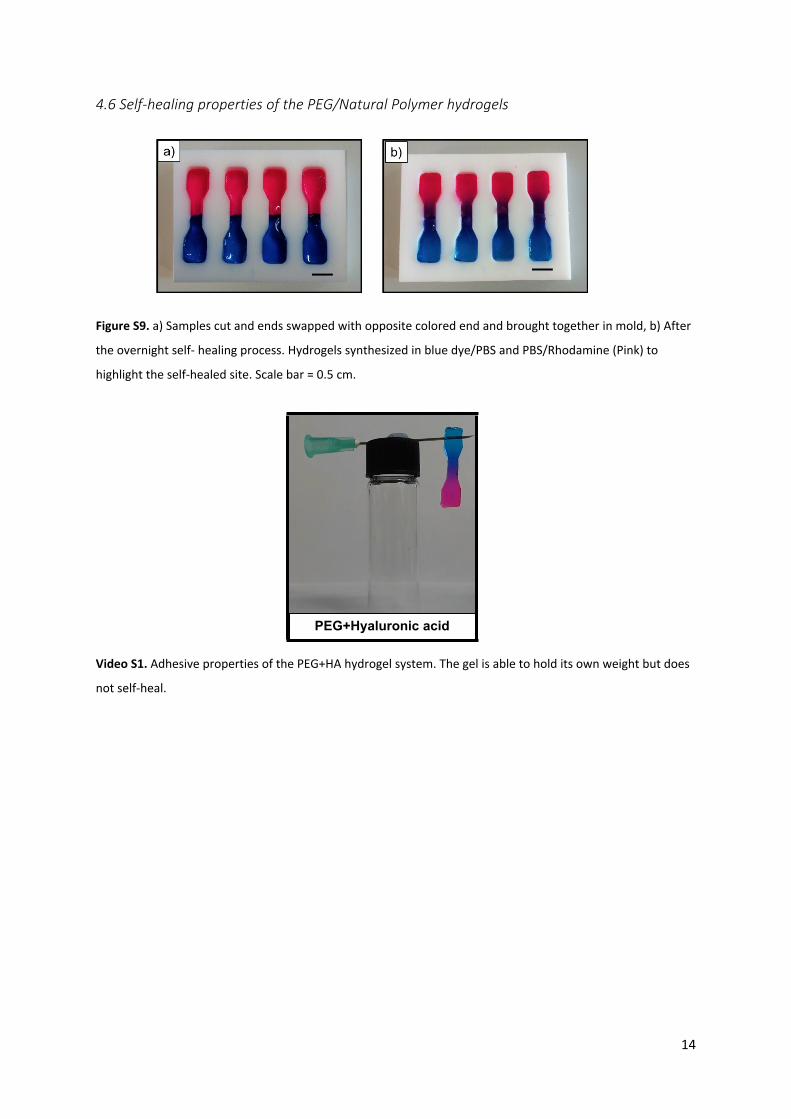
4.6 Self-healing properties of the PEG/Natural Polymer hydrogels
Figure S9. a) Samples cut and ends swapped with opposite colored end and brought together in mold, b) After
the overnight self- healing process. Hydrogels synthesized in blue dye/PBS and PBS/Rhodamine (Pink) to
highlight the self-healed site. Scale bar = 0.5 cm.
Video S1. Adhesive properties of the PEG+HA hydrogel system. The gel is able to hold its own weight but does
not self-heal.
PEG+Hyaluronic acid
15
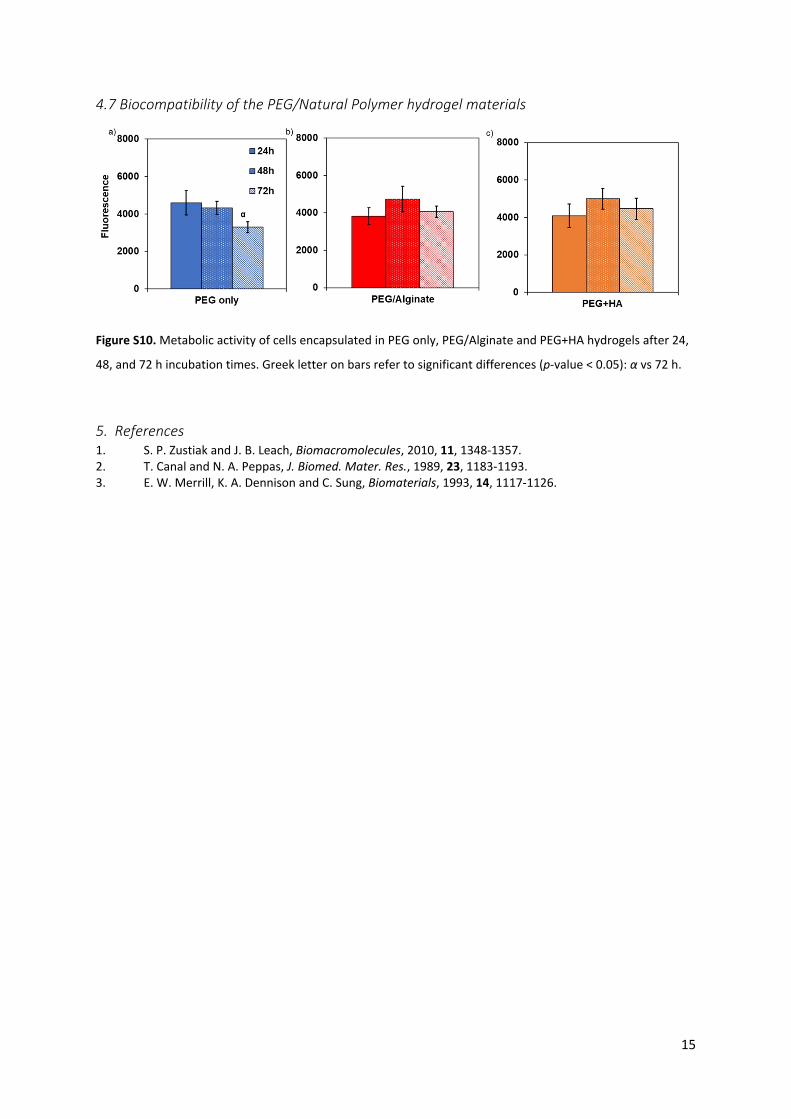
4.7 Biocompatibility of the PEG/Natural Polymer hydrogel materials
Figure S10. Metabolic activity of cells encapsulated in PEG only, PEG/Alginate and PEG+HA hydrogels after 24,
48, and 72 h incubation times. Greek letter on bars refer to significant differences (p-value < 0.05): α vs 72 h.
5. References1. S. P. Zustiak and J. B. Leach, Biomacromolecules, 2010, 11, 1348-1357.2. T. Canal and N. A. Peppas, J. Biomed. Mater. Res., 1989, 23, 1183-1193.3. E. W. Merrill, K. A. Dennison and C. Sung, Biomaterials, 1993, 14, 1117-1126.


