
SIGNIFICANT FACTORS AFFECTING
CONSTRUCTION PRODUCTIVITY
ZHAO YING
NATIONAL UNIVERSITY OF SINGAPORE
2004

SIGNIFICANT FACTORS AFFECTING
CONSTRUCTION PRODUCTIVITY
ZHAO YING
(B. Eng)
A THESIS SUBMITTED
FOR THE DEGREE OF MASTER OF ENGINEERING
DEPARTMENT OF CIVIL ENGINEERING
NATIONAL UNIVERSITY OF SINGAPORE
2004

ACKNOWLEDGEMENT
The research presented in this thesis was undertaken at the Department of Civil
Engineering of National University of Singapore.
First of all, I would like to express my sincere gratitude and appreciation to my
supervisor Associate Professor David Chua Kim Huat, for his continued guidance,
constructive comments, and encouragement during the period of my research.
I am also grateful to Dr Wang ShouQing for his valuable advice and encouragement for
my research.
My thanks go to all the participants in the questionnaire survey, and all my friends who
gave me help and support during this study period.
Special thanks are due to my dear parents, my sister Zhao Rui and my family in China for
their care, support with their deepest love to me.
The most of importantly, my husband Liu Yang, for his encouragement and keeping me
company all these years. His supports from all of the aspects gave me the strength to
carry on the study, without which this thesis would have been impossible.
At last but not least, appreciation is extended to National University of Singapore for the
generous offer of research scholarship.
i
TABLE OF CONTENTS
ACKNOWLEDGEMENT i
TABLE OF CONTENTS ii
SUMMERY vii
NOMENCLATURE ix
LIST OF FIGURES xi
LIST OF TABLES xiii
LIST OF PHOTOGRAPHS xiv
CHAPTER 1 INTRODUCTION 1
1.1 Background 1
1.2 Objectives 3
1.3 Methodology 4
1.4 Organization of thesis 4
CHAPTER 2 OVERVIEW OF CONSTRUCTION PRODUCTIVITY 6
2.1 Introduction 6
2.2 Concept & measurement of productivity in construction 6
2.2.1 Concept of productivity 6
2.2.2 Measurement of construction productivity 7
2.2.3 Input factors 8
2.2.4 Output factors 9
ii
2.3 Review of the factors affecting productivity 10
2.4 Overview of the operation content on the site 13
CHAPTER 3 CONCEPTUAL MODEL AND STUDY PROCEDURE 18
3.1 Introduction 18
3.2 Conceptual model 18
3.2.1 Starting point for the model 19
3.2.2 The second layer of the model 22
3.2.3 The third layer of the model 24
3.3 Stratified model for factors affecting productivity 26
3.4 The procedure of the study 28
CHAPTER 4 DATA COLLECTION 30
4.1 Introduction 30
4.2 The interview 30
4.2.1 Interview target and result 31
4.3 The survey 34
4.3.1 Survey objective 34
4.3.2 Design and organization of the questionnaire survey 34
4.3.3 Survey target 35
4.3.4 Survey feedback 36
CHAPTER 5 THE RELATIONSHIP BETWEEN PRODUCTIVITY AND WASTES 40
iii

5.1 Introduction 40
5.2 Adoption of neural network approach 40
5.3 Configuration of the neural network model 42
5.4 Result 47
5.4.1 Result of the model with all the variables 47
5.4.2 Identification of the critical variables 48
CHAPTER 6 ANALYSIS ON PROJECT LEVEL 53
6.1 Introduction 53
6.2 Methodology 53
6.3 Statistical index 55
6.3.1 The correlation coefficient R 55
6.3.2 Significance of the model 56
6.4 Results and discussion 57
6.4.1 Analysis of crews’ interference 57
6.4.2 Analysis of waiting due to inspection 59
6.4.3 Analysis of waiting for equipment 61
6.4.4 Analysis of waiting for instruction 64
6.4.5 Analysis of waiting for materials 66
6.4.6 Analysis of rework due to design change 69
6.5 Summary 71
CHAPTER 7 CASE STUDIES 77
iv
7.1 Introduction 77
7.2 Description of cases 77
7.3 The project-level factors 78
7.3.1 The project features 78
7.3.2 PM’s feature 85
7.3.3 Design 86
7.3.4 Organization 87
7.3.5 Project management 89
7.3.6 Summary of the project-level factors for the cases 93
7.4 Working conditions 94
7.5 Productivity performance 96
7.6 Proposal for Case A 99
7.7 Summary 100
CHAPTER 8 Conclusions and recommendations 101
8.1 Conclusions 101
8.2 Limitation 103
8.3 Recommendation 104
REFERENCES 106
APPENDIX A Questionnaire on project-level factors 110
APPENDIX B Weekly site performance record 112
v

APPENDIX C Rating of project-level factors 113
APPENDIX D Result of weekly site performance 115
APPENDIX E Question list for interview 117
vi
SUMMARY
Low productivity in the construction industry has long been a great concern, and several
studies have been focused on the identification of the productivity’s factors. Although
many factors were identified through these studies, further research on the relationship
between different factors was seldom carried out.
In this research, a study was conducted to recognize the significant factors for the low
productivity in Singapore construction industry. The focus was on the relationship among
different factors through qualitative and quantitative analysis, so as to identify the most
direct factors and their root causes. Based on this, a stratified model for factors affecting
productivity, was built to present the cause-effect relationship among factors of different
levels, which include factors on activity level and factors on project level. Unproductive
activities were regarded as the root cause for the loss of productivity. The unproductive
activities (waiting, rework, and idling) were the result of the work conditions, which
should be traced to the project-related factors. To verify the validity of the conceptual
model, a systematical procedure of study was designed.
Firstly, based on the interviews with some experienced construction personnel, a list of
common unproductive activities on site was determined. A structured survey was then
conducted on the selected 8 projects. Project performance, including wasted man-hours
and productivity data, was tracked for six months by weekly log sheets.
vii
Secondly, a neural network model was developed to identify the significant unproductive
activities that heavily affect productivity. Altogether eight waste sources were deemed to
be sufficiently significant. These were as follows: waiting due to crews’ interference;
waiting due to equipment sharing; setup of equipment; waiting for instruction; waiting for
inspection; rework due to design change; waiting due to stock problems; and material
vendor delay.
In the next step of the study, various regression analyses were developed between every
unproductive activity and each project-related factor. The project-level factors that have
high correlation with the critical wastes were analyzed, and a set of criteria for organizing
and executing the project was developed to help manager allocate the limited resources
for the purpose of minimizing the on-site wastes.
Finally, two cases were studied to demonstrate the validity of the proposed criteria and
determine the critical waste affecting productivity. According to the comparison and
analysis of these cases, it is recognized that the project that meets the project-level
criteria better has less manpower wasted on site, and performs the work more
productively.
viii
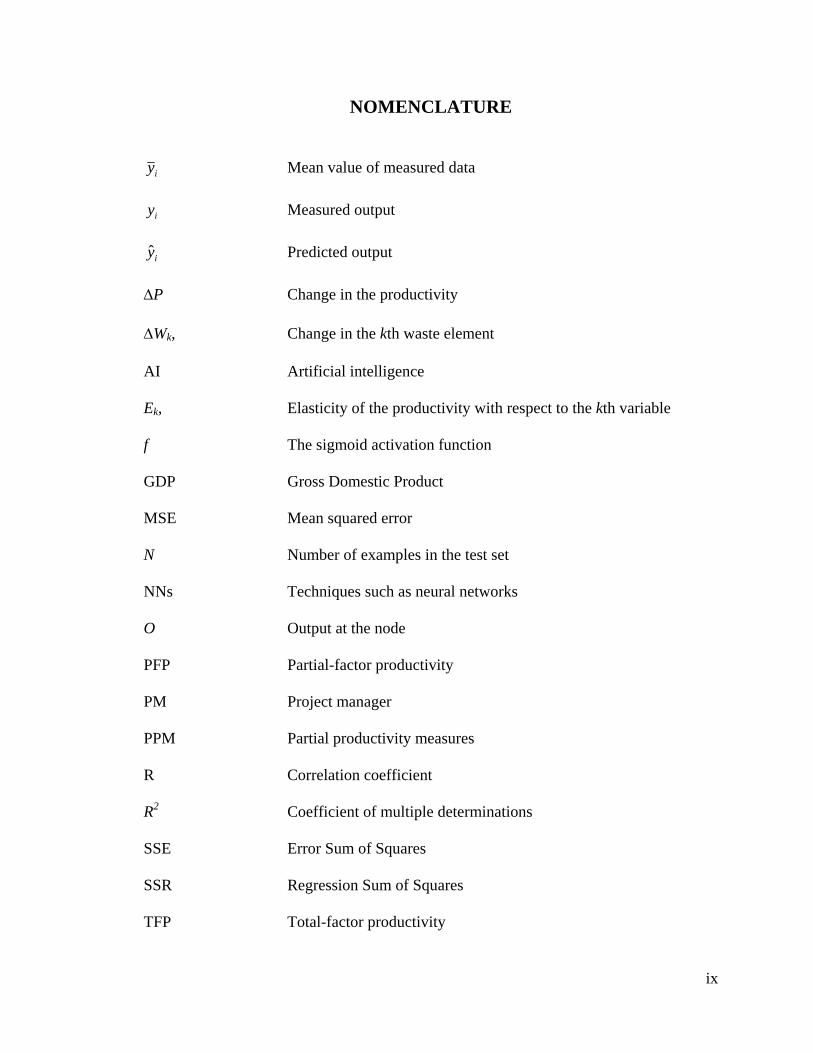
NOMENCLATURE
iy Mean value of measured data
iy Measured output
iy Predicted output
∆P Change in the productivity
∆Wk, Change in the kth waste element
AI Artificial intelligence
Ek, Elasticity of the productivity with respect to the kth variable
f The sigmoid activation function
GDP Gross Domestic Product
MSE Mean squared error
N Number of examples in the test set
NNs Techniques such as neural networks
O Output at the node
PFP Partial-factor productivity
PM Project manager
PPM Partial productivity measures
R Correlation coefficient
R2 Coefficient of multiple determinations
SSE Error Sum of Squares
SSR Regression Sum of Squares
TFP Total-factor productivity
ix

TPM Total productivity measures
Wi Corresponding weight
Xi The ith input
x

LIST OF FIGURES
Figure 2.1 Assembling operation time elements 14 Figure 2.2 Basic time components 16 Figure 3.1 Relationship between work element and productivity 20 Figure 3.2 Sources for unproductive activities 23 Figure 3.3 Relationship between project-level factors and work environment 25 Figure 3.4 Stratified model for factors affecting productivity 27 Figure 3.5 Procedure of the study 28 Figure 4.1 Monthly productivity of carpentry crews 37 Figure 4.2 The percentage of different wastes on site 39 Figure 5.1 Neural network architecture with two hidden layers 42 Figure 5.2 Schematic diagram of a processing element 43 Figure 5.3 Typical graphs of average error graphics during training 45 Figure 5.4 Actual training graphics 46 Figure 5.5 Simulated and actual productivity for the 20-input neuron model 48 Figure 5.6 Simulated and actual productivity for the 8-input neuron model 51 Figure 7.1 Original working sequences 81 Figure 7.2 New working sequences 82 Figure 7.3 Comparison of wastes of Projects A and B 96 Figure 7.4 Crews’ monthly productivity of Projects A and B 97
xi

Figure 7.5 Monthly productivity of Projects A and B 98 Figure 7.6 Productivity trend for Projects A and B 98
xii
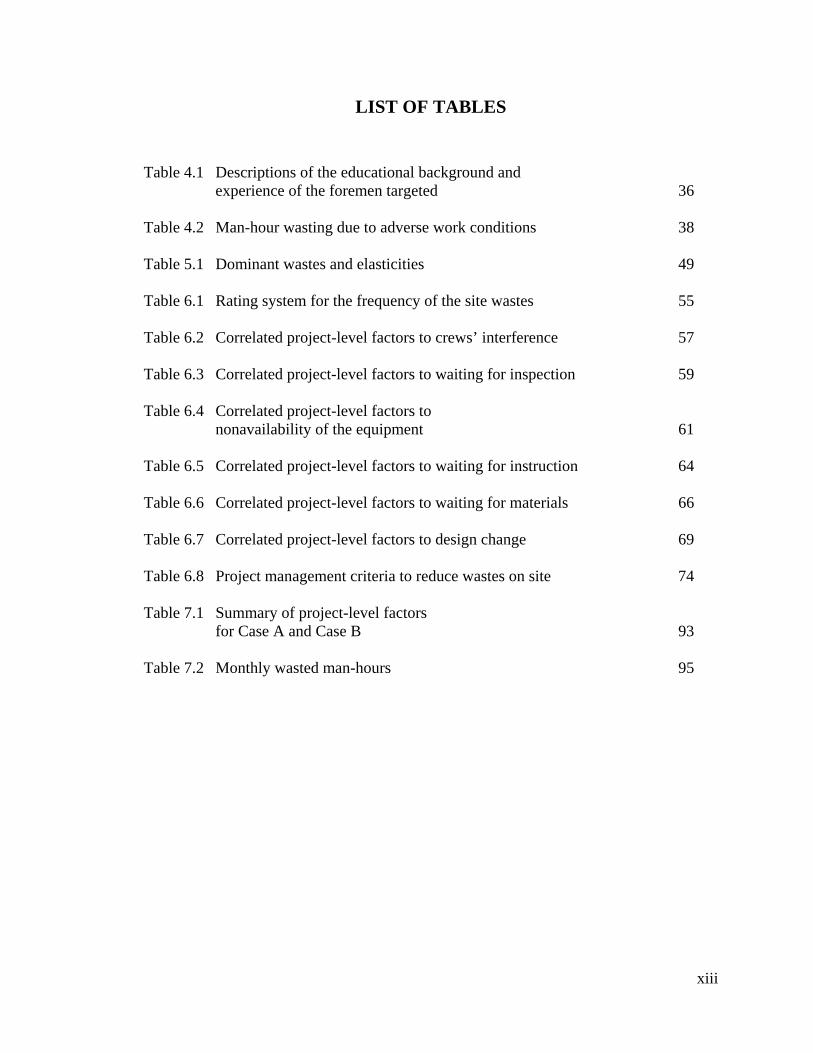
LIST OF TABLES
Table 4.1 Descriptions of the educational background and experience of the foremen targeted 36 Table 4.2 Man-hour wasting due to adverse work conditions 38
Table 5.1 Dominant wastes and elasticities 49
Table 6.1 Rating system for the frequency of the site wastes 55
Table 6.2 Correlated project-level factors to crews’ interference 57
Table 6.3 Correlated project-level factors to waiting for inspection 59
Table 6.4 Correlated project-level factors to nonavailability of the equipment 61 Table 6.5 Correlated project-level factors to waiting for instruction 64
Table 6.6 Correlated project-level factors to waiting for materials 66
Table 6.7 Correlated project-level factors to design change 69
Table 6.8 Project management criteria to reduce wastes on site 74
Table 7.1 Summary of project-level factors for Case A and Case B 93 Table 7.2 Monthly wasted man-hours 95
xiii

LIST OF PHOTOGRAPHS Picture 7.1 The site of Project A 79
Picture 7.2 The access of Project B 85
Picture 7.3 Material storage of Project A (1) 90
Picture 7.4 Material storage of Project A (2) 91
Picture 7.5 Material storage of Project B 92
xiv
CHAPTER 1
INTRODUCTION
1.1 BACKGROUND
The construction industry has been traditionally regarded as a labor-intensive industry.
The production in this area has the features of large scale, open job sites, and extensive
fragmentation in the process. Therefore the construction industry has long been regarded
as an “incredibly inefficient” sector (Dacy, 1965). The industry’s relatively low
productivity growth compared with other sectors such as the manufacturing industry has
caused its performance to be a great concern to clients and decision-makers.
In Singapore, low productivity in construction was identified as one of the major
problem of the construction industry. According to the 1992 CIDB Construction
Productivity Task Force report, the construction sector in Singapore was perceived as a
low productivity sector compared to the country’s manufacturing sector and the
construction sector of other developed countries. Because of its labor-intensive nature,
1
the construction industry in Singapore employs a disproportionately large share of the
nation’s total workforce pool in relation to its contribution to the economy. As an
economic sector, construction contributed 6% of the country’s Gross Domestic Product
(GDP), but took up 7.5% of the total workforce. Over the 10-year period from 1982
to1991, the construction productivity in Singapore had increased at an average rate of
3.1%, which is below the 4.2% rate for the whole Singapore economy, which
demonstrated that the construction industry is lagging behind the national development.
The reasons for this situation include the separation of design and construction phases; a
transient pool of largely low-cost, unskilled foreign labor; and the still economical,
traditional labor-intensive construction systems.
Since labor in Singapore is in very short supply, the industry relies heavily on foreign
skilled and unskilled workers (i.e., about 80% of construction labor being foreign
workers). While that may have overcome labor shortages in the industry, the problem of
low productivity associated with the readily available pool of cheap foreign labor
abounds. As a result of this cheap and low class labor, there is little incentive for
contractors to improve construction methods by introducing technological advancements.
With the government’s policy of controlling the number of foreign workers in Singapore
in recent years, the industry is facing the pressure to reduce its dependency on labor.
Consequently, a series of schemes, such as prefabrication and a buildable-design
mechanization programme, has been introduced by the government to encourage, assist,
and support the effort to improve construction productivity.
2
At the same time, the attempts to identify the reasons for low productivity never ceased,
especially to distinguish the critical causes. If the effort to enhance productivity
performance can be devoted in the right direction, then measures for improvement will be
taken efficiently. Although several studies have been done on factors affecting
productivity, and most of the factors are identified, further research on the relationship
between different factors is seldom carried out. In this research, a study is conducted to
recognize the significant factors for the low productivity in Singapore construction
industry. The focus is on the relationship among different factors through quality and
quantity analysis, so as to identify the most direct factors and their root causes.
1.2 OBJECTIVES
Evaluating the productivity performance is a rather complex problem, for almost all the
factors involved in a project will affect its productivity. Many existing researches dealt
with influential factors of productivity in a more qualitative manner; important factors
were simply identified but not quantified, nor were relationships with other factors
established. The present study qualitatively and quantitatively identifies critical factors
leading to the loss of productivity, and the cause-effect relationship between these critical
factors, and allowing the project organizational-level factors to be determined. Findings
from this research can provide managers with some guidelines and strategy to help them
efficiently plan and execute their projects in such a way as to enhance productivity. The
following objectives of the study are to be achieved:
3
• To investigate the common wastes (normally called unproductive activities) on
site that influence productivity.
• To find out the most significant wastes for productivity.
• To recognize the root causes for the significant wastes.
1.3 METHODOLOGY
The research was conducted through a combination of literature review, personal
interview, questionnaire survey, and analysis. The first few months’ literature review
provided a basic recognition of influential factors of construction productivity. From this
a basic framework was formed on the conceptual model of construction productivity.
After several interviews with the professionals, the usual wastes on site were determined,
and a carefully designed questionnaire was sent out to eight on-going projects to get the
information on work and project performance.
After enough data and information were acquired, a model of significant influential
wastes for construction productivity was developed as a neural network. Then the causes
for these significant wastes were traced to the project level. The purpose of case studies is
to examine the critical factors through pertinent examples that provide some evidence of
similar results and enable analytical generalizations to be made.
1.4 ORGANIZATION OF THESIS
Subsequent parts of the thesis are organized in the following sequence:
4
Chapter 2 gives a general overview of construction productivity and its influential factors.
Based on the literature review, a conceptual model of the construction productivity is
built, and the procedure of this study is designed in Chapter 3.
Chapter 4 describes the structured survey and the procedure of the data collection in
detail.
Chapter 5 analyzes the data with a neural network. The significant wastes on site are
distinguished. Chapter 6, with statistical analysis, determines the influential factors of
productivity on project level.
In Chapter 7, two cases are studied to examine the validity of the proposed relationship
identified among the productivity performance, work conditions, and organizational
factors. The analysis of the cases basically demonstrated its effectiveness.
Finally, chapter 8 presents the conclusions and the recommendations of the research, and
provides some suggestions regarding on future research.
5
CHAPTER 2
OVERVIEW OF CONSTRUCTION PRODUCTIVITY
2.1 INTRODUCTION
This chapter will review the literature on the definition and measurement of productivity,
previous research relating to the factors affecting productivity, and the activities on site.
2.2 CONCEPT & MEASUREMENT OF PRODUCTIVITY IN CONSTRUCTION
2.2.1 Concept of Productivity
There is no universal definition for productivity; the term has different meanings for
different people (Adrian, 1987). Generally, productivity is the relationship between the
output produced and one or more of the associated inputs devoted to the production
process (National Research Council, 1979). Productivity may be defined as the ratio of
output to input, via the arithmetical ratio between the amounts produced (output) and the
amount of any resources used during the process of production (input) (Chan &
Kumaraswamy, 1995). In essence, it is a measure of how well we make use of the
6

available resources effectively to produce the goods. A high productivity level represents
good use of resources and high returns.
There is divergence in opinion on how to measure output and input. A vast number of
output-to-input ratios can be created; no single productivity measure works for all
purposes. The selection of an appropriate concept of productivity depends on the
objective of measurement, availability of data, and the researcher’s preference.
2.2.2 Measurement of Construction Productivity
Productivity measurement can be categorized into partial productivity measures (PPM)
and total productivity measures (TPM) (Riggs and Felix, 1983).
Productivity is a parameter to evaluate the effectiveness of converting the resources into
the products. These resources (input) include manpower, management, material, capital,
technology, and equipment. Productivity expressed in relation to all of these factors is
termed total-factor productivity (TFP):
Total-factor productivity =input Totaloutput Total …(2.1)
Dacy (1965) and Koch and Maovenzadeh (1979) studied total factor productivity at the
industry level.
7

Other measures consider the relationships between output and a particular input or an
incomplete combination of inputs. These are referred to as partial-factor productivity
(PFP):
Partial-factor productivity =input Partial
output Total …(2.2)
The most popular partial-factor productivity are labor productivity and capital
productivity.
2.2.3 Input Factors
The input factors comprise all the resources devoted to the production, such as labor,
materials, management, capital, technology, and equipment. Expression in monetary
value is possibly the best method of combining all forms of inputs. However, some of the
inputs--like management and technology--are difficult to completely quantify and convert
to precise monetary values. Furthermore, the price effect of business cycles, such as
inflation, artificially affects the value.
Since in this labor-intensive industry, labor is often the greatest factor in overall
construction production, and constitutes a large part of construction costs, it is more
susceptible to management decisions than other resources and is more easily quantifiable
(Olomolaiye et al., 1998). Thus labor productivity is more significant to the construction
industry, and its input can be measured as man-hours or man-days.
8

2.2.4 Output Factors
The output factors vary depending on the level and the type of work for which
productivity is measured. At the national level, productivity is measured as Gross
Domestic Product (GDP) per worker. Across the economic sectors, it is measured as
value added per worker. The added value is the value of a firm’s output minus the value
of the intermediate goods that are consumed in production, such as materials, equipment,
and fuel. At the production level, the output factors for construction work can be
measured in terms of either physical unit or dollar value.
However, measuring output in terms of value added for a firm has some difficulties.
Firstly, it tends to reveal a firm’s management ability, especially the weaknesses in its
effectiveness, efficiency, and profitability. Consequently, construction firms often are not
willing to provide such information. Secondly, price effects of business cycles, such as
inflation, artificially affect data on output. Thirdly, the intermediate goods are so large
and complex that thorough and careful analysis is needed.
For the construction project manager and site manager, output in terms of a particular
task, such as volume of concrete placed or area plastered, is possibly more valuable, and
can express the progress of the project more specifically. Therefore, at the production
level the output is usually measured in physical units. For example, the productivity of
building construction is generally measured as the square meters of built-up area per
man-day, especially in some developed countries, such as Japan and Finland (CIDB,
9
1992). In the present study the area of formwork done per man-hour will be used as the
productivity indicator.
Productivity =hoursMan
areaFormwork …(2.3)
2.3 REVIEW OF THE FACTORS AFFECTING PRODUCTIVITY
The factors affecting productivity have been attracting much attention from the
researchers in the field of construction management. A number of studies on this topic
have been done from different points of view.
Adrian (1987) classified the factors causing low productivity as industry-related factors,
labor-related factors, and management related factors. Industry-related factors essentially
are the characteristics of the construction industry, such as uniqueness of construction
projects, varied locations, adverse and uncertain weather, and seasonality. Labor-related
factors include the union’s influence, little potential for learning, and lack of worker
motivation. Management-related factors mainly refer to lack of management of tools or
techniques.
Olomolaiye et al. (1998) divided the productivity factors into two categories, external
factors representing those outside the control of the firm’s management, and internal on
behalf of those originating within the firm, respectively. From his viewpoint, the nature
of the industry, mainly the separation of design and construction functions, has affected
construction productivity through waiting for drawings, design changes, and subsequent
rework. The construction clients have sometimes been impediments to construction
10
productivity because of their lack of adequate knowledge of construction procedures.
Moreover, being an outdoor industry, construction performance is usually very much
affected by the weather conditions. The level of economic development also affects
productivity. When the economy booms with more money available to carry out
developmental projects, construction industry productivity should increase. In addition to
the factors described above, health and safety legislation, procurement policies, and codes
of practices are further external factors influencing site practice and productivity. In the
internal category, management inadequacies could result in a waste of resources with
consequent losses in productivity; adoption of advanced technology and training for the
labor would improve productivity.
Thomas and Sakarcan (1994) built a model to present the factors affecting labor
productivity. In the model, two groups of factors codetermine the productivity
performance, namely, work environment and work to be done. Work-Environment
factors refer to how well a job is organized and managed. Work to be done, or work
content, relates to work that needs to be done and encompasses physical components of
work, specification requirements, and design details. Ginther (1993) conducted a study to
show that work to be done could influence the total cumulative labor resources by as
much as 15%, whereas work environment can influence labor requirements by an
additional 25%.
Based on this factor model, several researches have been carried out in further detail. One
study suggested that scheduled overtime always leads to losses of efficiency because of
11

the inability to provide materials, tools, equipment, and information at an accelerated rate.
(Thomas and Raynar, 1997) Through a case study (Thomas, 2000), slow down of the
work due to the normal workflow being interrupted has been investigated. Work
inefficiency would occur both when the work amount was larger and when it was less
than the normal level. Thomas et al. (1989) identified five material-management
conditions that could affect site performance; these are organization of storage areas,
housekeeping, planning of material deliveries, material availability, and material handling
and distribution.
Surveys and interviews are typical methods that have already been adopted in many
studies on productivity. Lim and Alum (1995) conducted a survey of top civil
engineering and building contractors to identify the factors affecting productivity in
Singapore. The three items of greatest concern were identified as difficulty in the
recruitment of supervisors, difficulty in the recruitment of workers, and a high rate of
labor turnover. Portas and AbouRizk (1997) undertook a questionnaire of superintendents
and project managers to determine all possible factors affecting productivity from the
viewpoints of superintendents and estimators. An interview conducted with contractors
showed that weather, material delivery, preceding trade, and multivisits were the main
adverse factors for site productivity (Hassanein and Melin, 1997). A questionnaire
identified rework, materials problems, tools, heavy equipment availability, crew
interference, overcrowded work areas, instruction, quality control inspection, and
management interventions as the main factors affecting craftsman productivity and
motivation (Chang and Borcherding, 1985). Another survey on construction personnel
12
(Hanna and Heale, 1994) was conducted to gauge the opinion of personnel in the field of
construction, specifically their perception of the factors that most affect construction
productivity. As a result, a set of comprehensive factors was identified and classified into
six groups: contract environment, planning, site management, working conditions,
working hours and motivation.
There are other studies that investigated or discussed the factors affecting construction
productivity. These include the research on the relationship between buildability and site
productivity by Poh and Chen (1998); the study by Kaming et al (1997) on the factors
influencing craftsmen’s productivity in Indonesia, based on which a system was
developed by Kaming et al. (1998) to diagnose productivity problems at an early stage in
Indonesian construction process; the discussion on causes of delay by Odeh and
Battaineh (2002); the work by Smith (1993) on formwork’s productivity; and the
comparison of productivity between UK and France by Winch and Carr (2001).
2.4 OVERVIEW OF THE OPERATION CONTENT ON THE SITE
With regard to the research on the productivity problem, a number of interesting results
have been achieved from the perspective of operation elements on site.
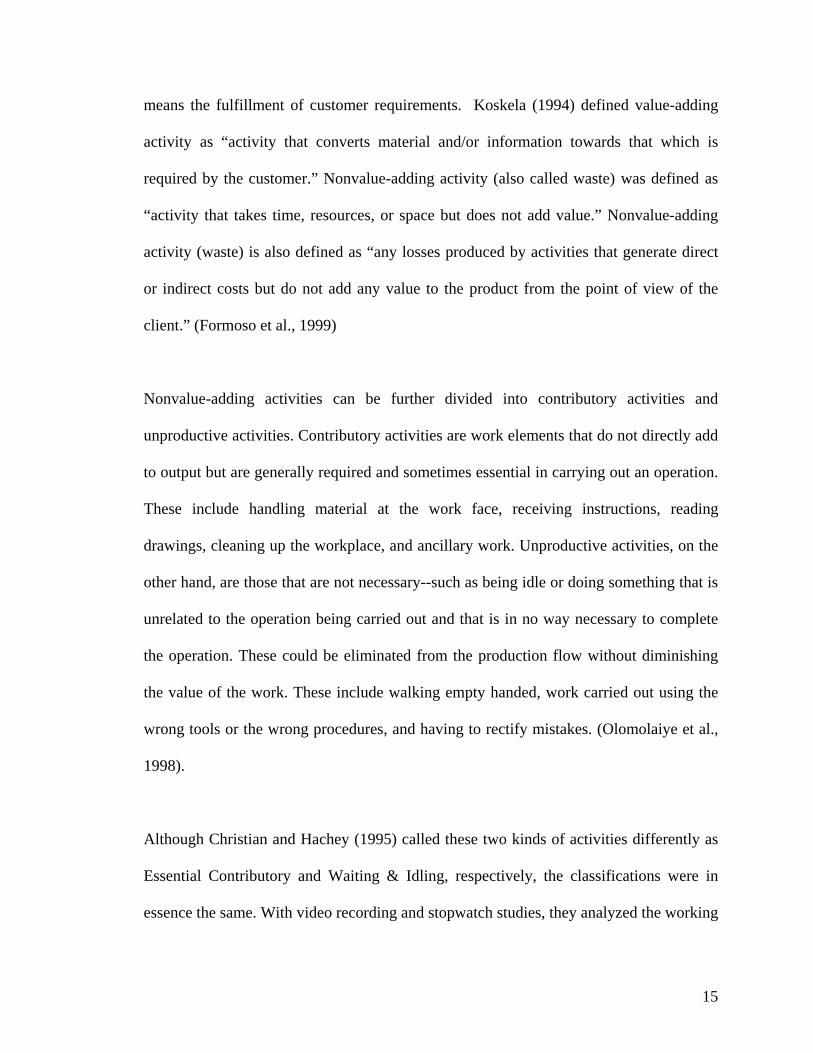
Drewin (1982) analyzed the different types of activities involved in construction
operations and the causes contributing to the total time of a construction operation, as
shown in Figure 2.1.
13

A- Basic work content Time taken to carry out operation under perfect conditions
B- Work content added by unavoidable externalities Time added due to factors such as weather, unforeseen conditions
C- Work content added by poor designs Time added due to uneconomical designs, inadequate specification, lack of standardization, etc.
D- Work content added by unsuitable methods Time added due to inefficient methods, poor site layouts, and unsuitable plant
E- Ineffective time due to management shortcomingsTime added due to factors such as lack of materials, lack of equipment, poor working conditions
F- Ineffective time due to shortcomings of workers
Figu
The basic
operation
out under
the follow
(B); Wor
methods (
due to sho
productivi
Recently,
was consi
constructi
Total work content
in
Total time of operation
Total effective time
Time added due to worker absence, lateness, idleness, carelessness, etc.
re 2.1 Assembling operation time elements (Adapted from Drewin, 1982)
work content (A) in Figure 2.1 is the amount of work contained in the
in terms of total labor hours and/or equipment hours if the operation is carried
perfect conditions. However, the actual total operation time usually consists of
ing additional time elements: Work content added by unavoidable externalities
k content added by poor designs (C); Work content added by unsuitable
D); Ineffective time due to management shortcomings (E); and Ineffective time
rtcomings of workers (F). According to this perspective, the ultimate aim for
ty improvement should be to reduce the actual operation time to A+B.
some researchers judged the operation from the viewpoint of value-adding. It
dered that similar to other production processes, the activities in the physics of
on flow can be classified as value adding and nonvalue-adding activities. Value
14
means the fulfillment of customer requirements. Koskela (1994) defined value-adding
activity as “activity that converts material and/or information towards that which is
required by the customer.” Nonvalue-adding activity (also called waste) was defined as
“activity that takes time, resources, or space but does not add value.” Nonvalue-adding
activity (waste) is also defined as “any losses produced by activities that generate direct
or indirect costs but do not add any value to the product from the point of view of the
client.” (Formoso et al., 1999)
Nonvalue-adding activities can be further divided into contributory activities and
unproductive activities. Contributory activities are work elements that do not directly add
to output but are generally required and sometimes essential in carrying out an operation.
These include handling material at the work face, receiving instructions, reading
drawings, cleaning up the workplace, and ancillary work. Unproductive activities, on the
other hand, are those that are not necessary--such as being idle or doing something that is
unrelated to the operation being carried out and that is in no way necessary to complete
the operation. These could be eliminated from the production flow without diminishing
the value of the work. These include walking empty handed, work carried out using the
wrong tools or the wrong procedures, and having to rectify mistakes. (Olomolaiye et al.,
1998).
Although Christian and Hachey (1995) called these two kinds of activities differently as
Essential Contributory and Waiting & Idling, respectively, the classifications were in
essence the same. With video recording and stopwatch studies, they analyzed the working
15
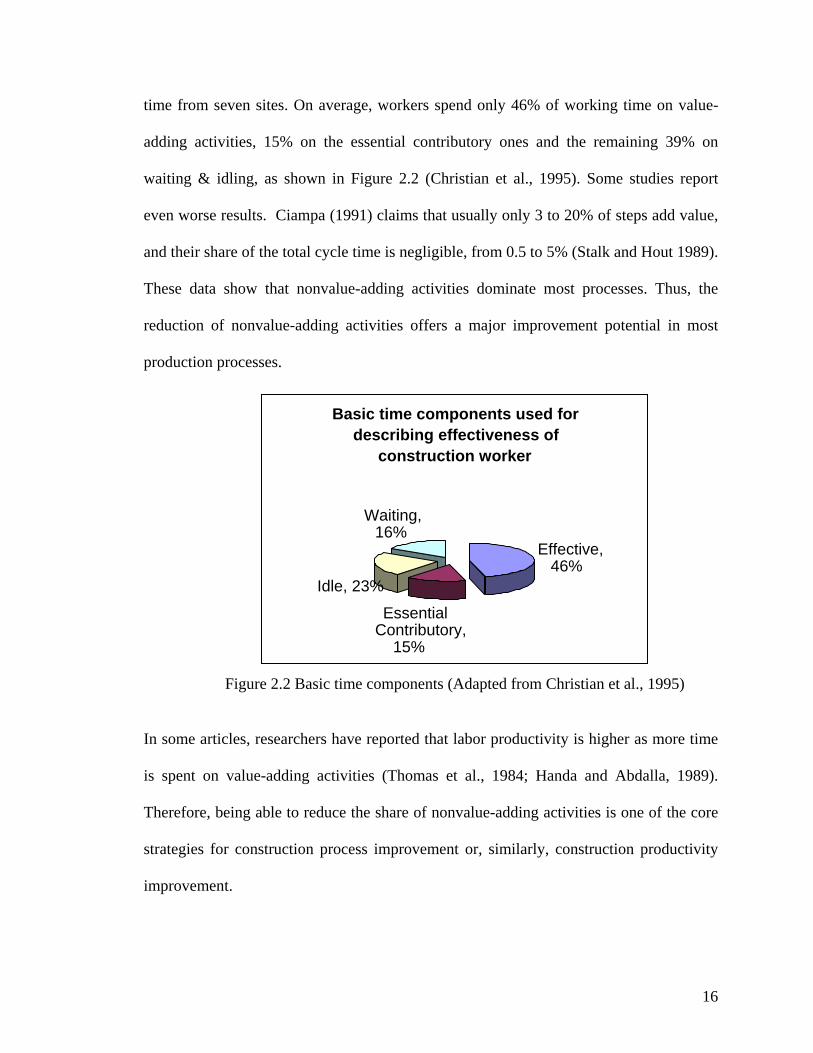
time from seven sites. On average, workers spend only 46% of working time on value-
adding activities, 15% on the essential contributory ones and the remaining 39% on
waiting & idling, as shown in Figure 2.2 (Christian et al., 1995). Some studies report
even worse results. Ciampa (1991) claims that usually only 3 to 20% of steps add value,
and their share of the total cycle time is negligible, from 0.5 to 5% (Stalk and Hout 1989).
These data show that nonvalue-adding activities dominate most processes. Thus, the
reduction of nonvalue-adding activities offers a major improvement potential in most
production processes.
Basic time components used for describing effectiveness of
construction worker
Waiting, 16%
Effective, 46%
Idle, 23%
Essential Contributory,
15%
Figure 2.2 Basic time components (Adapted from Christian et al., 1995)
In some articles, researchers have reported that labor productivity is higher as more time
is spent on value-adding activities (Thomas et al., 1984; Handa and Abdalla, 1989).
Therefore, being able to reduce the share of nonvalue-adding activities is one of the core
strategies for construction process improvement or, similarly, construction productivity
improvement.
16
For this reason identification of nonvalue-adding activities is critical for the study on
productivity. Borcherding et al. (1986) provide an interesting qualitative model, which is
called Sources of reduced productivity, to identify causes of reduced productivity in
construction work. Productivity loss on large complex construction projects is explained
using five major categories of unproductive time: (1) waiting or idle, (2) working slowly,
(3 ) doing rework, (4) traveling, (5) doing ineffective work. The reason why the crafts
workers produce less output per unit of time is relegated to one of these basic
nonproductive activities. The activities are affected directly or indirectly by several other
factors, which are portrayed in his model.
Serpell A. et al. (1995) called these nonvalue-adding activities as Waste of Time. It
includes waiting time, idle time, traveling, resting, reworking, working slowly and so on.
The causes for these wastes have been classified as inadequate and non accessible
resources, non availability of information, deficient method and planning, and poor
decision making that incorporates poor allocation of work to labor and improper
distribution of personnel. Furthermore the possible factors those contribute to the waste is
analyzed in the study.
17
CHAPTER 3
CONCEPTUAL MODEL AND STUDY PROCEDURE
3.1 INTRODUCTION
In this chapter, a conceptual model of factors affecting productivity will be developed,
based on which, the procedure of the study is introduced.
3.2 CONCEPTUAL MODEL
From the literature review, the apparent complexity of the relationship among the factors
affecting construction productivity can be observed. Almost all the factors involved in a
project will affect productivity performance. Moreover, some relationships of interaction
or cause-effect existing among such factors add to the complexity of the problem.
In order to understand the productivity-affecting factors systematically, identification of
the most direct factors is the starting point, followed by the study of the causes of these
18
direct factors. A conceptual model is thus built to demonstrate the relationships among
the factors and productivity.
3.2.1 Starting Point for the Model
Since productivity is defined as “Work quantity/man-hour consumed” in this study
(Equation 2.4), when the work quantity is fixed, productivity loss occurs when the man-
hours consumed increase beyond the estimated man-hours. Here the estimated man-hours
are assumed to be accurate. Therefore, the most direct cause that leads to the loss of
productivity is the increase of man-hours.
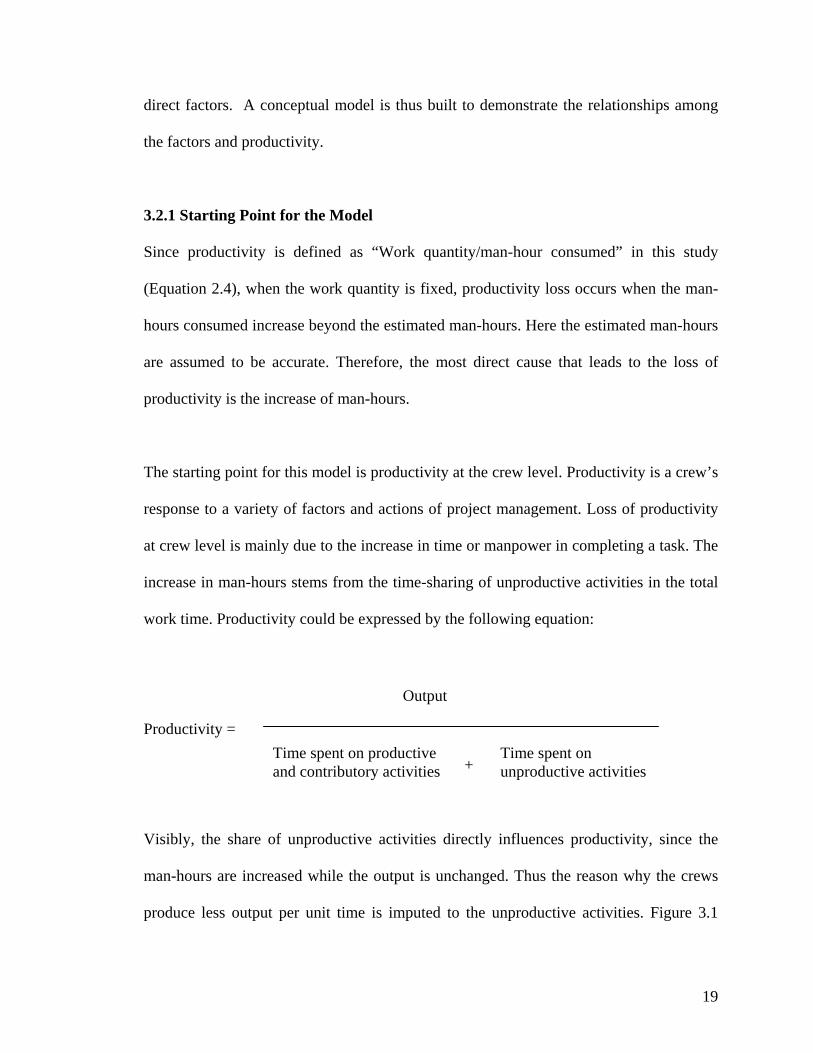
The starting point for this model is productivity at the crew level. Productivity is a crew’s
response to a variety of factors and actions of project management. Loss of productivity
at crew level is mainly due to the increase in time or manpower in completing a task. The
increase in man-hours stems from the time-sharing of unproductive activities in the total
work time. Productivity could be expressed by the following equation:
Output
Productivity =
+Time spent on Time spent on productive
and contributory activities
Visibly, the share of unproductive activities di
man-hours are increased while the output is unc
produce less output per unit time is imputed to
unproductive activities
rectly influences productivity, since the
hanged. Thus the reason why the crews
the unproductive activities. Figure 3.1
19

illustrates this relationship. The existence of unproductive activities is commonly
recognized. Techniques for identifying the work element in the operation could be video
recording or stopwatch studies. The unproductive activities mainly studied here are idling,
waiting, and rework. Although some other studies also classified resting, traveling and
working slowly into unproductive activities. From practical consideration, worker’s
resting on site may be physiologic needs for the work; traveling could be necessary
movement for getting tools or materials far away from the work place. So these two
activities are hard to differentiate from contributory activities. Working slowly is difficult
to distinguish. Thus the unproductive activities refer to waiting, idling, and rework in this
study.
Work Element
Productive Activities
Contributory Unproductive Activities Activities
Waiting
.
Figure 3.1 Relationship between work element and productivity
Rework Productivity
Idling
20
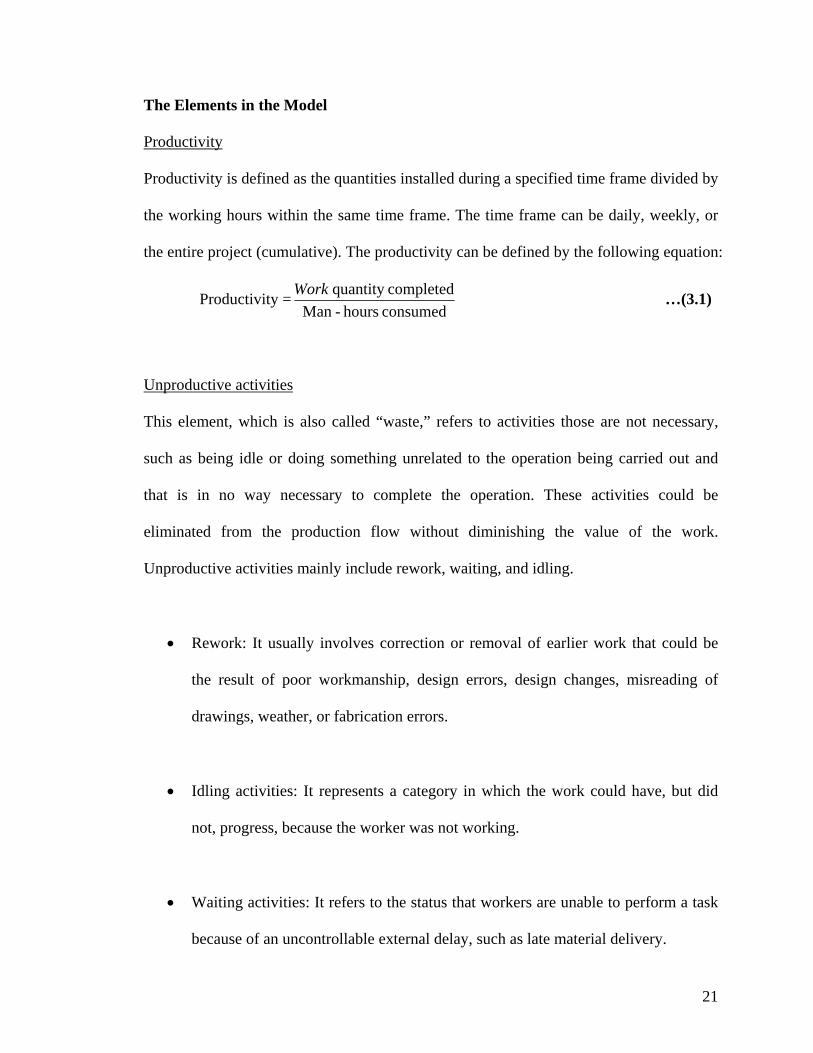
The Elements in the Model
Productivity
Productivity is defined as the quantities installed during a specified time frame divided by
the working hours within the same time frame. The time frame can be daily, weekly, or
the entire project (cumulative). The productivity can be defined by the following equation:
Productivity =consumedhours-Mancompletedquantity Work …(3.1)
Unproductive activities
also called “waste,” refers to activities those are not necessary,
• Rework: It usually involves correction or removal of earlier work that could be
• Idling activities: It represents a category in which the work could have, but did
• Waiting activities: It refers to the status that workers are unable to perform a task
because of an uncontrollable external delay, such as late material delivery.
This element, which is
such as being idle or doing something unrelated to the operation being carried out and
that is in no way necessary to complete the operation. These activities could be
eliminated from the production flow without diminishing the value of the work.
Unproductive activities mainly include rework, waiting, and idling.
the result of poor workmanship, design errors, design changes, misreading of
drawings, weather, or fabrication errors.
not, progress, because the worker was not working.
21
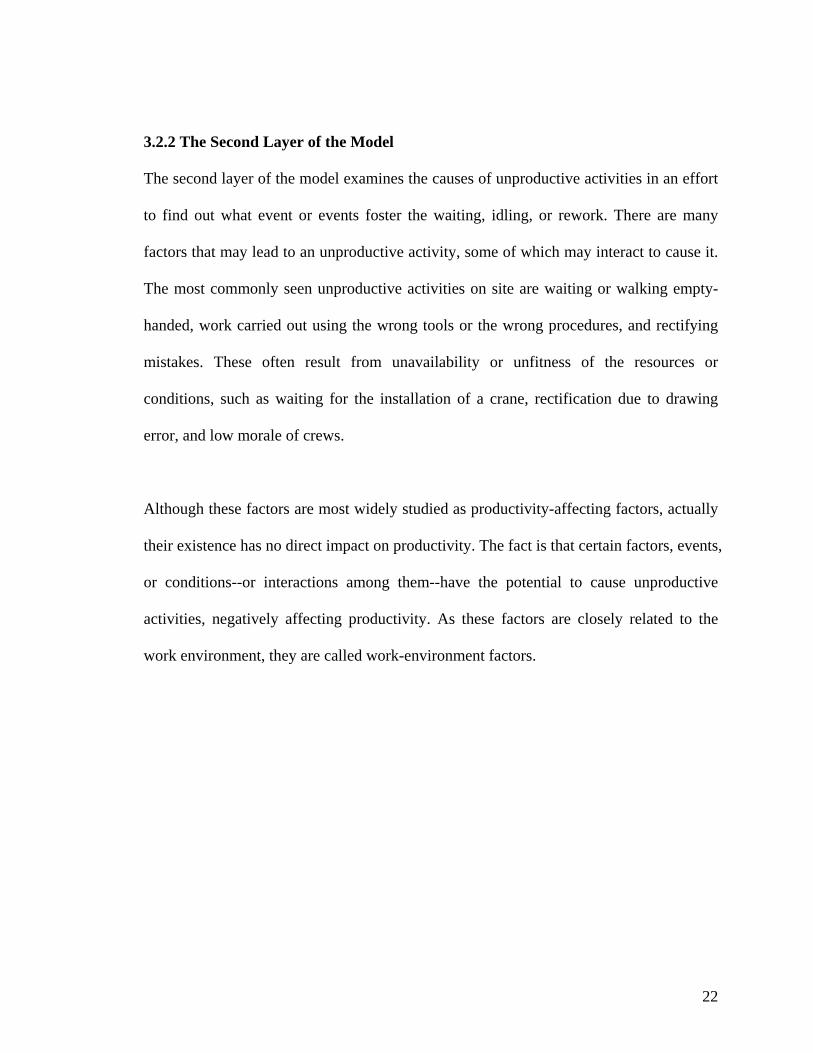
3.2.2 T
he second layer of the model examines the causes of unproductive activities in an effort
the waiting, idling, or rework. There are many
widely studied as productivity-affecting factors, actually
eir existence has no direct impact on productivity. The fact is that certain factors, events,
he Second Layer of the Model
T
to find out what event or events foster
factors that may lead to an unproductive activity, some of which may interact to cause it.
The most commonly seen unproductive activities on site are waiting or walking empty-
handed, work carried out using the wrong tools or the wrong procedures, and rectifying
mistakes. These often result from unavailability or unfitness of the resources or
conditions, such as waiting for the installation of a crane, rectification due to drawing
error, and low morale of crews.
Although these factors are most
th
or conditions--or interactions among them--have the potential to cause unproductive
activities, negatively affecting productivity. As these factors are closely related to the
work environment, they are called work-environment factors.
22
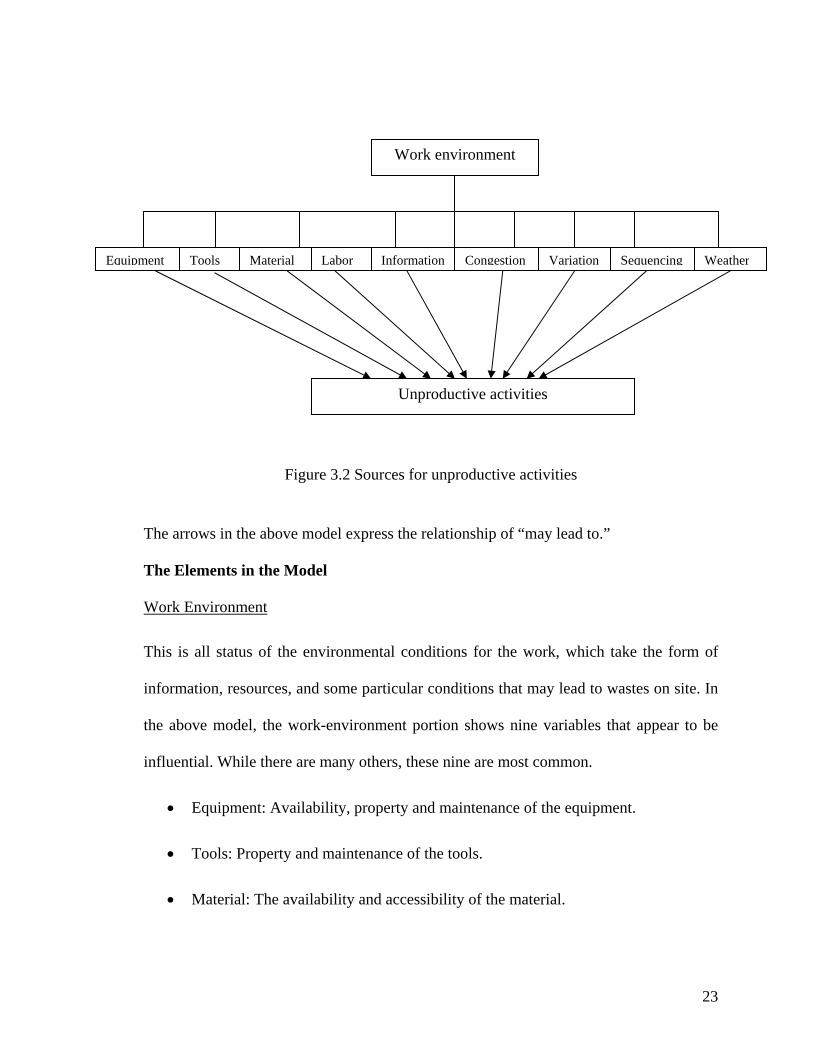
Work environment
s rt n n n g r
The ar
The E
Work
This i
inform
the ab
influe
•
•
•
Tool
rows in t
lements
Environm
s all statu
ation, res
ove mod
ntial. Whi
Equipm
Tools: P
Materia
Material
Figu
he above m
in the Mod
ent
s of the en
ources, and
el, the wor
le there are
ent: Availab
roperty and
l: The avail
Labo
Equipmenre 3.2 Sou
odel expr
el
vironmen
some pa
k-environ
many oth
ility, pro
mainten
ability an
Informatio
Unprodu
rces for unp
ess the relatio
tal condition
rticular cond
ment portion
ers, these ni
perty and ma
ance of the to
d accessibilit
Congestio
ctive activitie
roductive acti
nship of “ma
s for the wo
itions that ma
shows nine
ne are most co
intenance of
ols.
y of the mate
Variatio
s
vities
y lead to.”
rk, which t
y lead to w
variables t
mmon.
the equipm
rial.
Sequencin
ake the form
astes on site
hat appear to
ent.
Weathe
of
. In
be
23
• Labor: The experience and skill of the crew to the work, and the enthusiasm for
the work.
• Information: Adequacy and timeliness of the instruction, and the technical advice
for the work.
• Congestion: The site arrangement and housekeeping.
• Variation: Any variation exits on drawings, working technique, process planning
during the period of the construction.
• Sequencing: Proper and reasonable arrangement of working sequencing.
• Weather: The weather conditions during work, which can have a significant effect
on labor productivity.
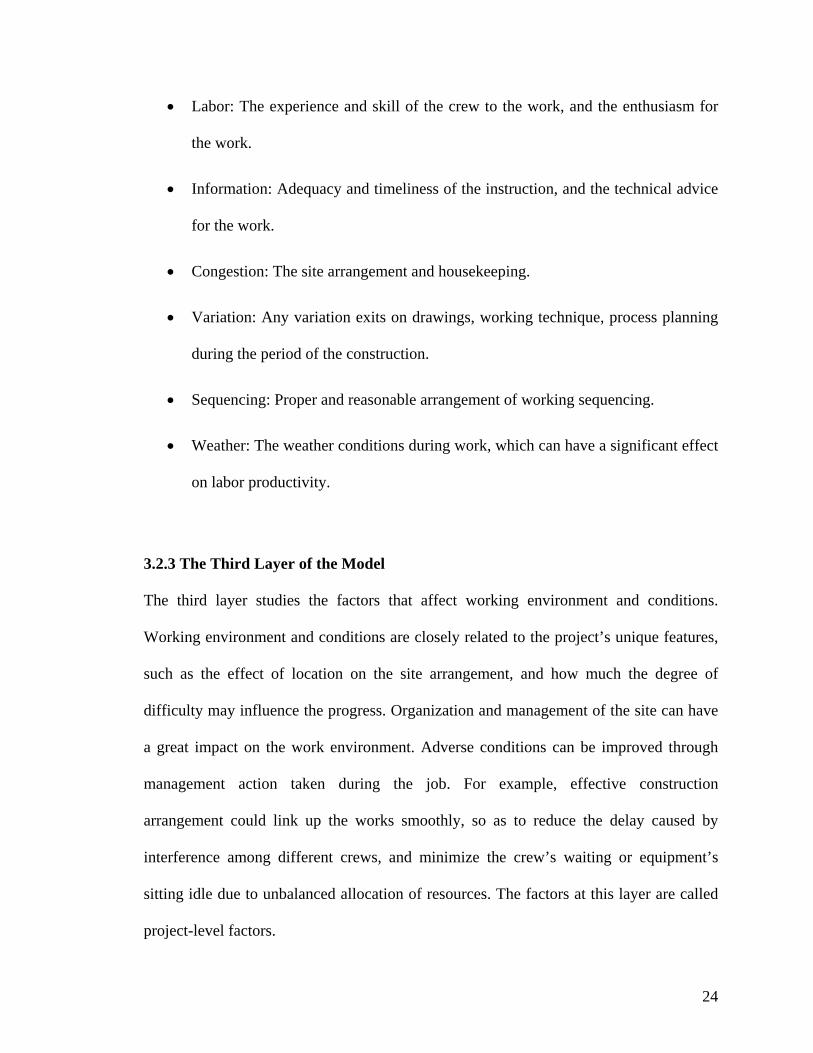
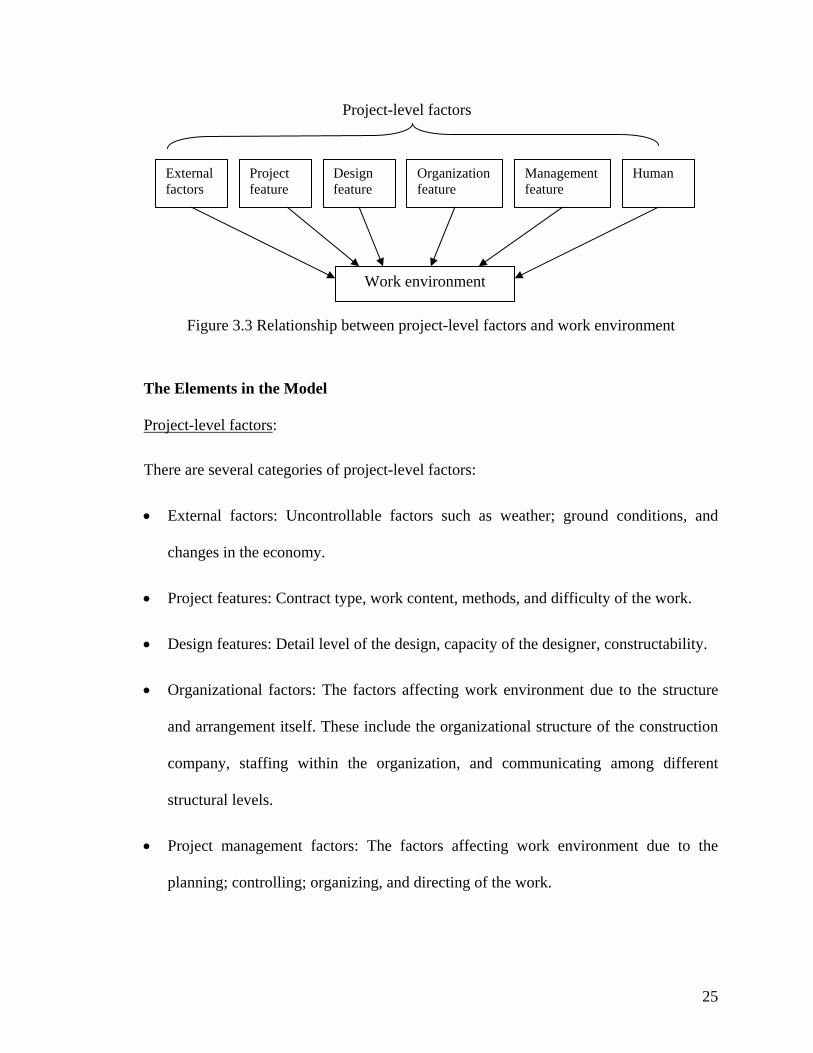
3.2.3 The Third Layer of the Model
The third layer studies the factors that affect working environment and conditions.
Working environment and conditions are closely related to the project’s unique features,
such as the effect of location on the site arrangement, and how much the degree of
difficulty may influence the progress. Organization and management of the site can have
a great impact on the work environment. Adverse conditions can be improved through
management action taken during the job. For example, effective construction
arrangement could link up the works smoothly, so as to reduce the delay caused by
interference among different crews, and minimize the crew’s waiting or equipment’s
sitting idle due to unbalanced allocation of resources. The factors at this layer are called
project-level factors.
24
Project-level factors
External factors
Project feature
Design feature
Organization feature
Management feature
Work environment
Human
Figure 3.3 Relationship between project-level factors and work environment
The Elements in the Model
Project-level factors:
There are several categories of project-level factors:
• External factors: Uncontrollable factors such as weather; ground conditions, and
changes in the economy.
• Project features: Contract type, work content, methods, and difficulty of the work.
• Design features: Detail level of the design, capacity of the designer, constructability.
• Organizational factors: The factors affecting work environment due to the structure
and arrangement itself. These include the organizational structure of the construction
company, staffing within the organization, and communicating among different
structural levels.
• Project management factors: The factors affecting work environment due to the
planning; controlling; organizing, and directing of the work.
25
• Human: Human-related factors such as the educational level and the skill level of the
people engaged in this project.
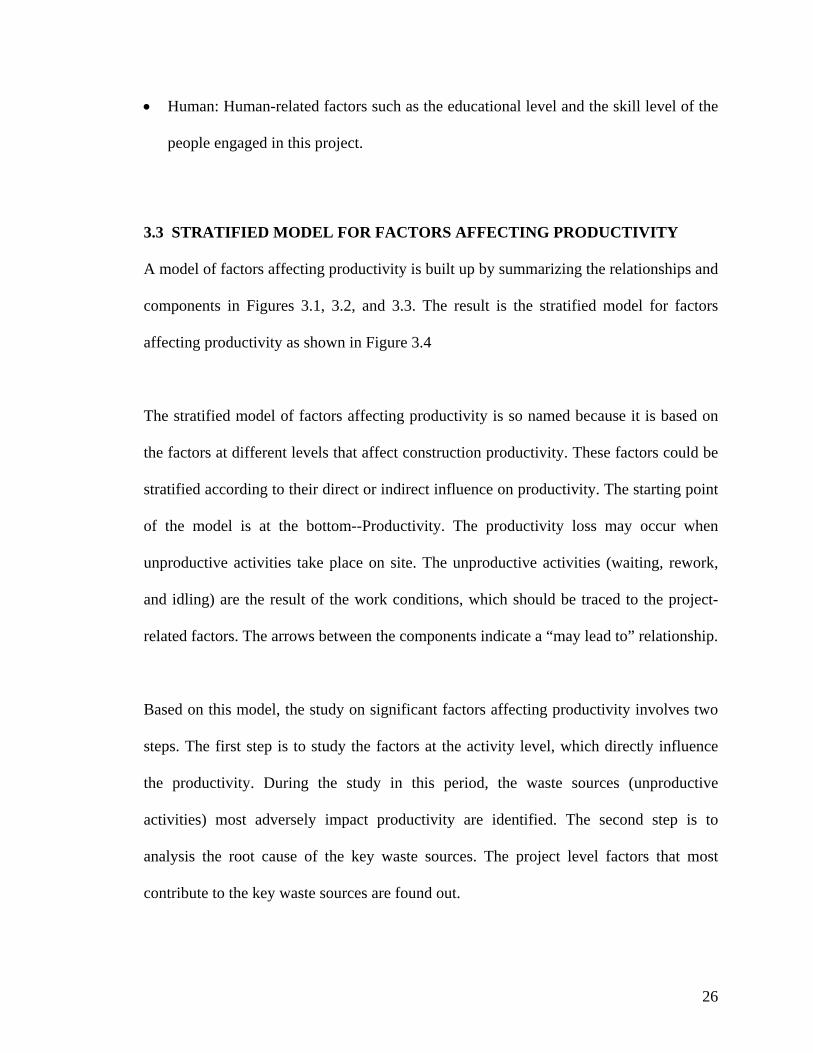
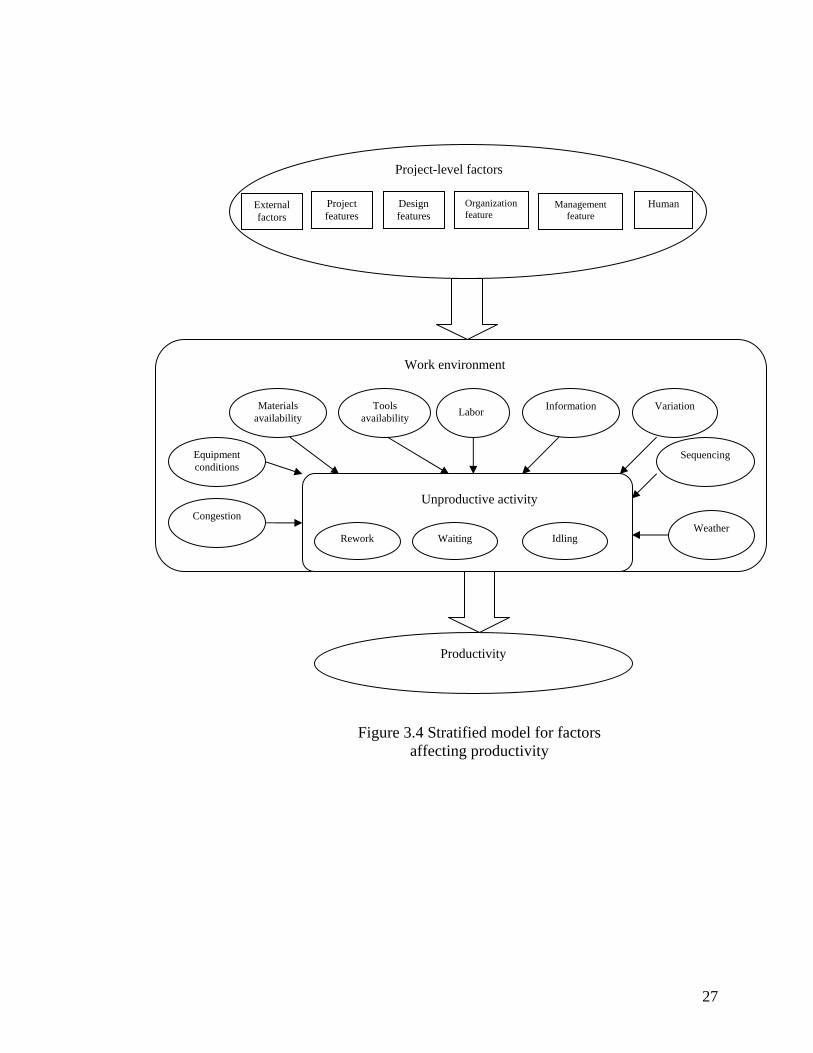
3.3 STRATIFIED MODEL FOR FACTORS AFFECTING PRODUCTIVITY
A model of factors affecting productivity is built up by summarizing the relationships and
components in Figures 3.1, 3.2, and 3.3. The result is the stratified model for factors
affecting productivity as shown in Figure 3.4
The stratified model of factors affecting productivity is so named because it is based on
the factors at different levels that affect construction productivity. These factors could be
stratified according to their direct or indirect influence on productivity. The starting point
of the model is at the bottom--Productivity. The productivity loss may occur when
unproductive activities take place on site. The unproductive activities (waiting, rework,
and idling) are the result of the work conditions, which should be traced to the project-
related factors. The arrows between the components indicate a “may lead to” relationship.
Based on this model, the study on significant factors affecting productivity involves two
steps. The first step is to study the factors at the activity level, which directly influence
the productivity. During the study in this period, the waste sources (unproductive
activities) most adversely impact productivity are identified. The second step is to
analysis the root cause of the key waste sources. The project level factors that most
contribute to the key waste sources are found out.
26
Project-level factors Project features
Design features
Organization feature
HumanExternal factors
Management feature
Work environment
Equipment conditions
Congestion
Sequencing
Materials availability
Variation
Weather
Tools availability
Information
Unproductive activity
Rework Waiting Idling
Productivity
Labor
Figure 3.4 Stratified model for factors affecting productivity
27
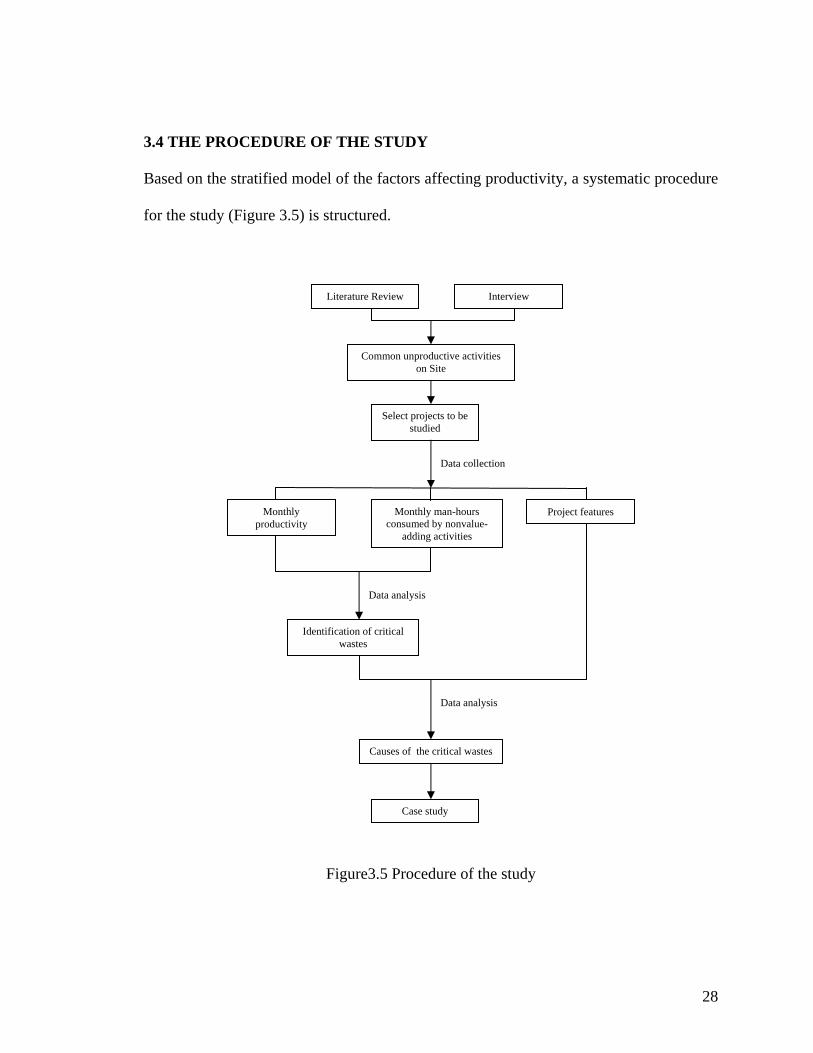
3.4 THE PROCEDURE OF THE STUDY Based on the stratified model of the factors affecting productivity, a systematic procedure
for the study (Figure 3.5) is structured.
Literature Review Interview
Common unproductive activities on Site
Select projects to be studied
Data collection
Monthly productivity
Monthly man-hours consumed by nonvalue-
adding activities
Project features
Data analysis
Identification of critical wastes
Data analysis
Causes of the critical wastes
Case study
Figure3.5 Procedure of the study
28

Through the Literature review and interview with some experienced construction
personnel, a list of common unproductive activities is determined. Then a structured
survey of selected projects is conducted. The survey includes three parts: project-related
factors; monthly productivity; and weekly working time wasted on unproductive
activities, which are determined through the interview. Subsequently, two stages of data
analysis will be carried on. The first is to analyze the relationship between the
unproductive activities and productivity performance to identify the most critical wastes
on site. The second is to determine the relationship between the critical wastes and the
project-level factors. Finally, two case studies are carried out to test the validity of the
proposed relationships that are identified step by step.
29
CHAPTER 4
DATA COLLECTION
4.1 INTRODUCTION
In this research, the data collection process consists of two stages. The first stage is
interviews, and the second is a survey on the performance at the work interface. In this
chapter, the objectives, design, and organization of two stages of data collection are
introduced. The nature of the targets and participants is also elaborated.
4.2 THE INTERVIEW
Through literature review, the common unproductive activities and their possible causes
have been basically identified. The sources of waste were related to design, material,
crew, equipment, and site elements, as shown below:
Waiting for equipment due to its being occupied
30
Waiting for equipment due to installation
Waiting due to equipment’s breakdown
Waiting due to unsuitable tools
Waiting due to tools malfunction
Waiting due to delivery delay
Waiting due to underestimating of materials required
Waiting for materials due to stock problems
Waiting for instruction
Waiting for drawings
Rework due to design error
Rework due to design change
Rework due to design omission
Rework due to field error
Waiting due to congested site
Waiting due to crews’ interference
Idling due to labor’s lack of enthusiasm
Waiting due to wet days
In order to testify the validity of these causes of wastes obtained from the review, and the
conformity with local construction market, interview was carried out.
4.2.1 Interview Target and Result
31

With the intention of getting a full picture of the actual situation during construction
operation and determining the wastes on site and the causes for these wastes, the
interviews were conducted to different levels of professionals. The interviewees include 6
project managers, 5 site managers, and 6 foremen. The advantage of getting different
levels involved is that the issues can be addressed through different stand, and thus the
concealing of information by certain persons has less effect to the result.
The interviewees were asked to identify whether the wastes in the question list (as shown
in Appendix E) happen frequently. Nearly all the interviewee gave positive answers to
these waste causes. In addition, 9 interviewees suggested to add “waiting for illuminating
at night work” into the category of “equipment”, because during night shift lack of
sufficient lighting or delay in providing lighting always affect the site progress and
productivity. Furthermore, as per the special feature of the weather in Singapore, 7
interviewees mentioned that “waiting for wet days” also happens quite often and delays
site work. Based on the literature review and the above feedbacks, the wastes were
categorized into reworks, waiting, and idling. The last one is distinguished from waiting
to emphasize the lack of a process-related source. Based on the findings of the literature
review and interviews, a list of waste sources was summarized as follows. The sources of
waste were related to design, material, crew, equipment, and site elements.
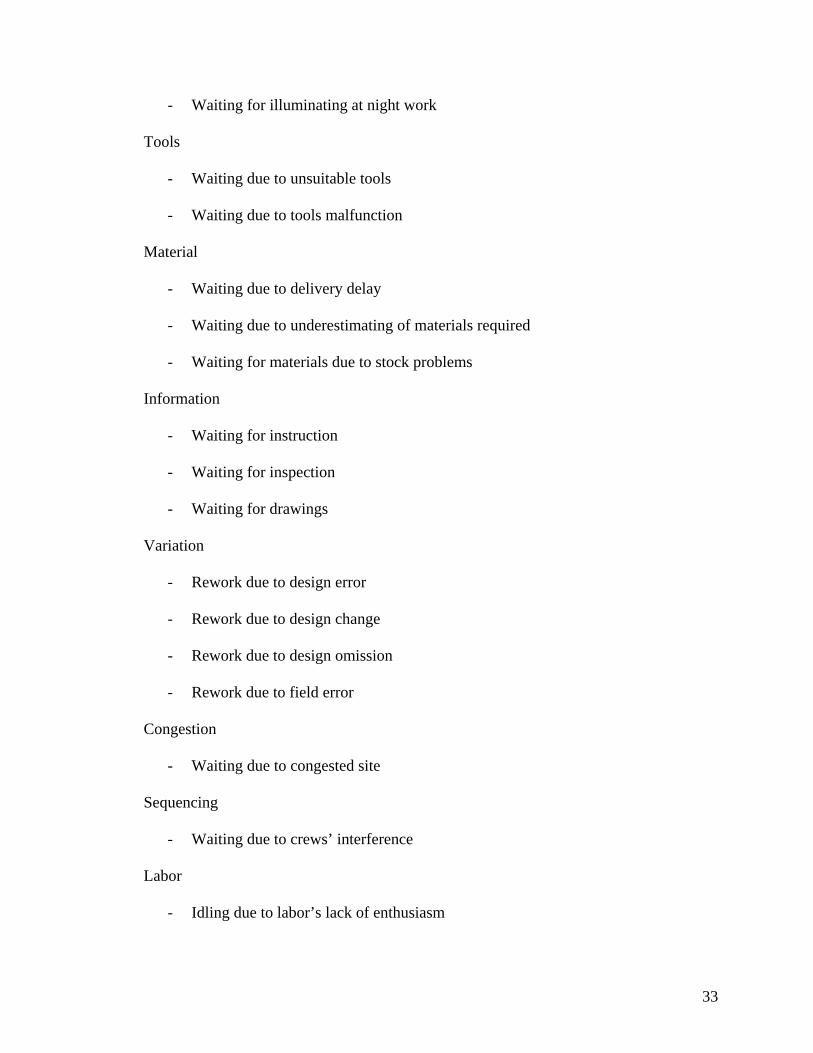
Equipment
- Waiting for equipment due to its being occupied
- Waiting for equipment due to installation
- Waiting due to equipment’s breakdown
32
- Waiting for illuminating at night work
Tools
- Waiting due to unsuitable tools
- Waiting due to tools malfunction
Material
- Waiting due to delivery delay
- Waiting due to underestimating of materials required
- Waiting for materials due to stock problems
Information
- Waiting for instruction
- Waiting for inspection
- Waiting for drawings
Variation
- Rework due to design error
- Rework due to design change
- Rework due to design omission
- Rework due to field error
Congestion
- Waiting due to congested site
Sequencing
- Waiting due to crews’ interference
Labor
- Idling due to labor’s lack of enthusiasm
33

Weather
- Waiting due to wet days
4.3 THE SURVEY
4.3.1 Survey Objective
The objectives of the survey are
1. To capture the background information of the projects studied, such as
management and organizational features.
2. To track the site performance of the projects.
4.3.2 Design and Organization of the Questionnaire Survey
The survey questions comprise two sections: one section of project organizational and
management characteristics, and one section of log sheets of work performance. The first
section requested project managers or site managers of the selected projects to evaluate
the project-related factors according to a five-point scale, which is as shown in Appendix
A. Section two, the log sheets (Appendix B), was to be filled in by foremen on a weekly
basis. The reason for making the foremen as the respondents of this section is that they
are the ones closest to the work and constitute the first line of supervision on the project.
They would have site knowledge of the root cause of any poor performance on site. The
weekly log sheets require the foremen not only to identify the source for the waste
element but also to record the duration or extent of the problem, and the number of
workers directly affected. The weekly man-hours lost on every waste element can then be
calculated.
34

To secure good-quality data, a brief presentation with regard to the objective, the
methodology of the study, and the description of the survey form were made to every
respondent, and the survey form would only be distributed upon their willingness and
ability to commit the necessary time for this study.
4.3.3 Survey target
Eight on-going structural projects were selected for the study. They were made up of
different natures of work--four commercial buildings, one Housing Development Board
residential building, one condominium, and two civil drainage projects. However,
because the projects are not identical and standardized, it is difficult to compare the
productivity performance among them. To overcome this difficulty, the carpentry trade--
comprising both fabricating and installation works--was selected for comparison, because
the carpentry work accounts for a large part of the labor cost in these projects. Also some
experienced construction people maintain that carpentry is the major trade in structural
work, which is twice more than steel benders in building construction in terms of man-
hours. Thus the labor productivity of carpentry crews could be representative for the
structural work to some extent. There are altogether 18 carpentry foremen in these eight
projects. All of them have many years industry experience as shown in Table 4.1.
Productivity was measured in square meters of formwork (m2) per man-hour. For the
purposes of company’s accounting, the work quantity reported was on a monthly basis.
Using the monthly manpower records, the monthly productivity for every crew was
determined.
35
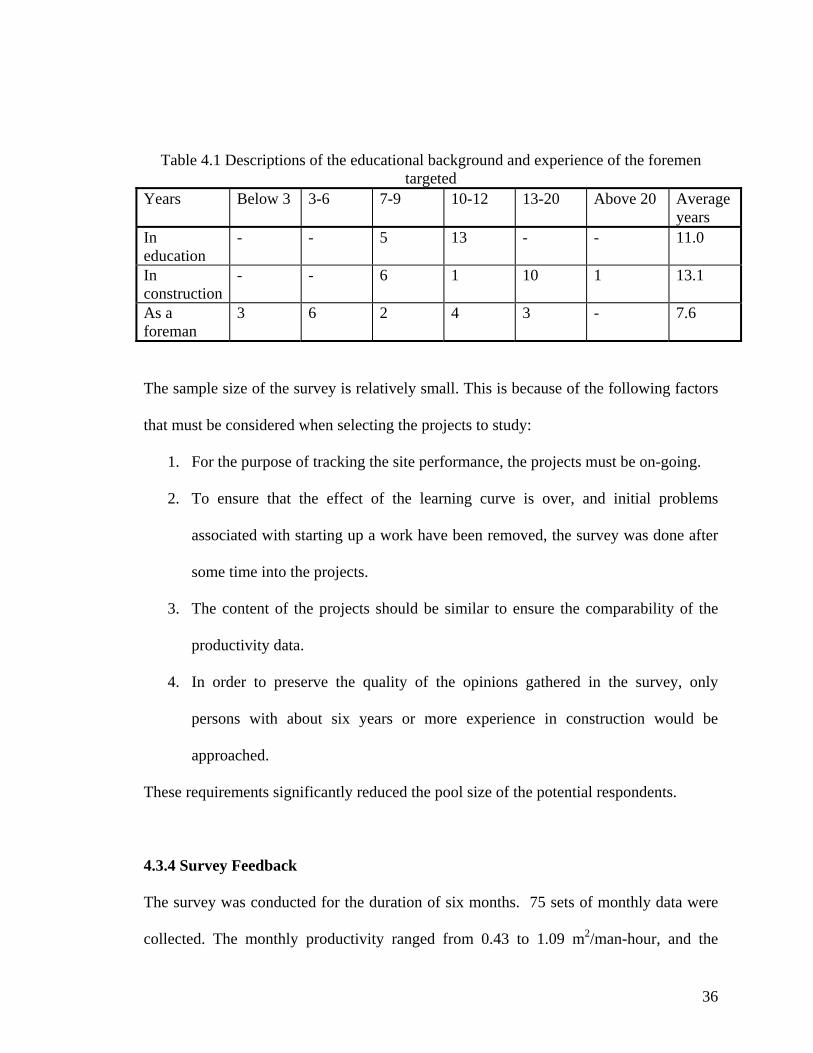
Table 4.1 Descriptions of the educational background and experience of the foremen
targeted Years Below 3
3-6
7-9
10-12
13-20
Above 20
Average years
In education
- - 5 13 - - 11.0
In construction
- - 6 1 10 1 13.1
As a foreman
3 6 2 4 3 - 7.6
The sample size of the survey is relatively small. This is because of the following factors
that must be considered when selecting the projects to study:
1. For the purpose of tracking the site performance, the projects must be on-going.
2. To ensure that the effect of the learning curve is over, and initial problems
associated with starting up a work have been removed, the survey was done after
some time into the projects.
3. The content of the projects should be similar to ensure the comparability of the
productivity data.
4. In order to preserve the quality of the opinions gathered in the survey, only
persons with about six years or more experience in construction would be
approached.
These requirements significantly reduced the pool size of the potential respondents.
4.3.4 Survey Feedback
The survey was conducted for the duration of six months. 75 sets of monthly data were
collected. The monthly productivity ranged from 0.43 to 1.09 m2/man-hour, and the
36

average productivity was 0.78 m2/man-hour, as shown in Figure 4.1. The weekly wasted
man-hours were accumulated monthly and analyzed along with the productivity figures.
The average man-hours wasted on the 20 waste sources were shown in Table 4.1. Table
4.2 classified the wasted man-hours according to the working conditions. The neural
network will be used in the next chapter to determine the relationships that exist between
the productivity performance and the working conditions.
0
0.2
0.4
0.6
0.8
1
1.2
1 5 9 13 17 21 25 29 33 37 41 45 49 53 57 61 65 69 73
Crew
prod
uctiv
ity (m
2/m
an-h
r)
Average productivity=0.78
Max=1.09
Min=0.43
Figure 4.1 Monthly productivity of carpentry crews
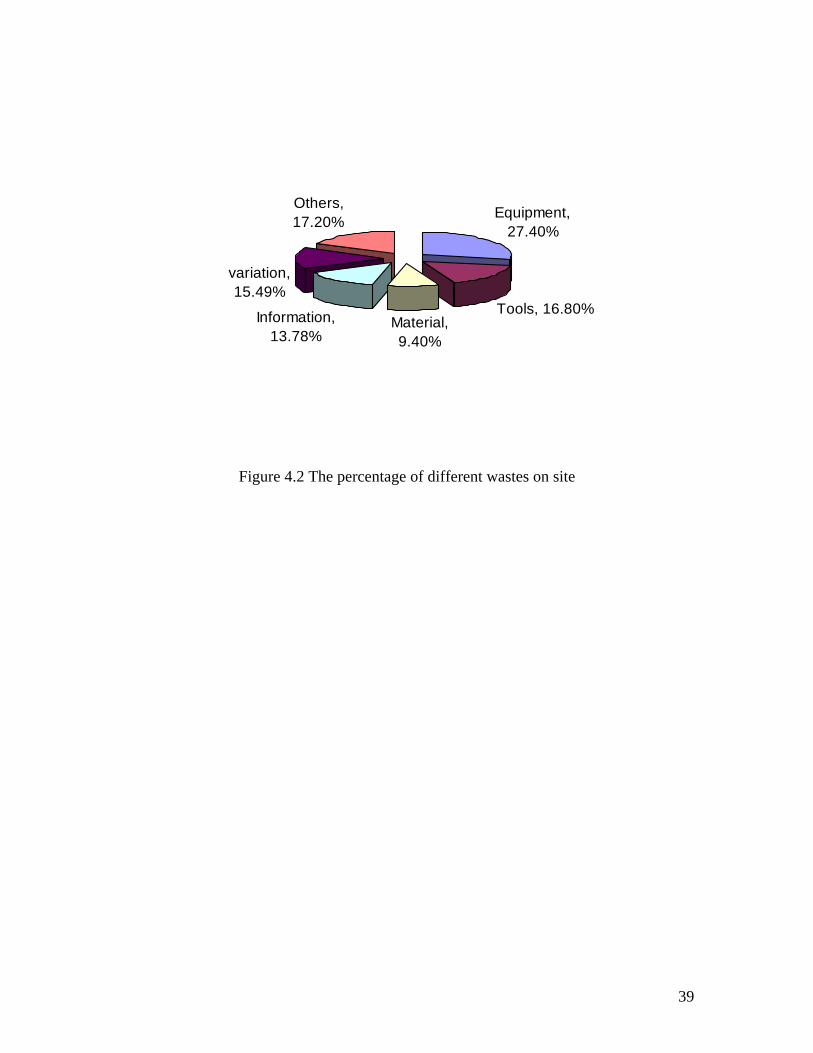
Figure 4.2 shows the wastes caused by different factors in percentage. Waiting for
equipment is the most serious problem, which causes 27.4% of the total wastes. Tools’
availability comes next. Other significant factors include variation, waiting for
information, and waiting for materials. These five account for over 82% of the lost time.
37
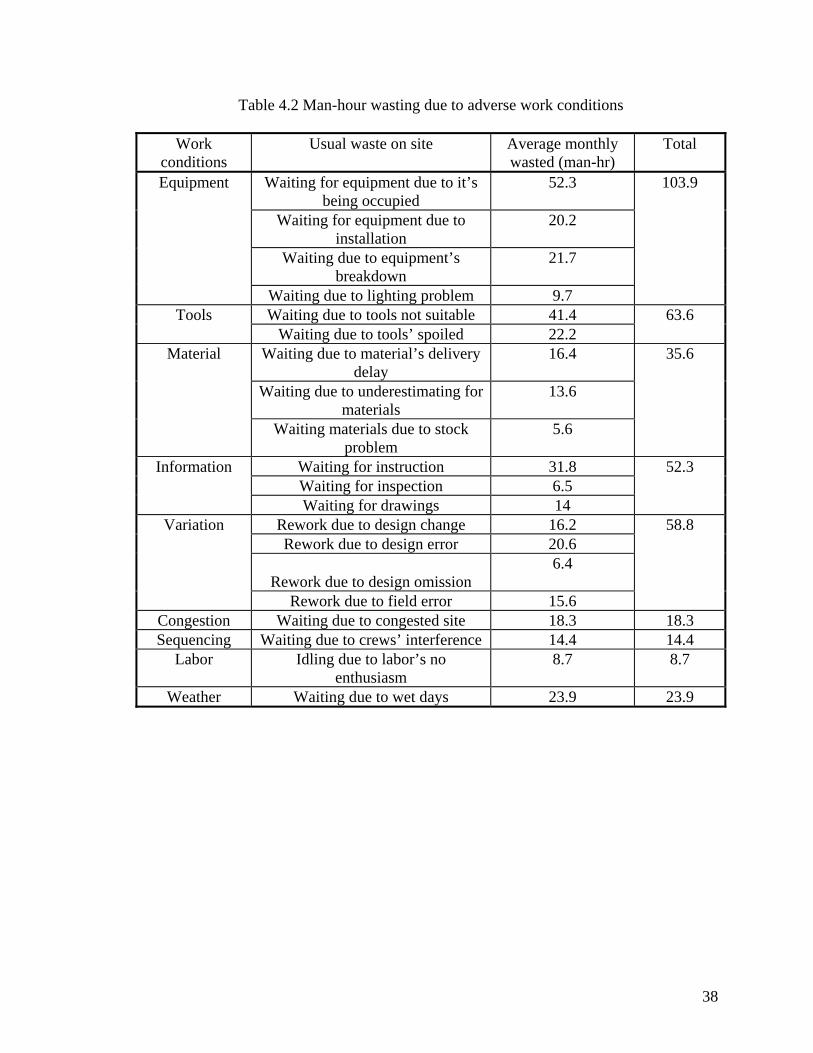
Table 4.2 Man-hour wasting due to adverse work conditions
Work conditions
Usual waste on site Average monthly wasted (man-hr)
Total
Waiting for equipment due to it’s being occupied
52.3
Waiting for equipment due to installation
20.2
Waiting due to equipment’s breakdown
21.7
Equipment
Waiting due to lighting problem 9.7
103.9
Waiting due to tools not suitable 41.4 Tools Waiting due to tools’ spoiled 22.2
63.6
Waiting due to material’s delivery delay
16.4
Waiting due to underestimating for materials
13.6
Material
Waiting materials due to stock problem
5.6
35.6
Waiting for instruction 31.8 Waiting for inspection 6.5
Information
Waiting for drawings 14
52.3
Rework due to design change 16.2 Rework due to design error 20.6
Rework due to design omission
6.4
Variation
Rework due to field error 15.6
58.8
Congestion Waiting due to congested site 18.3 18.3 Sequencing Waiting due to crews’ interference 14.4 14.4
Labor Idling due to labor’s no enthusiasm
8.7 8.7
Weather Waiting due to wet days 23.9 23.9
38
Equipment, 27.40%
Tools, 16.80%Material, 9.40%
Information, 13.78%
variation, 15.49%
Others, 17.20%
Figure 4.2 The percentage of different wastes on site
39

CHAPTER 5
THE RELATIONSHIP BETWEEN PRODUCTIVITY AND WASTES
5.1 INTRODUCTION
This chapter discusses the development of the neural network model for estimating the
construction productivity indices. Along with the model development, the critical site
wastes of the construction productivity were identified.
5.2 ADOPTION OF NEURAL NETWORK APPROACH
Conventionally, regression techniques have been used to develop the models related to
construction performance. Dacy (1965) established a linear regression model for
estimating productivity indices. Jaselskis (1988) developed predictive models using
logistic regression techniques to predict budget, schedule, and overall outstanding project
performances. In essence, regression techniques are suitable for variables that are
independent of each other. An apriori assumption of the functional relationship between
the input factors and project outcomes is necessary under the regression technique.
40
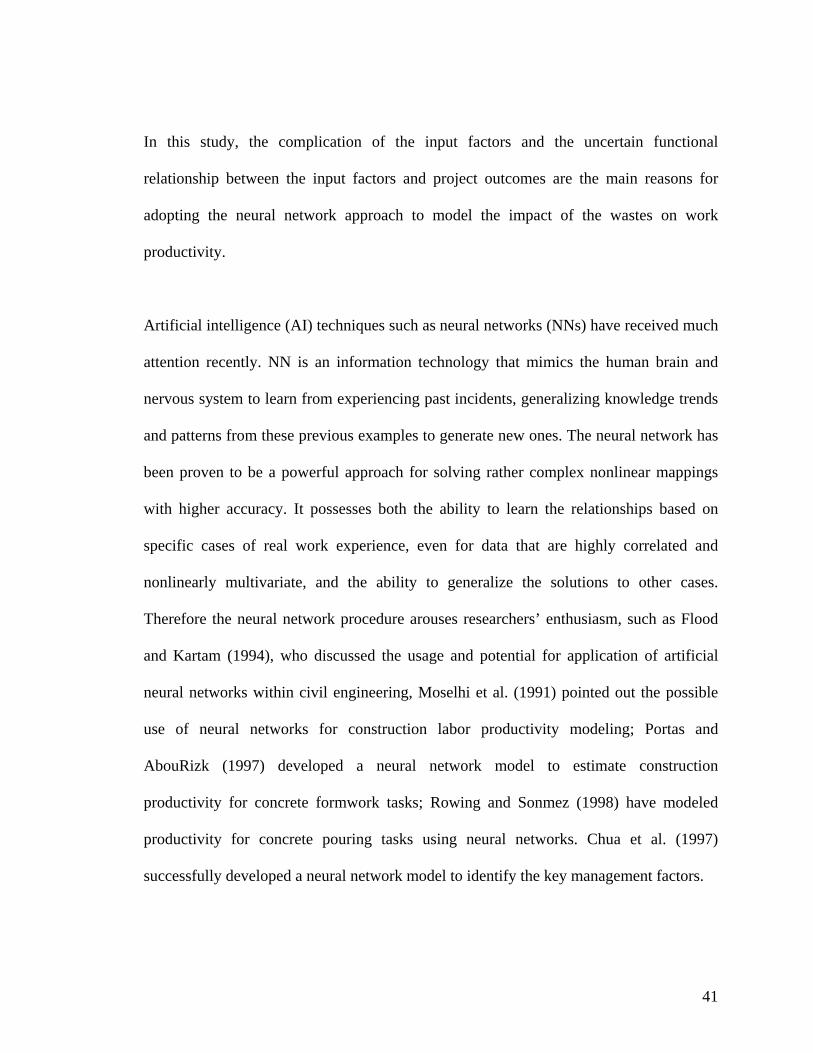
In this study, the complication of the input factors and the uncertain functional
relationship between the input factors and project outcomes are the main reasons for
adopting the neural network approach to model the impact of the wastes on work
productivity.
Artificial intelligence (AI) techniques such as neural networks (NNs) have received much
attention recently. NN is an information technology that mimics the human brain and
nervous system to learn from experiencing past incidents, generalizing knowledge trends
and patterns from these previous examples to generate new ones. The neural network has
been proven to be a powerful approach for solving rather complex nonlinear mappings
with higher accuracy. It possesses both the ability to learn the relationships based on
specific cases of real work experience, even for data that are highly correlated and
nonlinearly multivariate, and the ability to generalize the solutions to other cases.
Therefore the neural network procedure arouses researchers’ enthusiasm, such as Flood
and Kartam (1994), who discussed the usage and potential for application of artificial
neural networks within civil engineering, Moselhi et al. (1991) pointed out the possible
use of neural networks for construction labor productivity modeling; Portas and
AbouRizk (1997) developed a neural network model to estimate construction
productivity for concrete formwork tasks; Rowing and Sonmez (1998) have modeled
productivity for concrete pouring tasks using neural networks. Chua et al. (1997)
successfully developed a neural network model to identify the key management factors.
41

5.3 CONFIGURATION OF THE NEURAL NETWORK MODEL
Several configurations for the neural networks are possible and were tried. Eventually,
the following NN characteristics were adopted. The network comprised four layers as
shown in Figure 5.1, with two hidden layers and an input and output layer of nodes--or
more specifically neurons corresponding to their biological counterparts. The full
standard connections between the layers were adopted according to the back propagation
approach.
Input layer Hidden layer 1 Hidden layer 2 Output layer
Figure 5.1 Neural network architecture with two hidden layers
Each node receives its input from the preceding nodes in the earlier layers and generates
an output based on an activation function and the corresponding weights of the
connections:
∑=i
ii XWfO )( ... (5.1)
42

where O is the output at the node, Xi and Wi the ith input and corresponding weight, and f
the sigmoid activation function (Fu, 1994). Figure 5.2 is the schematic diagram of a
processing element.
Wk1X1
Among the various neural network architectures and paradigms, the back propagation
neural network is probably an effective network for most applications. It has the ability to
acquire arbitrarily complex nonlinear mappings with great reliability. In essence, the back
propagation NN learns a mapping from a set of input patterns to a set of corresponding
output patterns by adjusting the connection weights until the error in the output patterns is
minimized. In the present case, a set of waste elements in the input layer has to be
mapped onto a set of productivity records. The learning rule in back propagation adopts a
type of gradient descent technique with backward error propagation from the output layer
through the connections between the layers until the input layer is reached.
Summing junction
Activation function Wk2
∑
Wkm
X2 Output
f(. ) yk
Xm
Synaptic weights
… …
Processing element
Input
Figure 5.2 Schematic diagram of a processing element
43
The input layer has twenty neurons representing the twenty waste sources shown as Table
4.2. There are two hidden layers with ten neurons in each. The output layer has only one
neuron representing the productivity. Among the 75 patterns available, 62 data sets were
randomly chosen for training the neural network while the remaining 13 data sets were
used for testing. The neural network model in the present study was developed using
Neural Shell II
Learning
During training, the neural network is presented with a set of input vectors and desired
output vectors. The systems will first of all be using the input to generate an output,
which is then compared with the desired output that has been supplied. Learning will take
place only if there is a difference between these values, in which case the weights will be
adjusted so as to reduce the difference.
NeuroShell II uses a validation technique called Net-Perfect to optimize the network by
applying the current network to an independent test set, which is randomly selected
during training. Net-Perfect finds the optimum network for the data in the test set by
computing the mean squared error between actual and predicted for all outputs over
all patterns. The mean squared error (MSE) between actual and predicted output is
calculated as
iy iy
MSE= ∑iN
(1 2)ˆii yy − …(5.2)
where N is the number of examples in the test set.
44
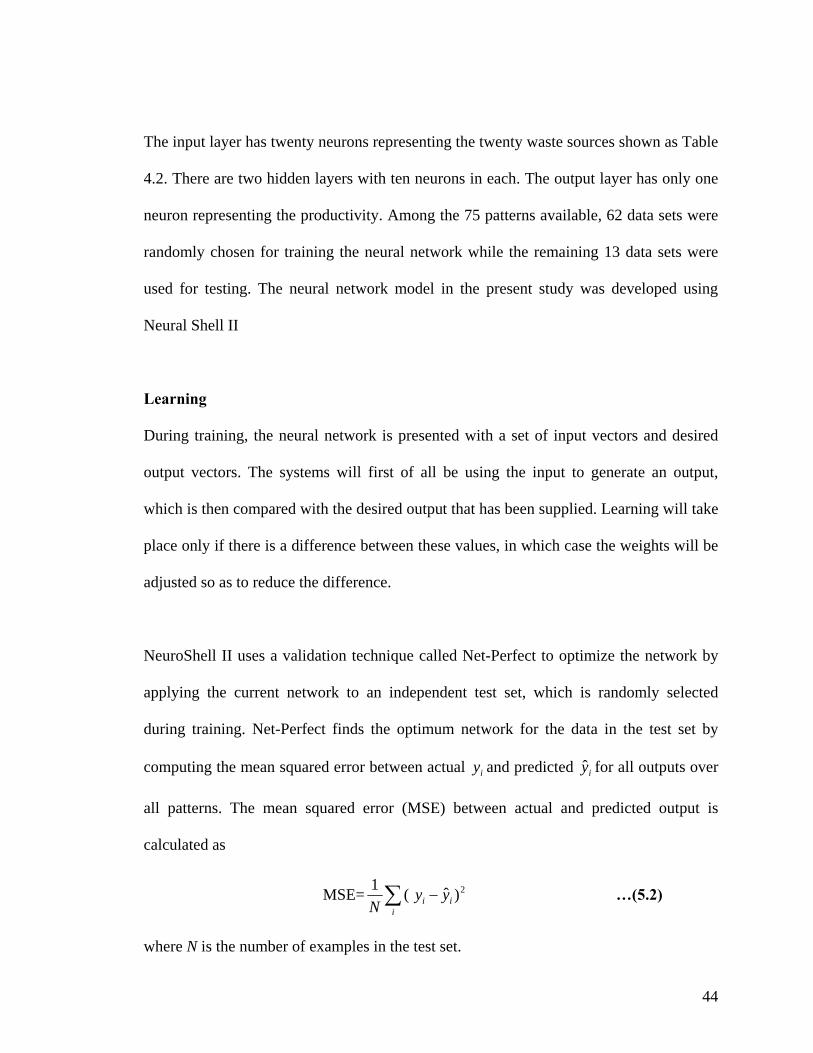
The network is saved every time a new minimum average error (or mean squared error) is
reached. Figure 5.3 shows the typical process of training with the Net-Perfect technique. A
vera
ge e
rror
Testing set
Training set
Learning epochs A
Figure 5.3 Typical graphs of average error graphics during training
During training, it can be seen that error for the training set continues to get smaller and
smaller, or at least gets to the point where it is fairly flat; the error for the test set
continues to get smaller to a point (point A), and then it slowly begins to get larger due to
overlearning. To avoid overtraining the network, Net-Perfect saves the network at this
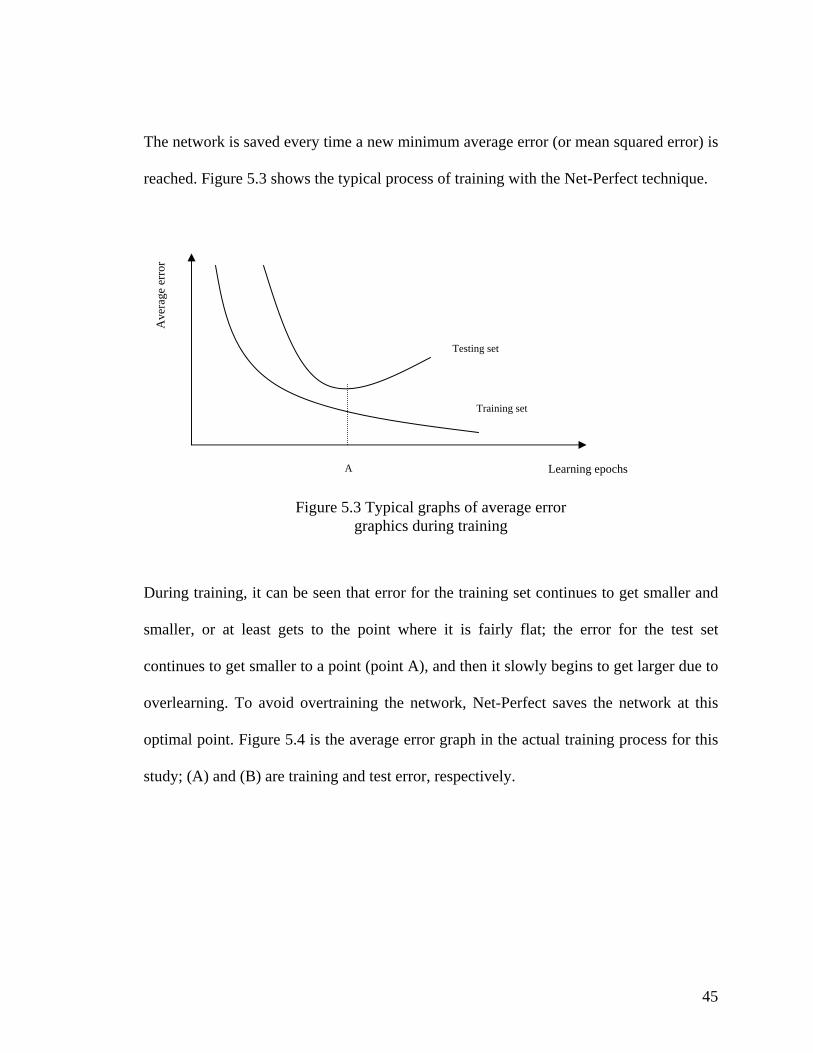
optimal point. Figure 5.4 is the average error graph in the actual training process for this
study; (A) and (B) are training and test error, respectively.
45
)
Figure 5.4 A(A) Training set averag
For the purpose of assessing the predic
R Squared is used to measure the predic
∑
∑−=R 2 1
where and are, respectively, measuiy iy
measured data; and R2 is the coefficient
in an R2 value of 1, a good fit near 1, an
(A
t
(B)
A
ctual training graphics e error (B) Test set average error
ion performance obtained by the model, an index
tion accuracy and is defined as
=
=
−
−
n
iii
n
iii
yy
yy
1
2
1
2
)(
)ˆ( ... (5.3)
red and predicted data; iy is the mean value of
of multiple determinations. A perfect fit would fit
d a very poor fit near 0.
46
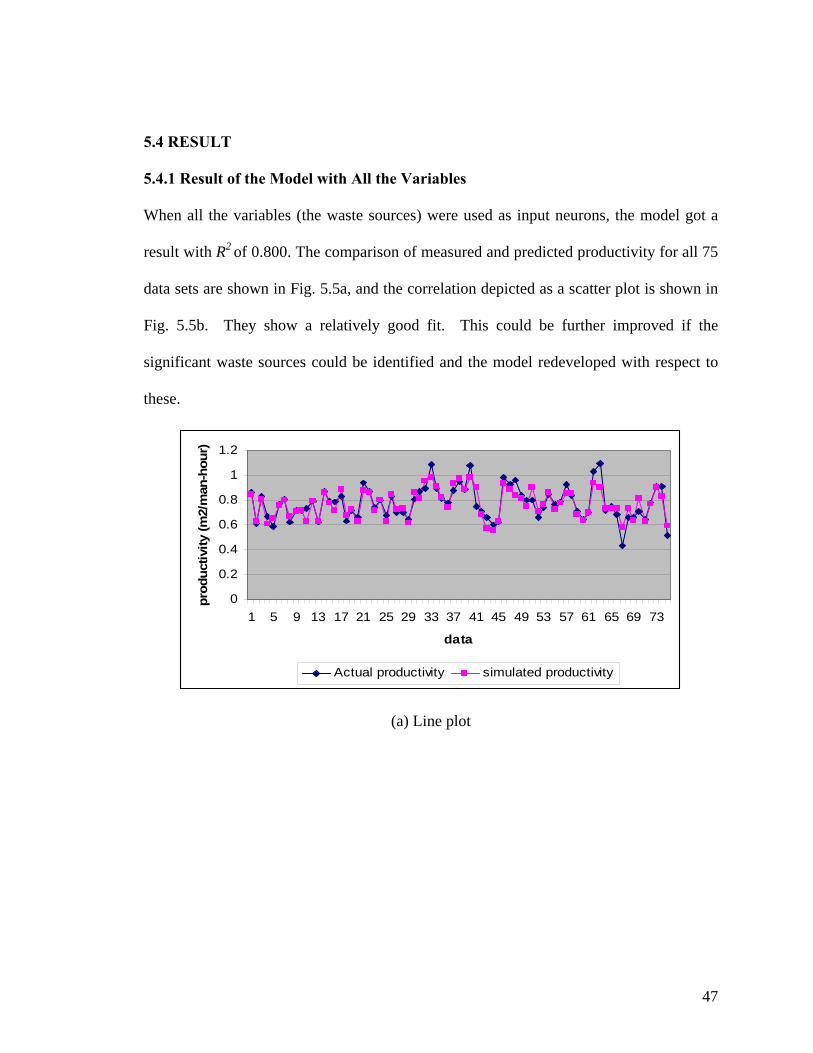
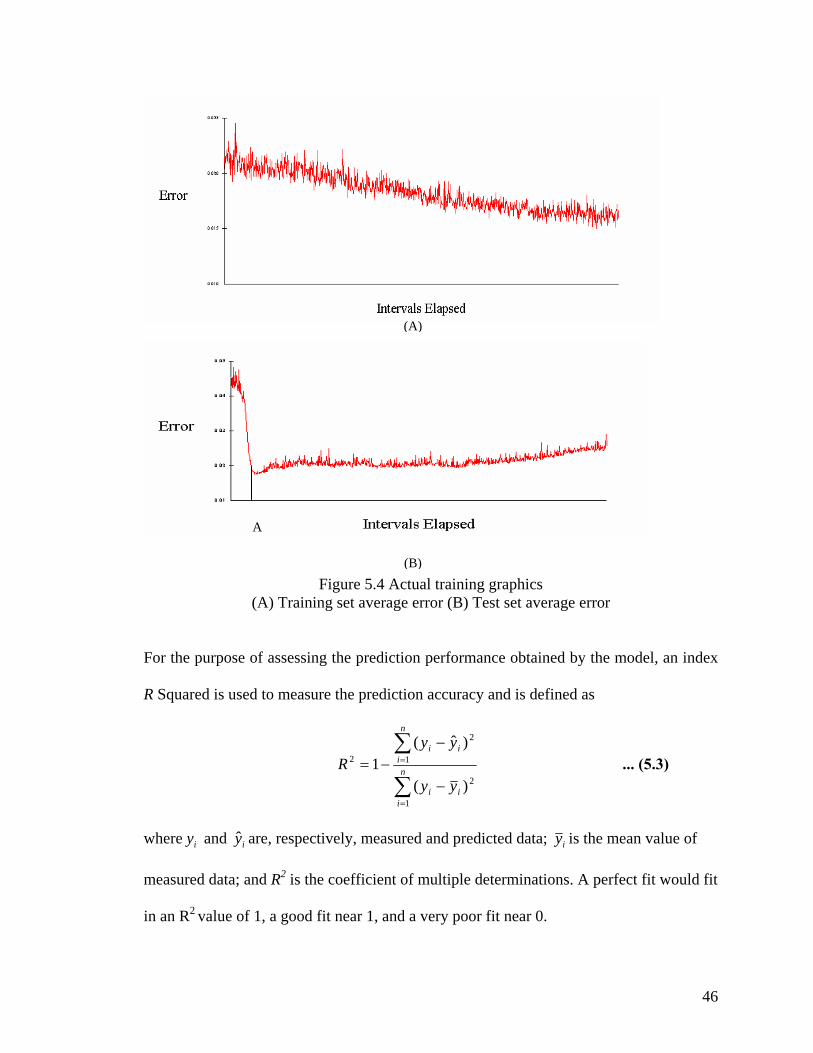
5.4 RESULT
5.4.1 Result of the Model with All the Variables
When all the variables (the waste sources) were used as input neurons, the model got a
result with R2 of 0.800. The comparison of measured and predicted productivity for all 75
data sets are shown in Fig. 5.5a, and the correlation depicted as a scatter plot is shown in
Fig. 5.5b. They show a relatively good fit. This could be further improved if the
significant waste sources could be identified and the model redeveloped with respect to
these.
0
0.2
0.4
0.6
0.8
1
1.2
1 5 9 13 17 21 25 29 33 37 41 45 49 53 57 61 65 69 73
data
prod
uctiv
ity (m
2/m
an-h
our)
Actual productivity simulated productivity
(a) Line plot
47
0.5
0.6
0.7
0.8
0.9
1
1.1
0.4 0.6 0.8 1 1.2
Actual productivity (m2/man-hour)
Sim
ulat
ed p
rodu
ctiv
ity (m
2/m
an-
hour
)
R2=0.800
(b) Scatter plot
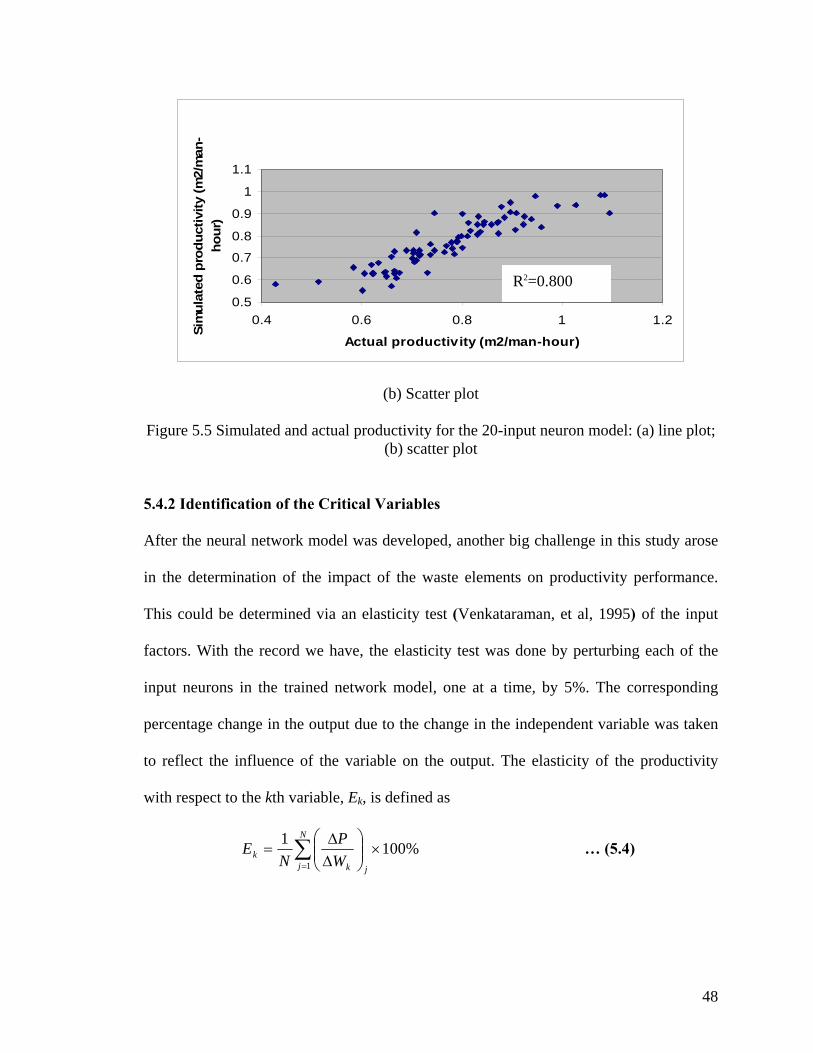
Figure 5.5 Simulated and actual productivity for the 20-input neuron model: (a) line plot; (b) scatter plot
5.4.2 Identification of the Critical Variables
After the neural network model was developed, another big challenge in this study arose
in the determination of the impact of the waste elements on productivity performance.
This could be determined via an elasticity test (Venkataraman, et al, 1995) of the input
factors. With the record we have, the elasticity test was done by perturbing each of the
input neurons in the trained network model, one at a time, by 5%. The corresponding
percentage change in the output due to the change in the independent variable was taken
to reflect the influence of the variable on the output. The elasticity of the productivity
with respect to the kth variable, Ek, is defined as
∑=
×⎟⎟⎠
⎞⎜⎜⎝
⎛∆∆
=N
j jkk W
PN
E1
%1001 … (5.4)
48
where ∆P is the change in the productivity due to a corresponding 5% change in the kth
waste element, ∆Wk, subscript j denotes the ratio obtained for the jth data set, and N is
the number of data sets used in the study.
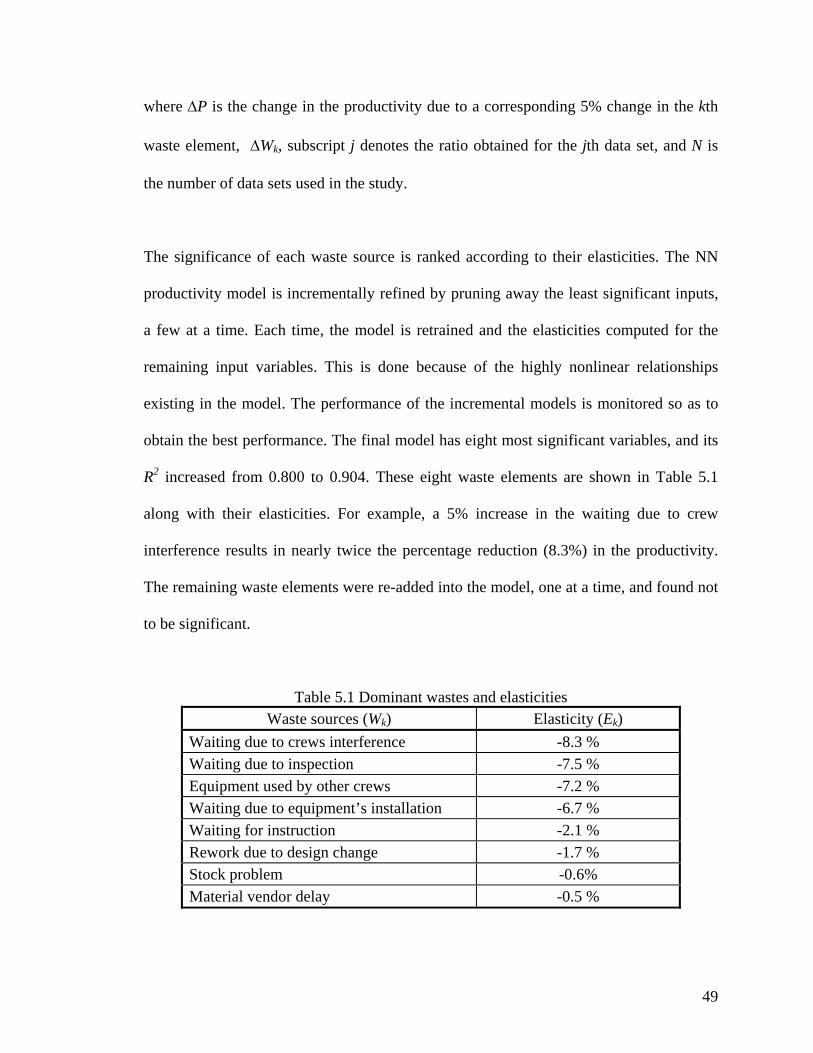
The significance of each waste source is ranked according to their elasticities. The NN
productivity model is incrementally refined by pruning away the least significant inputs,
a few at a time. Each time, the model is retrained and the elasticities computed for the
remaining input variables. This is done because of the highly nonlinear relationships
existing in the model. The performance of the incremental models is monitored so as to
obtain the best performance. The final model has eight most significant variables, and its
R2 increased from 0.800 to 0.904. These eight waste elements are shown in Table 5.1
along with their elasticities. For example, a 5% increase in the waiting due to crew
interference results in nearly twice the percentage reduction (8.3%) in the productivity.
The remaining waste elements were re-added into the model, one at a time, and found not
to be significant.
Table 5.1 Dominant wastes and elasticities Waste sources (Wk) Elasticity (Ek)
Waiting due to crews interference -8.3 % Waiting due to inspection -7.5 % Equipment used by other crews -7.2 % Waiting due to equipment’s installation -6.7 % Waiting for instruction -2.1 % Rework due to design change -1.7 % Stock problem -0.6% Material vendor delay -0.5 %
49

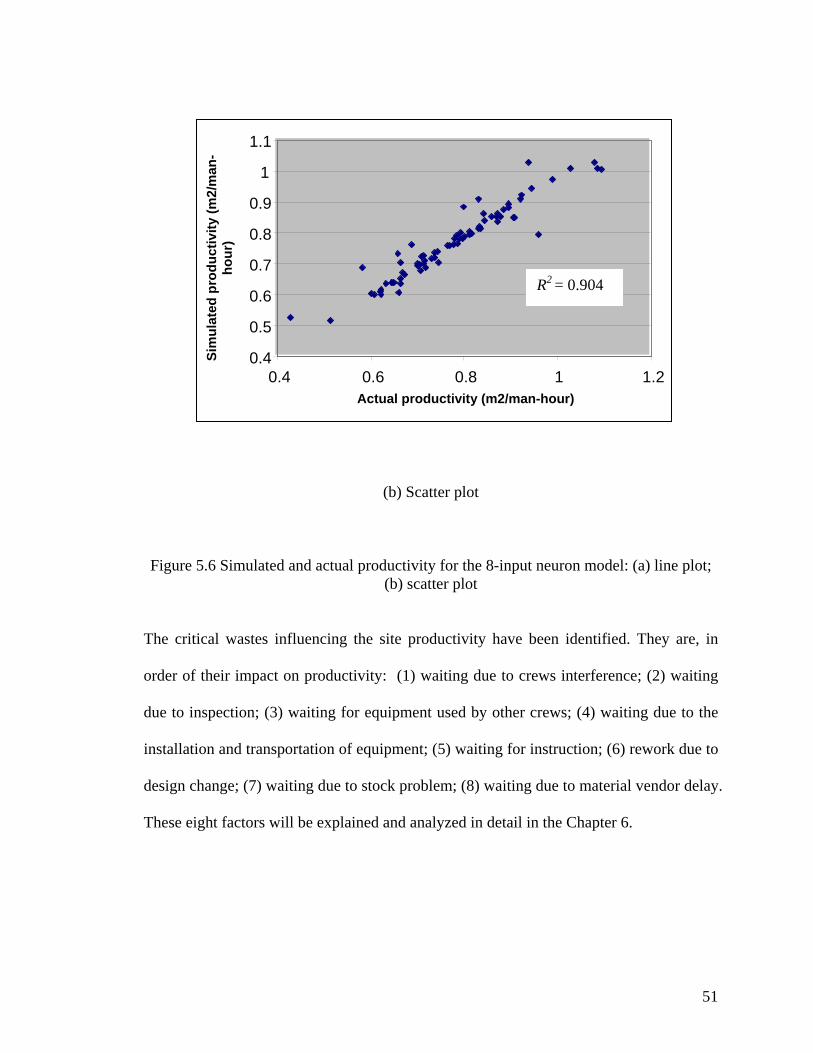
The comparisons of measured and predicted productivity for all 75 data sets with the final
model are shown in Fig. 5.6a, and the correlation depicted as a scatter plot is shown in
Fig. 5.6b. It is evident that the model shows a better correlation between prediction and
measured performance than before. There is considerably less scatter compared with the
initial model achieved through eliminating the less significant waste sources in the input.
0
0.2
0.4
0.6
0.8
1
1.2
1 5 9 13 17 21 25 29 33 37 41 45 49 53 57 61 65 69 73
Data
Pro
duct
ivity
(m2/
man
-hou
r)
Actual productivity Simulated productivity
(a) Line plot
50
1.1
Sim
ulat
ed p
rodu
ctiv
ity (m
2/m
an-
hour
)
1
0.9
0.8
0.7
(b) Scatter plot
Figure 5.6 Simulated and actual productivity for the 8-input neuron model: (a) line plot; (b) scatter plot
The critical wastes influencing the site productivity have been identified. They are, in
order of their impact on productivity: (1) waiting due to crews interference; (2) waiting
due to inspection; (3) waiting for equipment used by other crews; (4) waiting due to the
installation and transportation of equipment; (5) waiting for instruction; (6) rework due to
design change; (7) waiting due to stock problem; (8) waiting due to material vendor delay.
These eight factors will be explained and analyzed in detail in the Chapter 6.
0.4
0.5
0.6
0.4 0.6 0.8 1 1.2Actual productivity (m2/man-hour)
R2 = 0.904
51

The chapter 6 studies further on the root causes of these key wastes. The project level
factors which most contribute to these key waste sources will be identified with statistic
analysis.
52

CHAPTER 6
ANALYSIS ON PROJECT LEVEL
6.1 INTRODUCTION
The critical wastes affecting construction productivity have been identified in the
previous stage of this study. These eight critical wastes will be related to the project-level
factors to trace their root causes in this chapter.
6.2 METHODOLOGY
In this step of this study, the eight critical wastes for every project are correlated with the
respective project organization and management characteristics, which comprise the first
section of the questionnaire survey.
The project-level factors are measured with a 5-point scale, as depicted in Appendix A.
For the correlation, the number of the monthly man-hours wasted on each kind of waste
53
is first converted to a similar 5-point-scale format. The method of converting is described
hereunder.
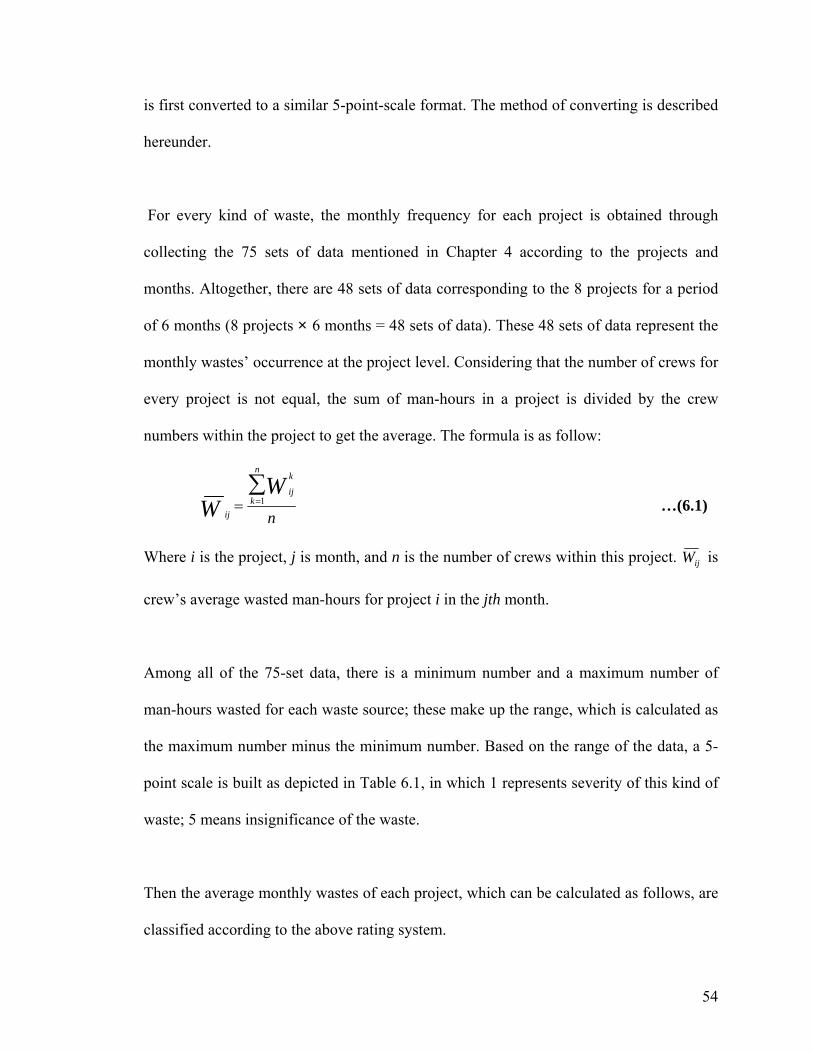
For every kind of waste, the monthly frequency for each project is obtained through
collecting the 75 sets of data mentioned in Chapter 4 according to the projects and
months. Altogether, there are 48 sets of data corresponding to the 8 projects for a period
of 6 months (8 projects × 6 months = 48 sets of data). These 48 sets of data represent the
monthly wastes’ occurrence at the project level. Considering that the number of crews for
every project is not equal, the sum of man-hours in a project is divided by the crew
numbers within the project to get the average. The formula is as follow:
n
n
k
k
ij
ij
WW
∑== 1 …(6.1)
Where i is the project, j is month, and n is the number of crews within this project. ijW is
crew’s average wasted man-hours for project i in the jth month.
Among all of the 75-set data, there is a minimum number and a maximum number of
man-hours wasted for each waste source; these make up the range, which is calculated as
the maximum number minus the minimum number. Based on the range of the data, a 5-
point scale is built as depicted in Table 6.1, in which 1 represents severity of this kind of
waste; 5 means insignificance of the waste.
Then the average monthly wastes of each project, which can be calculated as follows, are
classified according to the above rating system.
54
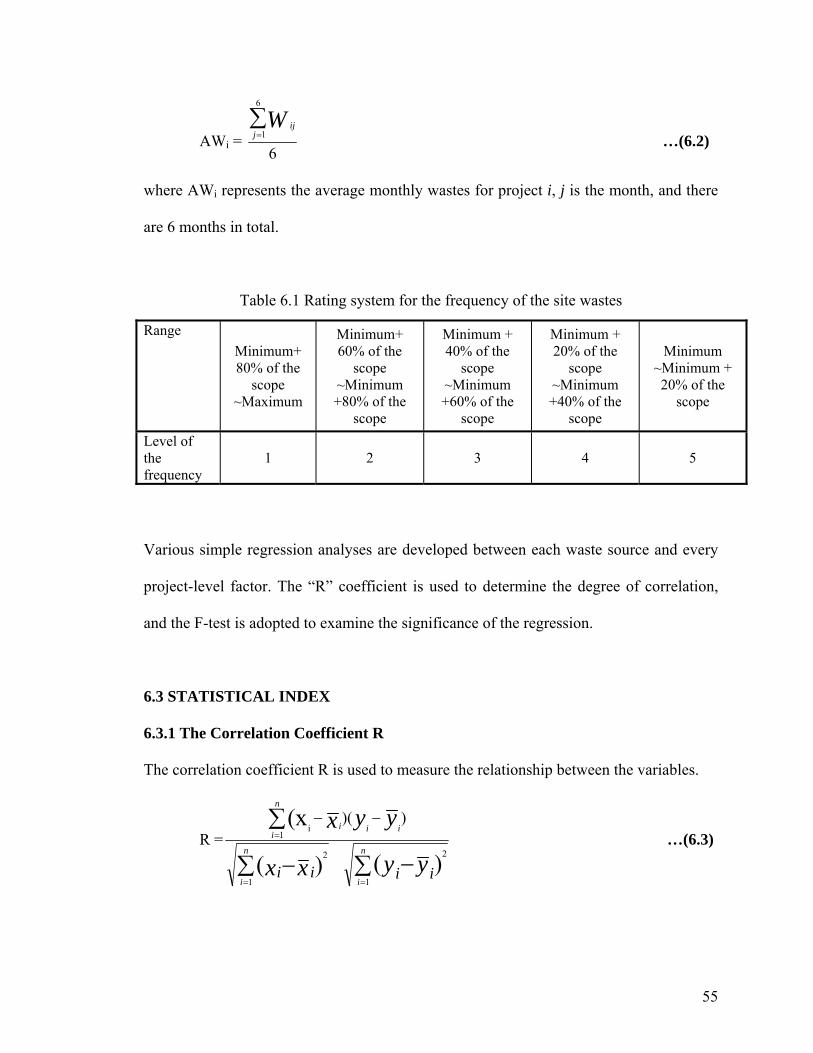
AWi = 6
6
1∑=j
ijW …(6.2)
where AWi represents the average monthly wastes for project i, j is the month, and there
are 6 months in total.
Table 6.1 Rating system for the frequency of the site wastes
Range Minimum+ 80% of the
scope ~Maximum
Minimum+ 60% of the
scope ~Minimum +80% of the
scope
Minimum + 40% of the
scope ~Minimum +60% of the
scope
Minimum + 20% of the
scope ~Minimum +40% of the
scope
Minimum ~Minimum + 20% of the
scope
Level of the frequency
1 2 3 4 5
Various simple regression analyses are developed between each waste source and every
project-level factor. The “R” coefficient is used to determine the degree of correlation,
and the F-test is adopted to examine the significance of the regression.
6.3 STATISTICAL INDEX
6.3.1 The Correlation Coefficient R
The correlation coefficient R is used to measure the relationship between the variables.
R =
∑ −∑ −
∑
==
=
−−
n
i
n
i
n
iiii
yyxx
yyx
iiii1
2
1
2
1i
)()(
(x ))( …(6.3)
55

where R is a dimensionless quantity that can be used to measure the linear association
between pairs of variables. Xi, Yi are a pair of variables studied, xi and yi
are their
respective means. n is the number of pairs of data used in the analysis. R ranges from -1
to +1. In general, the closer that R is to +1 (or -1) the higher the degree of correlation.
The sign of R indicates the positive or negative slope of the trend line. The critical R
value used in this study is 0.7.
6.3.2 Significance of the Model
An F-test was conducted for the significance analysis.
F-value =)2(
1−nSSE
SSR …(6.4)
where SSR is Regression Sum of Squares, which is calculated by∑ −=
n
iyyi
1
2)ˆ( ; SSE is
Error Sum of Squares, and it equals , and are measured and
predicted data, respectively ; and
∑ −=
n
iyy ii
1
2)ˆ( iy iy
iy is the mean value of measured data.
When F is greater than F0 that is the critical value of the F-test, the association between X
and Y would be regarded as significant. For this study, at the confidence of 0.95, the F0
for the 8 pairs of data is 5.99.
In this study, the critical value used for R is 0.7, this is stronger than some studies that
apply, as indicated by R = 0.64 (Smith, 1999) and R = 0.566 (Thomas et al., 2002). This
means that when the R value is greater than 0.7 and the regression is significant as given
56
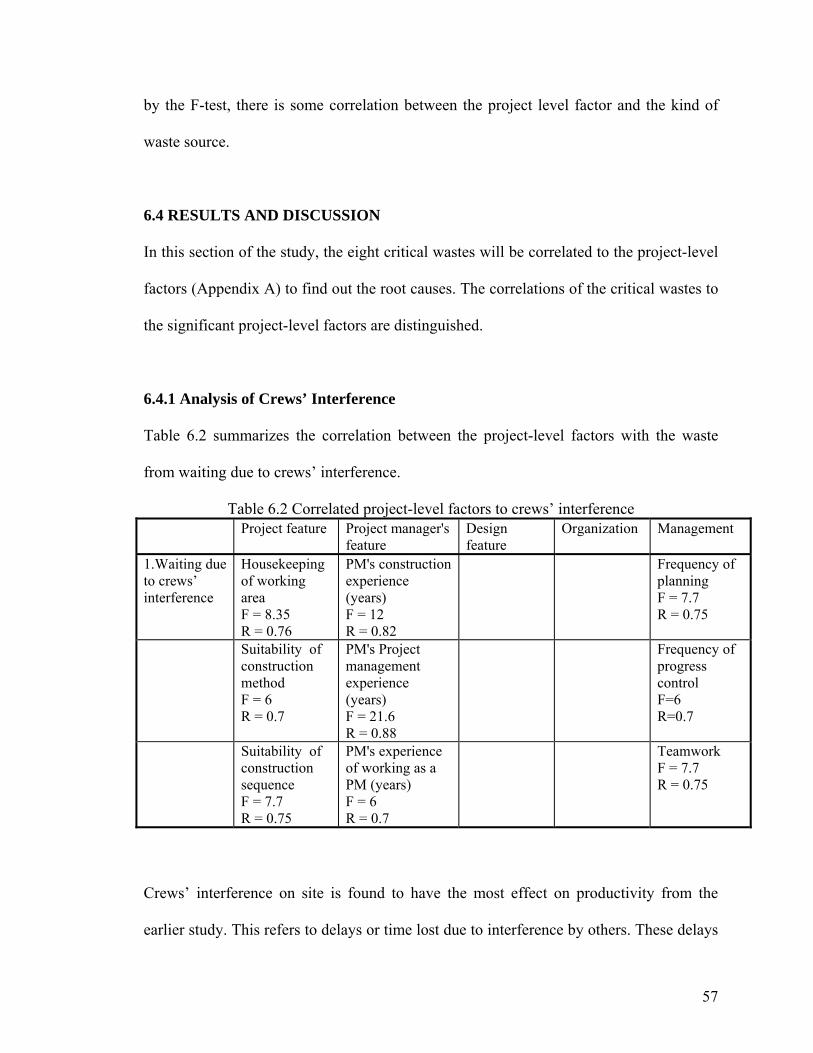
by the F-test, there is some correlation between the project level factor and the kind of
waste source.
6.4 RESULTS AND DISCUSSION
In this section of the study, the eight critical wastes will be correlated to the project-level
factors (Appendix A) to find out the root causes. The correlations of the critical wastes to
the significant project-level factors are distinguished.
6.4.1 Analysis of Crews’ Interference
Table 6.2 summarizes the correlation between the project-level factors with the waste
from waiting due to crews’ interference.
Table 6.2 Correlated project-level factors to crews’ interference Project feature Project manager's
feature Design feature
Organization Management
1.Waiting due to crews’ interference
Housekeeping of working area F = 8.35 R = 0.76
PM's construction experience (years) F = 12 R = 0.82
Frequency of planning F = 7.7 R = 0.75
Suitability of construction method F = 6 R = 0.7
PM's Project management experience (years) F = 21.6 R = 0.88
Frequency of progress control F=6 R=0.7
Suitability of construction sequence F = 7.7 R = 0.75
PM's experience of working as a PM (years) F = 6 R = 0.7
Teamwork F = 7.7 R = 0.75
Crews’ interference on site is found to have the most effect on productivity from the
earlier study. This refers to delays or time lost due to interference by others. These delays
57
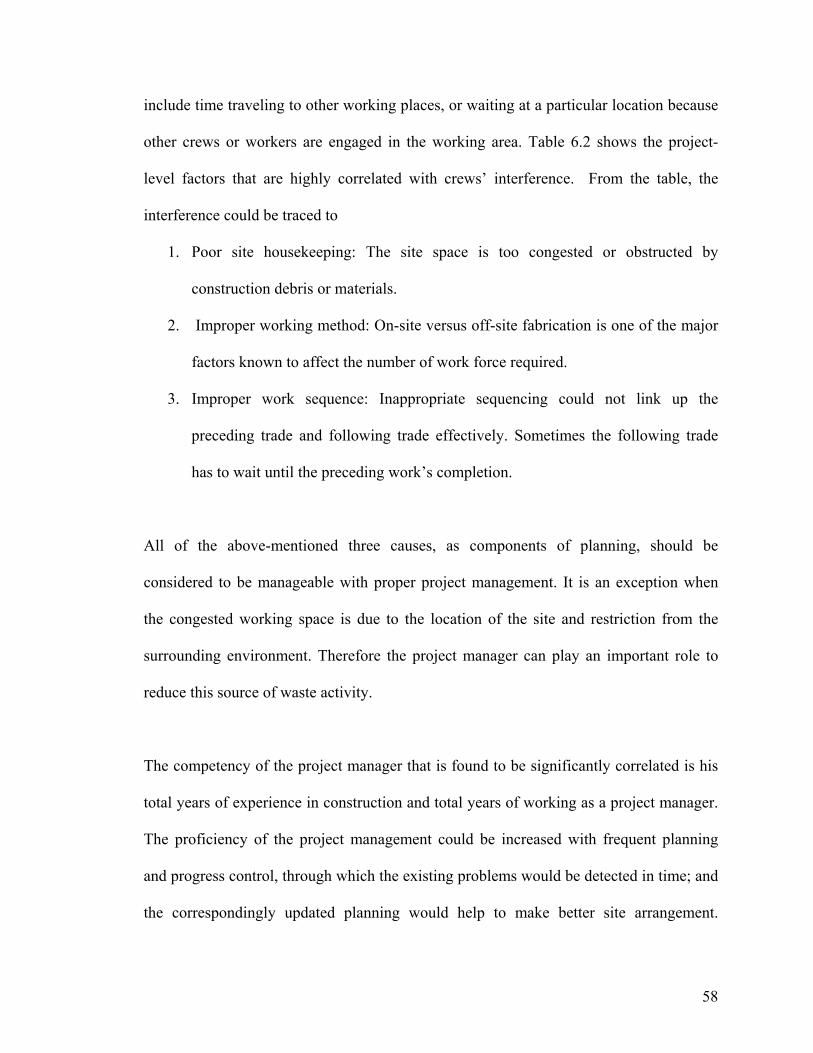
include time traveling to other working places, or waiting at a particular location because
other crews or workers are engaged in the working area. Table 6.2 shows the project-
level factors that are highly correlated with crews’ interference. From the table, the
interference could be traced to
1. Poor site housekeeping: The site space is too congested or obstructed by
construction debris or materials.
2. Improper working method: On-site versus off-site fabrication is one of the major
factors known to affect the number of work force required.
3. Improper work sequence: Inappropriate sequencing could not link up the
preceding trade and following trade effectively. Sometimes the following trade
has to wait until the preceding work’s completion.
All of the above-mentioned three causes, as components of planning, should be
considered to be manageable with proper project management. It is an exception when
the congested working space is due to the location of the site and restriction from the
surrounding environment. Therefore the project manager can play an important role to
reduce this source of waste activity.
The competency of the project manager that is found to be significantly correlated is his
total years of experience in construction and total years of working as a project manager.
The proficiency of the project management could be increased with frequent planning
and progress control, through which the existing problems would be detected in time; and
the correspondingly updated planning would help to make better site arrangement.
58
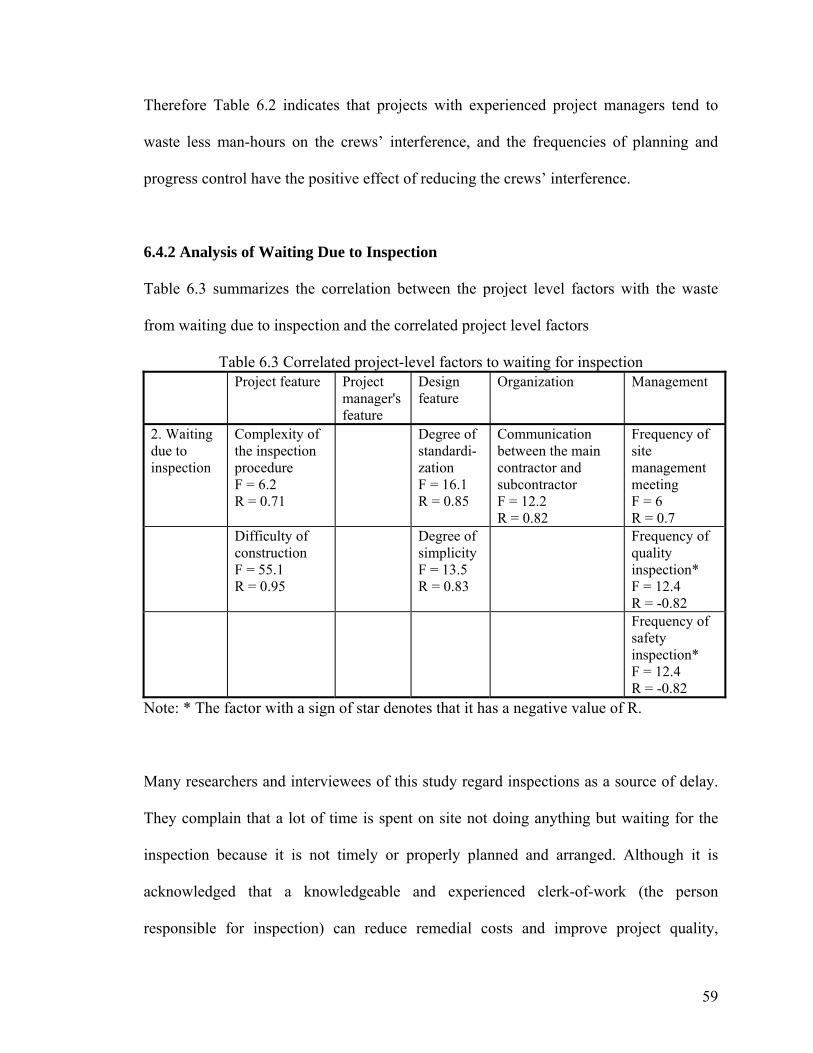
Therefore Table 6.2 indicates that projects with experienced project managers tend to
waste less man-hours on the crews’ interference, and the frequencies of planning and
progress control have the positive effect of reducing the crews’ interference.
6.4.2 Analysis of Waiting Due to Inspection
Table 6.3 summarizes the correlation between the project level factors with the waste
from waiting due to inspection and the correlated project level factors
Table 6.3 Correlated project-level factors to waiting for inspection Project feature Project
manager's feature
Design feature
Organization Management
2. Waiting due to inspection
Complexity of the inspection procedure F = 6.2 R = 0.71
Degree of standardi-zation F = 16.1 R = 0.85
Communication between the main contractor and subcontractor F = 12.2 R = 0.82
Frequency of site management meeting F = 6 R = 0.7
Difficulty of construction F = 55.1 R = 0.95
Degree of simplicity F = 13.5 R = 0.83
Frequency of quality inspection* F = 12.4 R = -0.82
Frequency of safety inspection* F = 12.4 R = -0.82
Note: * The factor with a sign of star denotes that it has a negative value of R.
Many researchers and interviewees of this study regard inspections as a source of delay.
They complain that a lot of time is spent on site not doing anything but waiting for the
inspection because it is not timely or properly planned and arranged. Although it is
acknowledged that a knowledgeable and experienced clerk-of-work (the person
responsible for inspection) can reduce remedial costs and improve project quality,
59
excessive or prolonged inspection would contradict its benefit. This result is also
reflected from Table 6.3, in which the frequency of the inspections on quality and safety
take a negative effect on “waiting due to inspection.” That means more frequent
inspections lead to more waiting time.
Some factors lead to low efficiency of inspection. Normally the subcontractor initiates
the inspection when part of their work is completed; then the main contractor will liaise
with the clerk-of-work to arrange the inspection. Hence good communication between
main contractor and subcontractor is very critical in reducing waiting time. Good
communication means adequate communication channels and their effectiveness in
delivering sufficient information to the appropriate persons. Site management meetings
provide one chance to enhance the communications among various parties in the project.
The data in Table 6.3 suggest that better quality in the communication between main
contractor and subcontractor and more frequent site meetings would help to reduce the
time wasting at inspections.
Another cause for “waiting due to inspection” that can be seen from Table 6.3 is the
difficulty of construction and buildability of design. More difficult construction and
lower buildability lead to more content of work to be inspected. As a result, longer time
on inspection becomes unavoidable.
60
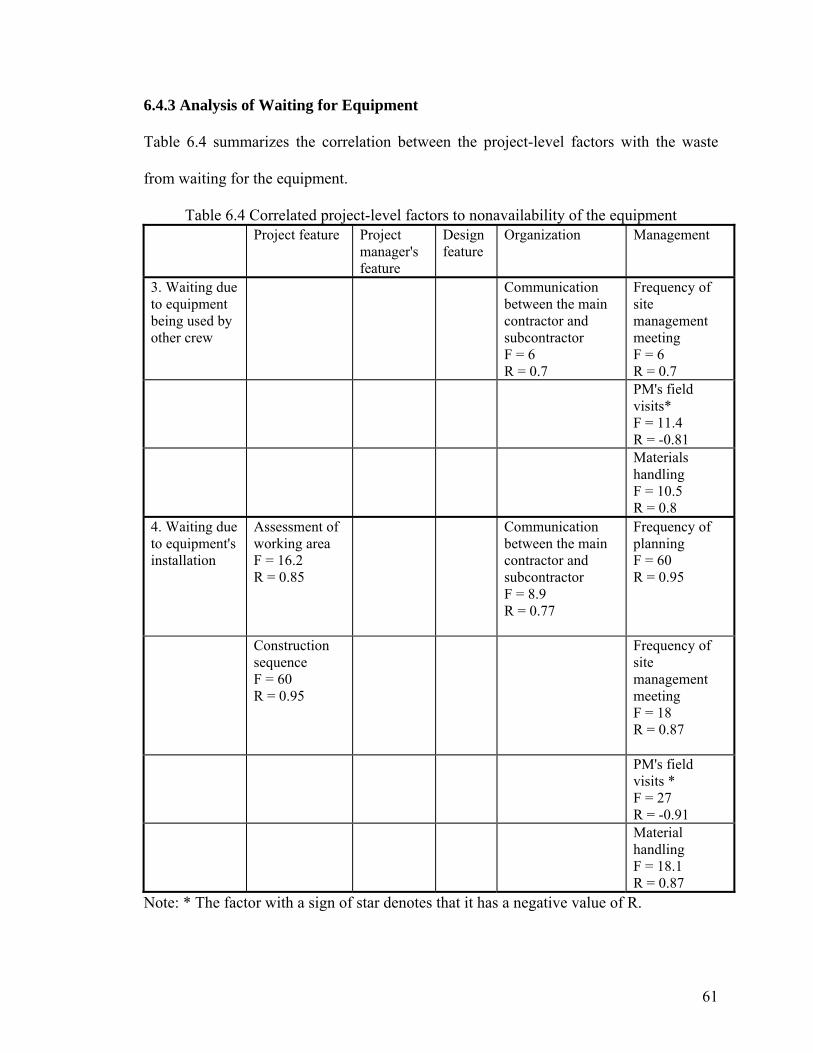
6.4.3 Analysis of Waiting for Equipment
Table 6.4 summarizes the correlation between the project-level factors with the waste
from waiting for the equipment.
Table 6.4 Correlated project-level factors to nonavailability of the equipment Project feature Project
manager's feature
Design feature
Organization Management
3. Waiting due to equipment being used by other crew
Communication between the main contractor and subcontractor F = 6 R = 0.7
Frequency of site management meeting F = 6 R = 0.7
PM's field visits* F = 11.4 R = -0.81
Materials handling F = 10.5 R = 0.8
4. Waiting due to equipment's installation
Assessment of working area F = 16.2 R = 0.85
Communication between the main contractor and subcontractor F = 8.9 R = 0.77
Frequency of planning F = 60 R = 0.95
Construction sequence F = 60 R = 0.95
Frequency of site management meeting F = 18 R = 0.87
PM's field visits * F = 27 R = -0.91
Material handling F = 18.1 R = 0.87
Note: * The factor with a sign of star denotes that it has a negative value of R.
61

Major equipment on site includes cranes, passenger/cargo lift, trailer/lorry, concrete
pump, truck mixer, and safety scaffolding. The entire construction process depends
heavily on this equipment. For example, cranes are needed to move and position
formwork, hoist and place reinforcement; the truck mixer and concrete pump are
indispensable to transport and place concrete. Any interruption in the use of the
equipment will lead to serious material handling problems and slowdown or even
stoppage of operations. Therefore the availability of equipment was regarded as crucially
important for construction progress.
However, in practice, in consideration of cost, main contractors are inclined to provide a
minimum amount of equipment on site. The amount of equipment is always planned
under the assumption of the optimal situation, in which all the trades are linked to each
other without any need for queuing or idling. As such the equipment is shared and
planned for high utilization. While the optimal condition is difficult to achieve in reality,
even the most proper planning cannot prevent an unforeseen circumstance from occurring.
Consequently, this phenomenon has caused the most complaints from the respondents.
This is evident in Table 4.2, where waiting for equipment is a frequently encountered
problem, which has contributed to about 72.5 man-hours lost on average each month,
forming the highest proportion of all waste sources.
Besides the high utilization rate, the frequent material handling and congested working
area increase the demand on equipment, and on the installation or movement of
equipment that will aggravate the situation of waiting for equipment. It is observed that
62
improved communication and coordination among the various parties can help to reduce
this conflict. Better communication could be effected through more site management
meeting and planning.
Via the correlation coefficient value, Table 6.4 indicates that the frequency of the project
manager (PM)’s field visits have negative influence on man-hours waste. The more often
the PM visits the site, the more man-hours are wasted. This result seems contradictory
with the common sense that the time of site visit reflects the PM’s effort devoted to the
project. The possible explanation could be that it is the problems occurred that bring the
PM to site more frequently.
63
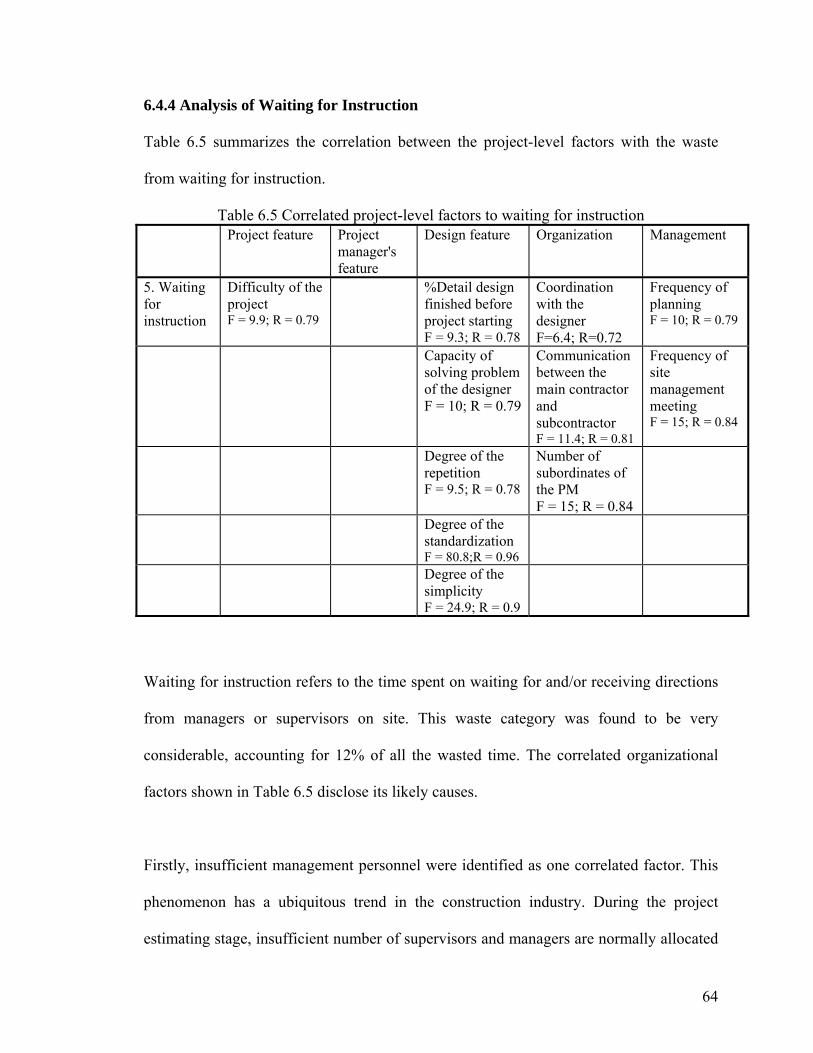
6.4.4 Analysis of Waiting for Instruction
Table 6.5 summarizes the correlation between the project-level factors with the waste
from waiting for instruction.
Table 6.5 Correlated project-level factors to waiting for instruction Project feature Project
manager's feature
Design feature Organization Management
5. Waiting for instruction
Difficulty of the project F = 9.9; R = 0.79
%Detail design finished before project starting F = 9.3; R = 0.78
Coordination with the designer F=6.4; R=0.72
Frequency of planning F = 10; R = 0.79
Capacity of solving problem of the designer F = 10; R = 0.79
Communication between the main contractor and subcontractor F = 11.4; R = 0.81
Frequency of site management meeting F = 15; R = 0.84
Degree of the repetition F = 9.5; R = 0.78
Number of subordinates of the PM F = 15; R = 0.84
Degree of the standardization F = 80.8;R = 0.96
Degree of the simplicity F = 24.9; R = 0.9
Waiting for instruction refers to the time spent on waiting for and/or receiving directions
from managers or supervisors on site. This waste category was found to be very
considerable, accounting for 12% of all the wasted time. The correlated organizational
factors shown in Table 6.5 disclose its likely causes.
Firstly, insufficient management personnel were identified as one correlated factor. This
phenomenon has a ubiquitous trend in the construction industry. During the project
estimating stage, insufficient number of supervisors and managers are normally allocated
64
to the construction site due to budgetary problems. This lack of supervision on site causes
the busy managers to be confronted with more severe time constraints and problems with
time management, and consequently influences the proceeding of the project. A
reinforcement in site supervision could help reduce the man-hour wastes due to waiting
for instructions.
Other project-level factors include the design feature and the communication among
various parties. Accurate and detailed drawings make the work proceed smoothly and
reduce the requests for instruction; and the adequacy of communication channels and
their effectiveness in providing sufficient information to the appropriate persons would
increase the efficiency of site instructions.
Another reason for the waiting can be attributed to the difficulty of the project. The
degree of the difficulty includes both construction and design aspects. A more difficult
project would bring in more technical challenges to construction, and therefore more
supervision and instruction would be needed. Although the difficulty of a project is
beyond management control, it is possible and necessary to organize the project team
accordingly. For the demanding project, the project manager needs to purposely make
more effort and deploy more management force to it.
When the work has a high degree of repetition, it will have a significantly positive effect
on the project, for the repetition of work could help workers to learn and get to know the
job well and consequently require less instruction. More simple and standardized design
65
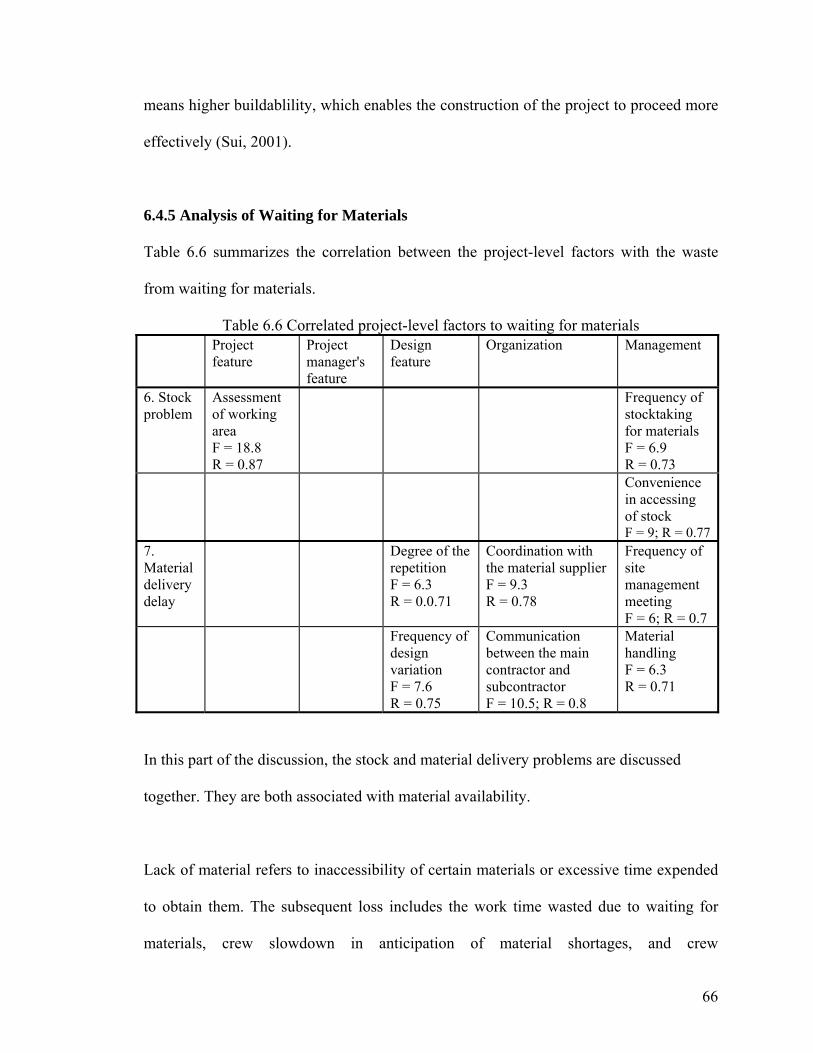
means higher buildablility, which enables the construction of the project to proceed more
effectively (Sui, 2001).
6.4.5 Analysis of Waiting for Materials
Table 6.6 summarizes the correlation between the project-level factors with the waste
from waiting for materials.
Table 6.6 Correlated project-level factors to waiting for materials Project
feature Project manager's feature
Design feature
Organization Management
6. Stock problem
Assessment of working area F = 18.8 R = 0.87
Frequency of stocktaking for materials F = 6.9 R = 0.73
Convenience in accessing of stock F = 9; R = 0.77
7. Material delivery delay
Degree of the repetition F = 6.3 R = 0.0.71
Coordination with the material supplier F = 9.3 R = 0.78
Frequency of site management meeting F = 6; R = 0.7
Frequency of design variation F = 7.6 R = 0.75
Communication between the main contractor and subcontractor F = 10.5; R = 0.8
Material handling F = 6.3 R = 0.71
In this part of the discussion, the stock and material delivery problems are discussed
together. They are both associated with material availability.
Lack of material refers to inaccessibility of certain materials or excessive time expended
to obtain them. The subsequent loss includes the work time wasted due to waiting for
materials, crew slowdown in anticipation of material shortages, and crew
66
refamiliarization after a lengthy delay. Thomas et al. (1989) estimated that the ineffective
material management caused an 18% work-hour overrun. This study found a total of 35.6
man-hour of unproductive time attributed to material unavailability, which amounts to
9.5% of total wasted time. Table 6.6 depicts the factors at project level that could cause
productivity loss due to material unavailability.
In the organizational aspect, it is indicated from Table 6.6 that communication and
coordination are key factors. The ordering of the materials in these contracts is the direct
responsibility of the main contractor, so that good communication is required between
subcontractor and main contractor to ensure a proper planning of material deliveries,
which would enable the uninterrupted supply to satisfy the work sequence. Besides this,
keeping good cash flow for the supplier would enhance the coordination between the
demand and supply; so it will reduce the chance that contractors suffer from the
disruption of material delivery due to late payment for the previous delivery.
Working space is another influential factor. This is understandable because site
congestion can hinder the availability of materials at the work face. Obstructed access
and disordered site conditions make on-site transportation difficult. Overcrowded
working area is one of the problems that contractors often have to face. This is not
surprising in Singapore because most high-rise buildings are constructed in densely
populated urban areas, which make it difficult to distribute materials to the desired work
faces when they are needed due to the limited space. The resulting extensive multiple
67
handling of materials, along with improperly sorted or marked out materials, would
worsen the situation of material availability.
Table 6.6 also shows that the smaller number of design changes and higher repetitive
level of work, the less would be the delay due to material deliveries problems. It is known
that the requirement for changing materials generally accompanies design change;
therefore the original material planning will have to be adjusted accordingly. As a result,
construction progress can be hindered since the supplier is unlikely to be able to meet the
new demand in a short time period. As for the repetition of the construction, it enables the
contractor and supplier to be familiar with the procurement of the materials, assuring the
availability of the materials from the credible supply chain.
68
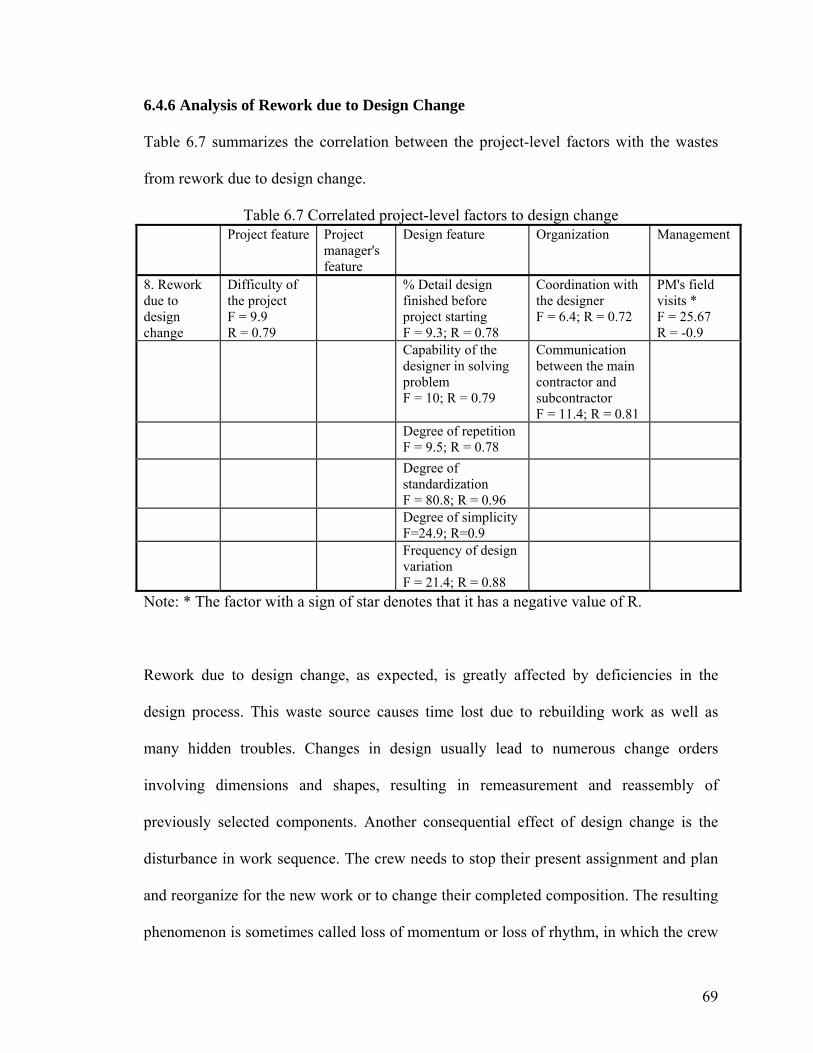
6.4.6 Analysis of Rework due to Design Change
Table 6.7 summarizes the correlation between the project-level factors with the wastes
from rework due to design change.
Table 6.7 Correlated project-level factors to design change Project feature Project
manager's feature
Design feature Organization Management
8. Rework due to design change
Difficulty of the project F = 9.9 R = 0.79
% Detail design finished before project starting F = 9.3; R = 0.78
Coordination with the designer F = 6.4; R = 0.72
PM's field visits * F = 25.67 R = -0.9
Capability of the designer in solving problem F = 10; R = 0.79
Communication between the main contractor and subcontractor F = 11.4; R = 0.81
Degree of repetition F = 9.5; R = 0.78
Degree of standardization F = 80.8; R = 0.96
Degree of simplicityF=24.9; R=0.9
Frequency of design variation F = 21.4; R = 0.88
Note: * The factor with a sign of star denotes that it has a negative value of R.
Rework due to design change, as expected, is greatly affected by deficiencies in the
design process. This waste source causes time lost due to rebuilding work as well as
many hidden troubles. Changes in design usually lead to numerous change orders
involving dimensions and shapes, resulting in remeasurement and reassembly of
previously selected components. Another consequential effect of design change is the
disturbance in work sequence. The crew needs to stop their present assignment and plan
and reorganize for the new work or to change their completed composition. The resulting
phenomenon is sometimes called loss of momentum or loss of rhythm, in which the crew
69
may have to rearrange the scaffolding, revise the conduit and cable-routing schedule,
coordinate with other crews, and plan many other elements of the work in a level of detail
that would not have been required had the details been correctly included in the original
design (Thomas and Napolitan, 1995). Design change was ranked as one of the most
serious hindrances to craftsmen’s productivity by Russell (1993) and Kaming, et al.
(1997). This study amounts to the same conclusion, 15.5% of wasted man-hour is
attributed to variation, out of which, 30% is design variation (Table 4.2). As shown in
Table 6.7, the root causes for the design change could be traced to the following aspects.
One cause is the accuracy and detailed level of the design prepared by the architect,
which is very important for a project. Sufficient design enables the project to proceed
with minimum modifications, ambiguities and missing information.
A second cause is the buildability of the design. From the Buildable Design Appraisal
System (BDAS), the more repetition, standardization, and simplicity designed into the
project, the higher buildable score will be achieved, enabling a more efficient
construction (Sui, 2001).
The third reason is the coordination and communication among different parties involved
in the project. Designers, in general, lack construction skills and often focus on
originality of design rather than constructability issues. Thus if construction managers
can be involved in the design stage, a higher buildability becomes possible. Although
design change cannot be eliminated, effectiveness in communication between design
70
team and construction management would help to mitigate the effect arising from design
change.
The negative correlation with the number of PM’s field visits is again noted. It is the
same as the situation in the preceding equipment problems. The serious design change
may draw the project manager’s attention and require him to devote much more time and
effort on site to coordinate and solve the problem.
6.5 SUMMARY
From the prior analysis, some factors that are closely related to productivity are obtained,
based on which certain criteria are developed. These criteria can help to improve
productivity, and are supposed to be under the project manager’s control. They focus on
how to plan and execute the project in such a way that could reduce the nonproductive
activities on site.
There are five groups of project-level factors. They are
1. Project features
• To keep good housekeeping of working area
• To have proper construction method
• To have proper work sequence
• To make the inspection procedure simplified
71
2. Project manager features
• Should be experienced in construction area
• Should be experienced in project management
• Should have rich experience of working as a PM
3. Design features
• Detail design to be finished as fully as possible before project starts
• Designer to be competent in solving problem
• High repetition
• High standardization
• High simplicity
• Minor or no design change
4. Organization of the project
• Keep good coordination with the designer
• Keep good communication between the main contractor and subcontractor
• Keep good and direct coordination with the material supplier
• PM should have sufficient subordinates to take care of different scope of work
5. Management of the project
• Frequent planning
• Frequent progress control
• Build good teamwork
72

• Frequent site management meetings
• To avoid excessive quality and safety inspection
• Reduce the times of relocating of materials
• Regular updating of inventory
• Make the stock easily accessible
73

Table 6.8 Project management criteria to reduce wastes on site
uce
crew
s’ in
terf
eren
ce
uce
was
tes o
n in
spec
tion
uce
wai
ting
for o
ccup
ied
equi
pmen
t
uce
wai
ting
for e
quip
men
t’s
alla
tion
uce
wai
ting
for i
nstru
ctio
n
uce
was
tes d
ue to
stoc
k pr
oble
ms
uce
was
tes d
ue to
mat
eria
l lat
e ve
ryuc
e w
aste
s due
to d
esig
n ch
ange
Proj
ect
feat
ure
PM
feat
ure
Des
ign
feat
ure
Org
aniz
atio
n fe
atur
e M
anag
emen
t fea
ture
Unproductive activity
s
Project level factor
Red
Red
Red
Red
inst
Red
Red
Red
deli
Red
Good housekeeping ☺ ☺ ☺ Proper construction method ☺
Proper work sequence ☺ ☺ Simplify the inspection procedure ☺
Experienced in construction area ☺ Experienced in project management ☺
Experienced in working as PM ☺ Detail design to be finished as fully as possible before project starts
☺ ☺
Designer to be competent in solving problem
☺ ☺
High degree of repetition ☺ ☺ ☺ High degree of standardization ☺ ☺ ☺ High degree of simplicity ☺ ☺ ☺ Minor design change ☺ ☺ Good coordination with the designer ☺ ☺ Good communication between the main contractor and subcontractor
☺ ☺ ☺ ☺ ☺ ☺
Good and direct coordination with the material supplier
☺
PM have sufficient subordinates to take care of different scope of work
☺
Frequent planning ☺ ☺ ☺ Frequent progress control ☺ Build a good teamwork ☺ Frequent site management meetings ☺ ☺ ☺ ☺ ☺ Avoid excessive quality and safety inspections
☺
Avoid frequent materials handling ☺ ☺ ☺ Keep regular updating of inventory ☺ Make the stock easily accessible ☺
74

Table 6.8 summarizes the project management criteria. The first two columns list all of
the project management criteria according to the project-level features, while the top row
describes the main unproductive activities. When a specific criterion plays a positive role
to reduce any unproductive activity, a smiling face will appear at the intersection of the
column and the row.
When the focus is on the project management criteria, it is easy to find out which single
criterion can be effective in reducing which unproductive activity. For example, in
project feature, keeping good housekeeping is a very critical task. Proper planning for the
working space, storage yard, and keeping a clear site access will reduce the waste due to
crews’ interference, waiting for equipment, and the wastes resulting from storage
problems.
The project manager's construction experience and project-management experience both
will help in efficiency in overall planning and arrangement, including coordination
among different trades and crews, so as to reduce wastes due to crews' interference.
A high degree of repetition, standardization, and simplicity of the design will no doubt
simplify the whole construction process and make the construction less difficult, which
requires less instruction and greatly reduce the waste caused by waiting for instruction. In
addition, as the content of and the time spent on inspection are reduced accordingly, so is
the unnecessary waiting time.
In organization feature, good communication between the main contractor and
subcontractor will be effective in reducing six out of the eight main wastes, which
75
illustrates that this criterion is extremely important in improving productivity through
different means.
Proper site management, especially regular and frequent site management meetings, will
reduce wastes on inspection, waiting for occupied equipment or their installation, waiting
for instruction, and late material delivery. Frequent planning and avoidance of multiple
handling of material also significantly reduce some unproductive activities.
When the purpose is to find out what are the criteria to reduce a single waste, the table
should be read vertically. In order to reduce the time in waiting for instruction, for
instance, the criteria in design feature group, organization feature group, and management
feature group should be looked into. There are totally ten criteria that will help to reduce
this kind of waste. When appropriate arrangement is done to cater for the ten criteria, it is
very likely that the waste due to waiting for instruction will be minimized during the
project implementation.
This table provides a guideline for project management people to consider both the
criteria and the wastes, which enable them to solve problems in two ways. Both ways
serve the same purpose, which is to reduce wastes and improve productivity.
In the next chapter, the effectiveness of project level criteria will be tested through a case
study.
76

CHAPTER 7
CASE STUDIES
7.1 INTRODUCTION
In order to test the validity of the relationship identified among the productivity
performance, work conditions, and project-level factors in Chapters 5 and 6, two cases
are studied in this chapter. The combination of survey and case study in this research is
desirable in order to develop more rigorous analysis of the factors affecting productivity
to strengthen the results. The analysis of the cases begins with the introduction of project-
level factors, followed by the working condition’s description, and then the productivity’s
measurement.
7.2 DESCRIPTION OF CASES
The two projects to be studied in this research are
77
Case A: Proposed 7-storey educational institution with one basement car park. The
contract duration is one-and-a-half years, with a value of 60 million on the basis of unit
price.
Case B: Underground highway with a ventilation building. The construction duration is
one and half year. It is a unit price contract with a value of 200 million.
7.3 THE PROJECT-LEVEL FACTORS
7.3.1 The Project Features
Case A
This project involves a 7-storey institution building with a basement car park. It is located
in a densely populated urban area, with a lot of buildings and heavy traffic in the vicinity.
Therefore the construction site for the project is limited and congested (Picture 7.1). For
this reason there is no particular place for stockpiling of materials on site. Materials have
to be delivered directly to the needed place; some are erected directly from the truck, and
some are temporarily unloaded wherever space is available and shifted one or more times
later.
78
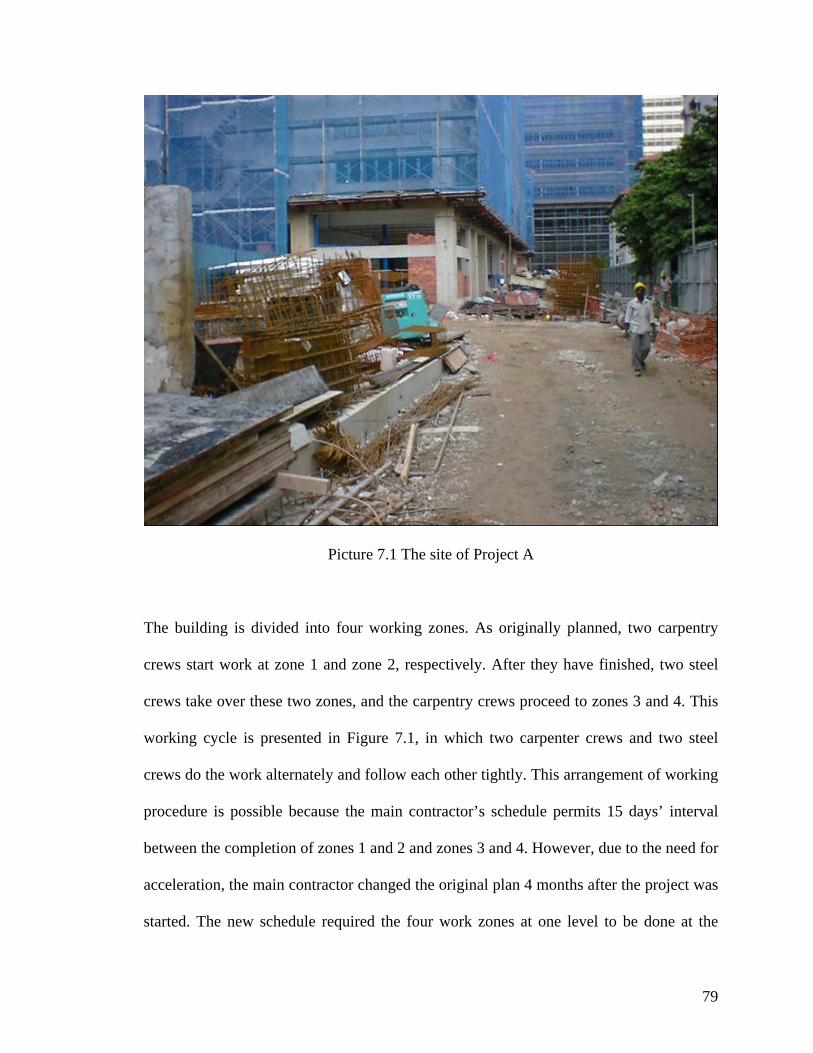
Picture 7.1 The site of Project A
The building is divided into four working zones. As originally planned, two carpentry
crews start work at zone 1 and zone 2, respectively. After they have finished, two steel
crews take over these two zones, and the carpentry crews proceed to zones 3 and 4. This
working cycle is presented in Figure 7.1, in which two carpenter crews and two steel
crews do the work alternately and follow each other tightly. This arrangement of working
procedure is possible because the main contractor’s schedule permits 15 days’ interval
between the completion of zones 1 and 2 and zones 3 and 4. However, due to the need for
acceleration, the main contractor changed the original plan 4 months after the project was
started. The new schedule required the four work zones at one level to be done at the
79

same time, as shown in Figure 7.2. As such, the completion time for one floor could be
reduced by 15 days, but the demand for manpower, material, and tools doubled from the
original plan. Furthermore, a great amount of manpower is wasted in waiting for the
previous crews to finish. This implementation not only interrupted the normal working
cycle and sequence, but also made the site overcrowded due to the increased amount of
materials, tools, and other ancillary utilities.
The subcontractor suffered a lot from this change in schedule because the subcontract
was based on unit rates and the quantity of work done. The change did not increase the
contract sum, but resulted in increased man-hours lost.
80

1,Jan 30, Jan 15, Feb 28, Feb 15, Mar
Carpentry 1
Carpentry 2
Steel 1
Steel 2
Carpentry 1
Carpentry 2
Steel 1
Steel 2
Zone
1 &
2
Leve
l 1
Zone
3 &
4
Carpentry 1
Zone
1 &
2
Carpentry 2
Steel 1
Leve
l 2
Steel 2
Carpentry 1
Zone
3 &
4
Carpentry 2
Steel 1
Steel 2
Figure 7.1 Original working sequences
81
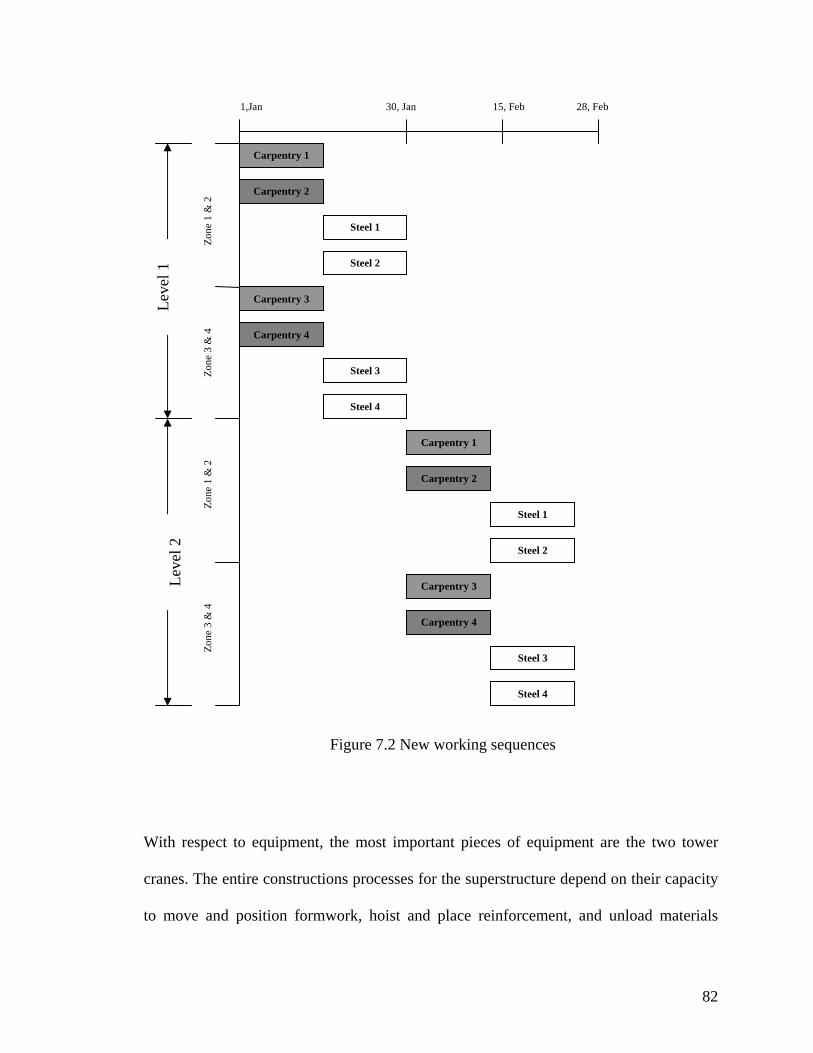
With respect to equipment, the most important pieces of equipment are the two tower
cranes. The entire constructions processes for the superstructure depend on their capacity
to move and position formwork, hoist and place reinforcement, and unload materials
1,Jan 30, Jan 15, Feb 28, Feb
Carpentry 1
Carpentry 2
Steel 1
Steel 4
Carpentry 3
Carpentry 4
Steel 3
Steel 2
Zone
1 &
2
Leve
l 1
Zone
3 &
4
Carpentry 1
Zone
1 &
2
Carpentry 2
Steel 1
Leve
l 2
Steel 2
Carpentry 3
Zone
3 &
4
Carpentry 4
Steel 3
Steel 4
Figure 7.2 New working sequences
82
from lorries. The two tower cranes were not able to fulfill the demand from the four work
zones which was doubled from the original plans. This consequently led to costly
queuing and frequent idling. Nevertheless, it is a dilemma that--although both the owner
and the main contractor are aware of the under capacity--, they could find no solution
because the limited space made it impossible to bring in more cranes.
The inspection in this project always bothered the contractor. Although the clerk-of-
works is regarded as experienced and competent, his requirements for inspection are
sometimes felt to be too harsh. He demands that the project manager or site manager,
foreman, and a number of workers follow the inspection. Once any defect is observed,
remedies must be done immediately. Other work is not allowed to commence until all
remedies are finished. Another problem arose from the clerk-of-works’ working time. In
the contract, the clerk-of-works have no overtime allowance, and therefore they are
reluctant to extend their work beyond normal working hours. Under the pressure of the
tight schedule, the contractor prefers to cast concrete during the nighttime without
interrupting the next day’s work. However, sometimes the contractor’s planning cannot
be fulfilled because of the clerk-of-works’ reluctance to work late to inspect the work and
supervise the casting. Consequently, one day’s time may be wasted as concreting is
delayed till the next day.
The contractor evaluates the construction difficulty of Case A as medium. The structure
of the building is relatively standard.
83
Case B
This is a civil project that involves an underground highway. The whole site is divided
into 2 parts, a 400-meter-long highway and a 600-meter-long highway. The site is located
at a noncrowded place outside the downtown area, with a big working space, and a broad
area is allocated as storage yard (Picture 7.2). However, shifting and transportation of
materials on site is needed because there is a great distance between the storage yard and
the work face, which cannot be covered by the cranes. Transportation vehicles are
desirable such as trailers or lorries. There are one or two cranes for each working zone,
but there are still some occasions when the cranes are too busy to fill the demand.
Nevertheless, due to the abundant space, the contractor can order more cranes when
necessary. Therefore, crane shortage is not a severe problem.
The procedure of inspection is rather flexible. The clerk-of-work carries out the
inspection during the process of work. Whatever problem is found, it is recorded down in
a note and reported as feedback to the contractor immediately. The latter has the time to
rectify the minor mistakes or negligence before they become a big problem. When the
work is finished, the inspection is also cleared at the same time, which not only reduces
the time before casting but also saves the manpower to follow the inspection and do
rectification work when compared with Case A. The strict but reasonable personality of
the inspector gained respect and cooperation from the contractor.
The contractor evaluates the construction difficulty of this project as “Not difficult”. The
working sequence is also regarded as reasonable.
84
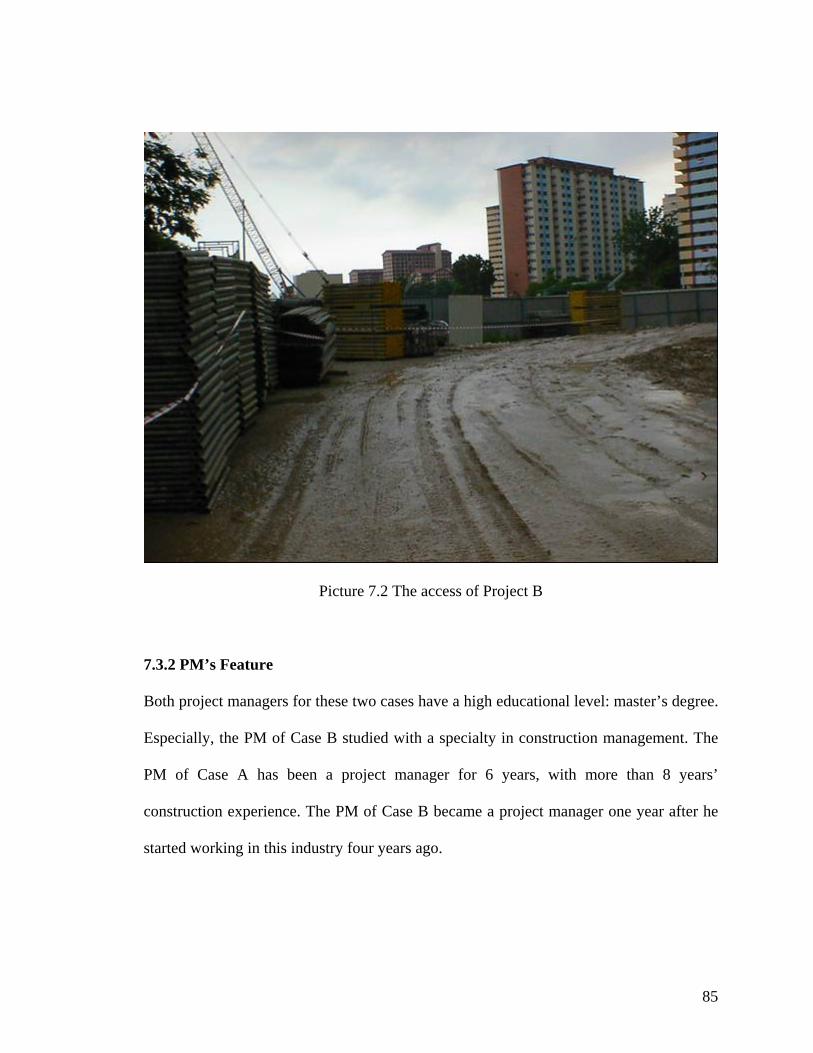
Picture 7.2 The access of Project B
7.3.2 PM’s Feature
Both project managers for these two cases have a high educational level: master’s degree.
Especially, the PM of Case B studied with a specialty in construction management. The
PM of Case A has been a project manager for 6 years, with more than 8 years’
construction experience. The PM of Case B became a project manager one year after he
started working in this industry four years ago.
85

7.3.3 Design
Case A
Design problems present a big headache in this project. At the time when the project
started, the detailed design was only less than fifty percent completed. Further
development, amendment, and rectification to the detailed shop drawings occur
throughout the whole construction. A lot of designs are changed during construction due
to negligence at the initial design stage. Some structural elements are requested to be
changed or added after they have been cast. In addition, there are many discrepancies on
drawings due to errors in dimensions, levels, and sizes. The frequent design changes
bring a lot of trouble to the contractors and seriously affect the work, which not only
increases the difficulty of construction, but also disrupts the work sequence and delays
progress. Re-planning of work sequence, rearrangement of workforce, and remobilization
of workers are frequently required, which significantly brings down the productivity on
site.
Case B
Before the project started, the design effect and detail design were almost completed.
Consequently, there are few design problems during construction. One reason behind this
is that the structure for this project is rather simple, and the degree of repetition is high. It
is standard along the tunnel, and the construction can be divided into many repeated 20-
meter-long sections. There is little design variation from section to section, therefore the
crew can become familiar with the design and resolve layout questions while constructing
the first section, and the work can be continuously carried out with few new instructions.
86
7.3.4 Organization
Case A
Since all parties on site are Chinese speaking, there is good communication among the
personnel from different companies.
However, there exist some problems in the organization of this project. The first problem
is the insufficiency of management staff. Due to budgetary consideration, the main
contractor appointed only one site manager to be in charge of the site, who also does the
job of engineer and site supervisor. He is not only responsible for the planning, site
arrangement, and coordination with the subcontractor, but also has to deal with the
technical issues and drawing problems. On the Subcontractor’s side, although there are a
project manager, a site manager, and an engineer to take care of this project, the project
manager and the engineer are only part-time on site and do not participate in the daily
operation. Therefore, the key persons to run the project are only the two site managers.
There are many occasions when they are too busy to cover all the matters on site, so that
problem solving is very slow, which affects the smooth progress of the work.
Anther problem arises from material availability. As stipulated in the contract, materials
are supplied by a separate supplier engaged by the main contractor. The subcontractor
requests the materials through a Material Application form, in which are indicated the
demand and estimated quantity. Before proceeding with the order, the main contractor
always checks the subcontractor’s application in order to control cost, and adjust the
quantity to an amount that seems to be reasonable. This amount is normally less than
87
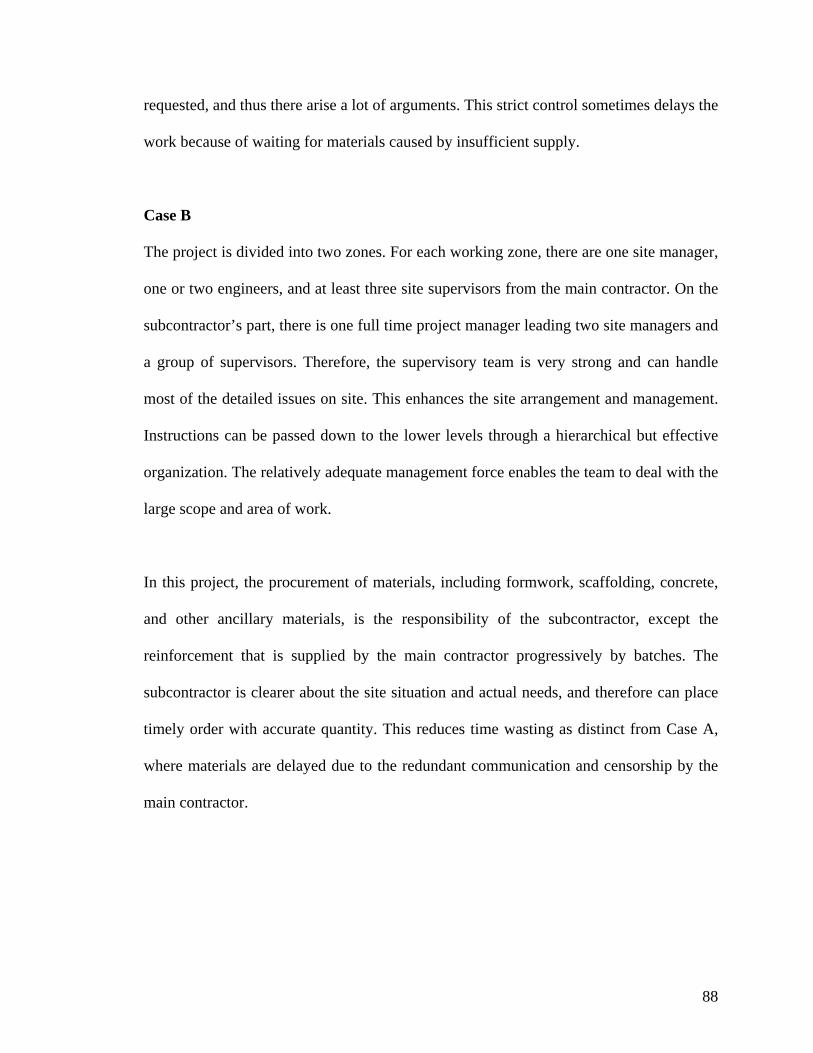
requested, and thus there arise a lot of arguments. This strict control sometimes delays the
work because of waiting for materials caused by insufficient supply.
Case B
The project is divided into two zones. For each working zone, there are one site manager,
one or two engineers, and at least three site supervisors from the main contractor. On the
subcontractor’s part, there is one full time project manager leading two site managers and
a group of supervisors. Therefore, the supervisory team is very strong and can handle
most of the detailed issues on site. This enhances the site arrangement and management.
Instructions can be passed down to the lower levels through a hierarchical but effective
organization. The relatively adequate management force enables the team to deal with the
large scope and area of work.
In this project, the procurement of materials, including formwork, scaffolding, concrete,
and other ancillary materials, is the responsibility of the subcontractor, except the
reinforcement that is supplied by the main contractor progressively by batches. The
subcontractor is clearer about the site situation and actual needs, and therefore can place
timely order with accurate quantity. This reduces time wasting as distinct from Case A,
where materials are delayed due to the redundant communication and censorship by the
main contractor.
88
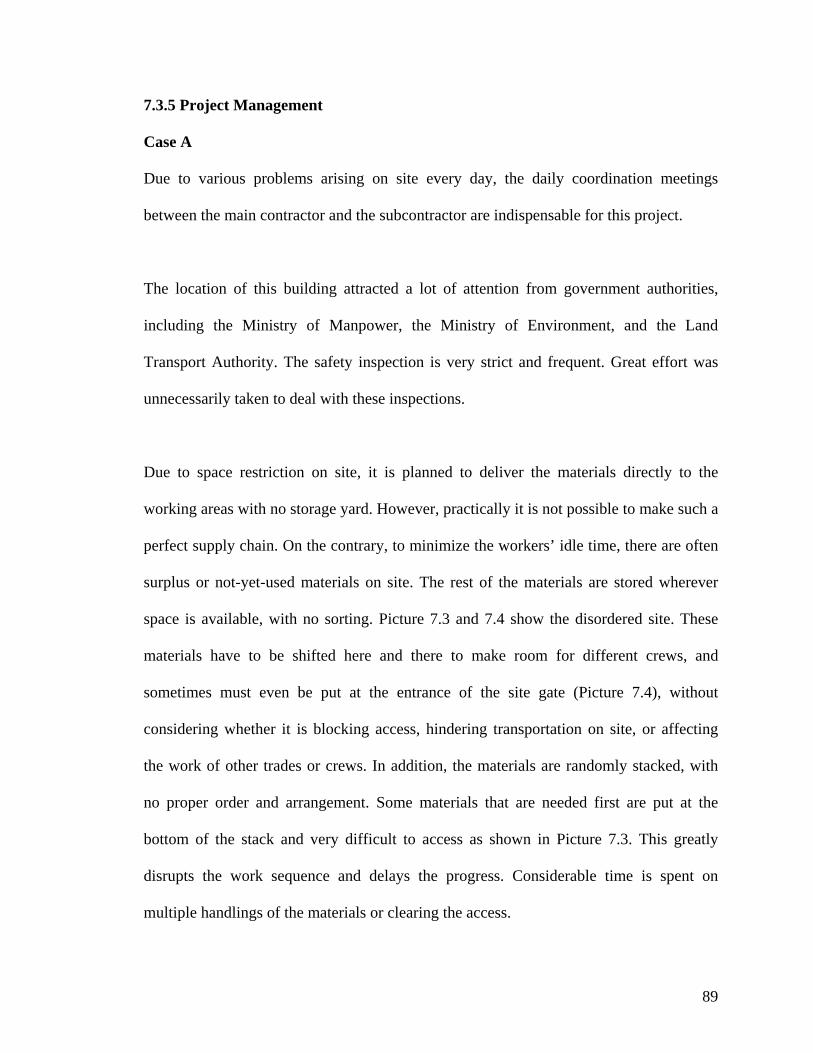
7.3.5 Project Management
Case A
Due to various problems arising on site every day, the daily coordination meetings
between the main contractor and the subcontractor are indispensable for this project.
The location of this building attracted a lot of attention from government authorities,
including the Ministry of Manpower, the Ministry of Environment, and the Land
Transport Authority. The safety inspection is very strict and frequent. Great effort was
unnecessarily taken to deal with these inspections.
Due to space restriction on site, it is planned to deliver the materials directly to the
working areas with no storage yard. However, practically it is not possible to make such a
perfect supply chain. On the contrary, to minimize the workers’ idle time, there are often
surplus or not-yet-used materials on site. The rest of the materials are stored wherever
space is available, with no sorting. Picture 7.3 and 7.4 show the disordered site. These
materials have to be shifted here and there to make room for different crews, and
sometimes must even be put at the entrance of the site gate (Picture 7.4), without
considering whether it is blocking access, hindering transportation on site, or affecting
the work of other trades or crews. In addition, the materials are randomly stacked, with
no proper order and arrangement. Some materials that are needed first are put at the
bottom of the stack and very difficult to access as shown in Picture 7.3. This greatly
disrupts the work sequence and delays the progress. Considerable time is spent on
multiple handlings of the materials or clearing the access.
89
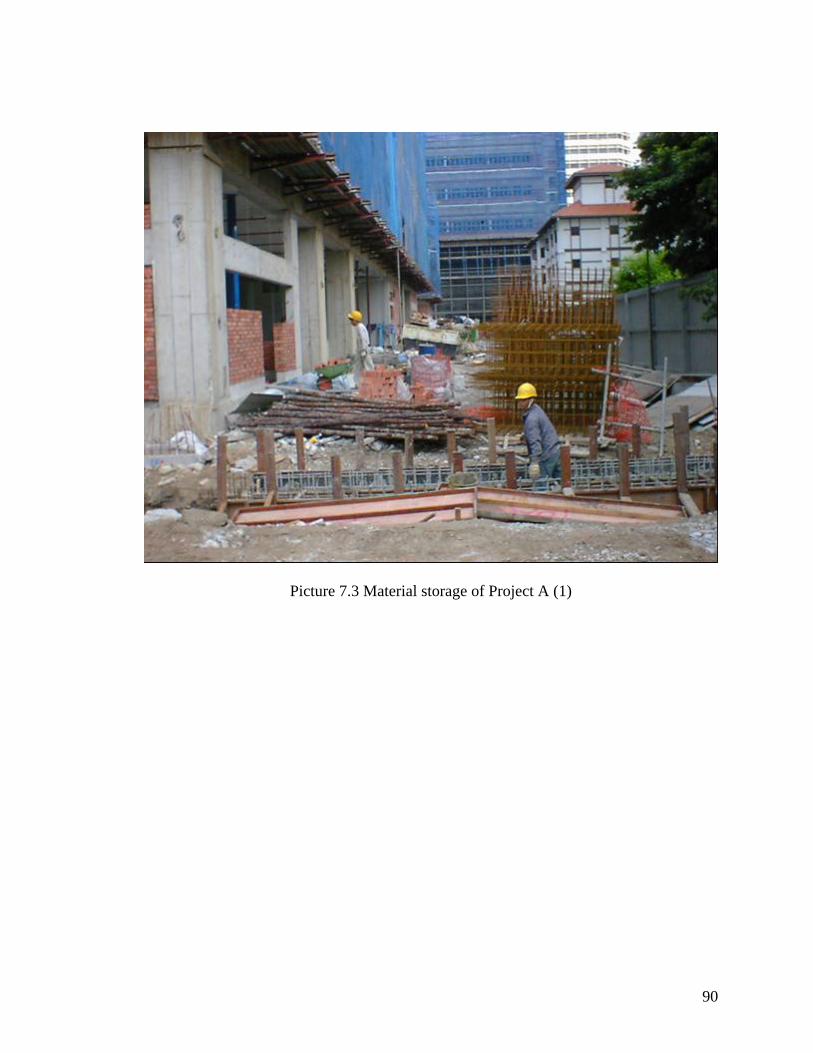
Picture 7.3 Material storage of Project A (1)
90
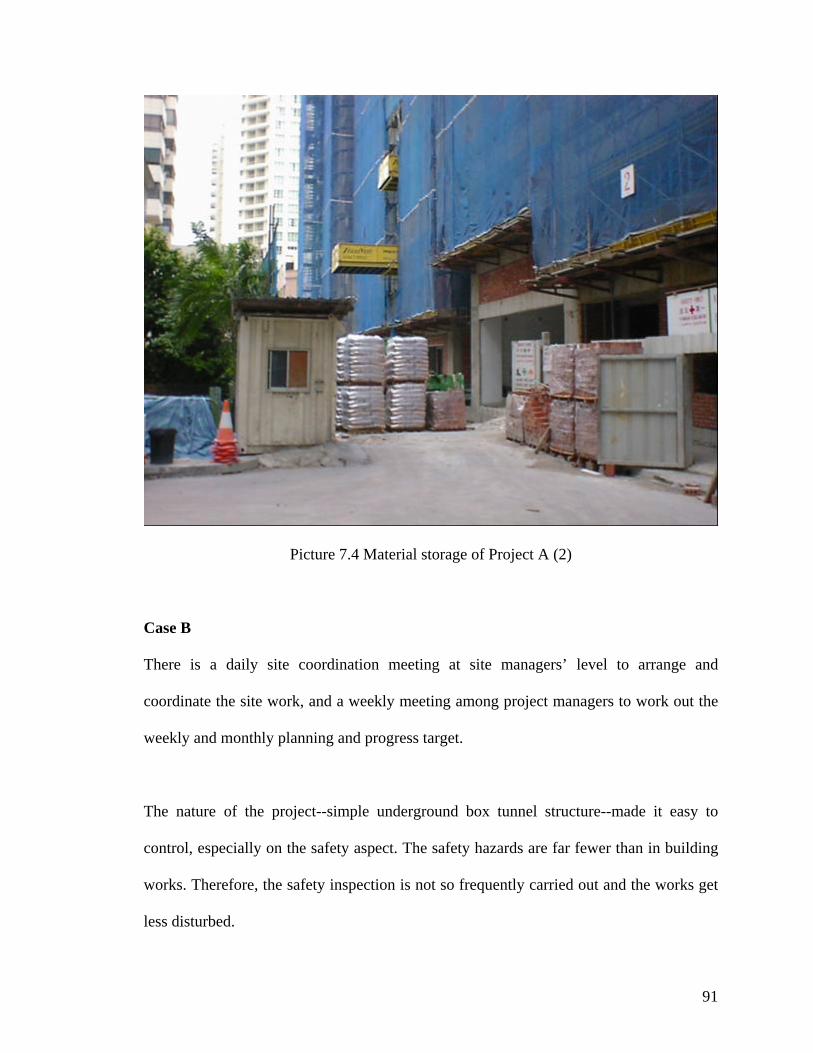
Picture 7.4 Material storage of Project A (2)
Case B
There is a daily site coordination meeting at site managers’ level to arrange and
coordinate the site work, and a weekly meeting among project managers to work out the
weekly and monthly planning and progress target.
The nature of the project--simple underground box tunnel structure--made it easy to
control, especially on the safety aspect. The safety hazards are far fewer than in building
works. Therefore, the safety inspection is not so frequently carried out and the works get
less disturbed.
91

A big area is allocated as storage yard. The materials are stacked neatly according to
different types, which makes the access and storage more convenient. Cranes and trailers
or lorries are essential equipment for moving the materials to the work face. Picture 7.5
shows the large and ordered storage yard.
Picture 7.5 Material storage of Project B
92
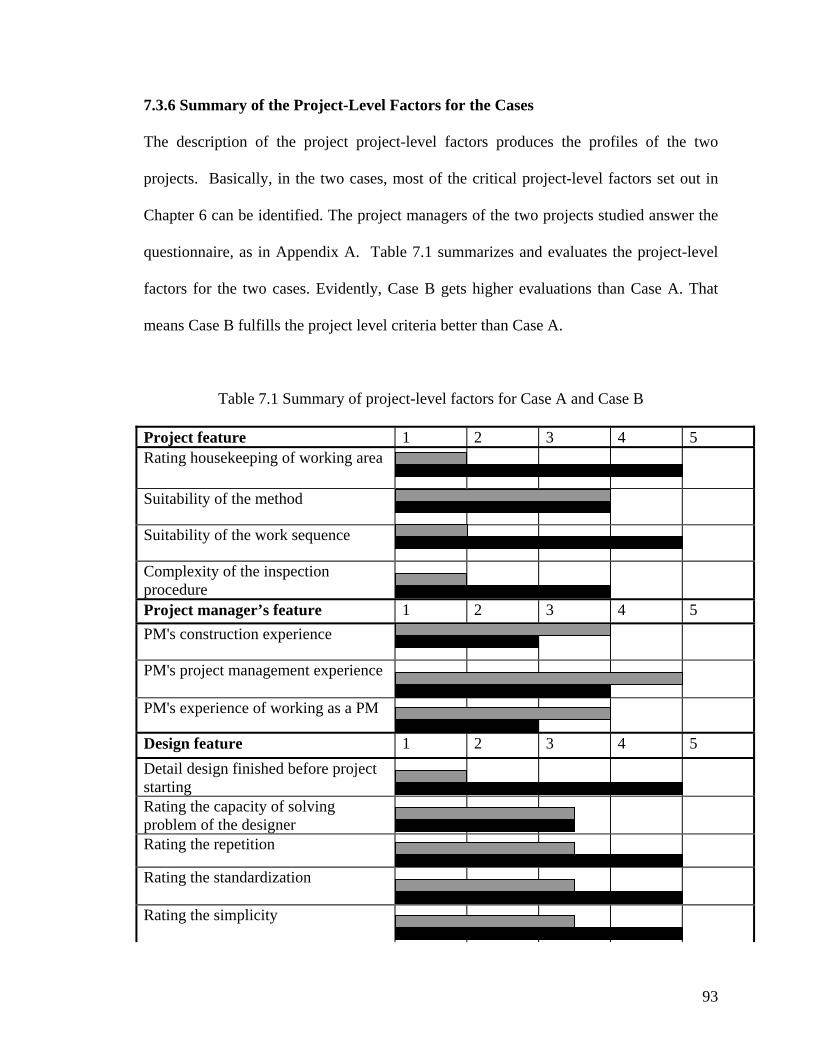
7.3.6 Summary of the Project-Level Factors for the Cases
The description of the project project-level factors produces the profiles of the two
projects. Basically, in the two cases, most of the critical project-level factors set out in
Chapter 6 can be identified. The project managers of the two projects studied answer the
questionnaire, as in Appendix A. Table 7.1 summarizes and evaluates the project-level
factors for the two cases. Evidently, Case B gets higher evaluations than Case A. That
means Case B fulfills the project level criteria better than Case A.
Table 7.1 Summary of project-level factors for Case A and Case B
Project feature 1 2 3 4 5 Rating housekeeping of working area
Suitability of the method
Suitability of the work sequence
Complexity of the inspection procedure Project manager’s feature PM's construction experience
PM's project management experience PM's experience of working as a PM
Design feature Detail design finished before project starting Rating the capacity of solving problem of the designer Rating the repetition
Rating the standardization Rating the simplicity
1 2 3 4 5
1 2 3 4 5
93
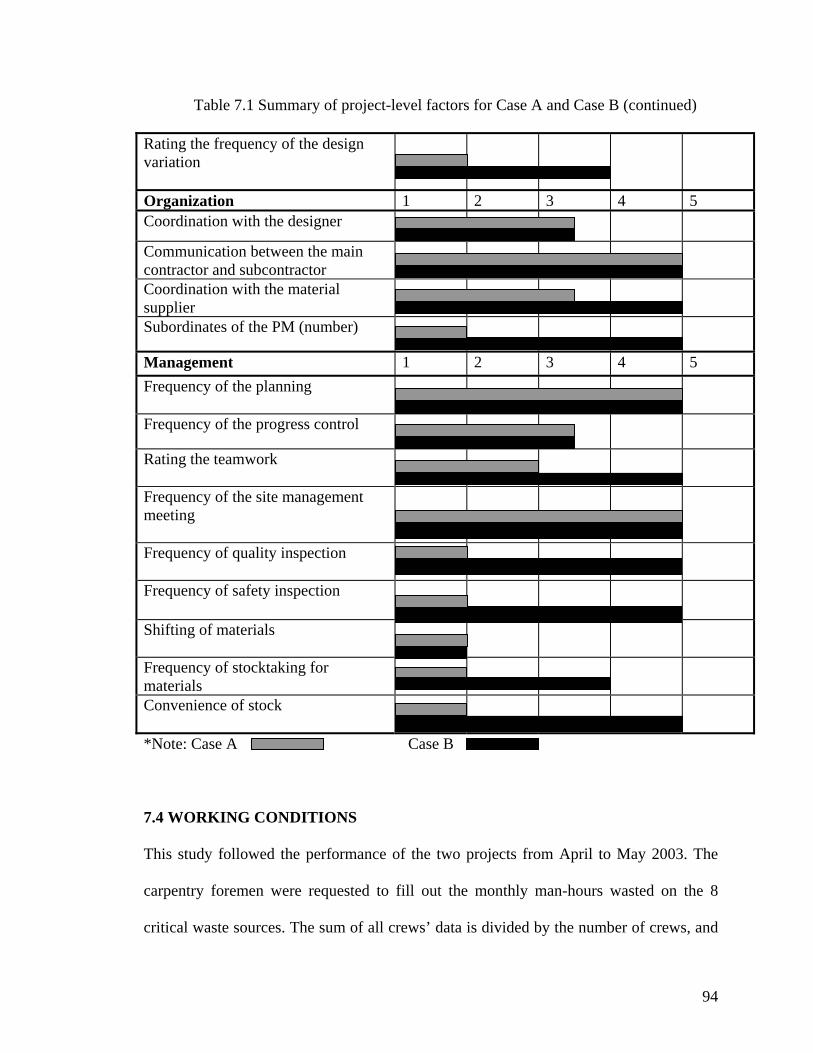
Table 7.1 Summary of project-level factors for Case A and Case B (continued)
Rating the frequency of the design variation
Organization 1 2 3 4 5 Coordination with the designer
Communication between the main contractor and subcontractor
Coordination with the material supplier
Subordinates of the PM (number)
Management 1 2 3 4 5 Frequency of the planning
Frequency of the progress control
Rating the teamwork
Frequency of the site management meeting
Frequency of quality inspection
Frequency of safety inspection
Shifting of materials
Frequency of stocktaking for materials
Convenience of stock
*Note: Case A Case B
7.4 WORKING CONDITIONS
This study followed the performance of the two projects from April to May 2003. The
carpentry foremen were requested to fill out the monthly man-hours wasted on the 8
critical waste sources. The sum of all crews’ data is divided by the number of crews, and
94
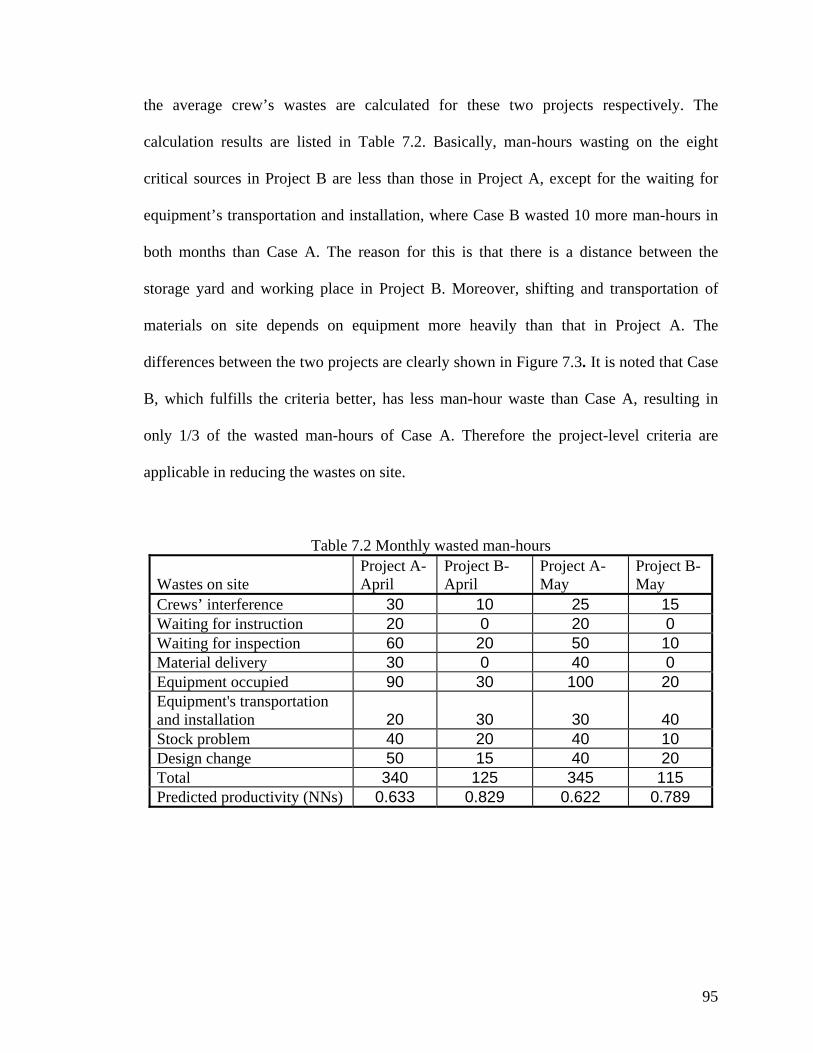
the average crew’s wastes are calculated for these two projects respectively. The
calculation results are listed in Table 7.2. Basically, man-hours wasting on the eight
critical sources in Project B are less than those in Project A, except for the waiting for
equipment’s transportation and installation, where Case B wasted 10 more man-hours in
both months than Case A. The reason for this is that there is a distance between the
storage yard and working place in Project B. Moreover, shifting and transportation of
materials on site depends on equipment more heavily than that in Project A. The
differences between the two projects are clearly shown in Figure 7.3. It is noted that Case
B, which fulfills the criteria better, has less man-hour waste than Case A, resulting in
only 1/3 of the wasted man-hours of Case A. Therefore the project-level criteria are
applicable in reducing the wastes on site.
Table 7.2 Monthly wasted man-hours
Wastes on site Project A-April
Project B-April
Project A-May
Project B-May
Crews’ interference 30 10 25 15 Waiting for instruction 20 0 20 0 Waiting for inspection 60 20 50 10 Material delivery 30 0 40 0 Equipment occupied 90 30 100 20 Equipment's transportation and installation 20 30 30 40 Stock problem 40 20 40 10 Design change 50 15 40 20 Total 340 125 345 115 Predicted productivity (NNs) 0.633 0.829 0.622 0.789
95
0
20
40
60
80
100
120
Crews'in
terferen
ce
Instru
ction
Inspe
ction
Materia
l deli
very
Equipmen
t occ
upied
Equipm
ent's
transp
ortatio
n
Stock p
roblem
Design
chan
ge
8 Critical non-value adding activities
Was
te (m
an-h
our)
project A-April Project A-May Project B-April Project B-May
Figure 7.3 Comparison of wastes of Projects A and B
7.5 PRODUCTIVITY PERFORMANCE
In these two months, the productivities for the four carpentry crews of Project A and two
carpentry crews of Project B were measured. The data are shown in Figure 7.4.
Comparing the two projects, the good performance of the crews in Project B is clearly
shown in the figure, where productivity of the crews in Project B are all above
0.8m2/man-hour, but almost all of Project A’s crews’ performance is below 0.7m2/man-
hour.
96

0.00
0.20
0.40
0.60
0.80
1.00
Month
Mon
thly
pro
duct
ivity
(m2/
man
-hou
r)
Crew 1-A 0.62 0.65
Crew 2-A 0.75 0.69
Crew 3-A 0.70 0.63
Crew 4-A 0.66 0.59
Crew 1-B 0.87 0.89
Crew 2-B 0.84 0.89
April May
Figure 7.4 Crews’ monthly productivity of Projects A and B
Besides the productivity data for the studied two months, the company provided the
monthly productivity data for the whole project duration. Figure 7.5 shows the monthly
productivity of Projects A and B from their commencement. The monthly performance
can be revealed by these curves, from which attentions should be aroused and awareness
created. After four months of construction, the productivity of Project A worsened
suddenly. The mainly corresponding cause of the declining should be the schedule
change. In contrast, the monthly productivity of Project B improved at a stable rate.
97
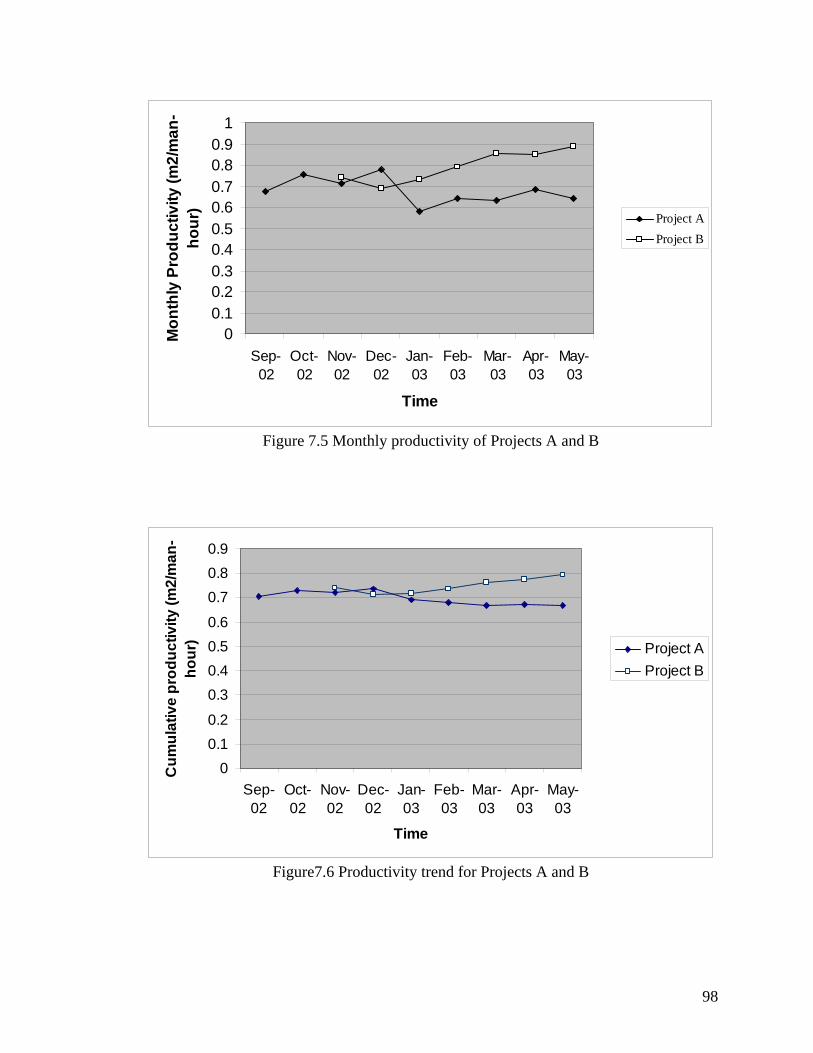
00.10.20.30.40.50.60.70.80.9
1
Sep-02
Oct-02
Nov-02
Dec-02
Jan-03
Feb-03
Mar-03
Apr-03
May-03
Time
Mon
thly
Pro
duct
ivity
(m2/
man
-ho
ur)
Project AProject B
Figure 7.5 Monthly productivity of Projects A and B
00.10.2
0.30.40.50.6
0.70.80.9
Sep-02
Oct-02
Nov-02
Dec-02
Jan-03
Feb-03
Mar-03
Apr-03
May-03
Time
Cum
ulat
ive
prod
uctiv
ity (m
2/m
an-
hour
) Project AProject B
Figure7.6 Productivity trend for Projects A and B
98
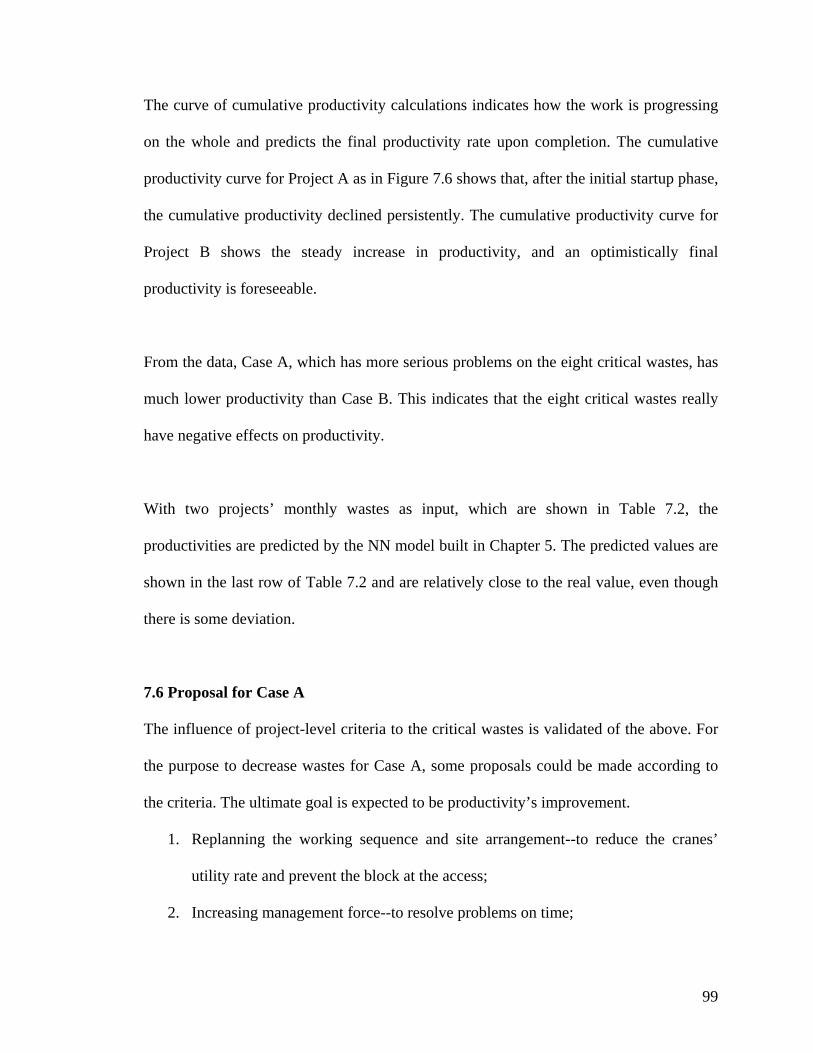
The curve of cumulative productivity calculations indicates how the work is progressing
on the whole and predicts the final productivity rate upon completion. The cumulative
productivity curve for Project A as in Figure 7.6 shows that, after the initial startup phase,
the cumulative productivity declined persistently. The cumulative productivity curve for
Project B shows the steady increase in productivity, and an optimistically final
productivity is foreseeable.
From the data, Case A, which has more serious problems on the eight critical wastes, has
much lower productivity than Case B. This indicates that the eight critical wastes really
have negative effects on productivity.
With two projects’ monthly wastes as input, which are shown in Table 7.2, the
productivities are predicted by the NN model built in Chapter 5. The predicted values are
shown in the last row of Table 7.2 and are relatively close to the real value, even though
there is some deviation.
7.6 Proposal for Case A
The influence of project-level criteria to the critical wastes is validated of the above. For
the purpose to decrease wastes for Case A, some proposals could be made according to
the criteria. The ultimate goal is expected to be productivity’s improvement.
1. Replanning the working sequence and site arrangement--to reduce the cranes’
utility rate and prevent the block at the access;
2. Increasing management force--to resolve problems on time;
99

3. Asking for the designer to increase design team to develop details on time and
review details before hand out the drawing--to decrease the wastes due to
drawing’s delay and design errors;
4. Enhancing the cooperation with the clerk-of-work--to arrange the inspection on
time and according to contractor’s progress.
7.7 SUMMARY
The analysis of the cases begins with the introduction of the organizational feature,
followed by the working condition’s description, and then the productivity’s
measurement. The study recognized that the project that meets the project-level criteria
better has less manpower wasted on site, and performs the work more productively.
Therefore the effectiveness of the criteria on reducing the critical affecting factors, and
the influence of critical waste on productivity, are proved to be justifiable to a great
extent.
100
CHAPTER 8
CONCLUSIONS AND RECOMMENDATIONS
8.1 CONCLUSIONS
Low productivity in the construction industry has long been a great concern, and several
studies have been focused on the identification of the productivity’s factors. This research
attempts to study the relationships between different factors through qualitative and
quantitative analysis, and determine the causes for the low productivity from the
perspective of flow-related issues. In particular, the nonvalue-adding activities or waste
elements are identified so that if these could be strategically eliminated, project
performance can be significantly improved through better production flow at the work
faces.
Extensive literature review was carried out, based on which the Stratified Model of
factors for Productivity was build up, and a systematical procedure of study was designed.
In the model, the direct causes for the loss of productivity are the non productive
101
activities (wastes) on site, which are determined by project organizational methods.
Through the interview of some experienced construction personnel, a list of common
unproductive activities on site was determined. Then a structured survey was conducted
on the selected projects. The performance, including wasted man-hours and productivity
data was tracked for six months by weekly log sheets. After enough data were obtained,
the neural network approach was adopted. Beginning with twenty usual waste sources,
the final model was obtained by incrementally trimming the inputs so that only the most
significant ones were retained. Altogether eight waste sources were deemed to be
sufficiently significant. These were as follows: waiting due to crews’ interference;
waiting due to equipment sharing; setup of equipment; waiting for instruction; waiting for
inspection; rework due to design change; waiting due to stock problems; and material
vendor delay. Using this model, the predicted performance on site was found to correlate
well with measured data. Then the dominant waste sources identified were traced to the
project-related factors to find out the possible causes of these nonvalue-adding activities.
In this step of the study, various simple regression analyses were developed between
every waste source and each project-related factor. The project-level factors that have
high correlation with the critical wastes were analyzed, and a set of criteria for organizing
and executing the project was developed to help manager allocate the limited resources
for the purpose of minimizing the on-site wastes.
To demonstrate the validity of the proposed criteria and the critical waste for productivity,
two cases were studied. The analysis of the cases begins with the introduction of the
102

project-level feature, followed by the working condition’s description, and then the
productivity’s measurement. Through the study, it is recognized that the project that
meets the project-level criteria better has less manpower wasted on site, and performs the
work more productively. Therefore the validity of the criteria and the critical affecting
factors for the productivity were proved.
This study qualitatively and quantitatively identifies critical factors leading to the loss of
productivity, and the cause-effect relationship between these critical factors and the
project level factors is recognized. Findings from this research can provide managers
some management guidelines and strategy to help them efficiently plan and execute their
projects in such a way as to maximize the likelihood of enhancing productivity.
8.2 LIMITATION
This research systematically studied the issues on construction productivity. Eight critical
wastes on site were recognized as the most direct affecting factors for productivity, and
the root causes for these eight factors were traced to the project level factors. However, it
also has inherent limitations as shown below.
Due to the requirement and restrictions for data as addressed in previous chapters, section
4.3.3, the number of projects to be studied is limited. For the study of the project level,
some analysis methods are unable to be conducted, such as multi-regression analysis,
resulting in the incapability of finding the possible interaction existing within the project-
level factors. At the activity level, the size of data pool for neural network model develop
103
is a bit small. Although the test result could be considered as acceptable as R2=0.8 with
20 inputs and R2=0.904 with 8 inputs, if the size of data pool was big enough, the result
would be more accurate and reliable, based on which a model can be built to predict the
value of productivity.
Because of the complexity of the construction site, some delay cannot be defined as
owing to some single cause explicitly. In many instances, the delay was the result of
interaction of several causes. Therefore, the noise in the data brings some difficulties for
the study.
8.3 RECOMMENDATION
This research has provided insights into the significant factors affecting construction
productivity. However, it is not enough. There are still some factors and issues to be
investigated in this area. The following are some of the concerns.
The present study has been confined to repetitive type of work related to formwork tasks.
The same approach could be extended to other repetitive works to obtain a better picture
of the effect of waste sources on productivity. This would help the industry better
develop management and control strategies to eliminate these wastes and thus improve
project performance.
Set up connections between construction productivity and external environment,
including political, legal and regulatory, and economic and commercial factors. These
104

factors have extensive impact on a company’s decision to plan and perform a project.
Enrich the project-level factors, and investigate the relationship among the factors within
the same level.
Finally, it is hoped that this study would provide impetus to further research on
construction productivity, especially on the relationship among the factors impacting
productivity, and assist in the accumulation of knowledge for productivity enhancement.
105
REFERENCE
1. Adrian, J. J. (1987), “Construction productivity Improvement.” New York: Elsevier
2. Borcherding, J.D., Palmeter, S.B., & Jansma, G.L. (1986), “Work force
management programs for increased productivity and quality work”, EEI Construction Committee Spring Meetings.
3. Chan, D. W. M. & Kumaraswamy, M. M. (1995), “A Study of the Factors affecting Construction Durations in Hong Kong”, Construction Management and Economics, Vol. 13, pp. 319-333.
4. Chang, L.-M. and Borcherding, J. D. (1985) “Evaluation of Craftsman
Questionnaire”, Journal of Construction Engineering and Management, Vol.111, No.4, pp. 426-439.
5. Christian, J and Hachey, D. (1995), “Effects of Delay Times on Production Rates
in Construction”, Journal of Construction Engineering and Management, Vol. 121, No. 1, pp. 20-26.
6. Chua, D. K. H., Kog, Y.C., Loh, P.K., & Jaselskis, E.J., (1997), “Model for
Construction Budget Performance---Neural Network Approach”, Journal of Construction Engineering and Management, Vol. 123, No. 3, pp.214-222.
7. Ciampa, D. (1991), “The CEO’s role in Time-Based Competition. In: Blackburn,
J.D. (e.d.). 1991.” Time-based Competition. Business One Irwin, Homewood. IL. Pp. 273-293.
8. Construction Industry Development Board Task Force on Productivity (1992),
“Raising Singapore’s construction Productivity”, CIDB, Singapore
9. Dacy, D. C. (1965), “Productivity Price Trends in Construction Since 1947”, Review of Economics and Statistics, 47, pp406-411
10. Drewin F. J. (1982), “Construction Productivity” New York: Elsevier
11. Flood, I. & Kartam, N. (1994), “Neural Networks In Civil Engineering. I:
Principles And Understanding”, Journal of Computing in civil Engineering, Vol. 8, No.2, pp. 131-147.
12. Flood, I. & Kartam, N. (1994), “Neural Networks In Civil Engineering. II:
Systems and Application”, Journal of Computing in civil Engineering, Vol. 8, No.2, pp. 149-162.
106
13. Formoso, C.T., Isatto, E.L., and Hirota, E.H. (1999), “Method for waste control in the Building Industry”. IGLC-7 proceedings, Pp221-232.
14. Fu L. M. (1994), “Neural Networks in Computer Intelligence” by McGraw-Hill
15. Ginther, R. S. (1993), “The effect of work environment on labor performance. ”
ME thesis, Pennsylvania State University, University Park, Pa.
16. Handa, V. K., and Abdalla, O. (1989) “Forecasting productivity by work sampling” Construction Management and Economics Vol. 7, pp. 19-28.
17. Hanna, A.S. & Heale, D. G. (1994), “Factors Affecting Construction Productivity:
Newfoundland Versus Rest of Canada”, Can. J. Civ. Eng., Vol. 21, pp. 663-673.
18. Hassanein, A. and Melin, J. (1997) “Crew Design Methodology for Construction Contractors”, Journal of Construction Engineering and Management, Vol.123, No.3, pp. 203-207.
19. Jaselskis, E.J. (1988), “Achieving Construction Project Success through
Predictive Discrete Choice Model”, PhD thesis, The University of Texas at Austin.
20. Kaming, P. F., Holt, G. D., Kometa, S. T. and Olomolaiye, P. O., (1998), “Severity diagnosis of productivity problems---- a reliability analysis” International Journal of Project Management Vol.16, No. 2, pp. 107-113
21. Kaming, P. F., Olomolaiye, P. O., Holt, G. D., and Harris, F. C., (1997), “Factors
influencing craftsmen’s productivity in Indonesia” International Journal of Project Management Vol. 15, No. 1, pp.21-30
22. Koch, J.A. and Maovenzaden, F. (1979), “ Productivity and Technology in
construction”, Journal of the Construction Division, ASCE 105, co4.
23. Koskela, L. (1994), “Lean construction”, Construction and Management Recent
Advances, (TH 438 Ncm)
24. Lim, E.C. and Alum J. (1995), “Construction Productivity: Issues Encountered by Contractors in Singapore”, International Journal of Project Management, Vol. 13, No. 1, pp. 51-58.
25. Lipsey, R.G., Steiner, P.O., Purvis, D.D. and Courant, P.N., (1990) “Economic”
Harper and Row Publisher, New York.
26. Moshlhi, O., Hegazy, T., and Fazio, P. (1991), “ Neural networks as tools in construction.” Journal of Construction Engineering and Management, Vol. 117, No. 4, pp606-625.
107
27. National Research Council panel to review productivity Statistics (1979),
measurement and interpretation of productivity, Washington, D.C: national Academy of Science.
28. Odeh, A. M. and Battaineh, H. T. (2002), “Causes of construction delay:
traditional contracts” International Journal of Project Management Vol. 20, pp67-73
29. Olomolaiye, P.O., Jayawardane, A.K.W., and Harris, F.C. (1998) “Construction
Productivity Management” Longman.
30. Poh, P. S. H. and Chen, J. -D. (1998), “The Singapore Buildable Design Appraisal System: a Preliminary Review of the Relationship Between Buildability, Site Productivity and Cost”, construction Management and Economics, Vol. 16, pp. 681-692.
31. Portas, J. and AbouRizk, S. (1997), “Neural Network Model For Estimating
Construction Productivity”, Journal of Construction Engineering and Management, Vol. 123, No.4, December, pp.399-410.
32. Riggs, J.L. and Felix, G.H. (1983) “Productivity by Objectives” Pretice Hall, Inc,
New York.
33. Russell, A.D. (1993), “Computerized Daily Site Reporting” Journal of Construction Engineering and Management, Vol.119, No.2, pp.385-402.
34. Serpell, A., Venturi, A.,& Contreras, J. (1995), “ Characterization of waste in
building construction projects”, 3rd workshop on lean construction, Albuquerque, 1995
35. Smith, G. R. (1993), “Factors influencing formwork productivity”, Can. J. Civ. Eng. 20, 144-153
36. Sonmez, R. & Rowings, J. E. (1998), “Construction Labor Productivity Modeling
with Neural Networks”, Journal of Construction Engineering and Management, Vol.124, No.6, pp. 498-504.
37. Stalk, G. J. and Hout, T.M. (1989), “Competing against time” Free press, NY.
38. Sui, P. L. (2001), “ Quantifying the relationships between buildability, structural
quality and productivity in construction” Structural survey, Vol. 19, No. 2, PP. 106-112.
108
39. Thomas, H. R. (2000), “Schedule Acceleration, work Flow, and Labor Productivity”, Journal of Construction Engineering and Management, Vol. 126, No. 4, pp. 261-267.
40. Thomas, H. R. and Raynar, K. A. (1997), “Scheduled Overtime and Labor
Productivity: Quantitative Analysis”, Journal of Construction Engineering and Management, Vol. 123, No. 2, pp. 181-188.
41. Thomas, H. R. and Sakarcan, A. S. (1994), “Forecasting Labor Productivity Using
Factor Model”, Journal of Construction Engineering and Management, Vol. 120, No.1, pp.228-239.
42. Thomas, H. R., Guevara, J. M., and Gustenhoven, C. T. (1984) “Improving
productivity estimates by work sampling.” Journal of Construction Engineering and Management, Vol.110, No. 2, pp. 178-188.
43. Thomas, H. R., Sanvido, V. E, and Sanders, S. R., (1989), “Impact of materiall
management on productivity---A case study” Journal of Construction Engineering and Management, Vol.115, No.3, pp.370-384
44. Thomas, H. Randolph & Napolitan, Carmen L. (1995), “Quantitative Effects of
Construction Changes on Labor Productivity”, Journal of Construction Engineering and Management, Vol. 121, No. 3, pp.290-296.
45. Thomas, H. R., Horman, M. J., Souza, U.E.L.D., & Zarski, I., (2002), “Reducing
variability to improve performance as a lean construction principle”, Journal of Construction Engineering and Management, Vol. 128, No. 2, pp.144-154.
46. Venkataraman, S., Fred, M., and Woodrow, B. (1995) “Effect of Roadway
Geometrics and Environmental Factors on Rural Freeway Accident Frequencies” Accident analysis and prevention, Vol. 27, No. 3, pp371-389.
47. Winch, G. and Carr, B. (2001), “Benchmarking on-site productivity in France and
the UK: a Calibre approach”, Construction Management and Economics (2001), 19, pp.577-590
48. Smith, S. D. (1999), “Earthmoving productivity estimation using linear regression
techniques”, Journal of Construction Engineering and Management, Vol. 125, No.3, pp.133-141.
109
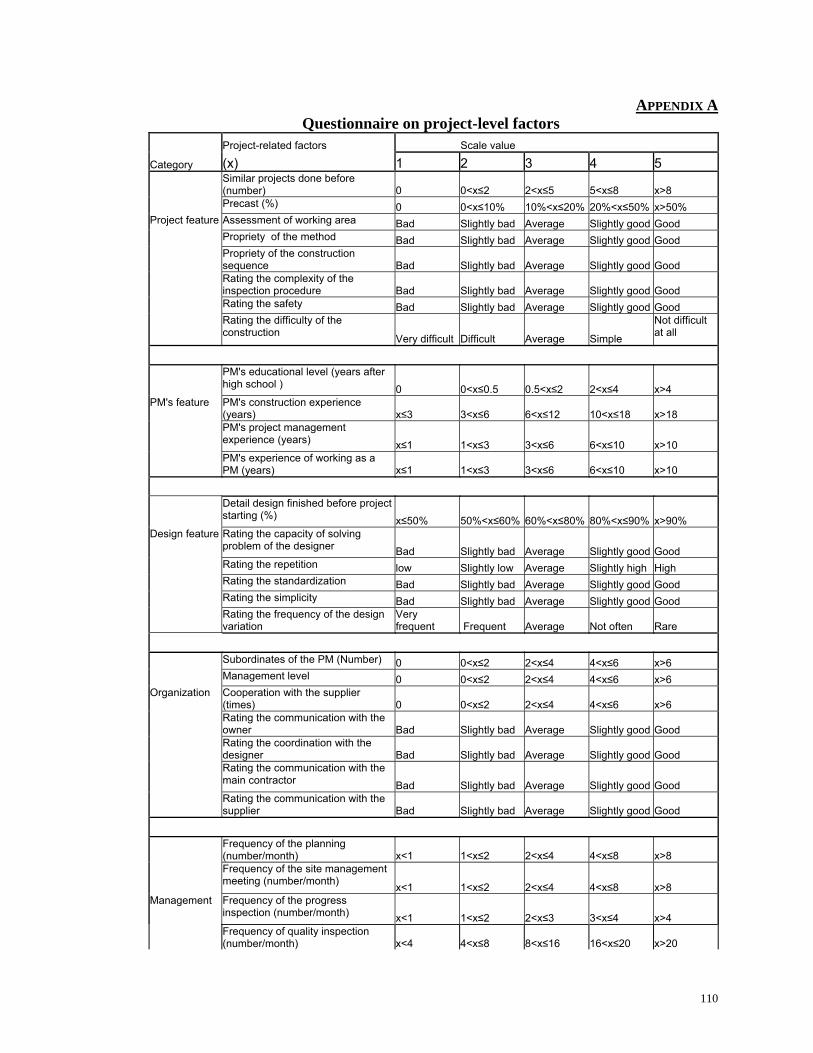
APPENDIX A Questionnaire on project-level factors
Project-related factors Scale value Category (x) 1 2 3 4 5
Similar projects done before (number) 0 0<x≤2 2<x≤5 5<x≤8 x>8
Precast (%) 0 0<x≤10% 10%<x≤20% 20%<x≤50% x>50% Project feature Assessment of working area Bad Slightly bad Average Slightly good Good Propriety of the method Bad Slightly bad Average Slightly good Good
Propriety of the construction sequence Bad Slightly bad Average Slightly good Good
Rating the complexity of the inspection procedure Bad Slightly bad Average Slightly good Good
Rating the safety Bad Slightly bad Average Slightly good Good
Rating the difficulty of the construction Very difficult Difficult Average Simple
Not difficult at all
PM's educational level (years after high school ) 0 0<x≤0.5 0.5<x≤2 2<x≤4 x>4
PM's feature PM's construction experience (years) x≤3 3<x≤6 6<x≤12 10<x≤18 x>18
PM's project management experience (years) x≤1 1<x≤3 3<x≤6 6<x≤10 x>10
PM's experience of working as a PM (years) x≤1 1<x≤3 3<x≤6 6<x≤10 x>10
Detail design finished before project starting (%) x≤50% 50%<x≤60% 60%<x≤80% 80%<x≤90% x>90%
Design feature Rating the capacity of solving problem of the designer Bad Slightly bad Average Slightly good Good
Rating the repetition low Slightly low Average Slightly high High Rating the standardization Bad Slightly bad Average Slightly good Good Rating the simplicity Bad Slightly bad Average Slightly good Good
Rating the frequency of the design variation
Very frequent Frequent Average Not often Rare
Subordinates of the PM (Number) 0 0<x≤2 2<x≤4 4<x≤6 x>6 Management level 0 0<x≤2 2<x≤4 4<x≤6 x>6 Organization Cooperation with the supplier
(times) 0 0<x≤2 2<x≤4 4<x≤6 x>6
Rating the communication with the owner Bad Slightly bad Average Slightly good Good
Rating the coordination with the designer Bad Slightly bad Average Slightly good Good
Rating the communication with the main contractor Bad Slightly bad Average Slightly good Good
Rating the communication with the supplier Bad Slightly bad Average Slightly good Good
Frequency of the planning (number/month) x<1 1<x≤2 2<x≤4 4<x≤8 x>8
Frequency of the site management meeting (number/month) x<1 1<x≤2 2<x≤4 4<x≤8 x>8
Management Frequency of the progress inspection (number/month) x<1 1<x≤2 2<x≤3 3<x≤4 x>4
Frequency of quality inspection (number/month) x<4 4<x≤8 8<x≤16 16<x≤20 x>20
110
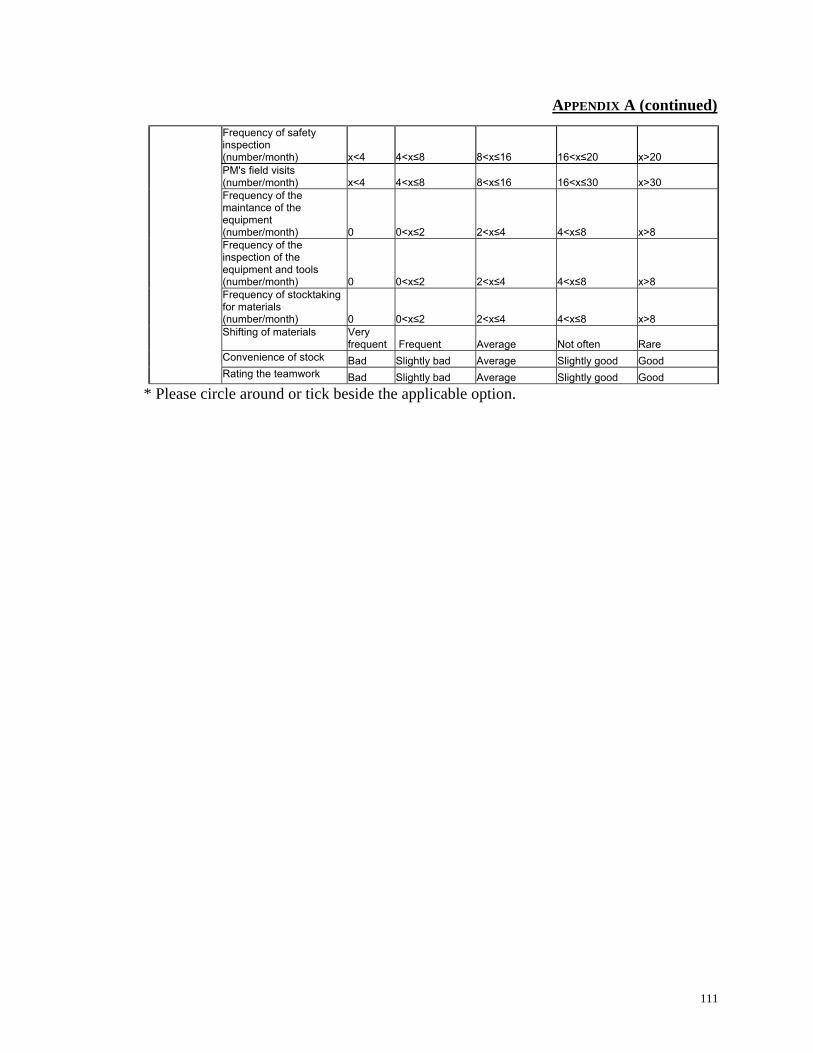
APPENDIX A (continued)
Frequency of safety inspection (number/month) x<4 4<x≤8 8<x≤16 16<x≤20 x>20
PM's field visits (number/month) x<4 4<x≤8 8<x≤16 16<x≤30 x>30
Frequency of the maintance of the equipment (number/month) 0 0<x≤2 2<x≤4 4<x≤8 x>8
Frequency of the inspection of the equipment and tools (number/month) 0 0<x≤2 2<x≤4 4<x≤8 x>8
Frequency of stocktaking for materials (number/month) 0 0<x≤2 2<x≤4 4<x≤8 x>8
Shifting of materials Very
frequent Frequent Average Not often Rare Convenience of stock Bad Slightly bad Average Slightly good Good Rating the teamwork Bad Slightly bad Average Slightly good Good
* Please circle around or tick beside the applicable option.
111
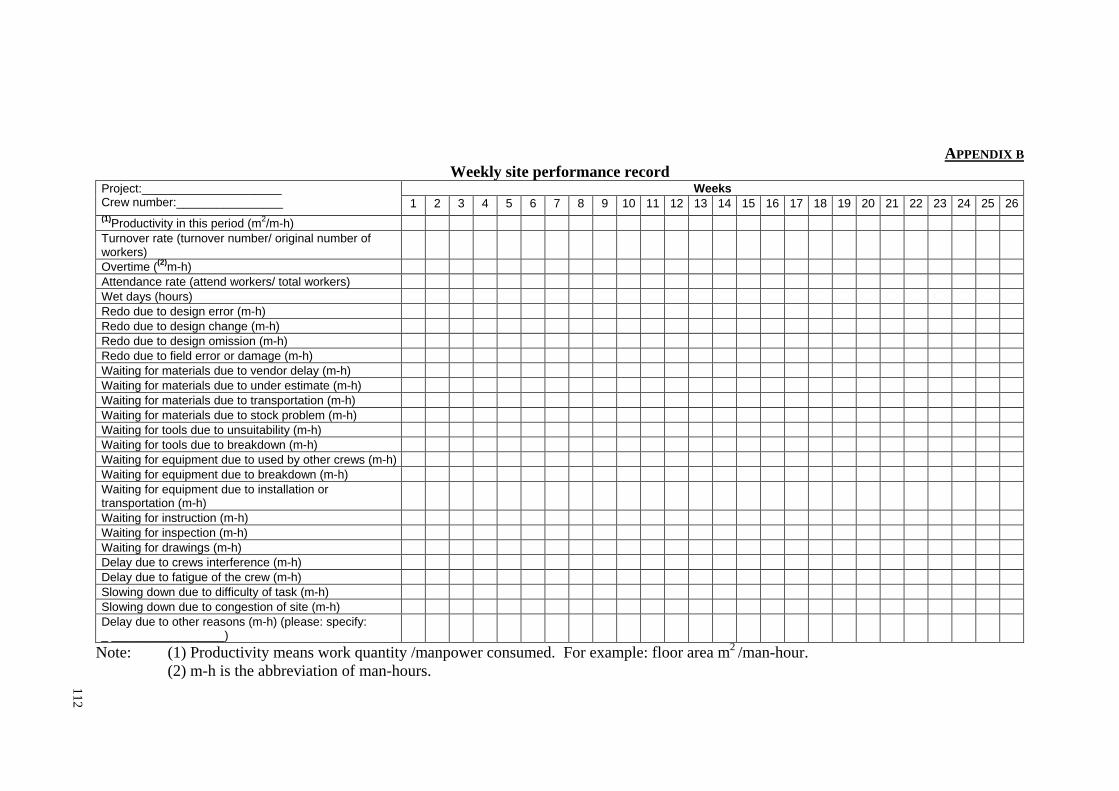
APPENDIX B Weekly site performance record
Weeks Project:_____________________ Crew number:________________ 1 2 3 4 5 6 7 8 9 1 2 5 6 7 8 9 0 1 2 3 410 1 1 13 41 1 1 1 1 1 2 2 2 2 2 25 26 (1)Productivity in this period (m2/m-h) Turnover rate (turnover number/ original number of workers)
Overtime ((2)m-h) Attendance rate (attend workers/ total workers) Wet days (hours) Redo due to design error (m-h) Redo due to design change (m-h) Redo due to design omission (m-h) Redo due to field error or damage (m-h) Waiting for materials due to vendor delay (m-h) Waiting for materials due to under estimate (m-h) Waiting for materials due to transportation (m-h) Waiting for materials due to stock problem (m-h) Waiting for tools due to unsuitability (m-h) Waiting for tools due to breakdown (m-h) Waiting for equipment due to used by other crews (m-h) Waiting for equipment due to breakdown (m-h) Waiting for equipment due to installation or transportation (m-h)
Waiting for instruction (m-h) Waiting for inspection (m-h) Waiting for drawings (m-h) Delay due to crews interference (m-h) Delay due to fatigue of the crew (m-h) Slowing down due to difficulty of task (m-h) Slowing down due to congestion of site (m-h) Delay due to other reasons (m-h) (please: specify: _ _________________)
Note: (1) Productivity means work quantity /manpower consumed. For example: floor area m2 /man-hour. (2) m-h is the abbreviation of man-hours.
112
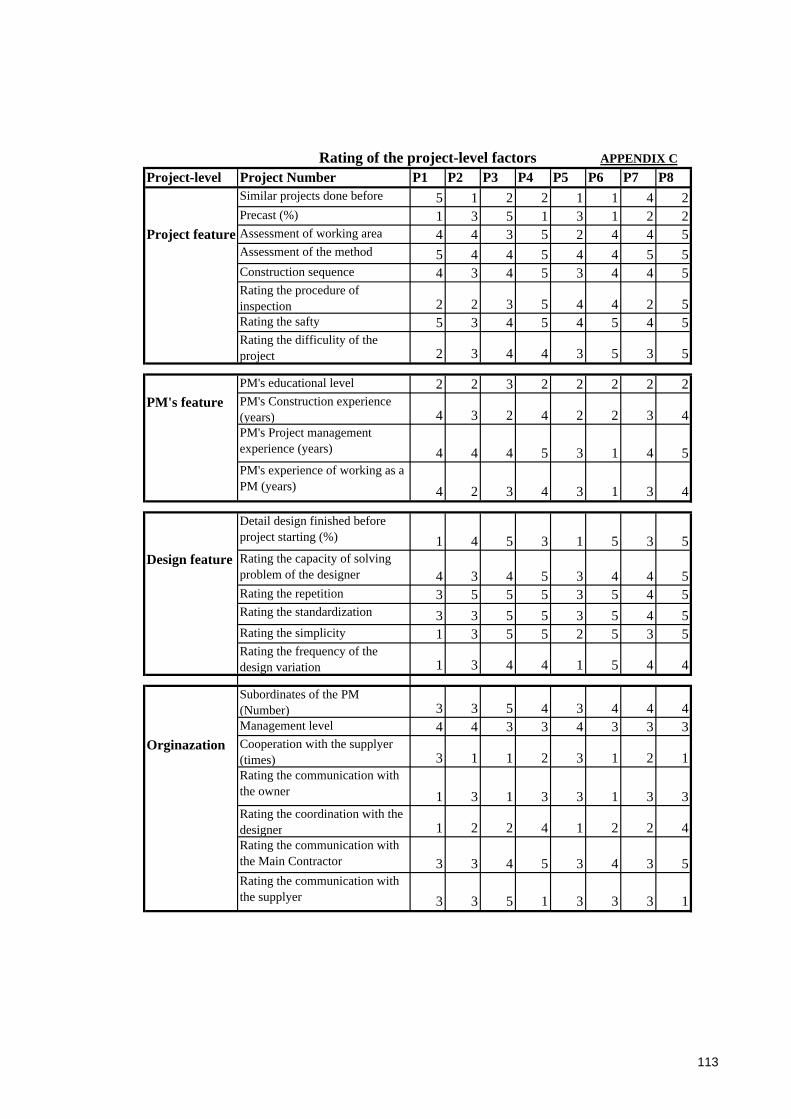
Rating of the project-level factors APPENDIX CProject-level Project Number P1 P2 P3 P4 P5 P6 P7 P8
Similar projects done before 5 1 2 2 1 1 4 2Precast (%) 1 3 5 1 3 1 2 2
Project feature Assessment of working area 4 4 3 5 2 4 4 5Assessment of the method 5 4 4 5 4 4 5 5Construction sequence 4 3 4 5 3 4 4 5Rating the procedure ofinspection 2 2 3 5 4 4 2 5Rating the safty 5 3 4 5 4 5 4 5Rating the difficulity of theproject 2 3 4 4 3 5 3 5
PM's educational level 2 2 3 2 2 2 2 2PM's feature PM's Construction experience
(years) 4 3 2 4 2 2 3 4PM's Project managementexperience (years) 4 4 4 5 3 1 4 5PM's experience of working as aPM (years) 4 2 3 4 3 1 3 4
Detail design finished beforeproject starting (%) 1 4 5 3 1 5 3 5
Design feature Rating the capacity of solvingproblem of the designer 4 3 4 5 3 4 4 5Rating the repetition 3 5 5 5 3 5 4 5Rating the standardization 3 3 5 5 3 5 4 5Rating the simplicity 1 3 5 5 2 5 3 5Rating the frequency of thedesign variation 1 3 4 4 1 5 4 4
Subordinates of the PM(Number) 3 3 5 4 3 4 4 4Management level 4 4 3 3 4 3 3 3
Orginazation Cooperation with the supplyer(times) 3 1 1 2 3 1 2 1Rating the communication withthe owner 1 3 1 3 3 1 3 3Rating the coordination with thedesigner 1 2 2 4 1 2 2 4Rating the communication withthe Main Contractor 3 3 4 5 3 4 3 5Rating the communication withthe supplyer 3 3 5 1 3 3 3 1
113
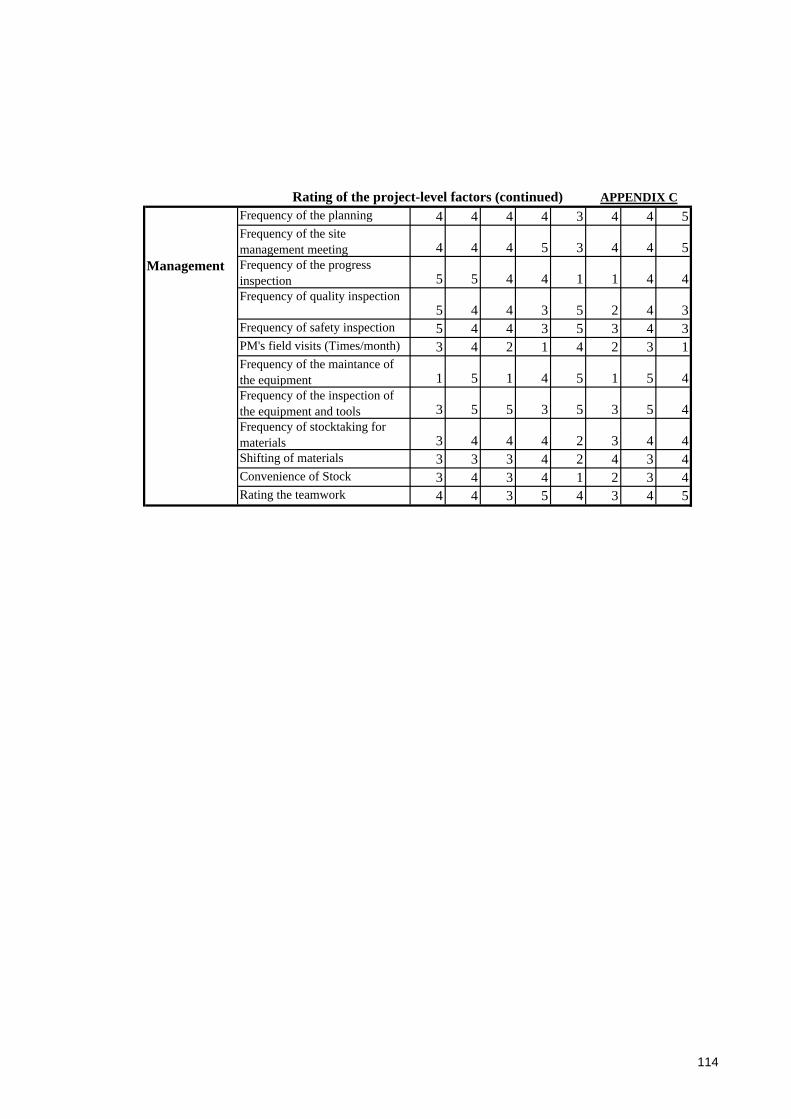
Rating of the project-level factors (continued) APPENDIX CFrequency of the planning 4 4 4 4 3 4 4 5Frequency of the sitemanagement meeting 4 4 4 5 3 4 4 5
Management Frequency of the progressinspection 5 5 4 4 1 1 4 4Frequency of quality inspection
5 4 4 3 5 2 4 3Frequency of safety inspection 5 4 4 3 5 3 4 3PM's field visits (Times/month) 3 4 2 1 4 2 3 1Frequency of the maintance ofthe equipment 1 5 1 4 5 1 5 4Frequency of the inspection ofthe equipment and tools 3 5 5 3 5 3 5 4Frequency of stocktaking formaterials 3 4 4 4 2 3 4 4Shifting of materials 3 3 3 4 2 4 3 4Convenience of Stock 3 4 3 4 1 2 3 4Rating the teamwork 4 4 3 5 4 3 4 5
114

Result of weekly site performance APPENDIX DPr
oduc
tivity
over
time
Wet
days
Des
ign
erro
r
Des
ign
chan
ge
Des
ign
omm
isio
n
Fiel
d er
ror
Tool
s bre
akdo
wn
Und
eres
timat
e
Tool
s1 n
ot su
itabl
e
Equi
pmen
t use
d by
oth
er
Equi
pmen
t bre
akdo
wn
Equi
pmen
t ins
tall
and
trans
port
stoc
k pr
oble
m
Mat
eria
l ven
dor d
elay
Inst
ruct
-ions
Insp
ect-i
on
Dra
win
gs
Cre
ws i
nter
fere
nce
Diff
icul
ity
Con
ges-
tion
Ligh
ting
0.86 40 50 15 15 0 20 30 0 30 100 0 0 0 20 0 40 5 10 0 0 100.61 30 8 30 20 10 25 50 0 40 120 60 0 20 20 10 50 20 20 0 20 200.83 98 15 20 0 0 10 20 0 40 70 0 0 10 40 0 30 0 15 0 10 200.67 30 10 40 50 0 30 20 0 50 100 40 0 15 60 10 60 15 20 0 15 400.58 40 45 30 30 15 15 40 0 50 70 0 20 10 30 10 45 20 20 0 15 150.77 45 30 20 20 20 10 40 0 30 60 50 0 0 30 10 25 10 10 0 10 200.81 24 10 10 10 10 10 20 0 30 45 50 10 0 20 0 30 20 15 0 0 200.62 90 15 30 20 0 10 30 0 40 90 0 10 0 35 0 55 20 25 0 20 400.71 40 50 25 25 10 30 30 0 30 90 0 30 0 40 0 30 10 10 80 0 200.72 45 25 20 20 20 20 50 0 30 80 30 45 0 40 0 30 10 10 0 15 200.73 35 10 15 15 0 25 60 0 40 80 45 45 0 20 10 25 5 15 0 10 200.79 100 15 10 10 10 10 20 0 20 70 0 35 0 40 0 25 20 15 0 0 200.62 60 15 30 30 15 50 20 0 50 85 20 30 20 50 10 45 20 25 60 10 400.87 25 40 0 0 0 0 0 0 40 40 30 10 10 0 0 25 0 10 0 30 100.79 30 45 10 0 0 0 0 0 50 45 0 20 10 20 0 40 5 15 0 25 150.78 24 30 0 15 0 10 0 0 50 60 0 20 10 10 10 30 10 20 0 25 200.83 18 15 0 0 0 0 0 0 50 45 0 20 0 0 0 30 10 10 0 10 100.63 40 10 0 25 0 15 0 0 70 50 35 25 20 35 0 50 10 15 0 40 200.71 20 12 20 0 0 0 0 0 50 30 0 25 10 15 10 50 5 10 0 35 100.66 20 15 20 0 0 10 0 0 60 50 50 30 10 30 10 30 5 10 0 35 200.94 25 45 0 0 0 0 0 0 20 25 20 0 0 20 0 20 0 0 0 20 100.87 30 50 10 0 0 0 0 0 30 25 0 0 0 10 0 25 0 10 0 30 100.74 25 35 0 25 0 0 0 0 30 30 0 0 10 15 10 40 10 25 0 15 200.80 15 15 10 10 0 0 0 0 30 25 0 0 0 20 0 50 10 20 0 25 200.67 25 50 15 0 0 0 0 0 100 130 40 50 15 0 10 50 10 20 0 40 100.83 30 40 0 0 0 0 0 0 80 90 0 20 10 0 0 40 5 10 0 30 100.70 30 35 10 0 0 0 0 0 70 80 0 35 20 0 10 25 10 15 0 20 200.70 14 15 10 0 0 0 0 0 80 100 0 35 10 0 10 30 10 10 0 25 100.65 25 15 10 0 0 0 0 0 80 140 60 45 20 0 10 40 10 10 0 20 200.81 20 40 20 40 15 15 50 30 60 75 0 20 0 30 0 30 5 10 0 10 00.87 25 40 20 20 5 10 40 40 70 80 0 20 0 40 0 30 10 10 0 10 00.90 30 30 15 15 0 20 40 50 70 55 0 30 0 25 0 20 0 0 0 10 01.08 20 15 20 0 0 10 20 40 30 50 0 15 0 10 0 25 0 0 0 0 00.89 25 20 20 20 10 0 20 20 40 50 0 15 0 30 0 40 10 0 15 15 00.82 20 15 30 35 25 20 30 20 70 60 120 15 10 25 0 30 0 10 10 20 00.78 25 10 20 20 20 20 50 40 80 50 0 20 10 50 10 45 10 10 0 20 00.88 30 25 0 0 0 0 0 0 0 30 0 15 0 15 0 30 0 0 0 0 00.94 30 10 0 0 0 0 0 0 0 25 0 0 0 0 5 30 0 0 10 0 00.88 30 15 0 0 0 0 0 0 0 25 60 15 0 20 0 20 0 0 20 0 01.08 30 10 0 0 0 0 0 0 0 15 0 0 0 15 0 20 0 0 10 0 00.74 30 15 0 0 0 0 0 0 0 30 0 30 10 15 0 30 0 0 0 0 0
115
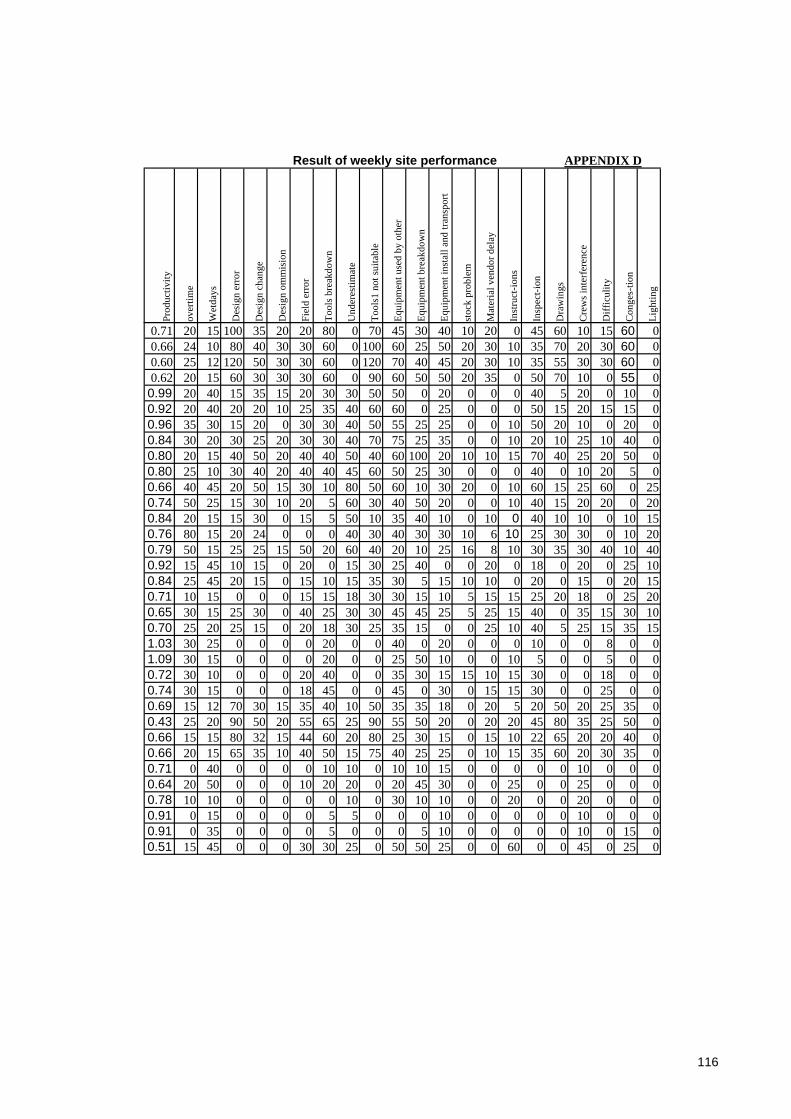
Result of weekly site performance APPENDIX DPr
oduc
tivity
over
time
Wet
days
Des
ign
erro
r
Des
ign
chan
ge
Des
ign
omm
isio
n
Fiel
d er
ror
Tool
s bre
akdo
wn
Und
eres
timat
e
Tool
s1 n
ot su
itabl
e
Equi
pmen
t use
d by
oth
er
Equi
pmen
t bre
akdo
wn
Equi
pmen
t ins
tall
and
trans
port
stoc
k pr
oble
m
Mat
eria
l ven
dor d
elay
Inst
ruct
-ions
Insp
ect-i
on
Dra
win
gs
Cre
ws i
nter
fere
nce
Diff
icul
ity
Con
ges-
tion
Ligh
ting
0.71 20 15 100 35 20 20 80 0 70 45 30 40 10 20 0 45 60 10 15 60 00.66 24 10 80 40 30 30 60 0 100 60 25 50 20 30 10 35 70 20 30 60 00.60 25 12 120 50 30 30 60 0 120 70 40 45 20 30 10 35 55 30 30 60 00.62 20 15 60 30 30 30 60 0 90 60 50 50 20 35 0 50 70 10 0 55 00.99 20 40 15 35 15 20 30 30 50 50 0 20 0 0 0 40 5 20 0 10 00.92 20 40 20 20 10 25 35 40 60 60 0 25 0 0 0 50 15 20 15 15 00.96 35 30 15 20 0 30 30 40 50 55 25 25 0 0 10 50 20 10 0 20 00.84 30 20 30 25 20 30 30 40 70 75 25 35 0 0 10 20 10 25 10 40 00.80 20 15 40 50 20 40 40 50 40 60 100 20 10 10 15 70 40 25 20 50 00.80 25 10 30 40 20 40 40 45 60 50 25 30 0 0 0 40 0 10 20 5 00.66 40 45 20 50 15 30 10 80 50 60 10 30 20 0 10 60 15 25 60 0 250.74 50 25 15 30 10 20 5 60 30 40 50 20 0 0 10 40 15 20 20 0 200.84 20 15 15 30 0 15 5 50 10 35 40 10 0 10 0 40 10 10 0 10 150.76 80 15 20 24 0 0 0 40 30 40 30 30 10 6 10 25 30 30 0 10 200.79 50 15 25 25 15 50 20 60 40 20 10 25 16 8 10 30 35 30 40 10 400.92 15 45 10 15 0 20 0 15 30 25 40 0 0 20 0 18 0 20 0 25 100.84 25 45 20 15 0 15 10 15 35 30 5 15 10 10 0 20 0 15 0 20 150.71 10 15 0 0 0 15 15 18 30 30 15 10 5 15 15 25 20 18 0 25 200.65 30 15 25 30 0 40 25 30 30 45 45 25 5 25 15 40 0 35 15 30 100.70 25 20 25 15 0 20 18 30 25 35 15 0 0 25 10 40 5 25 15 35 151.03 30 25 0 0 0 0 20 0 0 40 0 20 0 0 0 10 0 0 8 0 01.09 30 15 0 0 0 0 20 0 0 25 50 10 0 0 10 5 0 0 5 0 00.72 30 10 0 0 0 20 40 0 0 35 30 15 15 10 15 30 0 0 18 0 00.74 30 15 0 0 0 18 45 0 0 45 0 30 0 15 15 30 0 0 25 0 00.69 15 12 70 30 15 35 40 10 50 35 35 18 0 20 5 20 50 20 25 35 00.43 25 20 90 50 20 55 65 25 90 55 50 20 0 20 20 45 80 35 25 50 00.66 15 15 80 32 15 44 60 20 80 25 30 15 0 15 10 22 65 20 20 40 00.66 20 15 65 35 10 40 50 15 75 40 25 25 0 10 15 35 60 20 30 35 00.71 0 40 0 0 0 0 10 10 0 10 10 15 0 0 0 0 0 10 0 0 00.64 20 50 0 0 0 10 20 20 0 20 45 30 0 0 25 0 0 25 0 0 00.78 10 10 0 0 0 0 0 10 0 30 10 10 0 0 20 0 0 20 0 0 00.91 0 15 0 0 0 0 5 5 0 0 0 10 0 0 0 0 0 10 0 0 00.91 0 35 0 0 0 0 5 0 0 0 5 10 0 0 0 0 0 10 0 15 00.51 15 45 0 0 0 30 30 25 0 50 50 25 0 0 60 0 0 45 0 25 0
116

Appendix E
Question List for Interview
--Significant Factors Affecting Construction Productivity
Do these situations happen frequently during site operation? (Please put “×” or “√” in
bracket).
- Waiting for equipment due to its being occupied ( )
- Waiting for equipment due to installation ( )
- Waiting due to equipment’s breakdown ( )
- Waiting due to unsuitable tools ( )
- Waiting due to tools malfunction ( )
- Waiting due to delivery delay ( )
- Waiting due to underestimating of materials required ( )
- Waiting for materials due to stock problems ( )
- Waiting for instruction ( )
- Waiting for inspection ( )
- Waiting for drawings ( )
- Rework due to design error ( )
- Rework due to design change ( )
- Rework due to design omission ( )
- Rework due to field error ( )
- Waiting due to congested site ( )
- Waiting due to crews’ interference ( )
- Idling due to labor’s lack of enthusiasm ( )
Other incidents that affecting site work (if any):____________________________
__________________________________________________________________
117


