Download - Sino US Relations
8/9/2019 Sino US Relations
http://slidepdf.com/reader/full/sino-us-relations 1/5
Economi
cs&
politics
ResearchBriefing
AuthorMarkus Jaeger+1 212 [email protected]
EditorMaria Laura Lanzeni
Technical Assistant
Bettina Giesel
Deutsche Bank ResearchFrankfurt am MainGermanyInternet: www.dbresearch.com
E-mail: [email protected] Fax: +49 69 910-31877
Managing DirectorThomas Mayer
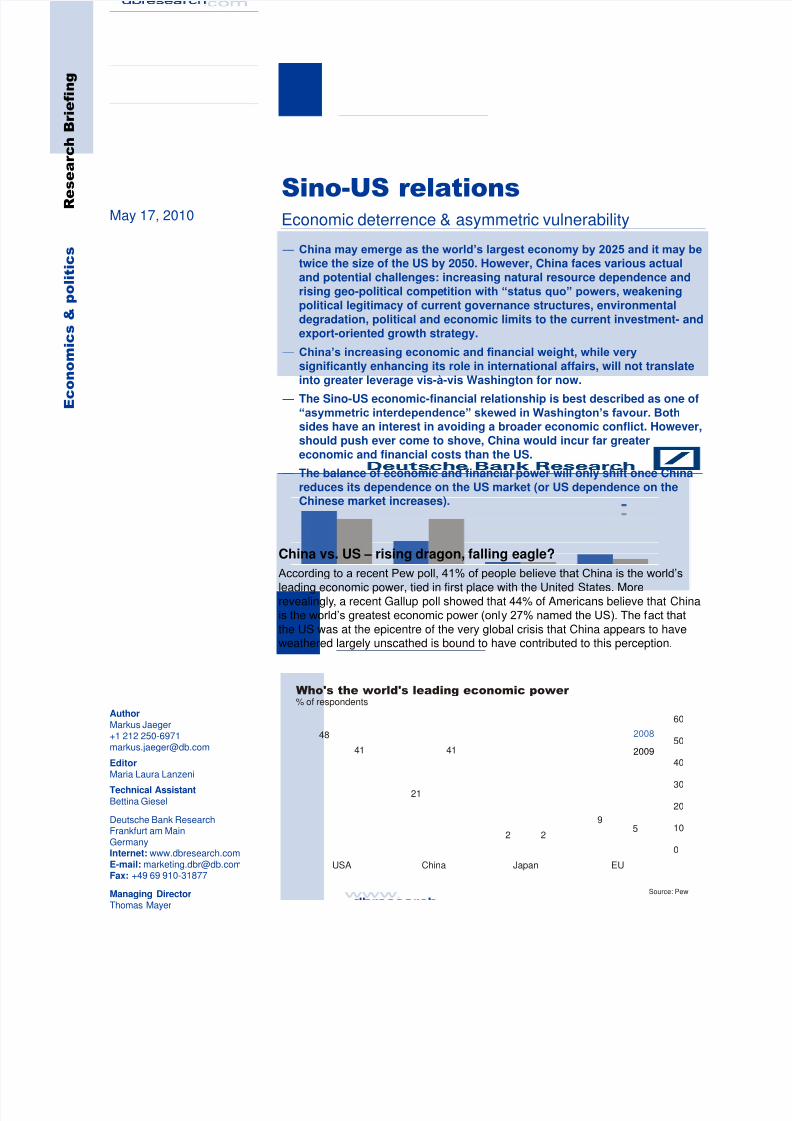
China vs. US – rising dragon, falling eagle?
According to a recent Pew poll, 41% of people believe that China is the world’s
leading economic power, tied in first place with the United States. Morerevealingly, a recent Gallup poll showed that 44% of Americans believe that Chinais the world’s greatest economic power (only 27% named the US). The fact that
the US was at the epicentre of the very global crisis that China appears to haveweathered largely unscathed is bound to have contributed to this perception.
May 17, 2010
Sino-US relationsEconomic deterrence & asymmetric vulnerability
— China may emerge as the world’s largest economy by 2025 and it may be
twice the size of the US by 2050. However, China faces various actualand potential challenges: increasing natural resource dependence andrising geo-political competition with “status quo” powers, weakeningpolitical legitimacy of current governance structures, environmentaldegradation, political and economic limits to the current investment- andexport-oriented growth strategy.
— China’s increasing economic and financial weight, while very
significantly enhancing its role in international affairs, will not translateinto greater leverage vis-à-vis Washington for now.
— The Sino-US economic-financial relationship is best described as one of“asymmetric interdependence” skewed in Washington’s favour. Both
sides have an interest in avoiding a broader economic conflict. However,should push ever come to shove, China would incur far greatereconomic and financial costs than the US.
— The balance of economic and financial power will only shift once Chinareduces its dependence on the US market (or US dependence on theChinese market increases).
48
21
2
9
41 41
25
0
10
20
30
40
50
60
USA China Japan EU
2008
2009
Who's the world's leading economic power % of respondents
Source: Pew

8/9/2019 Sino US Relations
http://slidepdf.com/reader/full/sino-us-relations 2/5
Research Briefing
2 May 17, 2010
In reality, of course, China’s economy is merely 1/3 the size of the
US economy (measured at market exchange rates), but, admittedly,2/3 measured at PPP exchange rates. While China is set to replaceJapan as the world’s second-largest economy this year, it will notovertake the US before 2025. China did, however, replace Germanyas the world’s largest exporter last year and it is both the largest
holder of official FX reserves and the second-largest netinternational creditor.
China’s economic and financial weight will continue to grow on theback of continued strong economic growth and (net) foreign assetaccumulation. While enhancing its influence in internationaleconomic affairs (including IFIs), it will not translate into significantlygreater bilateral leverage vis-à-vis Washington. This, despite the factthat the US will be running ―super -sized‖ fiscal deficits for some time
to come and that China – and primarily the Chinese government – isthe single largest holder of US government debt.
Remember “Japan as number one”?
It is very tempting to regard the global crisis as the event thatprecipitated the decline of the US and the rise of China. The ―rise
and decline‖ school has gotten it spectacularly wrong before,
however. During the 1970s, especially following the Vietnam Warand during the economically challenging Carter years, the―declinists‖ – as incredibly as this may sound today – worried thatUS economic stagnation would lose Washington the Cold Waragainst an increasingly assertive Soviet Union. It turned out that itwas the Soviet Union that was experiencing decline, leading to itseventual economic collapse and political break-up a little more thana decade later.
During the 1980s, when the US was running record-high fiscal and
current account deficits, Japan was going to emerge as ―number one‖, only to crash financially and burn economically before the
decade was over. It has experienced economic malaise ever since.During the 1990s and early 2000s, the US, supposedly, ―re -emerged‖ again as the most powerful economy with no seriouschallengers on the horizon, despite attempts to cast a German-ledEurope and a possibly rebounding Japan as potential challengers.Following the 2008 financial crisis, strengthened in their belief byapparent US geo-political setbacks in Afghanistan and Iraq, the―declinists‖ are once more predicting US decline. This time, it is
China’s turn to rise and challenge US pre-eminence.
Dragon rising
China does indeed look set to overtake the US in terms of economicsize. Not only has China weathered pretty much unscathed the verycrisis that has pushed the US economy ―off -course‖. But China has
been growing at an average annual rate of nearly 10% since thebeginning of economic reforms in the late 1970s. On current trendsand at PPP GDP, China will replace the US as the world’s largest
economy within the next decade. Chinese GDP measured at marketexchange rates should reach US levels by 2025 or so. Some well-respected China analysts, like Bert Keidel, even forecast theChinese economy potentially to be twice the size of the US by 2050.
While Chinese growth may slow down from double-digit levels, the
medium-term growth outlook appears solid. A low degree ofurbanization and a low per capita capital stock provide conditionsconducive to continued strong growth. When Japan slipped intocrisis, it had already reached the ―technological frontier‖. The Soviet
0
500
1,000
1,500
2,000
2,500
3,000
00 02 04 06 08 10
Increasing financial
China, FX reserves, USD bn
Sources: IIF, DB Research
prowess
3
0.00.20.40.60.81.01.21.41.6
C h i n a
G e r m a n y
U S
J a p a n
F r a n c e
Exports Imports
China is world's largestexporter USD tr, 2009F
Source: DB Research 2
-6
-4
-2
0
2
4
6
8
1 9 8 0
1 9 8 3
1 9 8 6
1 9 8 9
1 9 9 2
1 9 9 5
1 9 9 8
2 0 0 1
2 0 0 4
2 0 0 7
2 0 1 0
2 0 1 3
Remember JapanJapan, real GDP growth, %
Source: IMF 4
0
4,000
8,000
12,000
16,000
20,000
C h i n a
G e r m a n y
J a p a n
U S
1990 2000 2010 2015
Source: IMF
China risingGDP, USD bn, PPP
1

8/9/2019 Sino US Relations
http://slidepdf.com/reader/full/sino-us-relations 3/5
Sino-US relations
May 17, 2010 3
economic model, based on ―extensive‖ rather than ―intensive‖
growth, was not sustainable, especially in the context of strong geo-political competition that forced Moscow to keep defenceexpenditure at ultimately ruinous levels. By contrast, China isgenerating both intensive and extensive growth. So if Chinamanages to avoid geo-political competition by way of a ―peaceful
rise‖, it is likely to enjoy continued solid growth for the foreseeablefuture. This is the ―consensus China story‖ as seen through the eyesof the ―extrapolators―.
Cautionary voices of the bears
The China bears, on the other hand, not only expect Chinese growthrates to decline substantially. But they also see other, potentiallydangerous speed bumps on China’s road to economic pre-eminence. To stick with this metaphor, a speed bump can slow onedown; but if one hits it at top speed, it may throw one off-course, andmay even land one in the ditch. These ―bumps‖ include, among
others, the following: increasing natural resource dependence and
rising geo-political competition with ―status quo‖ powers (Friedberg),a ―trapped (economic) transition‖ (Pei), a crisis of political legitimacypotentially coinciding with political instability (MacFarquhar), politicaland economic limits to investment-heavy and (supposedly) export-oriented growth (Goldstein/Lardy).
One does not have to be a China bear to believe that the risks arebiased to the down- rather than the upside. But it is equallyimportant to recognise that a reasonable ―downside‖ scenario islikely to mean 5-7% annual growth rather than economic stagnation.China is unlikely to be thrown off-course in the way the Soviet andJapanese economies were. Structurally speaking, China’s medium -term growth potential is very significant. China is located far from the
technological frontier (unlike Japan in the 1980s). China’sdevelopment model is also based on a relatively high degree ofeconomic openness and is hence much better suited to generatetotal factor productivity growth than the economically closed SovietUnion, which lacked access to advanced Western/global technology.
The Soviet and Japanese examples, nonetheless, suggest the needto critically re-examine the economic and political sustainability ofChina’s growth strategy given China’s rapid progression from low- tomiddle-income economy. In Rumsfeldian parlance, China facesquite a few ―known unknowns‖ and, one must assume, a non-negligible number of ―unknown unknowns‖, though this can, of
course, not be known. History, in any event, would seem to counsel
some caution when it comes to simply extrapolating current trends adecade or more out into the future.
China’s financial prowess & Sino-US relations
China’s increasing economic size will provide Beijing with greater
political, economic and financial influence. China is in a radicallydifferent position from where it was a decade ago. Political,economic and financial influence comes in many guises. But overthe medium-term, it requires a strong economy and a solid financialposition. On both scores, China compares favourably to the US.While China is the world’s second-largest net creditor (after Japan),the US is the world’s largest debtor. While the US is running the
largest current account deficit, China is running the largest surplus.Arguably this has thus far provided Beijing with little in terms ofbilateral influence. It may have made Washington more reluctant topursue a confrontational policy towards Beijing, but it does not
0
2
4
6
8
10
12
14
16
1 9 8 0
1 9 8 3
1 9 8 6
1 9 8 9
1 9 9 2
1 9 9 5
1 9 9 8
2 0 0 1
2 0 0 4
2 0 0 7
2 0 1 0
2 0 1 3
Impressive performanceChina, real GDP growth, %
Source: IMF 5
-25-20-15-10-50510152025
BR CN IN RU DE JP US EUAgro Fuels & mining
Manufactures Services
Very dependent oncommodity importsNet exports, % of GDP, 2008
Source: IMF 8
0
20
40
60
80100
1 9 5 0
1 9 5 5
1 9 6 0
1 9 6 5
1 9 7 0
1 9 7 5
1 9 8 0
1 9 8 5
1 9 9 0
1 9 9 5
2 0 0 0
2 0 0 5
2 0 1 0
China Japan US
More urbanisation-driven
Rural population, % of total
Source: UN
growth in the pipeline
6
0
100
200
300
400
500
2005 2020 2040 2060 2080 2100
US China
This may be a little toobullishGDP, 2005 USD terms, tr
Source: Bert Keidel
7

8/9/2019 Sino US Relations
http://slidepdf.com/reader/full/sino-us-relations 4/5
Research Briefing
4 May 17, 2010
provide Beijing with a lever of direct influence vis-a-vis Washington,mainly because of the US’s reserve-currency country status andChina’s dependence on the US as an export market.
China’s most direct lever of influence vis-a-vis the US is the threat tosell off its estimated USD 880 bn worth of US treasury securities (as
of February) – and another USD 450 bn worth of agency debt (as ofJune 2009). Such a move would be quite costly for Beijing, however.First, economically and financially, China would shoot itself in theproverbial foot. The value of its holdings would decline and higherUS interest rates would weigh on the US growth outlook, hurtingChinese exports. Furthermore, China would have to find other dollarassets to invest in, unless it is willing to accept RMB appreciation – and too rapid a RMB appreciation is hardly in China’s interest in
terms of exports and dollar-denominated US debt holdings. If it doesre-invest in dollar-denominated assets, this would presumably helpease financing conditions in other parts of the US economy,potentially offsetting the negative effect of higher rates in thetreasury market. But these assets would be less liquid and carry
higher credit risk. A Chinese threat to divest US debt may thereforenot be considered very credible by Washington.
Secondly, even if Beijing were to sell large holdings of US debt, it isunclear how sizeable an impact this would have on US yields. In thevery short run, it might disrupt financial markets, but the medium-term impact would likely be manageable, as other foreign (official)buyers would step in, albeit at higher interest rates (e.g. Japan, Gulfcountries). Last but not least, any politically motivated fire sale of USdebt would trigger a very severe political backlash – and not justfrom the US. A fire sale (as opposed to a gradual unwinding ofholdings) would also undermine China’s standing as a reliable
financial investor and economic partner in the eyes of many other
countries.
Deterrence & asymmetric interdependence
Financially, economically and politically, Beijing would pay a highprice for pushing up US borrowing costs and, in all likelihood, amuch higher price than Washington would end up paying. First, theUS has access to a more diversified investor base (with parts ofwhich it maintains close political relations) than Beijing has marketsto invest in – at least as long as Beijing seeks to maintain a stableUSD-RMB exchange rate. Second, in the short run, the US marketis also substantially more important to China in terms of bothexports and imports than vice versa (chart 12) – and the Chinese
export sector is relatively more employment intensive! Last but notleast, Beijing’s concern about maintaining near-double-digit growthrates would diminish the credibility of any action that risks triggeringan outright economic conflict with the US, or a severe US economicslowdown on the back of financial instability.
In short, China’s holdings of US debt do not lend themselves as a
coercive instrument. They may act as a sort of limited deterrent.Naturally, rising cross-border asset holdings and trade haveincreased interdependence, raising the costs of economic conflictfor both sides – but the potential costs of a conflict due to China’s
trade dependence are substantially higher for Beijing than forWashington. The Sino-US economic-financial relationship is
therefore best described as one of ―asymmetric interdependence‖(or ―asymmetric vulnerability‖), skewed in Washington’s favour f ornow.
024681012141618
2000 2002 2004 2006 2008
Japan China
Who depends on whom?Holdings of US government debt,% of total debt outstanding*
Source: Treasury
*2009 data based on new benchmark survey.
9
-1,000-800-600-400-20002004006008001,000
00 03 06 09 12 15
China US
Vastly different positionsCurrent account, USD bn
Source: IMF 11
0369121518
2005 2006 2007 2008 2009
TreasuryAgencyCorporate & other debt
Who depends on whom(cont'd)?
Chinese holdings of US l/t debt,% of l/t securities outstanding
Source: TIC*Excludes short-term.
10
0
1
2
3
4
5
6
7
US China
Exports Imports
China is much morevulnerableBilateral trade, % of GDP
Source: IMF 12

8/9/2019 Sino US Relations
http://slidepdf.com/reader/full/sino-us-relations 5/5
Sino-US relations
Washington continues to hold a stronger hand – fornow
None of this means that China’s financial and economic power is not
a force to be reckoned with. China’s growing international financial
resources, rising outward investment, increasing prominence as a
trade partner and importance as a location for global FDI havematerially increased its influence (and interests). Nonetheless, asregards Sino-US relations, China will – for the foreseeable future – derive only limited bilateral influence from its meteoric economic andfinancial rise.
By the same token, Beijing will have a greater incentive to avoid abroader bilateral economic confrontation than Washington given thesubstantially greater economic and financial costs China would incurin the event of such a conflict. None of this is meant to suggest thata Sino-US economic conflict will never occur. Domestic politicalconsiderations do sometimes result in ―miscalculated― government
policies. However, if raison d’état and pragmatism prevail in both
Beijing and Washington, inevitably recurring economic tensions willremain manageable.
Last but not least, if and when China reduces its export dependenceon the US market relative to US dependence on the Chinesemarket, the balance of economic and financial power will changedramatically in Beijing’s favour. Until then, Beijing will have a fargreater interest in preventing a wider economic-financial conflictthan Washington.
© Copyright 2010. Deutsche Bank AG, DB Research, D-60262 Frankfurt am Main, Germany. All rights reserved. When quoting please cite ―Deutsche Bank
Research‖. The above information does not constitute the provision of investment, legal or tax advice. Any views expressed reflect the current views of the author, which do not
necessarily correspond to the opinions of Deutsche Bank AG or its affiliates. Opinions expressed may change without notice. Opinions expressed may differ from
views set out in other documents, including research, published by Deutsche Bank. The above information is provided for informational purposes only and withoutany obligation, whether contractual or otherwise. No warranty or representation is made as to the correctness, completeness and accuracy of the information given
or the assessments made.
In Germany this information is approved and/or communicated by Deutsche Bank AG Frankfurt, authorised by Bundesanstalt für Finanzdienstleistungsaufsicht. In
the United Kingdom this information is approved and/or communicated by Deutsche Bank AG London, a member of the London Stock Exchange regulated by theFinancial Services Authority for the conduct of investment business in the UK. This information is distributed in Hong Kong by Deutsche Bank AG, Hong Kong
Branch, in Korea by Deutsche Securities Korea Co. and in Singapore by Deutsche Bank AG, Singapore Branch. In Japan this information is approved and/ordistributed by Deutsche Securities Limited, Tokyo Branch. In Australia, retail clients should obtain a copy of a Product Disclosure Statement (PDS) relating to any
financial product referred to in this report and consider the PDS before making any decision about whether to acquire the product.
50.635.1
25.3
15.2
-1.2 -3.2 -17.7
-24.0
-6
-4
-2
0
2
4
J a p a n
C h i n a
G e r m a n y
R u s s i a
I n d i a
U K
B r a z i l
U S
Only trailing JapanNet IIP, USD tr, 2008; data label in% of GDP
Source: IMF 13
0
10
20
30
40
50
60
1
9 9 0 - 2 0 0 0 *
2 0 0 5
2 0 0 6
2 0 0 7
2 0 0 8
2 0 0 9
Sources: UNCTAD, DB Research
Becoming a player Chinese outward FDI flows, USD bn
*Annual average
14


