
4th International Conference on Earthquake Engineering Taipei, Taiwan October 12-13, 2006
Site-specific Prediction of Seismic Ground Motion with Bayesian Updating Framework
Site-specific Prediction of Seismic Ground Motion with Bayesian Updating Framework
Min Wang, and Tsuyoshi Takada
The University of Tokyo
Min Wang, and Tsuyoshi Takada
The University of Tokyo

2006/10/12 2
Takada Lab. UT
Introduction
Prediction of ground motion Important step of PSHA (Probabilistic Seismic Hazard Analysis) By the (past empirical) attenuation relation
Multi-event&
Multi-site
Status quo
Hazard / Risk@
specific-site
Needs
Past attenuation relation Site-specific attenuation relation

2006/10/12 3
Takada Lab. UT
Midorikawa & Ohtake 2003
Prediction : biased Uncertainty: average characteristic
Problems in the past attenuation relation
TKCH07 IBR005 TKY011 TCG009 TKY010-3
-2
-1
0
1
2
3
4 Number of data n : 42+54+61+63+73 = 293
Station Code
Log
arit
hmic
Dev
iati
on
Number of data n :Number of data n :Number of data n :Number of data n :
P=0P
Statistical uncertainty: not considered
TKCH07 IBR005 TKY011 TCG009 TKY010-3
-2
-1
0
1
2
3
4 Number of data n :
42
Station Code
Log
arit
hmic
Dev
iati
on
Number of data n :
54
Number of data n :
61
Number of data n :
63
Number of data n :
73
ˆˆ( , ) Py g x β

2006/10/12 4
Takada Lab. UT
Site-specific attenuation relation
Model
Mean value of ground motion y :
Variance of ground motion y : Var(y) = y2 =
2 + 2
Specific Only applied to the specific site
Local soil condition, topographic effects…(any local geologic conditions)
( , , )ˆˆ ( , )y g m r θx β
ˆ( )E y g
: median of the past attenuation relation(m,r,) : correction term = 0+ Mm+ Rr =(0,M, R ), random variables: random term, ~N(0,
2)
g
y2 =
2
2006/10/12 5
Takada Lab. UT
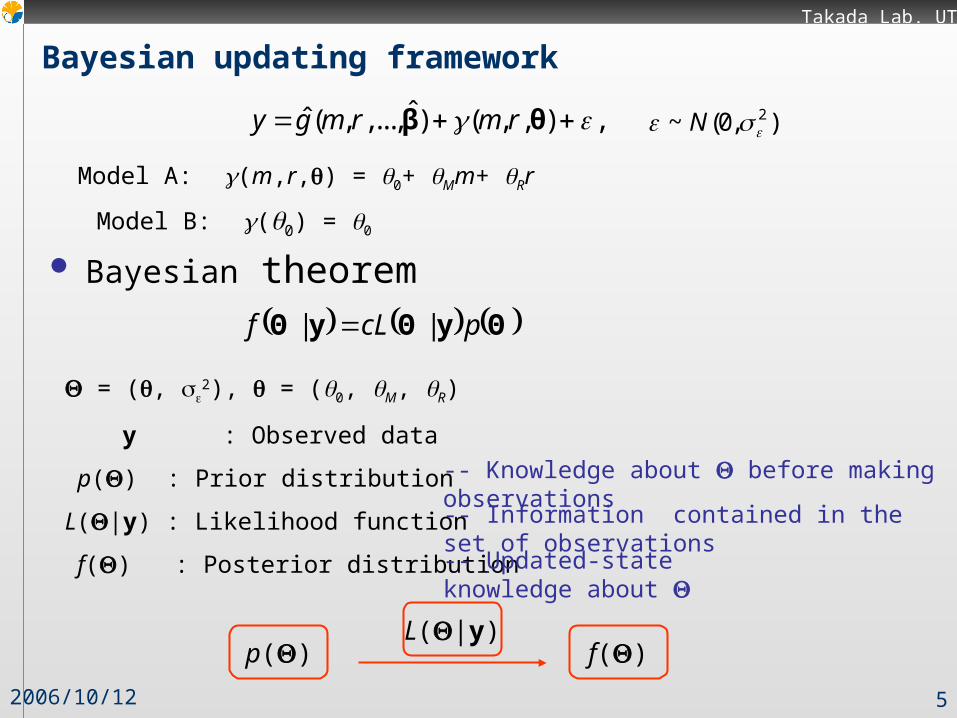
Bayesian updating framework
Bayesian theorem
ˆˆ( , ,..., ) ( , , ) ,y g m r m r β θ
Model A: (m,r,) = 0+ Mm+ Rr
Model B: (0) = 0
ΘyΘyΘ pcLf ||
= (, 2), = (0, M, R)
y : Observed data
p() : Prior distribution
L(|y) : Likelihood function
f() : Posterior distribution
),0(~ 2 N
-- Knowledge about before making observations
-- Information contained in the set of observations
-- Updated-state knowledge about
p()L(|y)
f()

2006/10/12 6
Takada Lab. UT
Bayesian estimation
Prior distribution Noinformative, independent about and
2 (Jeffrey’s rule, 1961)
p(, 2) 1/
2
Likelihood function
Marginal posterior distribution
2 2 / 22
( ) '( )( , ) ( ) exp ,
2nL
γ xθ γ xθθ
ˆ γ y g
3( , , )nx 1 m r
2
2
ˆ ˆ( ) ' ' ( )( ) 1
n
fvs
θ θ x x θ θθ
2
( / 2 1)2 22
( ) exp2
v vsf
1ˆ ( ' ) 'θ x x x y2 ˆ ˆ(1/ )( ) '( )s v γ γ γ γ
ˆˆ γ xθ
3v n
x = (1, m, r)
2ˆ ˆ, θ

2006/10/12 7
Takada Lab. UT
Evaluation of site-specific attenuation relation
Sites K-NET, KiK-NET, etc.
Data 1997~2005, Mw ≥ 5.0, R ≤ 250km,
PGA ≥ 10gal
Past attenuation relation (PGA) Si-Midorikawa (1999)
After S. Midorikawa (2005)

2006/10/12 8
Takada Lab. UT
Results
Site HKD100 & EKO.ERI

2006/10/12 9
Takada Lab. UT
Results
Site HKD100 & EKO.ERI
Site HKD10047 earthquakes
Site EKO.ERI20 earthquakes
4.5 5 5.5 6 6.5 7 7.5 8 8.50
50
100
150
200
250
Moment Magnitude m
Hyp
ocen
ter D
ista
nce
r (k
m)
Site Code : EKO.ERI Number of Observations : 20
4.5 5 5.5 6 6.5 7 7.5 8 8.50
50
100
150
200
250
Moment Magnitude m
Hyp
ocen
ter D
ista
nce
r (k
m)
Site Code : HKD100Number of Observations : 47
EKO.ERI HKD100-2
-1
0
1
2
3
4
Site Code
Loga
rithm
ic D
evia
tion
Number of data n =
20 47
ˆˆ ˆ( , )y g x β
^

2006/10/12 10
Takada Lab. UT
Parameter estimation
- 6 - 4 - 2 0 2 40
0.2
0.4
0.6
0.8
0
f ( 0)
- 0.5 0 0.5 10
1
2
3
4
m
f ( m
)
- 0.01 0 0.01 0.020
50
100
150
200
250
r
f ( r )
0 0.2 0.4 0.60
2
4
6
8
2
f ( 2 )
Parameters Estimator Standard deviation
0 -1.543 0.716
m 0.290 0.129
r 0.004 0.002
2 0.262 0.061
• Model A: HKD100

2006/10/12 11
Takada Lab. UT
Parameter estimation
• Model B
Site EKO.ERI (n=20) Site HKD100 (n=47)
Parameters EstimatorStandarddeviation
EstimatorStandarddeviation
0 0.497 0.286 0.597 0.087
2 1.459 0.596 0.338 0.077
- 2 0 20
0.5
1
1.5
0
f ( 0)
0 2 40
0.2
0.4
0.6
0.8
1
2
f ( 2 )
0 0.5 1 1.50
1
2
3
4
5
0
f ( 0)
0 0.5 10
2
4
6
2
f ( 2 )

2006/10/12 12
Takada Lab. UT
Prediction of ground motion
Predictive PDF of ground motion y
* * * *( | ) ( | , ) ( )f y L y f dΘx x Θ Θ Θ
Expectation over = (, 2)
100
101
10210
0
101
102
103
104
Mw
= 8.0
R (km)
PG
A (
gal)
this studySi-Midorikawa
Mw
= 5.0
6.0
7.0
Focal depth : 50 km Interplate earthquake
2ˆ ˆ( , )θ
* * *ˆ ˆ( , ) ( , )y g x β x θ

2006/10/12 13
Takada Lab. UT
Prediction of ground motion
Site EKO.ERI, Model B
0 50 100 150 200 250 3000
0.002
0.004
0.006
0.008
0.01
0.012
0.014
0.016
0.018
0.02
PGA (gal)
f PG
A(p
ga)
Site Code : EKO.ERI (35.72N, 139.76E)CENTRAL CHIBA PREF 2005/ 07/ 23
Observed: 113.10 (gal)Si- Midorikawa: 55.93 (gal), = 0.70This study: 90.98 (gal),
all = 1.27
This study
Median
Si- Midorikawa
Observation Mw = 6.0
R = 82 kmDepth = 73 kmInterplate
0 100 200 300 400 500 600 700 800 9000
1
2
3
4
5
6
7
8x 10
- 3
PGA (gal)f P
GA(p
ga)
Site Code : HKD100 (42.28N, 143.32E)SE OFF ERIMOMISAKI 2003/ 09/ 26
Observed: 425.91 (gal)Si- Midorikawa: 139.49 (gal), = 0.70This study: 305.24 (gal),
all = 0.58
This Study
Si- Midorikawa
Observation
Median
Mw = 7.3
R = 74 kmDepth = 21 kmInterplate
Site HKD100, Model A

2006/10/12 14
Takada Lab. UT
Discussions
Site-specific attenuation relation
Past attenuation relation
Method Bayesian approach Classical regression
Estimator PDF of parameter Point estimator
Statistical uncertainty
Possible Impossible
Uncertainty Specific site Common

2006/10/12 15
Takada Lab. UT
Conclusions
The site-specific attenuation are developed based on the past attenuation relation and observations with Bayesian framework.
It shows more flexibility that the correction term can expressed in a linear model and its reduced models according to the observations.
Although the statistical uncertainty will decrease, the inherent variability and model uncertainty remain unchanged no matter how much data increase.
The site-specific attenuation relation is suggested to be incorporated into PSHA because its median component and uncertainty component can represent those at the specific site.

2006/10/12 16
Takada Lab. UT
Thank you for your attention!

2006/10/12 17
Takada Lab. UT
Uncertainty of Ground Motion
Inherent Variability: temporal variability or spatial variability or both.
Model Uncertainty: missing variables and simplifying the function form in the prediction model (attenuation relation).
Statistical Uncertainty: limited data.
---- aleatory uncertainty
---- epistemic uncertainty
---- epistemic uncertainty
What is P2 of the past attenuation relation ? ˆ , ˆ
Py f x β
Answers to
---- represent inherent variability and model uncertainty.
---- represent the average character of uncertainty for all sites.

2006/10/12 18
Takada Lab. UT
Ground Motion
Modeling the ground motion
Effects of ground Motion: ---- Source, path, site
( , , ) aGM f Source Path Site
a: inherent variability, aleatory uncertainty
when f represents the real world of ground motion
m , s: epistemic uncertainty
Mathematical modeling
x: variables, : parameters ,ˆamGM f x θ
m: model uncertainty, when replaces f .f
Buildings
Engineering bedrock
Seismic bedrock
Source
Path
Site
s: statistical uncertainty, when is estimated with limited number of data.
Parameter estimate
ˆ , ˆsm aGM f θx

2006/10/12 19
Takada Lab. UT
Past attenuation relation
Model of ground motion
Mathematical modeling
Py
0.5100.5 0.0043 0.61 log ( 0.0055 10 ) 0.003wM
w i i Py M D d E R R
e.g. Si-Midorikawa(1999)
Mathematical modeling
ˆˆ( , ) Py g x β y: ground motion in natural logarithmx: variables, such as Mw, R, D, …, etc. : regression coefficientsP: random term ~N(0, P
2)β
P :
• inherent variability a , aleatory uncertainty
• model uncertainty m , epistemic uncertainty
( , , ) aGM f Source Path Site a: ~ N(0, a2)
a: inherent variability

2006/10/12 20
Takada Lab. UT
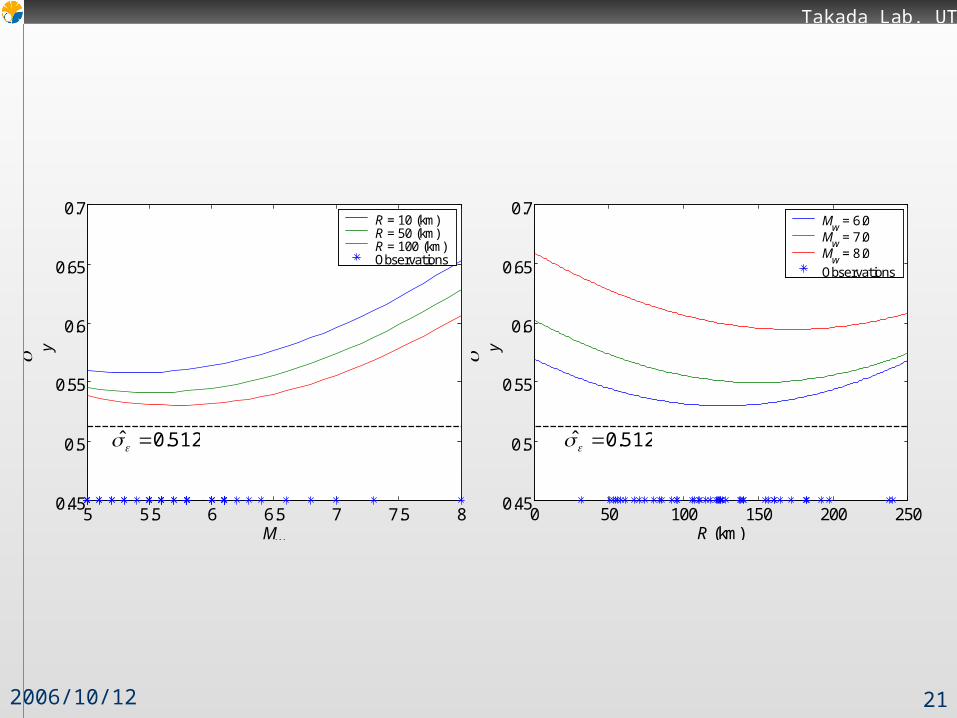
Uncertainty considering statistical uncertainty
* * *
* 1 *
ˆ ˆˆ( , )( ) ~
ˆ 1 ( ) '( ' )v
y gt
x β x θy
x x x x
x : observations of magnitude m and distance r.x*: new value of magnitude m and distance r.y*: new prediction of ground motion given x*.
5 5.5 6 6.5 7 7.5 8
50
100
150
200
250
Mw
R (
km)
0.54
0.56
0.58
0.6
0.62
0.64
Contour of y
2006/10/12 21
Takada Lab. UT
5 5.5 6 6.5 7 7.5 80.45
0.5
0.55
0.6
0.65
0.7
Mw
y
R = 10 (km)R = 50 (km)R = 100 (km)Observations
0 50 100 150 200 2500.45
0.5
0.55
0.6
0.65
0.7
R (km)
y
Mw = 6.0
Mw = 7.0
Mw = 8.0
Observations
512.0ˆ 512.0ˆ

2006/10/12 22
Takada Lab. UT
Soil-specific attenuation relation
Attenuation relation on a baseline condition
Amplification factor
Engineering bedrock
Surface
Amplification factor e.g. f(Vs)
Attenuation relation on Engineering bedrock

2006/10/12 23
Takada Lab. UT
Prediction for unobserved site --Macro-spatial Correlation Model
Conditional PDF of GMs at Unobserved Site:
Assuming GM is a log-normal field,
Conditional PDF can be given:
x1
x2
x3
y = ?
Unobserved Site
Observed Site
),,(
),,,()(
1
1,|
n
nYY xxf
xxyfyf
X
XxX
2|
| 2||
ˆ( )1( ) exp
22Y x
Y x
Y xY x
y yf y
XX
XX
2| 1 1
| 2
1 2|
( )2
/ 1 /
Y t tY Y c c Y
tY Y c Y
C C
C
X xX x X X
X x X X
x x
( ) expXYhh b 0 20 40 60 80 100
0
0.1
0.2
0.3
0.4
0.5
0.6
0.7
0.8
0.9
1
y = exp(- h/ 22.4)
h (km)
RLL
(h)
( ) exp 22.4XYhh
Ref.: Wang, M. and Takada, T. (2005): Macrospatial correlation model of seismic ground motion, Earthquake Spectra, Vol. 21, No. 4, 1137-1156.

2006/10/12 24
Takada Lab. UT
Conclusions
Give a new thinking on the prediction of ground motion. Change from common to specific Mean component is unbiased. Uncertainty represents that of specific site.
Reclassify the uncertainty of the prediction of ground motion. Inherent variability, model uncertainty, statistical uncertainty. Can deal with uncertainty due to data. Answer to how much degree the future earthquake is like the past.


