Six Characteristics of Science CONPTT
Consistency- Several scientists can repeat an experiment and the results are the same. Observability- The results or subject of an experiment can be observed by using the five senses or extensions of them. Natural- A natural cause must be used to explain why or how the naturally occurring result or experimental subject happens. Supernatural can’t be used. Predictability- Predictions can be made about the subject and can be tested. Testability- Subject can be tested using a controlled experiment. Tentativeness- Scientific theories are subject to change because of technology. Science-has all six characteristics. Pseudoscience-has five, four, or three of the characteristics. Nonscience-has two, one, or none of the characteristics.

Name_______________________________________________________ Date ________________ Period __________
Content Sections
Criteria Student checklist
Teacher Evaluation
Identify the problem/question that was investigated. 1 0 Problem/ Question The question is written in correct format. 2 1 0
The hypothesis is testable and aligned with the question. 4 3 2 1 0 Hypothesis Hypothesis is written as an “If…, then…” statement. 4 3 2 1 0
At least two paragraphs are dedicated to background information. Sources are cited.
4 3 2 1 0 Prior
Research Appropriate Information is included. 4 3 2 1 0
Independent Variable and operational definition is stated. 4 3 2 1 0
Dependent Variable and operational definition is stated. 4 3 2 1 0
Variables What variables did you keep the same? (Controlled Variables)
4 3 2 1 0
All materials used in the experiment are listed. 4 3 2 1 0 All procedures are listed in the correct order. 4 3 2 1 0 Exact measurements are used. 4 3 2 1 0 The experiment can easily be created. 4 3 2 1 0
Experiment (materials and procedures)
Experiment is written in the third person. 2 1 0 All data and observations are recorded. 4 3 2 1 0 Data is presented in tables, charts, graphs, narrative form or pictures.
4 3 2 1 0
Tables, charts, and graphs follow ITALK requirements 4 3 2 1 0 Describe what the data tables and graphs show. Describe what happened in your experiment.
4 3 2 1 0
Compare the predicted and actual results. 4 3 2 1 0 Explain if the experiment and results are reliable and valid.
4 3 2 1 0
Describe 3 sources of error in your experiment. 4 3 2 1 0
Discussion of
Results
Explain how you could avoid those errors in the future. 4 3 2 1 0 Restate the purpose of the experiment. 1 0 Restate the hypothesis. 2 1 0 Was the hypothesis supported or refuted, why? 4 3 2 1 0 What did I learn and how did I learn it? 4 3 2 1 0
Conclusions Be sure to
answer these questions.
What new questions am I left with? What further research can be done on this topic?
4 3 2 1 0
References Give bibliography information for at least 3 sources. 4 3 2 1 0
Total 100 Possible Points
***Science Lab Report Format***
(COVER PAGE - Size 22 font Tahoma, Comic Sans, Courier, Times Roman. Center)
The Effect of IV on the DV
(Size 12 font) Name Period
Mr. Prichard

(Font 18, centered)
Abstract (Own Page. This is for the Science Fair only) (All text should be left justified and in size 12 font)
Problem/Question (Share pages with other sections)
Hypothesis (Share pages with other sections)
Prior Research (Share pages with other sections)
Variables (Share)
Experiment (Share)
Materials: (both the words “materials and procedure” are size 12, left justified, italicized) • (Remember DETAILS) •
Procedure: 1. 2. 3. etc.
Results (Share)
Results, Data Tables, Graphs Data Analysis Discussion of Results
Conclusion (Share) Summary of Results Hypothesis supported or refuted Comparing results, what you learned, and importance Future questions, research, and experiments
References/Works Cited/Bibliography (Share)

WRITING “GOOD” OBSERVATIONS
IT Never use the word “it”.
What is “it”? NO OPINIONS
“YUCKY”, “BAD”, “UGLY”,“COOL”, “AWESOME”, “WEIRD”, “OFF THE HOOK”. ASK YOURSELF CAN ANYONE
DISAGREE?
OPINIONS
USE Complete Sentences WHEN MAKING AN OBSERVATION TRY TO USE AS MANY WORDS AS POSSIBLE.
USE 2 OR MORE DESCRIPTIVE WORDS WHEN MAKING AN OBSERVATION TRY TO USE AS MANY WORDS AS POSSIBLE. “DARK, NAVY BLUE.” USE ANALOGIES WHEN POSSIBLE. “LIGHT BLUE LIKE THE SKY.”
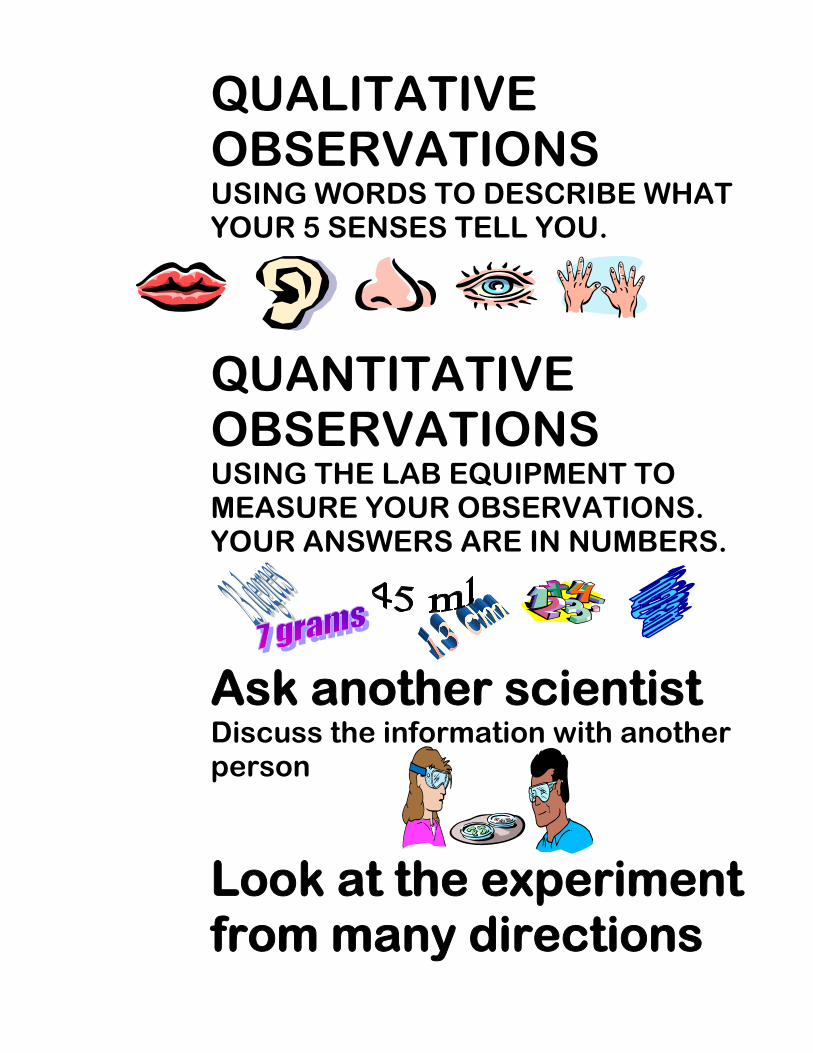
QUALITATIVE OBSERVATIONS USING WORDS TO DESCRIBE WHAT YOUR 5 SENSES TELL YOU.
QUANTITATIVE OBSERVATIONS USING THE LAB EQUIPMENT TO MEASURE YOUR OBSERVATIONS. YOUR ANSWERS ARE IN NUMBERS.
Ask another scientist
Discuss the information with another person
Look at the experiment from many directions
Prichard – Science
Name: ___________________________ Period:______ Date: _________________
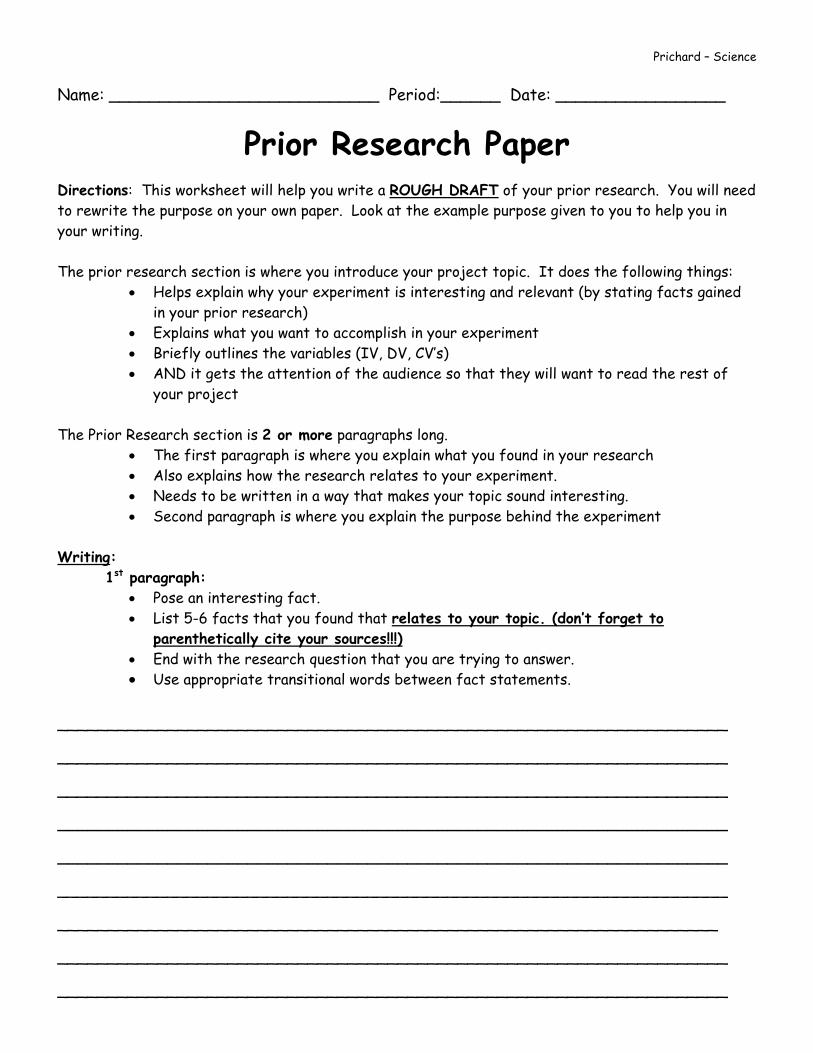
Prior Research Paper
Directions: This worksheet will help you write a ROUGH DRAFT of your prior research. You will need to rewrite the purpose on your own paper. Look at the example purpose given to you to help you in your writing. The prior research section is where you introduce your project topic. It does the following things:
• Helps explain why your experiment is interesting and relevant (by stating facts gained in your prior research)
• Explains what you want to accomplish in your experiment • Briefly outlines the variables (IV, DV, CV’s) • AND it gets the attention of the audience so that they will want to read the rest of
your project The Prior Research section is 2 or more paragraphs long.
• The first paragraph is where you explain what you found in your research • Also explains how the research relates to your experiment. • Needs to be written in a way that makes your topic sound interesting. • Second paragraph is where you explain the purpose behind the experiment
Writing:
1st paragraph: • Pose an interesting fact. • List 5-6 facts that you found that relates to your topic. (don’t forget to
parenthetically cite your sources!!!) • End with the research question that you are trying to answer. • Use appropriate transitional words between fact statements.
___________________________________________________________________
___________________________________________________________________
___________________________________________________________________
___________________________________________________________________
___________________________________________________________________
___________________________________________________________________
__________________________________________________________________
___________________________________________________________________
___________________________________________________________________
Prichard – Science
2nd Paragraph: • State why the project is being done • What is the IV? What is the DV? How are you measuring the IV and DV? • What do you hope to gain by completing this research? • Use the prompts to finish the sentences. (when you rewrite, don’t write the
small italicized part….that is just to help you determine what to write!) The intent of this project is to…(what are you comparing?) __________________________
___________________________________________________________________
___________________________________________________________________
The variable to be tested and changed is… (list the IV here) ________________________
___________________________________________________________________
Any changes will be noted by… (how are you measuring the DV?)____________________________
_________________________________________________________________________________
The research will show…. (what do you want your experiment to show?) ___________________
___________________________________________________________________
___________________________________________________________________
___________________________________________________________________

Prichard – Science
Variables: Variables are factors or conditions that can affect the outcome of an experiment. Use the
following spaces to identify the variables in your experiment:
Independent Variable a.k.a. Manipulated Variable:
A factor or condition that is intentionally changed by an investigator (you) in an experiment
_____________________________________________________________________
Operational Definition (how will the Independent Variable be measured). Be sure to state
how measurements will be made, the equipment, and the units of measurement that will be
used:
_____________________________________________________________________
_____________________________________________________________________
Dependent Variable a.k.a. Responding Variable:
A factor or condition that might be affected as a result of that change. This is the outcome that you measure in an experiment.
_____________________________________________________________________
Operational Definition (how will the Dependent Variable be measured). Be sure to state how
measurements will be made, the equipment, and the units of measurement that will be used:
_____________________________________________________________________
_____________________________________________________________________
Constants a.k.a. Controlled Variables:
A variable that is not changed. There can be lots of these. (list at least 8 Controlled
Variables or more if possible):
_____________________________________________________________________
_____________________________________________________________________
_____________________________________________________________________

Prichard – Science
Prior Research Example
Earthworms live in soils all over the world. These very valuable organisms eat their way through the soil breaking up clumps and adding nutrients (Smith 67). In addition, they are an important part of the food chain (Jones 114). Insecticides are absorbed directly from an environment and have been identified as non-selective toxins (Barker 352). Should mankind think twice before using an insecticide as a quick fix?
The intent of this project is to compare the average pulse rate of an earthworm in an ecosystem contaminated with traces of an insecticide to those in an ecosystem without any traces of an insecticide. The variable to be tested and changed is the amount used of a popular insecticide. Any changes will be noted by counting the number of times an earthworm’s dorsal blood vessel pulses in 15 seconds. The research will show that insecticides not only affect insects, but other creatures as well.
Variables Example INDEPENDENT VARIABLE: amount of insecticide OPERATIONAL DEFINITION: The amount of insecticide used will be measured in
milliliters with a graduated cylinder. DEPENDENT VARIABLE: heart rate of earthworms OPERATIONAL DEFINITION: Heart rate will be measured by counting how many
times the heart beats in one minute using a clock with a second hand. CONTROLLED VARIABLES: set amount of earthworms, same type of potting soil, same type of moss, same type of plants, same type of containers, same temperature, same type and temperature of water, same amount of sunlight

An experimental question focuses on a relationship between two variables – how one variable affects a second variable.
Experimental questions are written in this format: How does the (independent variable) affect the (dependent variable)? When writing Experimental Questions: 1. State them in question form. 2. Avoid questions that can be answered with YES or NO. 3. Include information such as the population (group the investigation will
focus on) and area (where the investigation will take place). Examples: • How does the thickness of tire treads affect the braking distance of a
car? • How does the amount of batting practice affect the batting average of
the Willis Junior High School baseball team?

Steps for writing a good Hypothesis
Use The Following Format to Write a Good Hypothesis: Define the INDEPENDENT and DEPENDENT variable: Use the following If…, Then…, Because…format: INDEPENDENT variable DEPENDENT variable:
If the _____________________________increases or decreases, then the ____________________________ will (increase or decrease) because (Based on your research, why do you think this will happen?)_______________ __________________________________________________________. EXAMPLE Experimental question: How does the amount of daylight affect the number of eggs a hen will lay? • Independent variable: The amount of daylight measured in hours, minutes, and
seconds. • Dependent variable (measurable event): The number of eggs the hens laid.
Hypothesis: If the amount of daylight increases, then the number of eggs laid will increase because increased exposure to sunlight mimics spring and summer which are egg laying seasons for hens.
Rules for good hypotheses:
1) Always use the If…, Then…, because… format. 2) NEVER write “I Think” in a hypothesis. 3) Always use the “future tense” Example: The number of eggs will increase; NOT
may increase, could increase, did increase.

Steps to Planning Your Scientific Investigation
I. Write an experimental question for your experiment:
How does (IV) affect (DV)?
II. Write a hypothesis for your experiment:
IF (IV) is increased/decreased/changed by… , then the (DV) will increase/decrease/change by…. . This will happen because (scientific reason).
III. Start writing procedures.
GUIDELINES FOR WRITING PROCEDURES
Good, now you are ready to start planning your experiment.
1. Safety: What will you do to be safe during the experiment? What safety equipment will you use?
2. Materials: List all the materials (including safety materials) that will be used before you list
the procedures. Include the size, amounts, and measurements of materials where necessary.
3. Experimental Setup: Describe your experimental setup. Include drawings, diagrams,
sketches, or photos of the experimental setup.
4. Measuring Variables: State the independent and the dependent variables. Describe how you are going to measure the independent and the dependent variables.
5. Controlling Variables: Describe how you are going control the controlled variables. 6. Procedure: Give step by step instructions for your experiment
a. Begin each procedure with a verb. Some common ones you may use include: gather, position, place, observe, and record amongst others.
b. Number each procedure. c. Include only one direction in each procedure. For example, if you will measure the
temperature and then record it on the data chart, make them two steps. The first one would be “measure the temperature” and the next step would be “record your results in the data chart.”
d. Give specific measurements for changing the independent variable. For example, if the independent variable is temperature, then each case might be 10oC, 20oC, 30oC etc.
e. Explain how many times you will repeat your experiment. You should repeat the experiment at least 5 times for 5 trials. Possibly more.
f. Why is it important to repeat your experiment? Give at least two reasons. g. Be specific! Remember, these procedures should be clear enough that another
scientist could conduct your experiment without getting confused and he/she should get similar results.

7. Draw a data table for your results. Show IV and DV with units. e.g.
Title Goes Here DV (units)
Trial Number IV (units)
1 2 3 4 5 Average
Fill in data as you conduct your experiment.
Write the specific changes here.

SAMPLE PROCEDURES FOR TESTING A PAPER AIRPLANE
Safety Considerations: In order to ensure safety for this experiment protective goggles will be warn and the airplanes will not be flown in the direction of anyone. Materials: Paper airplane design page Five paper clips Meter stick Masking tape Long, breezeless hallway Pen Data chart
Safety goggles Experimental setup (include experimental question): In order to test the question; “How does the number of paper clips on the nose of a paper airplane affect the distance it will fly?” The experimental set up will be that the papers will be laid out and constructed on a table and then taken outside to be flown. Outside and piece of masking tape will be taped to the ground and the airplanes flown in one direction and measured. Measuring Variables: The independent variable will be measured by counting the number of paper clips and the dependent variable will be measured using a meter stick and measuring in meters.
Controlling Variables: In order to control variables the same size and type of paper, same paper airplane design, same size and type of paper clips, same breezeless hallway, same starting line, same amount of thrust to fly the plane, same angle of release, same placement of paper clips Procedures: 1. Construct the paper airplane using the paper airplane design. 2. Place a piece of masking tape on the floor to mark the starting point for the paper airplane throw. 3. Throw the paper airplane with zero paperclips on the plane’s nose. 4. Observe where the paper airplane lands after it stops moving. 5. Measure the distance from the masking tape start line to the paper airplane using a meter stick. 6. Record the distance the plane flew in meters on the data chart. 7. Repeat steps 3 – 6 two more times. 8. Calculate the average of the three trials. 9. Record the average in the data chart. 10. Add one paper clip to the nose of the paper airplane. 11. Repeat steps 3 – 9 using one paper clip on the paper airplane’s nose. 12. Add two more paper clips to the nose of the plane. There should be a total of three paperclips on the airplane. 13. Repeat steps 3-9 using three paper clips on the plane. 14. Add two more paper clips to the nose of the plane. There should be a total of five paper clips on the airplane. 15. Repeat steps 3-9 using five paper clips on the plane.
PROCEDURES TEMPLATE
Safety Considerations:
In order to ensure safety for this experiment… _________________________________________________ _______________________________________________________________________________________ _______________________________________________________________________________________ _______________________________________________________________________________________ Materials: ____________________ ____________________ ____________________ ____________________ ____________________ Experimental setup: The experimental set up is…. _______________________________________________________________ _______________________________________________________________________________________ _______________________________________________________________________________________ _______________________________________________________________________________________ _______________________________________________________________________________________ _______________________________________________________________________________________ _______________________________________________________________________________________ Measuring Variables The independent variable will be measured by __________________________________________________ _______________________________________________________________________________________ and the dependent variable will be measured by ________________________________________________ _______________________________________________________________________________________ Controlled Variables:
In order to control variables…_______________________________________________________________ _______________________________________________________________________________________ _______________________________________________________________________________________ _______________________________________________________________________________________
Procedures: (Begin each procedure with a verb!) 1. 2. 3. 4. 5. 6. 7. 8. 9. 10. 11. 12. 13. 14. 15.

Prichard – 7/8
A Data Table How-To Guide Data Tables: This is what a data table should look like. It needs to be created in Microsoft Excel.
Title Goes Here DV (units)
Trial Number IV (units) 1 2 3 4 5 Average
Level 1 Level 2 Level 3
Step-by-Step Guide to making a Data Table: Pre-Computer
Step 1: Draw the rough draft of the data table by hand. Step 2: Determine the number of cells needed to make the data table
• Horizontal = 2 + the number of trials • Vertical = 4 + the number of IV levels
Computer Step 3: Open Microsoft Excel Step 4: Click on cell A1 and drag mouse until you have made a purple box the number
of cells you need both horizontally and vertically. Format Cells:
Step 5: Making sure that cells are purple, click on “Format” on top bar. Select “Cells” (or you can right click in the box and select “Format Cells”)
Step 6: Go to “Alignment”. • Make Horizontal and Vertical both “Center” AND click on “Wrap Text”
Step 7: Go to “Font” • Make size “12”, keep font style “Regular”, and pick the font you want
Step 8: Go to “Border” and pick “outline” and “inside” Step 9: Click “OK” Step 10: Now you are ready to begin typing in your data table!!

Prichard – 7/8
Merge Cells: In order to have some cells be longer without having any lines, you must “merge” the cells to make them be one big cell. If you look at the title bar of the data table, you will see it is one long cell without any lines. This is how to do that. Step 11: Click on cell A1 Step 12: Highlight the cells (drag the mouse) in the top row of your data table
Step 13: Find the button that is a white box with an “a” in the middle of it with two arrows. It looks a little like this:
a
It may be hidden off the tool bar. You can find it by clicking on the far right hand side of the bar where there are two arrows pointing right and one pointing down. After you find the button, click on it, it will merge the cells into one cell!
Step 14: Now type your title (remember to capitalize!) into cell A1 Step 15: Now you can merge the cells (B2 on) to make the DV cell and then the Trial
Number cell. You can also do this vertically and merge cell A2 through A4 to make the IV cell.
Helpful Tips and Suggestions: How to make cells bigger:
Step 1: Locate the cell you want larger. Keep in mind that this will make all cells in either that column or row get bigger.
Step 2: If you want it wider, put your cursor at the top of the data table in the gray area between the two letters you want wider. Your cursor will turn into a + letting you know that you are in the right place.
Step 3: Click and drag the mouse. This will resize the cells. Moving throughout Excel: Arrow keys: moves you from cell to cell Mouse: You can click on any cell you want to work with Tab: moves you from left to right one cell Enter/Return: Moves you down one cell Misc:
Spell Check: Highlight the area you want to spell check, otherwise, it only checks individual cells
A cell = one box in excel

I-TALK I = Information: All the information from your data table is in the graph. The correct type of graph is being used (bar vs. line graph). T= Title: The graph contains a title that describes what the graph is about. An experimental question works well for a title. A= Axis: The X, Y-axis are labeled and correctly numbered. The graph takes up as much of the paper as possible. L= Labels: Each axis is label with units K= Key: If more than one data set is in the graph, the key describes which line is which.

Data Analysis Directions
• Explain what your data tables and graphs show in paragraph format. • Use numbers and measurements in your explanations. • Determine the averages (mean) of the five trials for each change to the independent
variable. • How much did the results of the five trials vary? Give the range of the data. Calculate
the standard deviation. • Explain any trends (patterns) in the data. Explain how the independent variable
affected the dependent variable. Was there a positive or negative correlation or was there no relationship? Calculate the correlation coefficient.
• Do NOT use pronouns (I, we, he, she, they, etc.) Writing: The data tables and graphs show ____________________________________________
_____________________________________________________________________
_____________________________________________________________________
Explain the mean of five trials for each change in the independent variable.
__________________________________________________________________________
__________________________________________________________________________
__________________________________________________________________________
Explain how much the results of the five trials vary for each change in the independent
variable. State the range and standard deviation of the data. ________________________
__________________________________________________________________________
__________________________________________________________________________
__________________________________________________________________________
The data on the graph shows a (positive, negative, or no) correlation. A correlation
coefficient of ___________ was determined by _________________________________
_____________________________________________________________________
_____________________________________________________________________
____________________________________________________________________.
The hypothesis, (restate hypothesis), is (supported or refuted) by the data because (use the
data to support this) ______________________________________________________
_____________________________________________________________________
_____________________________________________________________________

Reliability and Validity Word Definition Your Definition Your Picture Reliability • Consistency
• Getting the same result, or close to the same result every time
Validity • Measuring what it says it measures
Word Example Reliability A junior high school student performs a science experiment to determine if boys and girls have
different tastes in music. The student surveyed three groups of 100 students by asking them to name their favorite music groups. Each group of 100 students she surveyed produced similar results. She found that 90% of the boys preferred rap and 80 – 85% of the girls preferred hip-hop in all 3 experiments.
Validity A high school art teacher wanted to find out how well her students could draw different geometric figures (shapes). She made a test that asked the students to draw 10 different shapes (circle, pentagon, triangle, etc) free hand. The teacher was pleased with the test because it did show her how well her students could draw shapes.
Fill in the blanks in the sentences below. Reliability is __________________________. If something is reliable, it should produce the _________ result over and over. Validity is ________________ what something says it _____________________.
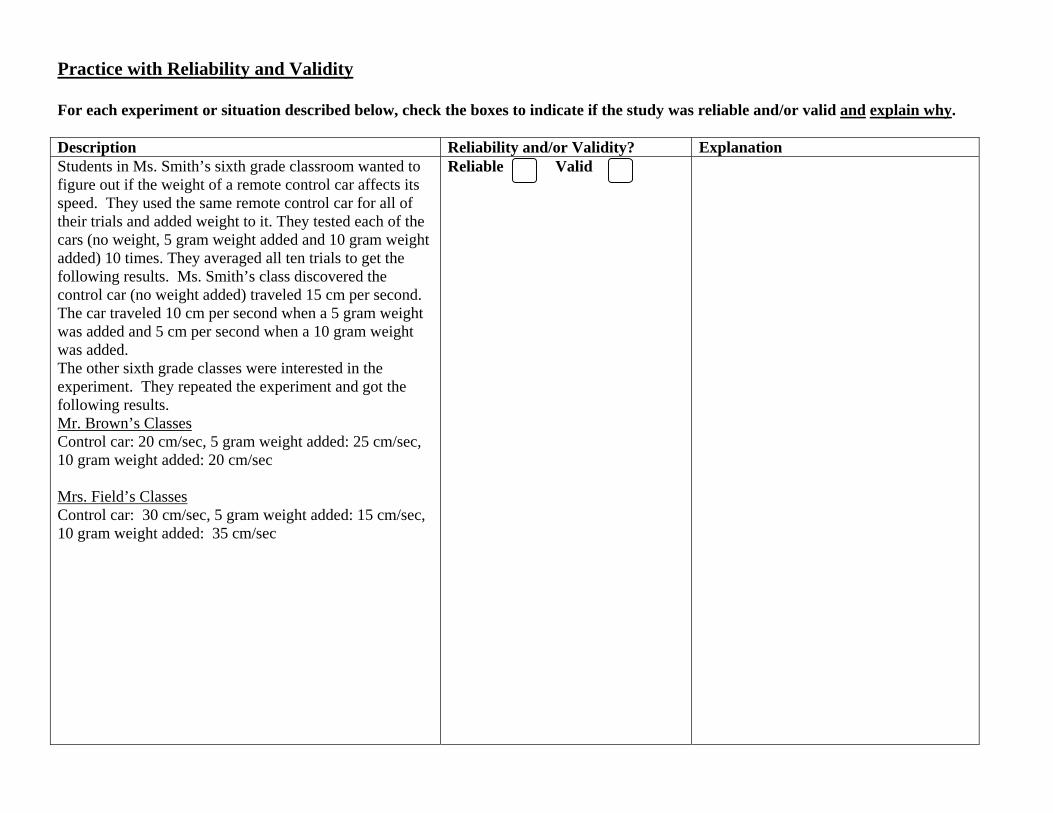
Practice with Reliability and Validity For each experiment or situation described below, check the boxes to indicate if the study was reliable and/or valid and explain why. Description Reliability and/or Validity? Explanation Students in Ms. Smith’s sixth grade classroom wanted to figure out if the weight of a remote control car affects its speed. They used the same remote control car for all of their trials and added weight to it. They tested each of the cars (no weight, 5 gram weight added and 10 gram weight added) 10 times. They averaged all ten trials to get the following results. Ms. Smith’s class discovered the control car (no weight added) traveled 15 cm per second. The car traveled 10 cm per second when a 5 gram weight was added and 5 cm per second when a 10 gram weight was added. The other sixth grade classes were interested in the experiment. They repeated the experiment and got the following results. Mr. Brown’s Classes Control car: 20 cm/sec, 5 gram weight added: 25 cm/sec, 10 gram weight added: 20 cm/sec Mrs. Field’s Classes Control car: 30 cm/sec, 5 gram weight added: 15 cm/sec, 10 gram weight added: 35 cm/sec
Reliable Valid

Many studies have been done to determine the affect of television watching on student grades. Recently, a high school student decided to conduct his own experiment to find out if students earn lower grades in math as their television viewing time increases. The high school student surveyed his fellow students to find out what their favorite television programs were. He also had them write their grades in math on the survey. His girlfriend conducted the same experiment on a different group of students. Each of them surveyed 100 high school students. Their results are shown below.
Boyfriend's Data
CSIMTVSurvivorSimpsons
Girlfriend's Data
CSIMTVSurvivorSimpsons
Reliable Valid
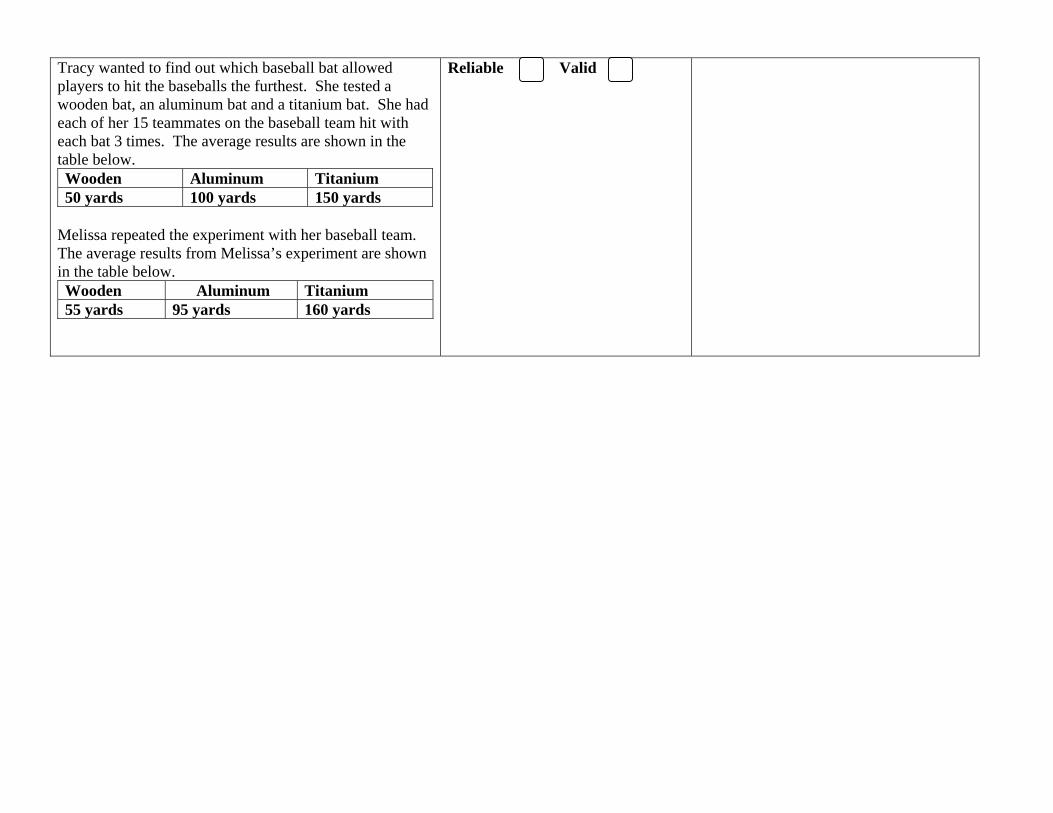
Tracy wanted to find out which baseball bat allowed players to hit the baseballs the furthest. She tested a wooden bat, an aluminum bat and a titanium bat. She had each of her 15 teammates on the baseball team hit with each bat 3 times. The average results are shown in the table below. Wooden Aluminum Titanium 50 yards 100 yards 150 yards
Melissa repeated the experiment with her baseball team. The average results from Melissa’s experiment are shown in the table below. Wooden Aluminum Titanium 55 yards 95 yards 160 yards
Reliable Valid
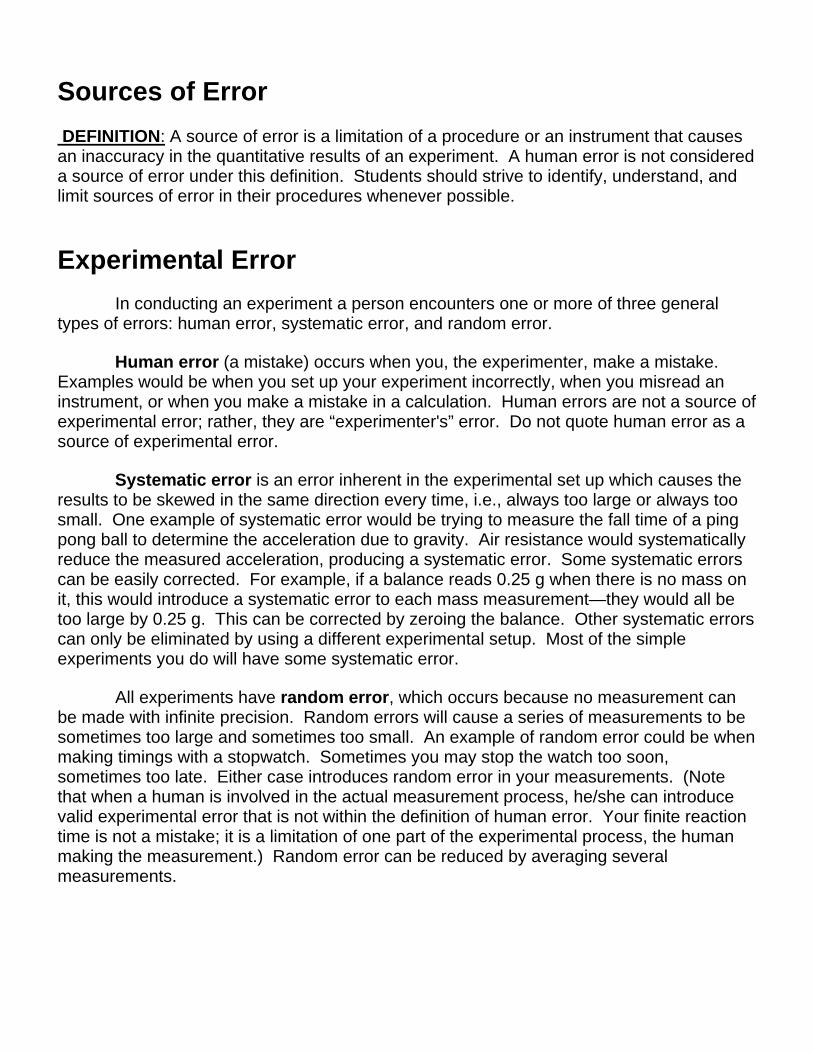
Sources of Error DEFINITION: A source of error is a limitation of a procedure or an instrument that causes an inaccuracy in the quantitative results of an experiment. A human error is not considered a source of error under this definition. Students should strive to identify, understand, and limit sources of error in their procedures whenever possible.
Experimental Error In conducting an experiment a person encounters one or more of three general types of errors: human error, systematic error, and random error.
Human error (a mistake) occurs when you, the experimenter, make a mistake. Examples would be when you set up your experiment incorrectly, when you misread an instrument, or when you make a mistake in a calculation. Human errors are not a source of experimental error; rather, they are “experimenter's” error. Do not quote human error as a source of experimental error.
Systematic error is an error inherent in the experimental set up which causes the results to be skewed in the same direction every time, i.e., always too large or always too small. One example of systematic error would be trying to measure the fall time of a ping pong ball to determine the acceleration due to gravity. Air resistance would systematically reduce the measured acceleration, producing a systematic error. Some systematic errors can be easily corrected. For example, if a balance reads 0.25 g when there is no mass on it, this would introduce a systematic error to each mass measurement—they would all be too large by 0.25 g. This can be corrected by zeroing the balance. Other systematic errors can only be eliminated by using a different experimental setup. Most of the simple experiments you do will have some systematic error.
All experiments have random error, which occurs because no measurement can be made with infinite precision. Random errors will cause a series of measurements to be sometimes too large and sometimes too small. An example of random error could be when making timings with a stopwatch. Sometimes you may stop the watch too soon, sometimes too late. Either case introduces random error in your measurements. (Note that when a human is involved in the actual measurement process, he/she can introduce valid experimental error that is not within the definition of human error. Your finite reaction time is not a mistake; it is a limitation of one part of the experimental process, the human making the measurement.) Random error can be reduced by averaging several measurements.

Science
Name: ___________________________ Period:______ Date: _________________
Discussion of Results Directions: This worksheet will help you write a ROUGH DRAFT of your Discussion of Results. You will need to rewrite the Discussion of Results on your own paper.
The discussion of results is where you explain what the results of your experiment mean. It explains what happened, what that means in relation to your hypothesis, and also explains why the results occurred. The Discussion of Results is 4 OR MORE paragraphs long. Follow the nstructions below. i
Writing: 1st paragraph:
• Restate the problem • Restate the hypothesis • Explain what your data should look like if the hypothesis is correct
The problem being studied in this experiment was ______________________________
__________________________________________________________________.
It was proposed that if (hypothesis) _________________________________________
___________________________________________________________________
If the hypothesis is correct, the results SHOULD (say what the results should look like)
___________________________________________________________________
___________________________________________________________________
___________________________________________________________________.
2nd paragraph: • Explain the data that you collected, including listing the mean (average). • Explain why the results occurred. • Compare the results to research and similar experiments you have read about or
experienced. • Explain if your experiment is reliable. Include the results of calculating correlation
coefficients and standard deviations. • Explain if your experiment is valid.
The data in this experiment ACTUALLY showed that____________________________
___________________________________________________________________
___________________________________________________________________
__________________________________________________________________.
Science
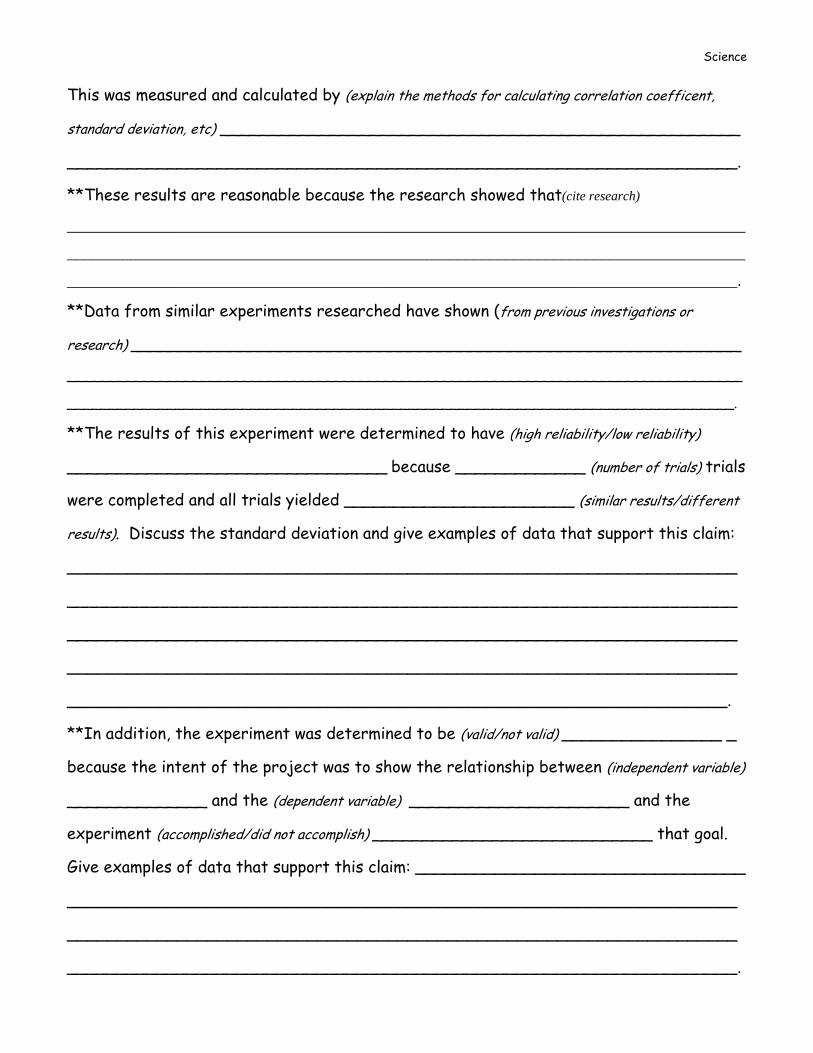
This was measured and calculated by (explain the methods for calculating correlation coefficent,
standard deviation, etc) ____________________________________________________
___________________________________________________________________.
**These results are reasonable because the research showed that(cite research)
_____________________________________________________________________________________
_____________________________________________________________________________________
____________________________________________________________________________________.
**Data from similar experiments researched have shown (from previous investigations or
research) _____________________________________________________________
_________________________________________________________________________________
________________________________________________________________________________.
**The results of this experiment were determined to have (high reliability/low reliability)
________________________________ because _____________ (number of trials) trials
were completed and all trials yielded _______________________ (similar results/different
results). Discuss the standard deviation and give examples of data that support this claim:
___________________________________________________________________
___________________________________________________________________
___________________________________________________________________
___________________________________________________________________
__________________________________________________________________.
**In addition, the experiment was determined to be (valid/not valid) ________________ _
because the intent of the project was to show the relationship between (independent variable)
______________ and the (dependent variable) ______________________ and the
experiment (accomplished/did not accomplish) ____________________________ that goal.
Give examples of data that support this claim: _________________________________
___________________________________________________________________
___________________________________________________________________
___________________________________________________________________.

Science
3rd Paragraph: • Summarize and evaluate your experimental procedure, making comments about its
success and effectiveness. • State at least sources of error in the experiment • Identify sources of error as human error, experimental error, or random error
Although the experiment was controlled, there were still some possible sources of error. Sources of error in this experiment include (What could have changed your data? What variables were not controlled or could not be controlled? Was your experimental setup successful and effective? Why or why not?) ___________________________________________________________________
___________________________________________________________________
___________________________________________________________________
___________________________________________________________________
_________________________________________________________________________________
___________________________________________________________________
___________________________________________________________________
___________________________________________________________________
___________________________________________________________________
4th Paragraph: • Explain how you could avoid these errors in the future. • Suggest changes in the experimental procedure
These errors could be avoided in the future by (How can you improve your procedure so that you don’t make the same mistakes and/or how could you better control your variables?) ___________________________________________________________________
___________________________________________________________________
___________________________________________________________________
___________________________________________________________________
___________________________________________________________________
___________________________________________________________________
___________________________________________________________________
___________________________________________________________________
___________________________________________________________________

Science
Name: ___________________________ Period:______ Date: _________________
Conclusion
Directions: This worksheet will help you write a ROUGH DRAFT of your conclusion. You will need to rewrite the conclusion on your own paper. The conclusion should be 3 OR MORE paragraphs in length. Follow the instructions below.
Writing:
1st Paragraph: • Restate the purpose of the experiment • Restate the hypothesis • State whether the hypothesis was supported (meaning it was “right”) or refuted
(meaning it wasn’t “right”) and why it was supported or refuted. USE THE DATA. • If the hypothesis was refuted, then write a new, refined, hypothesis to match the
data that was collected.
This experiment was done to determine the effect of (Independent Variable) on
(Dependent Variable).
The hypothesis stated that if____________________________________________,
then, ______________________________________________________________,
because _____________________________________________________________.
The hypothesis was (supported or refuted). ____________________________________.
The hypothesis was (supported or refuted) because (Add scientific reasons why it was
supported or refuted. What does the data show?) ________________________________
___________________________________________________________________
____________________________________________________________________________________
____________________________________________________________________________________
***If the hypothesis was refuted you are going to create a new (refined)
hypothesis that matches the data collected in the experiment.***
The refined hypothesis for this experiment states that if________________________,
then _______________________________________________________________,
because_____________________________________________________________.

Science
2nd Paragraph: • Explain what you learned from the experiment • Explain WHY this information is important and HOW can it be applied in everyday
life Throughout the course of this project I have learned___________________________________
___________________________________________________________________________________
___________________________________________________________________________________
This information important because (explain how it can be applied in everyday life)______
___________________________________________________________________
___________________________________________________________________
___________________________________________________________________
3rd Paragraph:
• Explain and describe new questions you are left with. • Explain and describe FUTURE RESEARCH or EXPERIMENTS could be done on
this topic? • Suggest changes in the experimental procedure (or design) and/or possibilities
for further study
Other questions I have based on this investigation are __________________________
___________________________________________________________________
___________________________________________________________________
___________________________________________________________________
Future research that could be done on this topic includes ________________________
___________________________________________________________________
___________________________________________________________________
___________________________________________________________________
Describe a future experiment that could be done on this topic. ___________________
___________________________________________________________________
___________________________________________________________________
___________________________________________________________________
___________________________________________________________________

Writing an Abstract
The purpose of this project was to discover/find out how _____________________ (IV)
affected ___________________ (DV). The hypothesis was that if ___________________________
(IV) is related to _______________________ (DV) and __________________________ (IV) is
(changed/increased/decreased), then __________________ (DV) will (change/increase/decrease).
This would happen because __________________________________________________________
________________________________________________________________________________
_____________________________________________(scientific reason why).
The effect of (IV) _________ on (DV) ______ was determined by (write summary of procedure
in past tense) ____________________________________________________________________
________________________________________________________________________________
________________________________________________________________________________
________________________________________________________________________________.
The results collected during this investigation were; (Say what the mean results were for each
trial. Start with largest/fastest, etc.)_____________________________________________________
________________________________________________________________________________
________________________________________________________________________________
_______________________________ . The results showed that the hypothesis, (restate hypothesis)
________________________________________________________________________________
______________________________________________________ was (supported/refuted). This
happened because _________________________________________________________________
________________________________________________________________________________
____________________________________________ (Scientific reason why).
To further understanding of this topic, future research could include _____________________
________________________________________________________________________________
________________________________________________________________________________
________________________________________________________ (list 3 other questions you
would investigate in future experiments to find out more about your topic.)

Parts Of A Successful Science Fair Project Remember – NO PRONOUNS (I, we, me us…), NO CONTRACTIONS (don’t, isn’t, won’t…)
1. Project Data Notebook. This is your Log and Proof that you have worked on your project. You must write down EVERYTHING you did and learned in this book, EVERY DAY. A project data book is your most treasured piece of work. Accurate and detailed notes make a logical and winning project. Good notes show consistency and thoroughness to the judges and will help you when writing your research paper. Data tables are also helpful. They may be a little ‘messy’ but be sure the quantitative data recorded is accurate and that units are included in the data tables. Make sure you date each entry.
2. The Report and Visual Display. Your report and visual display need the following
sections:
a. Title Page – the title in the center of the page. Your name, school address and grade at the bottom right hand corner. (School address: 401 South McQueen Road Chandler, AZ 85225)
b. Abstract c. Problem/Experimental Question d. Hypothesis e. Prior Research f. Variables g. Experiment – Materials and Procedures h. Results – Data Tables
Results – Graphs Results – Data Analysis with Range, Mean, Standard Deviation, and Correlation Coefficient
i. Discussion of Results – with Reliability and Validity and Sources of Error. j. Conclusion – with Future Research k. Acknowledgements – Who do you want to thank for helping you with this
project and why? l. Bibliography – List all sources of information in MLA format – Books,
Journals, Articles, Websites etc. m. Appendix – All additional material that supports your lab.
3. Section Labels: You need to create a label for each section above (except “Title of Project”). Must be easy to read, no smaller than 48, no larger than 72. All section labels should be same size.

Display Board Guidelines It is important for scientists to communicate the findings of their research. One of the ways this is done is on a display board like the one you will create for your experiment. You may type up the following sections in Microsoft Word, PowerPoint, or Publisher. Your display board must include the following: o Label (provided by teacher) with Name, Period, and Title of Project. This goes on the back of your display board o Title (You can use your experimental question or make it creative!!) o Experimental Question o Hypothesis o Prior Research o Abstract o Variables o Experimental Design – Materials, Procedures, Safety o Data Table o Graphs o Data Analysis o Discussion of results o Conclusions o Bibliography/Works Cited o Pictures? (no student faces)
The most important objective for your board is to effectively communicate the facts about your project. The display board can only achieve that objective if it's easy to read. Here are some suggestions for fonts and font size.
• Stick with traditional fonts like Arial or Times New Roman, or similar typefaces. • Use italics or bold for emphasis, not for all your text. • USING ALL CAPS MAKES WRITING MUCH HARDER TO READ. Please use upper and lower case letters (called “sentence case” in MS Word) • Don't use reverse type (white text on a dark background). It is hard to read. Use black characters on a white (or pastel) background. • Artistic Fonts are also very difficult to read.. • Use no more than two or three different fonts on your board. Times New Roman for body copy and Arial for headings makes for a nice combination.
Text Size Suggestions for a Typical Science Project Display Board
1) Project Title 150+ You want your title to be visible from across a room! 2) Headings 32+ Should be easily readable from five feet away by someone just walking by.
• Experimental Question • Hypothesis • Prior Research • Abstract • Variables • Experimental Design – Materials, Procedures, Safety • Data Table • Graphs • Data analysis • Discussion of results • Conclusions • Bibliography/Works Cited
3) Main Text 12 – 14 This is a comfortable text size for someone who comes closer to read more.
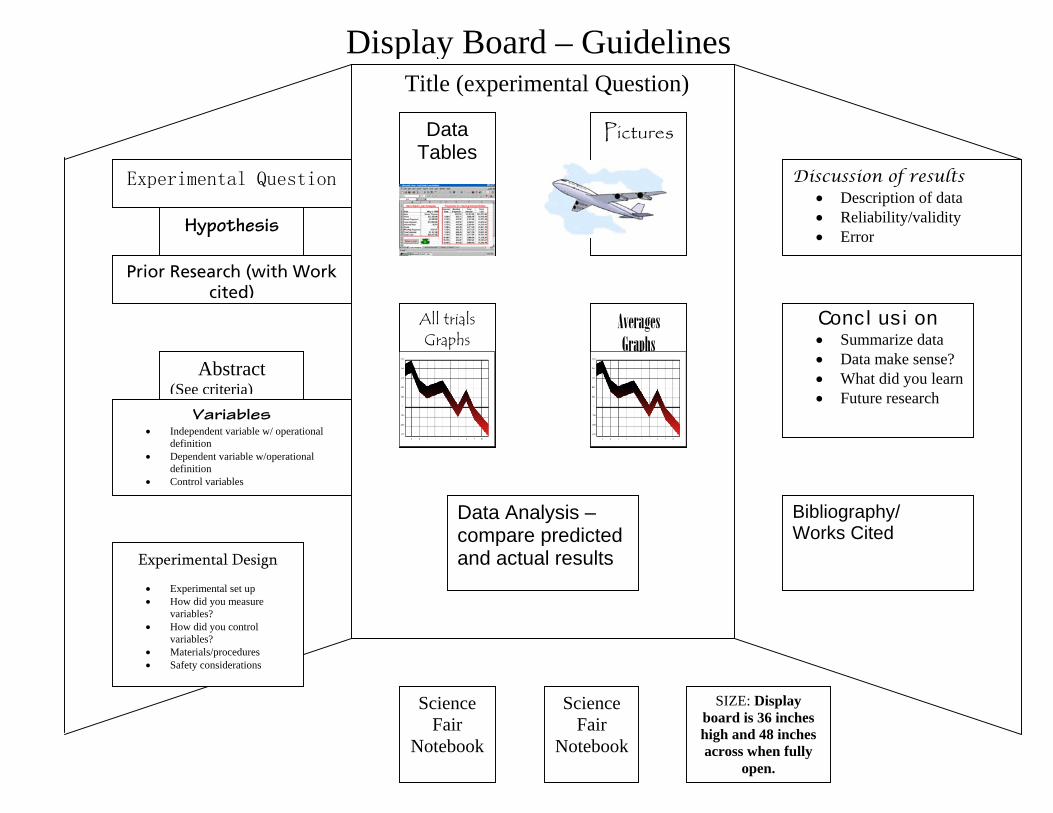
Display Board – GuidelinesTitle (experimental Question)
Data Tables
Pictures
Discussion of results • Description of data • Reliability/validity • Error
Experimental Question
Hypothesis
Prior Research (with Work cited)
All trials Graphs
Conclusion • Summarize data • Data make sense? • What did you learn• Future research
Averages Graphs
Abstract (See criteria)
Variables • Independent variable w/ operational
definition • Dependent variable w/operational
definition • Control variables
Data Analysis – compare predicted and actual results
Bibliography/ Works Cited
Experimental Design
• Experimental set up • How did you measure
variables? • How did you control
variables? • Materials/procedures • Safety considerations
Science Fair
Notebook
Science Fair
Notebook
SIZE: Display board is 36 inches high and 48 inches across when fully
open.


