NBER WORKING PAPER SERIES
SKILL VS. LUCK IN ENTREPRENEURSHIP AND VENTURE CAPITAL: EVIDENCE FROM SERIAL ENTREPRENEURS
Paul GompersAnna KovnerJosh Lerner
David Scharfstein
WORKING PAPER 12592http://www.nber.org/papers/w12592
NATIONAL BUREAU OF ECONOMIC RESEARCH1050 Massachusetts Avenue
Cambridge, MA 02138October 2006
Helpful comments were provided by Yael Hochberg, Steve Kaplan, Roni Michaely, Avri Ravid, andvarious seminar participants. We thank for Tim Dore for exceptional research assistance on thisproject. Harvard Business School's Division of Research and the National Science Foundationprovided financial assistance. All errors and omissions are our own. The views expressed herein arethose of the author(s) and do not necessarily reflect the views of the National Bureau of EconomicResearch.
© 2006 by Paul Gompers, Anna Kovner, Josh Lerner, and David Scharfstein. All rights reserved.Short sections of text, not to exceed two paragraphs, may be quoted without explicit permissionprovided that full credit, including © notice, is given to the source.

Skill vs. Luck in Entrepreneurship and Venture Capital: Evidence from Serial EntrepreneursPaul Gompers, Anna Kovner, Josh Lerner, and David ScharfsteinNBER Working Paper No. 12592October 2006JEL No. G24,L26
ABSTRACT
This paper argues that a large component of success in entrepreneurship and venture capital can beattributed to skill. We show that entrepreneurs with a track record of success are more likely tosucceed than first time entrepreneurs and those who have previously failed. Funding by moreexperienced venture capital firms enhances the chance of success, but only for entrepreneurs withouta successful track record. Similarly, more experienced venture capitalists are able to identify andinvest in first time entrepreneurs who are more likely to become serial entrepreneurs. Investmentsby venture capitalists in successful serial entrepreneurs generate higher returns for their venturecapital investors. This finding provides further support for the role of skill in both entrepreneurshipand venture capital.
Paul GompersGraduate School of BusinessHarvard University, Morgan 483Soldiers FieldBoston, MA 02163and [email protected]
Anna KovnerMorgan HallGraduate School of Business AdministrationHarvard UniversityBoston, MA [email protected]
Josh LernerHarvard Business SchoolMorgan Hall, Room 395Cambridge, MA 02163and [email protected]
David ScharfsteinHarvard Business SchoolBaker 239Soldiers FieldBoston, MA 02163and [email protected]

1. Introduction
What makes entrepreneurs successful? Is it skill or luck? Knight (1921, part III,
ch. IX, ¶ 10) argues that an important component of entrepreneurship is the willingness
of the “venturesome to ‘assume’ or ‘insure’ the doubtful and timid by guaranteeing to the
latter a specified income in return for an assignment of the actual results.” In this view,
luck is a big determinant of entrepreneurial success. According to Kihlstrom and Laffont
(1979), luck is the only determinant of entrepreneurial success: in their model
entrepreneurs are simply less risk averse individuals who are willing to guarantee
workers’ wages and bear residual risk. Schumpeter (1934, p. 137) argues just the
opposite, claiming that “the entrepreneur is never the risk bearer,” but rather an
innovator, one who discovers new production processes, finds new markets, creates new
types of organizations, or introduces new products. Entrepreneurial success, in this view,
flows from innovative skill. Only suppliers of capital bear risk.
In this paper, we empirically reject the Kihlstrom and Laffont hypothesis that
entrepreneurs are just efficient risk bearers in favor of the view, emphasized by
Schumpeter, that skill is an important component of entrepreneurship. At the same time,
we present evidence that suppliers of capital are not just efficient risk bearers in the
entrepreneurial process, as Schumpeter suggests, but rather bring their own set of
capabilities to identifying skilled entrepreneurs and helping them build their businesses.
Our approach to identifying skill in entrepreneurship is to examine the
performance of venture-capital backed serial entrepreneurs. We try to answer the
following simple question: Are successful entrepreneurs more likely to succeed in their
next ventures than first-time entrepreneurs and entrepreneurs who previously failed? Our
2
answer is yes. Our empirical model indicates that entrepreneurs who succeeded in a
prior venture (i.e., started a company that went public) have a 30% chance of succeeding
in their next venture. By contrast, first-time entrepreneurs have only an 18% chance of
succeeding and entrepreneurs who previously failed have a 20% chance of succeeding.
This performance persistence suggests that a component of success in entrepreneurship is
attributable to skill. While it may be better to be lucky than smart, the evidence
presented here indicates that being smart has value too.
We also find evidence in support of the entrepreneurial skill hypothesis by
examining the behavior and performance of venture capital firms. As has been shown by
Sorensen (2004), Kaplan and Schoar (2005), Gompers, Kovner, Lerner and Scharfstein
(2006), and Hochberg, Ljungqvist, and Lu (2006), companies that are funded by more
experienced (top-tier) venture capital firms are more likely to succeed. This could be
because top-tier venture capital firms are better able to identify high quality companies
and entrepreneurs. Alternatively, this performance differential could be because top-tier
venture capital firms add more value – e.g., by helping new ventures make customer
contacts, fill key management positions, or set business strategy. However, we find that
there is only a performance differential when venture capital firms invest in companies
started by first-time entrepreneurs or those who previously failed. If a company is started
by an entrepreneur with a track record of success, then the company is no more likely to
succeed if it is funded by a top-tier venture capital firm or one in the lower tier. Thus, it
seems, prior success is a public signal of quality. It also implies that previously
successful entrepreneurs derive no benefits from the value-added services of more

3
experienced venture capital firms; successful entrepreneurs apparently know what they’re
doing.
Another piece of evidence in support of the entrepreneurial skill hypothesis is that
when previously successful entrepreneurs raise funding for their next venture, they are
able to do so when the company is younger and at an earlier stage of development.
Presumably, this is the case because venture capital firms perceive a successful track
record as evidence of skill, not just luck.
Taken together, these findings also support the view that suppliers of capital are
not just efficient risk-bearers, but rather help to put capital in the right hands and ensure
that it is used effectively. The evidence for this goes beyond the finding–documented
here and by others–that more experienced venture capital firms have higher success rates
on their investments. More experienced venture capital firms only have higher success
rates when they invest in unproven entrepreneurs, a fact which highlights the role
suppliers of venture capital play in identifying skilled entrepreneurs and helping them to
succeed.
Finally, we study the value consequences of serial entrepreneurship. We start by
examining the pre-money valuations of new ventures. More experienced venture capital
firms invest at higher valuations, which is consistent with our finding that they also
invest in firms with higher success rates. However, we do not find that serial
entrepreneurs (whether successful or not) are able to benefit from their higher success
rates by selling equity at higher prices. Given this fact, it should come as no surprise that
the average investment multiple (exit valuation divided by pre-money valuation) is
higher for companies of previously successful serial entrepreneurs. We also find that

4
fund returns are higher for venture capital firms that tend to invest a larger share of their
portfolio in serial entrepreneurs. Our findings are consistent with there being an
imperfectly competitive venture capital market in which prices do not get bid up to the
point where excess returns from investing in serial entrepreneurs are eliminated.
Our findings are related to a number of other studies in the entrepreneurship
literature. Several study the effect of experience on performance. Consistent with our
findings, Eesley and Roberts (2006a) use data from a survey of alumni from the
Massachusetts Institute of Technology to show that entrepreneurial experience increases
the likelihood of success (as measured by firm revenues). Our finding that serial
entrepreneurs are more likely to succeed is also consistent with the observations of
Kaplan and Stromberg (2003), who study the contractual terms of venture capital
financings. They find that serial entrepreneurs receive more favorable control provisions
than first time entrepreneurs, including more favorable board control, vesting, liquidation
rights, and more up-front capital. Presumably this is because their higher success rates
make it less important for venture capitalists to protect themselves with tighter control
provisions.
Chatterji (2005) shows that industry experience also increases the likelihood of
success. In the medical device industry, startups founded by former employees of other
medical device companies perform better than other startups. The value of industry
experience is also emphasized by Bhide (2000), who shows that a substantial fraction of
the Inc. 500 got their ideas for their new company while working for their prior
employer. Kaplan, Sensoy, and Stromberg (2006) emphasize the importance of
management in the success of entrepreneurial firms. Carroll and Mosakowski (1987),

5
Honig and Davidson (2000) and Reuber, Dyke and Fischer (1990) are other related
works.
Finally, a number of papers have examined the characteristics of serial
entrepreneurs. Eesley and Roberts (2006b) find that entrepreneurs are more likely to start
another venture if they started their first venture when they were younger, were not
married, and funding their first company with venture capital. Bengtsson (2005, 2006)
finds that failed serial entrepreneurs are more likely than successful serial entrepreneurs
to get funding from the same venture capital firm that financed their first ventures.
Consistent with our finding on the role of venture capitalists, he argues that these initial
venture capitalists are better able to judge whether the venture failed because of bad luck
or the limitations of the entrepreneur.
The rest of the paper is organized as follows. Section 2 describes the construction
of the data set and summarizes the data. Our main findings are presented in Section 3.
We conclude in Section 4.
2. Data
The core data for the analysis come from Dow Jones’ Venture Source (previously
named Venture One), described in more detail in Gompers, Lerner, and Scharfstein
(2005). Venture Source, established in 1987, collects data on firms that have obtained
venture capital financing. Firms that have received early-stage financing exclusively from
individual investors, federally chartered Small Business Investment Companies, and
corporate development groups are not included in the database. The companies are initially
identified from a wide variety of sources, including trade publications, company Web pages,

6
and telephone contacts with venture investors. Venture Source then collects information
about the businesses through interviews with venture capitalists and entrepreneurs. The data
collected include the identity of the key founders (the crucial information used here) as well
as the industry, strategy, employment, financial history, and revenues of the company. Data
on the firms are updated and validated through monthly contacts with investors and
companies.
When considering and controlling for the role of the venture capital investor, we
consider only observations in which the venture capital firm serves on the board of the
company. We do not consider the influence of other venture investors who do not serve
on the board of directors. Our analysis focuses on data covering investments from 1975
to 2000, dropping information prior to 1975 due to data quality concerns.1 In keeping
with industry estimates of a maturation period of three to five years for venture capital
financed companies, we drop companies receiving their first venture capital investment
after 2000 so that the outcome data can be meaningfully interpreted. Results were
qualitatively similar when we ran the analyses looking only at data through 1998 in order to
be conservative about exit periods.
For the purposes of this analysis, we examine the founders (henceforth referred to as
“entrepreneurs”) that joined firms listed in the Venture Source database during the period
from 1986 to 2000. Typically, the database reports the previous affiliation and title (at the
previous employer) of these entrepreneurs, as well as the date they joined the firm. In some
cases, however, Venture Source did not collect this information. In these cases, we attempt
to find this information by examining contemporaneous news stories in LEXIS-NEXIS,
1Gompers and Lerner (2004) discuss the coverage and selection issues in Venture Economics and Venture Source data prior to 1975.

7
securities filings, and web sites of surviving firms. We believe this data collection
procedure may introduce a bias in favor of having more information on successful firms, but
it is not apparent to us that it affects our analysis.
We identify serial entrepreneurs through their inclusion as founders in more than
one company in our data set. As a result, we may fail to identify serial entrepreneurs who
had previously started companies that were not venture capital financed. Thus, our study is
only about serial entrepreneurship in venture capital-financed firms, not about serial
entrepreneurship in general. To the extent that prior experience in non-venture-backed
companies is important, we will be understating the effect of entrepreneurial experience.
Table 1 reports the number and fraction of serial entrepreneurs in our sample in each
year. Several patterns are worth highlighting. First, the number of entrepreneurs in the
sample increased slowly from 1984 through 1994. Afterwards, as the Internet and
technology boom took off in the mid-1990s, the number of entrepreneurs grew very rapidly.
Second, with the general growth of the industry through this period, serial entrepreneurs
accounted for an increasing fraction of the sample, growing from about 7% in 1986 to a
peak of 13-14% in 1994. There was some decrease in the fraction of serial entrepreneurs
after 1994, probably because of the influx of first-time entrepreneurs as part of the Internet
boom. The absolute number of serial entrepreneurs actually peaked in 1999.
Table 2 documents the distribution of serial entrepreneurs across industries based
on the nine industry groupings used in Gompers, Kovner, Lerner, and Scharfstein (2006).
The data show a clear concentration of entrepreneurs in the three sectors that are most
closely associated with the venture capital industry: Internet and computers;
communications and electronics; and biotech and healthcare. These are also the three

8
industries with the highest representation of serial entrepreneurs. The other industries, such
as financial services and consumer, are smaller and have a lower percentage of serial
entrepreneurs.
Table 3 lists the 50 most active venture capital firms in our sample and ranks
them according to both the number of serial entrepreneurs they have funded and the
fraction of serial entrepreneurs in their portfolios. Given that many successful venture
capital firms have an explicit strategy of funding serial entrepreneurs, it is not surprising
that these firms have higher rates of serial entrepreneurship than the sample average. This
tabulation suggests that the biggest and most experienced venture capital firms are more
successful in recruiting serial entrepreneurs. Nevertheless, there does appear to be quite
a bit of heterogeneity among these firms in their funding of serial entrepreneurs. Some of
the variation may stem from the industry composition of their portfolios, the length of
time that the groups have been active investors, and the importance they place on funding
serial entrepreneurs. In any case, the reliance on serial entrepreneurs of the largest, most
experienced, and most successful venture capital firms indicates that we will need to
control for venture capital firm characteristics in trying to identify an independent effect
of serial entrepreneurship.
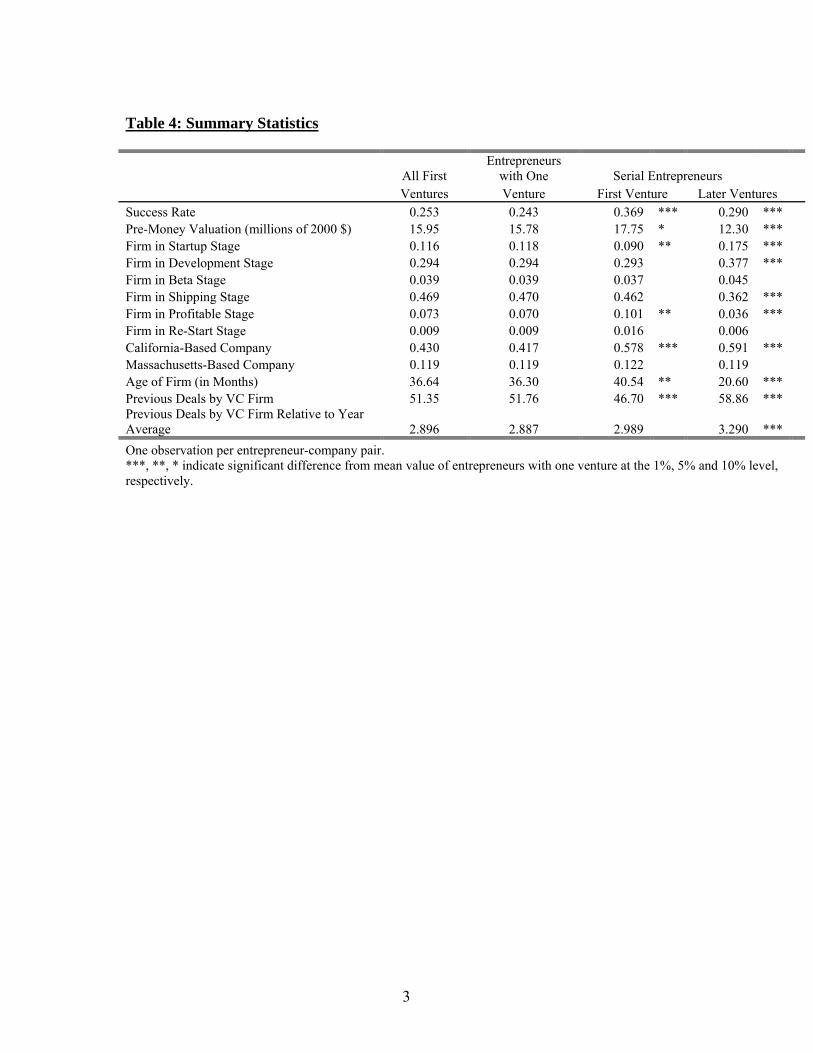
Table 4 provides summary statistics for the data we use in our regression analysis.
We present data for (1) all entrepreneurs in their first ventures; (2) entrepreneurs who have
started only one venture; (3) serial entrepreneurs in their first venture; and (4) serial
entrepreneurs in their later ventures.
The first variable we look at is the success rate within these subgroups of
entrepreneurs. We define “success” as going public or filing to go public by December

9
2003. The findings are similar if we define success to also include firms that were acquired
or merged. The overall success rate on first time ventures is 25.3%. Not surprisingly, serial
entrepreneurs have an above-average success rate of 36.9% on their first ventures: venture
capitalists are more likely to be more enthusiastic about financing a successful entrepreneur
than one who has previously failed. It is more interesting that in their subsequent ventures
they have a significantly higher success rate (29.0%) than do first time entrepreneurs
(25.3%).
Serial entrepreneurs have higher success rates, even though on average they receive
venture capital funding at an earlier stage in their company's development. While 45% of
first-time ventures receive first-round funding at an early stage (meaning they are classified
as “startup,” “developing product,” or “beta testing,” and not yet “profitable” or “shipping
product”), close to 60% of entrepreneurs receive first-round funding at an early stage when
it is their second or later venture. The later ventures of serial entrepreneurs also receive
first-round funding when the ventures are younger–21 months as compared to 37 months for
first time entrepreneurs. This earlier funding stage is also reflected in lower first-round pre-
money valuations for serial entrepreneurs–$12.3 million as compared to $16.0 million for
first-time entrepreneurs.
Controlling for year, serial entrepreneurs appear to be funded by more experienced
venture capital firms, both in their first and subsequent ventures.2 The last row of Table 4
reports the ratio of the number of prior investments made by the venture capital firm to the
average number of prior investments made by other venture capital firms in the year of the
investment. This ratio is consistently greater than one because more experienced (and likely
2 Throughout the paper, we use venture capital experience as a proxy for ability. Recently, other measures of ability have been utilized including centrality of the venture capitalists in the overall venture capital network (Hochberg, Ljungqvist, and Lu, 2006; Sorenson and Stuart, 2001).

10
larger) venture capital firms do more deals. The table indicates that venture capital firms
that invest in serial entrepreneurs, whether in their first or subsequent ventures, have nearly
three times the average experience of the average firm investing in the same year. This is
about 14% greater than the year-adjusted experience of venture capital firms that invest in
one-time-only entrepreneurs.3 Given the evidence that more experienced venture capital
firms have higher success rates (e.g., Gompers, Kovner, Lerner and Scharfstein, 2006) it
will be important for us to control for venture capital experience in our regression, as well as
other factors such as company location, which has also been linked to outcomes.
3. Findings
A. Success
In this section we take a regression approach to exploring the impact of serial
entrepreneurs on the success of the companies they start. In the first set of regressions,
the unit of analysis is the entrepreneur at the time that the database first records the firm’s
venture capital funding. Our basic approach is to estimate logistic regressions where the
outcome is whether the firm “succeeds,” i.e. goes public or registers to go public by
December 2003. Our results are qualitatively similar if we also include an acquisition as
a successful outcome.
A main variable of interest in the initial regressions is a dummy variable, LATER
VENTURE, which takes the value one if the entrepreneur had previously been a founder
of a venture capital backed company. We are also interested in whether the entrepreneur
3Note that venture capital firms that invest in the first ventures of serial entrepreneurs have done fewer deals on an absolute basis. This is because these first deals are early in the sample period.

11
had succeeded in his prior venture, and thus construct a dummy variable, PRIOR
SUCCESS, to take account of this possibility.
There are a number of controls that must be included in the regression as well.
As noted above, we control for venture capitalists’ experience. The simplest measure of
experience would be the number of prior companies in which the venture capital firm
invested. We take a log transformation of this number to reflect the idea that an
additional investment made by a firm that has done relatively few deals is more
meaningful than an additional investment by a firm that has done many. However,
because of the growth and maturation of the venture capital industry, there would be a
time trend in this measure of experience. This is not necessarily a problem: investors in
the latter part of the sample do have more experience. Nevertheless, we use a more
conservative measure of experience, which adjusts for the average level of experience of
other venture capital firms in the relevant year. Thus, our measure of experience for a
venture capital investor is the log of one plus the number of prior companies in which the
venture capital firm has invested minus the log of one plus the average number of prior
investments undertaken by venture capital firms in the year of the investment. Because
there are often multiple venture capital firms investing in a firm in the first round, we
take experience of the most experienced investor who serves on the board of directors of
the firms after the first venture financing round of the company, which we label VC
EXPERIENCE.4
4We have replicated the analysis using the average experience of investors from the earliest round and employing an entrepreneur-company-VC firm level analysis where each investor from the earliest round was a separate observation. In both cases, the results were qualitatively similar. We do not use the experience of venture capitalists who do not join the firm’s board, since it is standard practice for venture investors with significant equity stakes or involvement with the firm to join the board.

12
The regressions also include dummy variables for the round of the investment.
Although we include each company only once (when the company shows up in the
database for the first time), about 26% of the observations begin with rounds later than
the first round. (In these instances, the firm raised an initial financing round from another
investor, such as an individual angel.) All of the results are robust to including only
companies where the first observation in the database is the first investment round. We
also include dummy variables for the company’s stage of development and the logarithm
of company age in months. Because success has been tied to location, we include a
dummy variable for whether the firm was headquartered in California and one for
whether it was headquartered in Massachusetts. We also include year and industry fixed
effects. Finally, because there is often more than one entrepreneur per company, there
will be multiple observations per company. Thus, robust standard errors of the
coefficient estimates are calculated after clustering by company. In later regressions, the
unit of analysis will be the company.
The first column of Table 5 reports one of the central findings of the paper. The
coefficient of LATER VENTURE is positive and statistically significant. At the means of
the other variables, entrepreneurs in their second or later ventures have a predicted
success rate of 25.0%, while first-time entrepreneurs have a predicted success rate of
20.8%.
There are a number of hypotheses as to why the success rate of entrepreneurs in
their second or later ventures is higher than the success rate of first-time entrepreneurs.
One hypothesis is that there is learning-by-doing in entrepreneurship. The experience of
starting a new venture–successful or not–confers on entrepreneurs some benefits (skills,

13
contacts, ideas) that are useful in subsequent ventures. (Such a hypothesis is consistent
with Lazear’s (2005) finding that Stanford MBAs who ultimately become entrepreneurs
follow more varied career paths than their classmates.) In this view, entrepreneurs can
learn to succeed through the experience of having started a company regardless of what
its ultimate performance is. Alternatively, the higher average success rate of
entrepreneurs in subsequent ventures could reflect a deeper pool of talented and hard-
working entrepreneurs. We use the outcome of serial entrepreneurs' prior ventures to
distinguish between these hypotheses.
To determine whether a pure learning-by-doing effect exists, in the second
column of Table 5 we add the dummy variable, PRIOR SUCCESS, which equals 1 if the
prior venture of the serial entrepreneur was successful. The estimated coefficient of this
variable is positive and statistically significant. Including it also lowers the coefficient of
the LATER VENTURE dummy so that it is no longer statistically significant. The
predicted success rate of entrepreneurs with a track record of success is 30.6%, compared
to only 22.1% for serial entrepreneurs who failed in their prior venture, and 20.9% for
first-time entrepreneurs. This finding indicates that it is not experience per se that
improves the odds of success for serial entrepreneurs. Instead, it suggests the importance
of entrepreneurial skill in determining performance.
The unit of analysis for the first two columns of Table 5 is the entrepreneur-
company level. We also repeat the analysis using only one observation per company,
accounting for any potential concerns about the independence of observations. The third
column of Table 5 reports the results of a regression in which the unit of analysis is the
company, not the entrepreneur-company. The key variables are 1) a dummy for whether

14
any of the founders is in their second or later ventures and 2) a dummy for whether any
of the founders was successful in a prior venture. Here too a track record of prior success
has a bigger effect on future success than does prior experience per se. Companies with a
previously successful entrepreneur have a predicted success rate of 26.7%, whereas those
with entrepreneurs who failed in prior ventures have an 17.9% success rate, and
companies with first-time entrepreneurs have a 14.1% chance of success. The effect of
prior success on predicting future success is very large.
The regressions also indicate that venture capital firm experience is positively
related to success. Using estimates from the third column of Table 5, at the 75th
percentile of VC EXPERIENCE and at the means of all the other variables, the predicted
success rate is 19.0%, while at the 25th percentile, the predicted success rate is only
13.3%. There are a number of reasons why more experienced venture capital firms may
make more successful investments.
To consider the importance of the VC firm in determining portfolio company
success, we do a similar analysis on two levels. In specification 4 of Table 5, we look at
the data on an entrepreneur-company-VC firm level. This allows us to fully consider
variation in entrepreneur and VC firm characteristics. To account for concerns about the
independence of observations, specification 5 is at the company-VC firm level.
In these specifications, we are using VC EXPERIENCE as an imperfect proxy for
the quality of a venture capital firm. If successful entrepreneurs are more likely to get
funded by better venture capital firms, we could be getting a positive coefficient of
PRIOR SUCCESS because it is a proxy for the unobservable components of venture
capital firm quality that is not captured by VC EXPERIENCE. Thus, to control for

15
unobservable characteristics, we estimate the model with venture capital firm fixed
effects. This enables us to estimate how well a given venture capital firm does on its
investments in serial entrepreneurs relative to its other investments in first-time
entrepreneurs. Results in the fourth and fifth columns of Table 5 indicate that with
venture capital firm fixed effects, the differential between first time entrepreneurs and
successful serial entrepreneurs is even larger. The fifth column, which estimates the
effects at the company level, generates a predicted success rate for first-time
entrepreneurs of 17.7%. The predicted success rate for failed serial entrepreneurs in later
ventures is 19.8%, and it is 29.6% for entrepreneurs with successful track records.
Financing from experienced venture capital firms has a large effect on the
probability that an entrepreneur succeeds for one of several reasons: because these firms
are better able to screen for high quality entrepreneurs, because they are better monitors
of entrepreneurs, or because they simply have access to the best deals. But, if an
entrepreneur already has a demonstrable track record of success, does a more
experienced venture capital firm still enhance performance? To answer this question, we
add to the basic specification in column 2 and 3 of Table 5 an interaction term between
VC EXPERIENCE and PRIOR SUCCESS, as well an interaction term between VC
EXPERIENCE and LATER VENTURE.
The results are reported in columns 6 and 7 of the table. The coefficient of VC
EXPERIENCE×PRIOR SUCCESS is negative and statistically significant (though
somewhat more so in column 6). This indicates that venture capital firm experience has a
less positive effect on the performance of entrepreneurs with successful track records.
Indeed, using estimates from column 7, the predicted success rate for previously

16
successful entrepreneurs is 28.1% when funded by more experienced venture capital
firms (at the 75th percentile of VC EXPERIENCE) and 27.7% when funded by less
experienced venture capital firms (at the 25th percentile of VC EXPERIENCE).
Essentially, venture capital firm experience has a minimal effect on the performance of
entrepreneurs with good track records. Where venture capital firm experience does
matter is in the performance of first-time entrepreneurs and serial entrepreneurs with
histories of failure. First-time entrepreneurs have a 17.6% chance of succeeding when
funded by more experienced venture capital firms and an 11.7% chance of succeeding
when being funded by a less experienced venture capital firm. Likewise, failed
entrepreneurs who are funded by more experienced venture capital firms have a 22.1%
chance of succeeding as compared to a 14.7% chance of succeeding when they are
funded by less experienced venture capital firms.
These findings provide support for the view that venture capital firms actively
screen and/or monitor their portfolio companies, and that there is some skill in doing so.
When an entrepreneur has a proven track record of success–a publicly observable
measure of quality–experienced venture capital firms are no better than others at
determining whether he will succeed. It is only when there are less clear measures of
quality–an entrepreneur is starting a company for the first time, or an entrepreneur has
actually failed in his prior venture–that more experienced venture capital firms have an
advantage in identifying entrepreneurs who will succeed. To use a sports analogy, all
general managers of teams in the National Football League (NFL) probably agree that
superstar quarterback Tom Brady of the New England Patriots would be a valuable
addition to their teams. But, NFL teams were much less optimistic about his prospects

17
in 2000 when the Patriots drafted him in the sixth round. The football equivalent of our
finding would be that teams with a more experienced staff (such as the Patriots) are better
at identifying diamonds-in-the-rough such as Tom Brady when they are in the draft, but
no better at determining their worth once they are proven superstars.5
The results are also consistent with the view that venture capitalists actively
monitor their portfolio firms or add value through a variety of means such as executive
recruiting and customer contacts. Previously successful entrepreneurs–who presumably
need less monitoring and value-added services–do not benefit as much from this sort of
venture capital firm monitoring and expertise. By way of contrast, the evidence suggests
that first-time entrepreneurs and those with a track record of failure are more likely to
benefit from venture capital firm expertise. To continue the football analogy, Tom Brady
would benefit less from a high-quality football coach now than he did when he was first
drafted.
Table 6 provides additional supporting evidence for the view that more
experienced venture capital firms are better able to identify and/or develop
entrepreneurial skill. Here, we analyze the sample of first-time entrepreneurs to
determine the factors that lead them to become serial entrepreneurs. The dependent
variable is equal to one if the entrepreneur subsequently starts another venture. The
logistic regression reported in the first column in the table indicates that first-time
entrepreneurs funded by more experienced venture capital firms are more likely to
become serial entrepreneurs. At the 25th percentile of experience, there is a 4.8% chance
5Massey and Thaler (2006) present strong evidence that high first-round NFL draft picks are overvalued relative to later picks. Although they interpret their findings as evidence of a behavioral bias, it is also possible that less experienced general managers (who run lower quality teams and get to pick early in the first round) have a harder time assessing quality.

18
that an entrepreneur will start another venture, whereas at the 75th percentile, there is a
5.7% probability. Though the increase is small on an absolute basis, given the low
baseline rates of serial entrepreneurship, the effect is quite big.
B. Valuation
We now examine how serial entrepreneurship and venture capital firm experience
affect company valuations.6 To analyze this question, we use first-round “pre-money”
valuation as our valuation measure. Venture Source calculates this as the product of the
price paid per share in the round and the shares outstanding prior to the financing round.7
The pre-money valuation is the perceived net present value of the company, and therefore
excludes the additional capital raised in the financing.
A company’s valuation depends on numerous factors including those we can
(imperfectly) observe (e.g., the stage of product development, company age, industry,
location, public market valuation levels, entrepreneur’s quality, and venture capital firm’s
quality) and those we cannot (e.g., the company’s sales and assets). We are mainly
interested in how measures of entrepreneur quality and venture capital firm quality affect
pre-money valuation.
Table 7 presents the results of regressing the natural log of real pre-money
valuation (expressed in millions of year 2000 dollars) on the above observables. Because
the data include significant outliers (one valuation exceeds $600 million), we winsorize
the dependent variable at the 99th percentile ($131.5 million), which is more than 15
6Hsu (2004) shows that entrepreneurs have to pay more (i.e., to accept a lower valuation) to be financed by venture capitalists with better track records. 7Almost all venture capital financings use convertible preferred stock. This methodology for calculation pre-money valuation implicitly assumes that the value of preferred stock’s liquidation preference is zero. Thus, this common approach to calculating pre-money valuation overstates the true valuation. This bias is unlikely to vary systematically with the variables we are using in our regression analysis.

19
times the median. All the regressions include industry and year fixed effects. We again
consider specifications at the entrepreneur-company level (1, 2 and 6), company level (3
and 7), the entrepreneur-company-VC firm level (4), and the company-VC firm level (5).
Before describing our main results, it is worth pointing out that the controls all have the
predicted sign. Older firms and those at later stages of product development have higher
valuations. In addition, when public market industry valuations are higher, venture
capital valuations are also higher. The public market industry valuation is calculated as
the average market-to-book equity ratio for publicly traded firms in the same industry.8
Finally, firms located in California have slightly higher valuations than those in other
states and firms located in Massachusetts have somewhat lower valuations, but these
differences are not statistically significant.
Of more interest is the finding that venture capital firm experience is positively
related to pre-money valuation. The effect, however, is modest. The elasticity is
approximately 9.2%. For example, the estimates from column 3 of Table 7 imply that at
the 75th percentile of VC EXPERIENCE, the forecasted valuation is $10.49 million,
whereas at the 25th, it is $8.92 million. That more experienced firms pay more for new
ventures is not surprising, given that they have higher success rates. Because there are
8In order to do this we need to link the SIC codes of public companies to the nine industries used in our analysis. Our procedure is to identify the SIC codes of all venture capital-backed firms that went public within a given Venture Economics industry code. Because there are multiple SIC codes associated with each of our nine industries, we construct market-to-book ratios as a weighted average of the market-to-book ratios of the public companies in those SIC codes, where the weights are the relative fractions of firms that went public within our nine industries. For each of the public firms assigned to the industry, we compute the ratio of shareholders’ equity to the market value of the equity at the beginning of the quarter. If multiple classes of common and preferred stock were outstanding, the combined value of all classes is used. In many industries, numerous small firms with significant negative earnings introduce a substantial skewness to the distribution of these ratios. Consequently, we weighted the average by equity market capitalization at the beginning of the quarter.

20
unobservable firm characteristics that affect valuation levels (or those that are measured
with error), it is likely that VC EXPERIENCE serves as a proxy for the characteristics
that increase firm value. These characteristics, such as the quality of the entrepreneur,
might be unobservable to less experienced venture capital firms. Alternatively,
characteristics such as sales or assets could be observable to market participants, but
unobservable to us given the data we have. If more experienced venture capital firms
invest in more mature firms in ways we do not fully capture with our company stage
controls, this could explain our finding.
The finding that new ventures funded by more experienced venture capital firms
invest at higher pre-money valuations needs to be reconciled with Hsu’s (2004) finding
that more experienced venture capital firms make offers at lower pre-money valuations.
Hsu examines a sample of new ventures that received competing offers from venture
capital firms. To the extent that more experienced venture capital firms add more value
to new ventures (as is consistent with our findings), they would require larger equity
stakes (lower share prices) in exchange for their money and their value-added services.
Thus, the offers from top-tier ventures capital firms should imply lower pre-money
valuations even though the companies are worth more if funded by them. Because Hsu is
looking at within-venture offers, he is controlling for the quality of the venture. He is
therefore able to isolate the effect of venture capital firm quality on valuations. Because
we are looking across ventures, we are picking up the effect identified by Hsu as well as
the between-venture differences in quality. This may explain why the estimated effect is
small.

21
Somewhat surprisingly, in the first two columns of Table 7 we find no
relationship between pre-money valuation and LATER VENTURE and PRIOR SUCCESS.
The same is true when we conduct the analysis at the company level (column 3) and
include venture capital firm fixed effects (columns 4 and 5). Given the higher success
rates of previously successful entrepreneurs, one would have thought that firms
associated with these entrepreneurs would have had higher valuations. Apparently this is
not the case, which suggests that venture capital firms are able to buy equity in firms
started by previously successful entrepreneurs at a discount.
The last two columns of Table 7 add interactions of VC EXPERIENCE with
measures of PRIOR SUCCESS and LATER VENTURE. The coefficient of the
interaction term is negative and statistically significant only at the five percent level. This
suggests that top-tier venture capital firms are not as eager to pay for prior performance,
but the magnitude of the effect is small.
This result is consistent with the results of Kaplan and Stromberg (2003). Kaplan
and Stromberg examine venture capital contractual terms and find that repeat
entrepreneurs receive more favorable terms for vesting, board structure, liquidation
rights, and the tranching of capital, but did not receive greater equity ownership
percentages. It therefore appears that serial entrepreneurs may extract greater value from
venture capitalists in the non-price terms of investment.
The overall conclusion that we draw from Table 7 is that despite the higher
success rates of entrepreneurs with successful track records, venture capital firms are not
paying premiums to invest in their companies. Why successful entrepreneurs appear

22
unable to capture an increasing share of rents is something of a mystery, but it has
implications for returns.
C. Returns
In this section, we investigate whether venture capital firms earn higher returns on
their investments in serial entrepreneurs. Unfortunately, we do not observe actual rates
of return on venture capital investments.9 What we can observe, with varying degrees of
accuracy, is company valuations at the time of exit. Venture Economics and Venture
Source provide this information for most IPOs and some acquisitions. For companies
missing information in these databases, we search for valuation at the time of IPO in
SDC Corporate New Issues database. We also searched for acquisition values using
Factiva. If the firm did not go public by December 2003, we assume that the exit value is
zero. We exclude from the analysis firms that went public or were acquired where we
could not find the valuation.
Our crude measure of return is the ratio of the exit valuation to pre-money
valuation in the first financing round with venture investors, what we refer to as the
investment multiple. The investment multiple is likely to be correlated with actual
returns but it does not adjust for two critical elements of return: the time it takes to exit
and the dilution that occurs over financing rounds.
Table 8 presents regression results in which the dependent variable is the
investment multiple divided by the average investment multiple of firms funded in the
same industry and year. We refer to this variable as the relative investment multiple.
9Venture capitalists typically invest in multiple financing rounds. Even if we know that a given venture firm invested in a certain round, it is often unclear what percentage of the equity sold in the financed the venture capitalist received. This information is needed to compute a rate of return.
23
When the relative investment multiple is one, the investment multiple on the venture
capital firm’s investment is equal to the industry-year average.
The regressors include the same set of variables we have been considering
throughout. The first column indicates that the relative investment multiple is greater for
firms with serial entrepreneurs, although the effect is not statistically significant. The
effect is larger for serial entrepreneurs who previously succeeded, as results reported in
the second column indicate. The estimated effect is statistically significant at
conventional levels. Finally, venture capital experience is positively related to the
relative investment multiple.
The estimates from the third column of Table 8 imply that among companies
funded by inexperienced venture capital firms, only those with previously successful
entrepreneurs do better than the industry-year average investment multiple (79% higher
on average). First time and failed entrepreneurs do significantly worse than the average.
By contrast, when companies are funded by top-tier venture capital firms, they perform
in general at the industry average and do significantly better if one of the entrepreneurs
has a successful track record (107% greater).
The last column of Table 8 looks at relative investment multiples, conditional on
the venture succeeding. Prior success and venture capital experience have no appreciable
effect on relative investment valuation. This indicates that the higher returns documented
in the first four columns of the Table 8 come from higher success rates, not greater
returns in the IPOs.
Finally, we try to connect our deal-level results to venture capital fund internal
rates of return. Our source of return data is the 2004 Private Equity Performance

24
Monitor, which presents return data on over 1,700 private equity funds. This information
is compiled by Mark O’Hare, who over the past five years has created a database of
returns from public sources (e.g., institutional investors who have posted their returns
online), Freedom of Information Act requests to public funds, and voluntary disclosures
by both general and limited partners. In order to do this mapping, we need to make some
assumptions. (For instance, because Mayfield V was raised in 1984 and Mayfield VI in
1988, we attribute all investments made between 1984 and 1987 to Mayfield V.)
Our dependent variable is fund internal rate of return (IRR) measured in percent.
(For example, a 60% return gets entered into the data as 60.) The average fund IRR is
13.8%. We include a series of controls including industry shares in the portfolio of the
fund, year dummies for the year the fund was established, and assets under management
at the time the fund was raised.
Our main independent variables of interest are the portion of a fund’s deals that
involve serial entrepreneurs and the portion that involve successful serial entrepreneurs.
The results in Table 9 are quite strong and demonstrate the impact that serial
entrepreneurs can have on portfolio returns. At the 25th return percentile, 6.8% of venture
capital funds are investments in companies with serial entrepreneurs; at the 75th
percentile, it is 18.2%. The coefficient of 59.2 in column 2 implies a 7.3% greater IRR
for funds that invest in serial entrepreneurs. However, there appears to be no link to the
share of the fund invested in previously successful entrepreneurs. The estimated effects
of experience are also large. Top-tier firms are predicted to have IRRs of 45.4%, as
compared to 14.3% for less experienced venture capital firms.
4. Conclusions

25
This paper examines the role that skill plays in the success of entrepreneurs and
venture capitalists. By examining the experience of serial entrepreneurs and the venture
capitalists that fund them, we are able to provide insights into how important each is and
what type of skill each possesses. Our results indicate that skill is an important
determinant of success for entrepreneurial startups. Successful serial entrepreneurs are
more likely to replicate the success of their past companies than either single venture
entrepreneurs or serial entrepreneurs who failed in their prior venture.
More experienced venture capital firms are also shown to have higher success
rates on their investments. However, this is isolated to first time entrepreneurs and those
who previously failed. When experienced and inexperienced venture capital firms invest
in entrepreneurs with a track record of success, there is no performance differential. This
evidence would seem to suggest that prior success is a signal of quality or that venture
capital firms add little value to talented, successful entrepreneurs. If prior success were
pure luck, we would not see this pattern.
While they are more likely to be successful, serial entrepreneurs are not able to
extract all of the value from their superior ability. We find that successful serial
entrepreneurs do not achieve higher valuations than do other entrepreneurs.10 This leads
to higher deal returns for venture capitalists who invest in companies started by
successful serial entrepreneurs. Investing in serial entrepreneurs also leads to higher
rates of return of the funds themselves.
Our paper raises several interesting questions for future research. First, while our
paper identifies entrepreneurial skill, it does not distinguish exactly what the critical
10 We are unable to determine the value implications of the non-price terms in Kaplan and Stromberg (2003) because we do not have the actual financing documents.

26
entrepreneurial skill is. It is possible that entrepreneurial skill is embodied in the
networks with customers, suppliers, and other market participants that enhance the
outcomes of serial entrepreneurs. It is also possible that the skill is greater ability to
identify markets, set strategy, and correctly analyze various business problems. In future
work, we hope to examine the markets that serial entrepreneurs enter and to identify
whether future success is confined to the markets where they have operated in the past or
whether successful serial entrepreneurs are also more successful in new markets.
While not ruling it out, our results are less consistent with the learning by doing
work of Eesley and Roberts (2006a,b). A learning-by-doing story would need to explain
why there is differential learning between successful and unsuccessful serial
entrepreneurs as well as why more experienced venture capitalists can identify failed
serial entrepreneurs who “learned” in their previous venture.
The results in this paper also highlight the role of venture capital skill in
identifying talented entrepreneurs and attractive markets. We do not, however, identify
whether this ability operates at the individual or the firm level. Similarly, we do not
know whether various attributes of the individual general partners or the firms
themselves are also associated with greater ability to identify successful investments. In
future work, we plan to look at how demographic characteristics of individual general
partners and characteristics of venture capital teams affect the success of venture capital
investments.

27
References
Bengtsson, Ola, Repeat Relationships between Venture Capitalists and Entrepreneurs, Unpublished working paper, University of Chicago, 2005. Bengtsson, Ola, Investor Attitudes and the Supply of Capital: Are Venture Capitalists in California More Forgiving?, Unpublished working paper, University of Chicago, 2006. Bhide, Amar, The Origin and Evolution of New Businesses. Oxford: Oxford University Press. 2000. Carroll, Glenn R., and Elaine Mosakowski, The Career Dynamics of Self-Employment, Administrative Science Quarterly 32. 1987. 570-589. Chatterji, Aaron K., Spawned with a Silver Spoon? Entrepreneurial Performance and Innovation in the Medical Device Industry, Unpublished Working Paper, University of California at Berkeley, 2005. Eesley, Charles, and Edward Roberts, Cutting Your Teeth: Learning from Rare Experiences, Unpublished working paper, MIT, 2006a. Eesley, Charles, and Edward Roberts, The Second Time Around?: Serial Entrepreneurs From MIT, Unpublished working paper, MIT, 2006b. Gompers, Paul, Anna Kovner, Josh Lerner, and David Scharfstein, Specialization and Success: Evidence from Venture Capital, Unpublished working paper, Harvard University, 2006. Gompers, Paul, and Josh Lerner, The Venture Capital Cycle. 2nd edition. Cambridge: MIT Press. 2004. Gompers, Paul, Josh Lerner, and David Scharfstein, Entrepreneurial Spawning: Public Corporations and the Genesis of New Ventures, 1986 to 1999, Journal of Finance 60. 2005. 577-614. Hochberg, Yael, Alexander Ljungqvist, and Yang Lu, Whom You Know Matters: Venture Capital Networks and Investment Performance, Journal of Finance Forthcoming. 2006. Honig, Benson, and Per Davidsson, Nascent Entrepreneurship, Social Networks and Organizational Learning, Paper presented at the Competence 2000, Helsinki, Finland. Hsu, David H., What Do Entrepreneurs Pay for Venture Capital Affiliation? Journal of Finance 59. 2004. 1805-1844
28
Kaplan, Steven N., and Antoinette Schoar, Private Equity Performance: Returns, Persistence and Capital, Journal of Finance 60. 2005. 1791-1823. Kaplan, Steven N., Berk A. Sensoy, and Per Strömberg, What are Firms? Evolution from Birth to Public Companies, Unpublished working paper, University of Chicago, 2006. Kaplan, Steven N., and Per Stromberg, Financial Contracting Theory Meets the Real World: Evidence from Venture Capital Contracts, Review of Economic Studies 70. 2003. 281-316. Kihlstrom, Richard, and Jean-Jacques Laffont, A General Equilibrium Entrepreneurial Theory of Firm Formation Based on Risk Aversion, Journal of Political Economy 87. 1979. 719-748. Knight, Frank H. Risk, Uncertainty and Profit. New York: Houghton Mifflin Company. 1921. <http://www.econlib.org/library/Knight/knRUP8.html>. Lazear, Edward P., Entrepreneurship, Journal of Labor Economics 23. 2005. 649-680. Massey, Cade, and Richard H. Thaler, Overconfidence vs. Market Efficiency in the National Football League, Working paper no. 11270, National Bureau of Economic Research, 2006. Reuber, Rebecca, Lorraine Dyke, and Eileen Fischer, The Impact of Entrepreneurial Teams on the Financing Experiences of Canadian Ventures, Journal of Small Business and Entrepreneurship 7. 1990. 13-22. Schumpeter, Joseph A. The Theory of Economic Development. Cambridge, Mass: Harvard University Press. 1934. Sorensen, Morten, How Smart is Smart Money? A Two-Sided Matching Model of Venture Capital, Unpublished working paper, University of Chicago, 2004. Sorenson, Olav, and Toby Stuart, Syndication Networks and the Spatial Distribution of Venture Capital Investments. American Journal of Sociology. 106. 2001. 1546-1586.

29
Table 1: Frequency of Serial Entrepreneurs by Year
Serial Entrepreneurs as Year Serial Entrepreneurs Total Entrepreneurs a Percent of Total 1980 0 11 0.0 1981 0 7 0.0 1982 0 11 0.0 1983 0 34 0.0 1984 2 29 6.9 1985 3 42 7.1 1986 9 99 9.1 1987 9 130 6.9 1988 10 209 4.8 1989 14 254 5.5 1990 35 301 11.6 1991 34 337 10.1 1992 53 522 10.2 1993 65 516 12.6 1994 78 574 13.6 1995 129 1,051 12.3 1996 166 1,262 13.2 1997 141 1,205 11.7 1998 164 1,256 13.1 1999 174 1,678 10.4 2000 38 404 9.4 Sample includes one observation per entrepreneur - company pair.

Table 2: Frequency of Serial Entrepreneurs by Industry Serial Entrepreneurs as Serial Entrepreneurs Total Entrepreneurs a Percent of Total Internet and Computers 556 4,489 12.4 Communications and Electronics 157 1,424 11.0 Business and Industrial 2 109 1.8 Consumer 29 576 5.0 Energy 0 19 0.0 Biotech and Healthcare 271 1,964 13.8 Financial Services 11 163 6.7 Business Services 68 827 8.2 Other 30 361 8.3 Sample includes one observation per entrepreneur - company pair.

2
Table 3: Frequency of Serial Entrepreneurs by Venture Capital Firm Serial Total Serial Entrepreneurs as Ranking by: Year Entrepreneurs Entrepreneurs a Percent of Total Number Percent Kleiner Perkins Caufield & Byers 100 666 15.0 1 9 New Enterprise Associates 80 702 11.4 2 28 Sequoia Capital 69 432 16.0 3 5 U.S. Venture Partners 68 454 15.0 4 10 Mayfield 63 459 13.7 5 19 Accel Partners 61 418 14.6 6 13 Crosspoint Venture Partners 60 407 14.7 7 11 Institutional Venture Partners 56 385 14.5 8 14 Bessemer Venture Partners 49 340 14.4 9 16 Matrix Partners 44 275 16.0 10 4 Menlo Ventures 43 305 14.1 11 17 Sprout Group 42 315 13.3 12 21 Brentwood Associates 40 265 15.1 14 8 Venrock Associates 40 389 10.3 13 31 Mohr Davidow Ventures 38 251 15.1 16 6 Oak Investment Partners 38 462 8.2 15 39 Domain Associates 37 210 17.6 17 1 Benchmark Capital 36 264 13.6 19 20 Greylock Partners 36 374 9.6 18 34 InterWest Partners 35 312 11.2 20 29 Advent International 33 238 13.9 21 18 Foundation Capital 31 188 16.5 24 2 Enterprise Partners Venture Capital 31 215 14.4 23 15 Canaan Partners 31 252 12.3 22 23 Delphi Ventures 30 185 16.2 26 3 Sigma Partners 30 204 14.7 25 12 Charles River Ventures 29 192 15.1 27 7 Norwest Venture Partners 27 231 11.7 28 25 Austin Ventures 25 270 9.3 29 36 Morgan Stanley Venture Partners 24 191 12.6 34 22 Lightspeed Venture Partners 24 202 11.9 33 24 Sutter Hill Ventures 24 207 11.6 32 26 Battery Ventures 24 242 9.9 31 33 Sevin Rosen Funds 24 254 9.4 30 35 JPMorgan Partners 23 225 10.2 36 32 St. Paul Venture Capital 23 277 8.3 35 38 Alta Partners 22 190 11.6 37 27 Morgenthaler 20 183 10.9 38 30 Trinity Ventures 18 214 8.4 39 37 Warburg Pincus 16 195 8.2 40 40
Sample includes one observation per VC firm-portfolio company. Includes the 40 VC firms with the most total deals in the sample.
3
Table 4: Summary Statistics
All First Entrepreneurs
with One Serial Entrepreneurs Ventures Venture First Venture Later Ventures Success Rate 0.253 0.243 0.369 *** 0.290 *** Pre-Money Valuation (millions of 2000 $) 15.95 15.78 17.75 * 12.30 *** Firm in Startup Stage 0.116 0.118 0.090 ** 0.175 *** Firm in Development Stage 0.294 0.294 0.293 0.377 *** Firm in Beta Stage 0.039 0.039 0.037 0.045 Firm in Shipping Stage 0.469 0.470 0.462 0.362 *** Firm in Profitable Stage 0.073 0.070 0.101 ** 0.036 *** Firm in Re-Start Stage 0.009 0.009 0.016 0.006 California-Based Company 0.430 0.417 0.578 *** 0.591 *** Massachusetts-Based Company 0.119 0.119 0.122 0.119 Age of Firm (in Months) 36.64 36.30 40.54 ** 20.60 *** Previous Deals by VC Firm 51.35 51.76 46.70 *** 58.86 *** Previous Deals by VC Firm Relative to Year Average 2.896 2.887 2.989 3.290 *** One observation per entrepreneur-company pair. ***, **, * indicate significant difference from mean value of entrepreneurs with one venture at the 1%, 5% and 10% level, respectively.

Table 5: Venture Success Rates
(1) (2) (3) (4) (5) (6) (7)
Probit Probit Probit Probit Probit Probit Probit
LATER VENTURE 0.0411 0.0126 0.0017 0.0069 (2.92) *** (0.73) (0.09) (0.34) PRIOR SUCCESS 0.0830 0.0992 0.1252 (2.93) *** (3.04) *** (3.68) *** Any Entrepreneur In LATER VENTURE 0.0384 0.0222 0.0362 (2.21) ** (1.01) (1.65) * Any Entrepreneur Has PRIOR SUCCESS 0.0808 0.0939 0.1198 (3.12) *** (2.90) *** (3.66) *** VC FIRM EXPERIENCE 0.0381 0.0379 0.0357 0.0391 0.0399 (4.51) *** (4.49) *** (5.82) *** (4.56) *** (5.52) *** VC FIRM EXPERIENCE X LATER VENTURE 0.0079 (0.51) VC FIRM EXPERIENCE X PRIOR SUCCESS -0.0453 (2.02) ** VC FIRM EXPERIENCE X Any Entrepreneur 0.0027 In Later Venture (0.16) VC FIRM EXPERIENCE X Any Entrepreneur -0.0404 Has PRIOR SUCCESS (1.87) * Logarithm of Age of Company 0.0060 0.0061 0.0084 0.0086 0.0024 0.0060 0.0082 (0.89) (0.90) (1.70) * (1.03) (0.37) (0.89) (1.68) * California-Based Company 0.0249 0.0249 0.0029 0.0183 -0.0066 0.0249 0.0024 (1.33) (1.33) (0.21) (0.75) (0.34) (1.33) (0.17) Massachusetts-Based Company -0.0616 -0.0610 -0.0415 -0.1039 -0.0681 -0.0617 -0.0436 (2.38) ** (2.36) ** (2.24) ** (3.24) *** (2.61) *** (2.39) ** (2.37) ** Company In Development Stage 0.0175 0.0168 0.0304 0.0183 0.0544 0.0171 0.0305 (0.58) (0.56) (1.39) (0.55) (2.05) ** (0.57) (1.40) Company In Beta Stage 0.0402 0.0403 0.0691 0.0476 0.1202 0.0411 0.0702 (0.78) (0.78) (1.78) * (0.93) (2.79) (0.80) (1.81) *

2
Company In Shipping Stage 0.0659 0.0657 0.0671 0.0982 0.1282 0.0664 0.0677 (2.06) ** (2.06) ** (2.92) *** (2.79) *** (4.56) *** (2.08) ** (2.94) *** Company In Profitable Stage 0.1784 0.1789 0.2269 0.1814 0.2672 0.1798 0.2278 (3.49) *** (3.50) *** (5.40) *** (2.99) *** (5.26) *** (3.51) *** (5.41) *** Company In Re-Start Stage -0.0163 -0.0138 -0.0554 -0.0040 0.0133 -0.0128 -0.0541 (0.15) (0.13) (0.76) (0.04) (0.15) (0.12) (0.74) Company Stage Missing 0.1057 0.1061 0.1453 0.2929 0.2891 0.1082 0.1500 (1.96) * (1.97) ** (3.31) *** (4.07) *** (4.46) *** (2.00) ** (3.39) *** Controls for: Round Number yes yes yes yes yes yes yes Year yes yes yes yes yes yes yes Industry yes yes yes yes yes yes yes VC Firm Fixed Effects no no no yes yes no no Log-likelihood -4872.2 -4867.7 -1635.5 -9568.9 -2805.8 -4865.5 -1632.9 χ2-Statistic
373.1 376.9 536.7 1008.7 1034.9 379.4 535.7 p-Value 0.000 0.000 0.000 0.000 0.000 0.000 0.000
Observations 9,876 9,876 3,831 19,617 6,180 9,876 3,831 The sample consists of 9,932 ventures by 8,808 entrepreneurs covering the years 1975 to 2000. The dependent variable is Success, an indicator variable that takes on the value of one if the portfolio company went public and zero otherwise. LATER VENTURE is an indicator variable that takes on the value of one if the entrepreneur had started a previous venture-backed company and zero otherwise. PRIOR SUCCESS is an indicator variable that takes on the value of one if the entrepreneur had started a previous venture-backed company that went public or filed to go public by December 2003 and zero otherwise. Any Entrepreneur in Later Venture is an indicator variable that takes the value of one if any entrepreneur within the company had started a previous venture-backed company and zero otherwise. Any Entrepreneur with Prior Success is an indicator variable that takes the value of one if any entrepreneur within the company started a previous venture-backed company that went public or filed to go public by December 2003 and zero otherwise. VC FIRM EXPERIENCE is the difference between the log of the number of investments made by venture capital organization f prior to year t and the average in year t of the number of investments made by all organizations prior to year t. The sample analyzed in columns 1, 2, and 6 is at the entrepreneur-company level, the sample analyzed in columns 3 and 7 is at the company level, the sample analyzed in column 4 is at the entrepreneur-company-VC firm level, and the sample analyzed in column 5 is at the company-VC firm level. Standard errors are clustered at portfolio company level. Robust t-statistics are in parentheses below coefficient estimates. ***, **, * indicate statistical significance at the 1%, 5% and 10% level, respectively.

Table 6: Probability of Becoming a Serial Entrepreneur (1) (2) Probit Probit VC FIRM EXPERIENCE 0.0058 0.0058 (2.57) ** (2.53) ** PRIOR SUCCESS 0.0009 (0.17) Logarithm of Age of Company 0.0036 0.0036 (1.75) * (1.75) * California-Based Company 0.0347 0.0347 (6.47) *** (6.46) *** Massachusetts-Based Company 0.0193 0.0194 (2.18) ** (2.19) ** Company In Development Stage 0.0122 0.0122 (1.29) (1.28) Company In Beta Stage 0.0058 0.0058 (0.40) (0.40) Company In Shipping Stage 0.0141 0.0141 (1.47) (1.47) Company In Profitable Stage 0.0032 0.0031 (0.26) (0.25) Company In Re-Start Stage -0.0086 -0.0085 (0.41) (0.41) Company Stage Missing 0.0262 0.0261 (1.75) * (1.75) * Controls for: Round Number yes yes Year yes yes Industry yes yes Log-likelihood -2145.5 -2145.5 χ2-Statistic 563.6 564.4 p-Value 0.000 0.000 Observations 8,734 8,734 The sample consists of 8,808 initial ventures by entrepreneurs covering the years 1975 to 2000. The dependent variable is Become Serial, an indicator variable that takes the value of one if the entrepreneur begins a second venture and zero otherwise. VC FIRM EXPERIENCE is the difference between the log of the number of investments made by venture capital organization f prior to year t and the average in year t of the number of investments made by all organizations prior to year t. PRIOR SUCCESS is an indicator variable that takes on the value of one if the entrepreneur's first venture-backed company went public or filed to go public by December 2003 and zero otherwise. Standard errors are clustered at portfolio company level. Robust t-statistics are in parentheses below coefficient estimates. ***, **, * indicate statistical significance at the 1%, 5% and 10% level, respectively.

Table 7: Pre-Money Valuations
(1) (2) (3) (4) (5) (6) (7)
OLS OLS OLS OLS OLS OLS OLS
LATER VENTURE -0.0290 -0.0245 0.0144 -0.0210 (0.97) (0.66) (0.46) (0.45) PRIOR SUCCESS -0.0132 -0.0726 0.0671 (0.23) (1.31) (0.90) Any Entrepreneur In LATER VENTURE -0.0260 -0.0112 -0.0176 (0.60) (0.28) (0.31) Any Entrepreneur Has PRIOR SUCCESS 0.0065 -0.0351 0.1204 (0.11) (0.58) (1.50) VC FIRM EXPERIENCE 0.0916 0.0916 0.1149 0.0965 0.1344 (4.88) *** (4.88) *** (7.12) *** (5.09) *** (7.12) *** VC FIRM EXPERIENCE X LATER VENTURE -0.0050 (0.15) VC FIRM EXPERIENCE X PRIOR SUCCESS -0.0926 (1.75) * VC FIRM EXPERIENCE X Any Entrepreneur -0.0135 In Later Venture (0.31) VC FIRM EXPERIENCE X Any Entrepreneur -0.1382 Has PRIOR SUCCESS (2.34) ** Logarithm of Age of Company 0.0889 0.0889 0.0927 0.0396 0.0543 0.0886 0.0916 (4.94) *** (4.93) *** (5.82) *** (3.77) *** (3.08) *** (4.92) *** (5.76) *** California-Based Company 0.0771 0.0771 0.0629 0.0576 0.0195 0.0771 0.0611 (1.87) * (1.87) * (1.69) * (2.29) ** (0.47) (1.87) * (1.64) Massachusetts-Based Company -0.0554 -0.0555 -0.0715 -0.1195 -0.1312 -0.0575 -0.0800 (0.95) (0.95) (1.42) (3.46) (2.53) ** (0.99) (1.60) Company In Development Stage 0.4787 0.4788 0.4366 0.7874 0.6834 0.4794 0.4367 (8.28) *** (8.28) *** (8.71) *** (19.28) *** (10.77) *** (8.29) *** (8.70) *** Company In Beta Stage 0.6504 0.6503 0.6652 1.1635 1.0595 0.6509 0.6661 (6.17) *** (6.17) *** (7.32) *** (19.80) *** (11.83) *** (6.18) *** (7.37) *** Company In Shipping Stage 0.9070 0.9070 0.8456 1.2609 1.1157 0.9078 0.8468

2
(14.02) *** (14.02) *** (14.48) *** (28.84) *** (16.19) *** (14.05) *** (14.49) *** Company In Profitable Stage 1.3444 1.3442 1.3231 1.8374 1.6150 1.3451 1.3247 (12.92) *** (12.91) *** (13.16) *** (28.27) *** (14.51) *** (12.93) *** (13.21) *** Company In Re-Start Stage -0.5520 -0.5524 -0.5416 0.2357 0.0529 -0.5501 -0.5322 (2.29) ** (2.29) ** (2.45) ** (2.29) ** (0.22) (2.28) ** (2.41) ** Company Stage Missing 0.0000 0.0000 0.0000 0.0000 0.0000 0.0000 0.0000 (0.00) (0.00) (0.00) (0.00) (0.00) (0.00) (0.00) Logarithm of Value-Weighted Industry Index 0.4467 0.4465 0.3532 0.2684 0.1682 0.4472 0.3572 (4.32) ** (4.32) ** (3.80) ** (3.95) ** (1.61) (4.33) ** (3.86) ** Controls for: Round Number yes yes yes yes yes yes yes Year yes yes yes yes yes yes yes Industry yes yes yes yes yes yes yes VC Firm Fixed Effects no no no yes yes no no R-squared 0.36 0.36 0.35 0.56 0.56 0.36 0.35
Observations 6,377 6,377 2,348 15,670 4,912 6,377 2,348
The sample consists of 6,418 professional venture financings of privately held firms between 1975 and 2000 in the Venture Source database for which the firm was able to determine the valuation of the financing round. The dependent variable is natural logarithm of Pre-Money Valuation, defined as the product of the price paid per share in the financing round and the shares outstanding prior to the financing round, expressed in millions of current dollars. Later Venture is an indicator variable that takes on the value of one if the entrepreneur had started a previous venture-backed company and zero otherwise. PRIOR SUCCESS is an indicator variable that takes on the value of one if the entrepreneur had started a previous venture-backed company that went public or filed to go public by December 2003 and zero otherwise. Any Entrepreneur in Later Venture is an indicator variable that takes the value of one if any entrepreneur within the company had started a previous venture-backed company and zero otherwise. Any Entrepreneur with Prior Success is an indicator variable that takes the value of one if any entrepreneur within the company started a previous venture-backed company that went public or filed to go public by December 2003 and zero otherwise. VC FIRM EXPERIENCE is the difference between the log of the number of investments made by venture capital organization f prior to year t and the average in year t of the number of investments made by all organizations prior to year t. The sample analyzed in columns 1, 2, and 6 is at the entrepreneur-company level, the sample analyzed in columns 3 and 7 is at the company level, the sample analyzed in column 4 is at the entrepreneur-company-VC firm level, and the sample analyzed in column 5 is at the company-VC firm level. Standard errors are clustered at portfolio company level. Robust t-statistics are in parentheses below coefficient estimates. ***, **, * indicate statistical significance at the 1%, 5% and 10% level, respectively.

3
Table 8: Venture Returns
(1) (2) (3) (4) (5) (6) (7) (8)
OLS OLS OLS OLS OLS OLS OLS OLS
LATER VENTURE 0.3429 0.0883 0.1228 -0.3030 0.1845 0.0163 0.1536 (1.63) (0.36) (0.54) (1.93) * (1.41) (0.12) (0.86) PRIOR SUCCESS 0.7799 0.8278 1.4183 0.4238 0.3159 (1.46) (1.66) * (2.77) *** (1.37) (0.91) ANY ENTREPRENEUR IN LATER VENTURE 0.3823 (1.39) ANY ENTREPRENEUR HAS PRIOR SUCCESS 0.8185 (1.64)
VC FIRM EXPERIENCE 0.1531 0.1515 0.1594 0.2285 0.2089 -0.1216 -
0.1187 -0.1076 (1.73) * (1.71) * (1.80) * (2.29) ** (1.93) * (1.63) (1.59) (1.41) VC FIRM EXPERIENCE X LATER VENTURE -0.0546 0.0224 -0.1387 (0.28) (0.17) (1.18) VC FIRM EXPERIENCE X PRIOR SUCCESS -0.0555 -0.0591 0.1012 (0.16) (0.16) (0.40) VC FIRM EXPERIENCE X Any Entrepreneur -0.0892 In Later Venture (0.34) VC FIRM EXPERIENCE X Any Entrepreneur 0.0359 Has PRIOR SUCCESS (0.09)
Logarithm of Age of Company -0.1371 -0.1373 -0.1376 -0.1084 -0.0712 -0.2048 -
0.2023 -0.2023 (2.23) ** (2.23) ** (2.22) ** (1.60) (1.18) (3.36) *** (3.31) *** (3.30) *** California-Based Company 0.3013 0.3024 0.3021 0.1221 0.2886 0.0169 0.0126 0.0146 (1.23) (1.23) (1.23) (0.48) (0.96) (0.08) (0.06) (0.07) Massachusetts-Based Company -0.1708 -0.1634 -0.1643 -0.1585 -0.0815 0.0258 0.0277 0.0247 (0.68) (0.65) (0.66) (0.54) (0.26) (0.09) (0.09) (0.08)
Company In Development Stage -0.3487 -0.3519 -0.3521 -0.1943 -0.2974 -1.1035 -
1.1169 -1.1208 (0.80) (0.81) (0.81) (0.41) (0.61) (2.05) ** (2.07) ** (2.07) **

4
Company In Beta Stage -0.9392 -0.9333 -0.9346 -0.7156 -1.0589 -1.7482 -
1.7498 -1.7495 (2.23) ** (2.21) ** (2.21) ** (1.57) (2.28) ** (3.07) *** (3.07) *** (3.07) ***
Company In Shipping Stage -0.1372 -0.1318 -0.1321 -0.0247 -0.4690 -1.2298 -
1.2334 -1.2365 (0.29) (0.28) (0.28) (0.05) (0.91) (2.27) ** (2.27) ** (2.27) **
Company In Profitable Stage -0.3106 -0.3011 -0.3019 -0.1153 -0.4534 -1.4655 -
1.4653 -1.4703 (0.64) (0.62) (0.62) (0.22) (0.82) (2.62) *** (2.62) *** (2.62) *** Company In Re-Start Stage 0.5986 0.6178 0.6163 0.0814 0.8543 0.3517 0.3693 0.3669 (0.39) (0.41) (0.40) (0.09) (0.48) (0.31) (0.32) (0.32) Company Stage Missing -1.0495 -1.0383 -1.0363 -0.7742 -1.1125 0.0000 0.0000 0.0000 (2.54) ** (2.51) ** (2.50) ** (1.74) * (2.52) ** (0.00) (0.00) (0.00) Controls for: Round Number yes yes yes yes yes yes yes yes Year yes yes yes yes yes yes yes yes Industry yes yes yes yes yes yes yes yes R-squared 0.01 0.01 0.01 0.01 0.01 0.1 0.1 0.1
Observations 8,897 8,897 8,897 3,513 6,586 1,554 1,554 1,554
The sample consists of 8,944 ventures for which an IPO valuation was determined or for which there was no IPO. The dependent variable is IPO Exit Return, defined as the ratio of the IPO valuation to the pre-money valuation for the venture relative to the ratio of the IPO valuation to pre-money valuation of all ventures in the same industry in the current year. LATER VENTURE is an indicator variable that takes on the value of one if the entrepreneur had started a previous venture-backed company and zero otherwise. PRIOR SUCCESS is an indicator variable that takes on the value of one if the entrepreneur had started a previous venture-backed company that went public or filed to go public by December 2003 and zero otherwise. Any Entrepreneur in Later Venture is an indicator variable that takes the value of one if any entrepreneur within the company had started a previous venture-backed company and zero otherwise. Any Entrepreneur with Prior Success is an indicator variable that takes the value of one if any entrepreneur within the company started a previous venture-backed company that went public or filed to go public by December 2003 and zero otherwise. VC Firm Experiencet is the difference between the log of the number of investments made by venture capital organization f prior to year t and the average in year t of the number of investments made by all organizations prior to year t. Standard errors are clustered at portfolio company level. Robust t-statistics are in parentheses below coefficient estimates. ***, **, * indicate statistical significance at the 1%, 5% and 10% level, respectively.

Table 9: Fund-Level Returns (1) (2) (3) (4) OLS OLS OLS WLS Share of Portfolio With LATER VENTURE 54.0521 59.1963 36.7272 310.7474 (1.21) (1.24) (0.63) (1.70) * Share of Portfolio With PRIOR SUCCESS 64.4079 -74.5977 (0.72) (0.31) VC FIRM EXPERIENCE 20.0744 19.5406 20.0984 20.1381 (5.02) *** (4.77) *** (5.01) *** (3.50) *** Controls: Vintage Year Fixed Effects yes yes yes yes Fund Size yes yes yes yes Percentage in Each Industry yes yes yes yes Mean Round Number of Deals yes R-squared 0.45 0.46 0.46 0.59 Observations 514 482 514 514
The sample consists of 370 VC funds with information from the 2004 Private Equity Performance Monitor. The dependent variable is Fund IRR, defined as the IRR of the fund. Share of Portfolio with Later Venture is the share of the individual VC firm's portfolio in later ventures of serial entrepreneurs over the years of the fund. Share of Portfolio with Prior Success is the share of the individual VC firm's portfolio in later ventures of serial entrepreneurs where the entrepreneur was successful in the previous venture over the years of the fund. VC FIRM EXPERIENCE is the difference between the log of the average number of investments made by venture capital organization f prior to year t for each investment in the fund and the average in year t of the average number of investments made by all organizations prior to year t. Standard errors are clustered at VC firm level. Robust t-statistics are in parentheses below coefficient estimates. ***, **, * indicate statistical significance at the 1%, 5% and 10% level, respectively.


