
SOCIAL PROGRESS INDEX: STATES OF INDIA
MAKING SOCIAL PROGRESS MORE INTEGRAL TO THE INDIAN DEVELOPMENT AGENDA
This paper analyses the social progress of twenty-eight Indian states and one Union Territory
(Delhi) for the period 2005–2016 by applying the Social Progress Index framework. The
results will enable the policymakers and businesses to evaluate and benchmark performance
on different social indicators, identify priority areas for improvement and establish the best
practices that can be scaled and emulated.
The objective of this paper is to share the perspective regarding Social Progress Index with
the national and state-level policymakers as well as business executives across India.
SOCIAL PROGRESS INDEX: STATES OF INDIA
Page 1
ABOUT THE PROJECT
The project is being conducted by the Institute for Competitiveness, India. The purpose of this
initiative is to complement the economic assessment of India by adopting the Social Progress
Index, a tool that measures social welfare independent of economic performance.
This is being implemented in three phases:
● Phase 1: Analyzing the social progress performance of 28 states and 1 Union Territory in
India.
● Phase 2: Analyzing the social progress performance of 50 cities in India.
● Phase 3: Analyzing the social progress performance of 562 districts in India.
• Phase 3a - Scope involves districts of Goa, Gujarat, Maharashtra, Madhya Pradesh,
Daman and Diu, Chandigarh, Dadra and Nagar Haveli, Delhi, Rajasthan, and
Punjab.
• Phase 3b - Scope involves districts of Andhra Pradesh, Karnataka, Kerala, Tamil
Nadu, Lakshadweep Islands, Puducherry and Andaman & Nicobar Islands.
• Phase 3c - Scope includes districts of Odisha, Bihar, West Bengal, Uttar Pradesh,
Himachal Pradesh, Uttarakhand, Haryana, Sikkim, Jharkhand, Chhattisgarh.
This paper relates to the first phase of the project and presents the results of the BETA
SOCIAL PROGRESS INDEX: STATES OF INDIA.
The Institute plans to launch the final index by the end of 2017 and the purpose of
presenting this paper is to invite the readers to share their feedback and comments on the
proposed Social Progress Index, States of India by July 10th, 2017.
The complete methodological paper can be downloaded from the Social Progress India
website: http://socialprogress.in/
Discussion Paper by:
Institute for Competitiveness, U24/8, DLF Phase 3, Gurgaon - 122002, Haryana, India
Email: [email protected] Contact No.: +91 124 4376676
SOCIAL PROGRESS INDEX: STATES OF INDIA
Page 2
KEY FINDINGS FROM THE SOCIAL PROGRESS INDEX, STATES OF INDIA
• All Indian states have made significant improvements on social progress over the last eleven
years. However, there are wide regional variations.
• The analysis reveals that every state has room for improvement as even the high performing
states score low on certain aspects of social progress.
• Economic measures cannot be the sole drivers of decision making. Even though economic
performance is closely related to social progress, economic performance alone does not provide
a complete picture of the society.
• The index identifies country-specific and state-specific issues that can help the change makers at
the national as well as state level in framing policies.
• Social Progress Index framework is closely coherent with Sustainable Development Goals and the
Corporate Social Responsibility activities. It can thus provide a monitoring mechanism to track the
SDG implementation and assist businesses in making CSR investments.
SOCIAL PROGRESS INDEX: STATES OF INDIA
Page 3
THE IMPORTANCE OF MEASURING SOCIAL PROGRESS FOR INDIAN STATES
The Indian economy has undergone a major overhaul in the past few decades. A country that was
admonished for its Hindu rate of growth1 until the 1990s has now become the fastest growing major
economy. Per capita income in the period 1991–2016 has increased around 15 times (in terms of current
prices), foreign direct investment inflows grew at three times the world average in the last decade, the
fiscal deficit is decreasing, and inflation is modest.
Laudable economic growth has helped the country to advance its social parameters as well. The poverty
headcount is reduced from 47.8 % (1990) to 21.9 % (2011–12) due to higher social investments in
poverty reduction programs; considerable progress has been made in universalization of primary
education with the current youth literacy rate at 902 %; the focus on maternal and child care has led to
substantial improvements in mortality rates across the country.
Despite these accomplishments, performance in social welfare still lags the economic success that the
country has achieved. Several of India’s peers have been making remarkable social progress even
without such economic prosperity. This mismatch between social and economic progress highlights the need
for India to rethink and act directly on key social and environmental aspects.
A holistic approach towards measuring social developments will help the country to make social progress
more integral to the policymaking process. The Social Progress Index offers one such actionable
framework that can help leaders and change makers to evaluate their performance on social
parameters. (The complete framework is explained in Chapter 2.)
The Global Social Progress Index Scorecard for India, as shown in Figure 1, sheds light on India’s
absolute and relative performance. The absolute analysis presents the indicator performance and
component scores at a 0-100 scale. Relative analysis examines country performance relative to a group
of comparator countries with similar resources (measured in terms of GDP per capita) and derives
strengths and weaknesses accordingly (red - weakness, yellow - neutral, green - strength).
1 The Hindu rate of growth refers to the low annual growth rate of the planned economy of India before the liberalisations of 1991. 2 World Bank Data, 2015

SOCIAL PROGRESS INDEX: STATES OF INDIA
Page 4
Figure 1: Social Progress Index Scorecard of India, 2016
Source: Social Progress Imperative, Global Social Progress Index 2016
On an absolute basis, India performs fairly well on certain parameters, for example, the affordability of
housing, political rights, and gender parity in basic education; there is room for improvement when the
country is analysed on tolerance and inclusion, pollution, and health.
On a relative basis, India’s scores are well within the range of expected scores for all the three
dimensions i.e. Basic Human Needs, Foundations of Wellbeing and Opportunity. It outperforms its peers
on tackling corruption and providing the citizens with political rights. On the other hand, the country can
learn from its peers in devising strategies for a healthy ecosystem and providing access to information.
However, these country-level insights are not sufficient to devise a useful plan of action within India as
conditions vary significantly across the country.
India is well-known for its diversity. As a country with large population, it presents endless varieties of
physical features, cultural patterns, religions, and languages. Considering its diversity and heterogeneity,
SOCIAL PROGRESS INDEX: STATES OF INDIA
Page 5
it becomes difficult for policy makers to formulate policies as the needs and problems of people differ
according to geography, economic status, religion, and social position. There is, therefore, an increasing
need for data-driven regional insights that can foster inclusive growth.
Region-specific insights are valuable as they help policy makers to understand these diverse needs and
inform relevant policies needed to identify priorities and drive progress. For instance, the literacy rate in
India stood at 74.04 % in 2011. While such performance is very low and suggests the need to focus
more on expanding access to knowledge, there are wide regional disparities. For example, the literacy
rate of Kerala was 93.91 % while Bihar was at 63.8 %.
While a wealth of information is publicly available at the regional level across a wide range of
measures including climate change, safety and security, education, and health, a holistic measure to track
a region’s performance across all these dimensions is missing.
The Social Progress Index can address this need by applying a robust and credible framework and
methodology, to provide detailed data-driven insights on different dimensions of social progress.
The analysis of social progress at the regional level has the following key benefits:
● It provides a credible and robust measure of social progress for Indian states, and can be
applied to cities and districts, to benchmark performance, identify priority areas for improvement,
and best practices that can be scaled and emulated.
● It enables policy makers to formulate strategies for inclusive growth and prioritize public
investments based on the real needs of the citizens.
● It provides value-added inputs to business leaders on the different geographies and sectoral
needs, giving them a sense of direction on planning and spending their CSR budgets.
SOCIAL PROGRESS INDEX: STATES OF INDIA
Page 6
Box 1: The Beyond GDP Debate
The world was in the midst of an upheaval from the Great Depression when the idea of National Income Accounting was proposed by Simon Kuznets. National income accounting (the best-known system of which is gross domestic product - GDP), an estimate of the final goods and services produced in a country. an estimate of the final goods and services produced in a country, was developed to provide a window to the economic performance of a region, at a time when the world faced economic realities very different from those of today. The aim was to move away from a rudimentary set of data to a uniform set of national accounts, a purpose that GDP served well. Its use as a global measure of progress was further strengthened at the Bretton Woods Conference (1944) and since then, GDP has become the de facto language of countries’ progress worldwide.
For the last several decades, the predominant focus of all countries has been on maximizing growth rates and economic performance with the underlying belief that such gains will trickle down to societies’ and people’s welfare. There is no denying that economic growth has helped nations to grow and has lifted millions out of poverty. However, it is now widely accepted that focus on the economic scorecard does not bring prosperity to all realms of societies’ wellbeing.
The trade-off between the twin objectives of development process, i.e., economic growth and
social progress, has long been a ubiquitous debate. However, it is increasingly being
challenged by the notion that although important, economic growth is not sufficient for achieving
the welfare of societies. It may, or may not, lead to social progress.
In the countries that have seen consistent GDP growth, the fundamental question surfaces
whether the sole focus on economic performance is the correct approach to drive and assess
prosperity. There is also perhaps a mismatch between how governments define and measure
progress and citizens’ perception. For everyday lives of people success is about living long and
healthy lives, while feeling safe, and having freedom to make life choices without restrictions.
This is yet another piece of evidence that a model of development based solely on economic
performance is incomplete.
Nations across the world need to focus on fulfilling the needs of their citizens, i.e., providing
them with adequate food, addressing security concerns, developing a public healthcare system,
building a society that is free from biases. For such an approach to inclusive development, the
world needs a measurement model that moves beyond the idea of GDP; a framework that can
equip leaders and change makers to make social progress more integral to national
performance.

SOCIAL PROGRESS INDEX: STATES OF INDIA
Page 7
THE SOCIAL PROGRESS INDEX
The Social Progress Index focuses on what matters to societies and people by giving them the tools to
better understand and seize opportunities and building blocks to enhance and sustain the quality of their
lives, and create the conditions to reach their full potential.
It was developed in collaboration with a team of scholars led by Professor Michael E. Porter of Harvard
Business School. National and city leaders across Latin America and the European Commission’s
Directorate General for Regional and Urban Policy are using the index for agenda setting, policymaking,
and prioritizing how to mobilize resources and measure impact.
FRAMEWORK OF THE INDEX
Guided by a group of academic and policy experts, the Social Progress Index follows a conceptual
framework that defines social progress as well as its key elements. In this context, social progress is
defined as the “capacity of a society to meet the basic human needs of its citizens, establish the
building blocks that allow citizens and communities to enhance and sustain the quality of their lives,
and create the conditions for all individuals to reach their full potential.”
The framework outlines three broad categories of social progress, referred to as dimensions, emerging
from the above definition of social progress:
● Basic Human Needs;
● Foundations of Wellbeing; and
● Opportunity.
Each of these dimensions is further broken down into four underlying components (see Figure 2).
The most important step in designing the index is to select the appropriate indicator set that represents
the components under each dimension. Apart from the criteria that the data should be publicly available,
principles of the index guide the choice of a relevant set of indicators. The set of unique design
principles that allow an exclusive analysis of social progress and help the Index stand out from other
indices are:
● including social and environmental indicators only;
● measuring outcomes, not inputs3;
● relevant to all societies;
● an actionable tool to drive change.
3 The index does not consider input indicators, such as spending on a particular policy area, such as education, or healthcare.

SOCIAL PROGRESS INDEX: STATES OF INDIA
Page 8
Figure 2: Social Progress Index Framework
The Index represents the first comprehensive framework for measuring social progress that is independent
of economic performance. As a complement to traditional measures of economic performance, such as
income, the Social Progress Index provides a better understanding of the relationship between economic
gain and social progress. In contrast, other indices such as the Human Development Index combine
economic and social indicators. Our objective is to utilize a clear yet rigorous methodology that isolates
the non-economic dimensions of social performance.
The Index offers a systematic, empirical foundation for governments, businesses, civil society and
communities to prioritise social and environmental issues, and benchmark performance against other
countries, regions, cities and communities to inform and drive public policies, investments, and business and
community decisions.

SOCIAL PROGRESS INDEX: STATES OF INDIA
Page 9
SOCIAL PROGRESS INDEX: CAPTURING THE SPIRIT OF THE SDGS
The Sustainable Development Goals (SDGs) are an ambitious commitment by the world’s leaders to
improve the wellbeing of the world’s citizens and ensure environmental sustainability by 2030. One
hundred and sixty-nine targets grouped in 17 goals set out a universal and an unprecedented agenda
which embraces economic, environmental and social aspects of the wellbeing of societies.
However, it also poses a difficult challenge of defining and measuring success. With 17 goals, 169
targets and 230 indicators the SDGs might perhaps be difficult to grasp, understand, and of course,
difficult to measure. Therefore, a framework which can allow anyone to capture the totality of the
SDGs—improved wellbeing and advanced environmental sustainability—while not dwelling on the
individual details of every indicator is the need. A framework that can be understood and used by
everyone—policymakers, businesses, civil society and the general public.
The Social Progress Index offers such a well suited rapid-assessment approach to help capture the spirit
of the SDGs. Unlike the SDGs, which are by definition a list of goals rather a conceptual model, the
Social Progress Index has been designed and tested over a number years to provide an aggregate
assessment of performance. Having a general framework that can be aggregated in a single number
that can be tracked over time is useful as it can enhance public understanding and engagement. There is
a strong coherence between the SDGs and the Social Progress Index (Figure 3). It can, therefore, support
SDG implementation playing a complementary role to the official monitoring systems that are being put
in place. It may be instrumental for the nation as a whole as well as individual states and territories in
achieving their SDGs targets.
Figure 3: SDGs and Social Progress Index
NutritionandBasicMedical
Care
WaterandSanitation
Shelter
Personal
Safety
PersonalRights
PersonalFreedomandChoice
Tolerance
andInclusion
AccesstoAdvancedEducation
AccesstoBasicKnowledge
AccesstoInformation
HealthandWellness
Environ-mentalQuality

SOCIAL PROGRESS INDEX: STATES OF INDIA
Page 10
SOCIAL PROGRESS INDEX: FACILITATING CSR INVESTMENTS
The idea of Corporate Social Responsibility (CSR) is not new to the Indian companies. Previously, CSR in
India was seen as a philanthropic activity. It was an action that was performed by many businesses, but
the impact was not measured. However, as the idea gained momentum globally, many companies started
reporting their activities.
Still the need was felt to bring a set of large businesses under the umbrella of CSR. The Companies Act in
2013 formally introduced Corporate Social Responsibility guidelines which made it mandatory for
certain companies to spend at least 2 percent of their average net profits.
Figure 4: CSR and Social Progress Index
However, the statistics indicate that more than 50 % of the firms fail to do so. The primary reason that
stands out for non-compliance with the law is the unawareness regarding which areas to invest in. The
Social Progress Index address that challenge by bringing out insights about the needs of the people in
different regions. It can thus be helpful for the companies to identify key focus areas where investments
can be made (see Figure 4 for CSR and Social Progress Index mapping).

SOCIAL PROGRESS INDEX: STATES OF INDIA
Page 11
SOCIAL PROGRESS INDEX, STATES OF INDIA: RESULTS
Based on extensive research and consultation with relevant stakeholders, we propose a framework for
measuring Social Progress Index for the States of India, as presented in Figure 5. It includes 54 indicators
which based on publically available sources of public authorities.
Figure 5: Social Progress Index, States of India Indicator Framework

SOCIAL PROGRESS INDEX: STATES OF INDIA
Page 12
COUNTRY-LEVEL ANALYSIS
The consolidation of the state-level results4 helps in assessing India’s national performance across all
aspects of social progress. This provides an opportunity to identify components that are more advanced
than others, which can help inform nationwide policies, strategies, and actions.
Overall, on a scale 0-100 (0 worst case scenario, 100 best case scenario) the country scores 54.90 on
the Social Progress Index. Breaking down this average across dimensions and components, we find that
there is wide variation in the country’s performance across different facets of social progress (Figure 6).
At the dimension level, the country scores highest at 63.06 on Basic Human Needs, followed by 52.34 on
Foundations of Wellbeing, and lowest at 49.31 on Opportunity.
Figure 6: Social Progress Index, States of India: Country-Level Analysis
Basic Human Needs capture the aspects of social progress that are vital for human survival. Closer
analysis of the four components that form the dimension—Nutrition & Basic Medical Care, Shelter, Water
& Sanitation, and Personal Safety—reveals that three of them score above the national average, while
Nutrition & Basic Medical Care seems to be lagging. At the component level, the country performs best on
Water & Sanitation (84.37). This reflects important progress in an area that has been a focus of the
Global Goals as well as the Indian Government. Nutrition & Basic Medical Care (44.64) seems to be the
greatest challenge that the nation needs to address. The high levels of mortality and low levels of
children’s nutrition are issues that need immediate attention.
4 A measure of the country’s average level of social progress is developed by weighting each state’s score by population and summing across all states. The results different to the Global Social Progress

SOCIAL PROGRESS INDEX: STATES OF INDIA
Page 13
Foundations of Wellbeing encompasses the services that help citizens in improving their quality of life.
Among the four components that form the dimension—Access to Basic Knowledge, Access to Information &
Communication, Health & Wellness, and Environmental Quality—the scores are lowest in Access to
Information & Communication (35.41). This is due to low access to television and the internet in the
country. The states perform best on Health & Wellness (68.89), but the analysis also reveals that obesity
is a growing issue in India. Out of 29 regions under study, 11 have average obesity rates of more than
20%. The nation needs to address this concern soon.
Opportunity encompasses Personal Rights, Personal Freedom and Choice, Inclusion, and Access to
Advanced Education. The lowest performing area is Access to Advanced Education (37.25). The
advanced education ecosystem in India has a lot of challenges that are clearly reflected by the low
average scores. The gross enrolment ratio in higher education is not only less than that of developed
economies (less USA) but also than developing economies like China. The best performance in the
dimension is achieved by the states in securing the freedom of citizens (67.12).
STATE-LEVEL ANALYSIS
ABSOLUTE ANALYSIS The absolute analysis presents the state scores at the overall, dimension and the component level scaled
from 0 to 100, with 100 being the score for the best-case scenario, and 0 the worst case. This helps in
comparing and ranking of states.
India’s states’ scores (see Table 1) range from a high of 60 to a low of 40. The results show that while
there are considerable differences between states, there are no significant over- or underperforming
outliers. Even though the scores are tightly clustered between 44.89 and 68.09, there is immense scope of
improvement.
Table 1: Social Progress Index, States of India, 2016 results
State Score
Andhra Pradesh 56.13
Arunachal Pradesh 55.24
Assam 48.53
Bihar 44.89
Chhattisgarh 56.69
Delhi 60.17
Goa 63.39
Gujarat 56.65
Haryana 57.37
Himachal Pradesh 65.39
Jammu & Kashmir 55.41
Jharkhand 47.80
Karnataka 59.72
SOCIAL PROGRESS INDEX: STATES OF INDIA
Page 14
Kerala 68.09
Madhya Pradesh 55.03
Maharashtra 57.88
Manipur 55.50
Meghalaya 53.51
Mizoram 62.89
Nagaland 56.76
Odisha 51.64
Punjab 62.18
Rajasthan 52.31
Sikkim 62.72
Tamil Nadu 65.34
Tripura 53.22
Uttar Pradesh 50.96
Uttarakhand 64.23
West Bengal 54.37
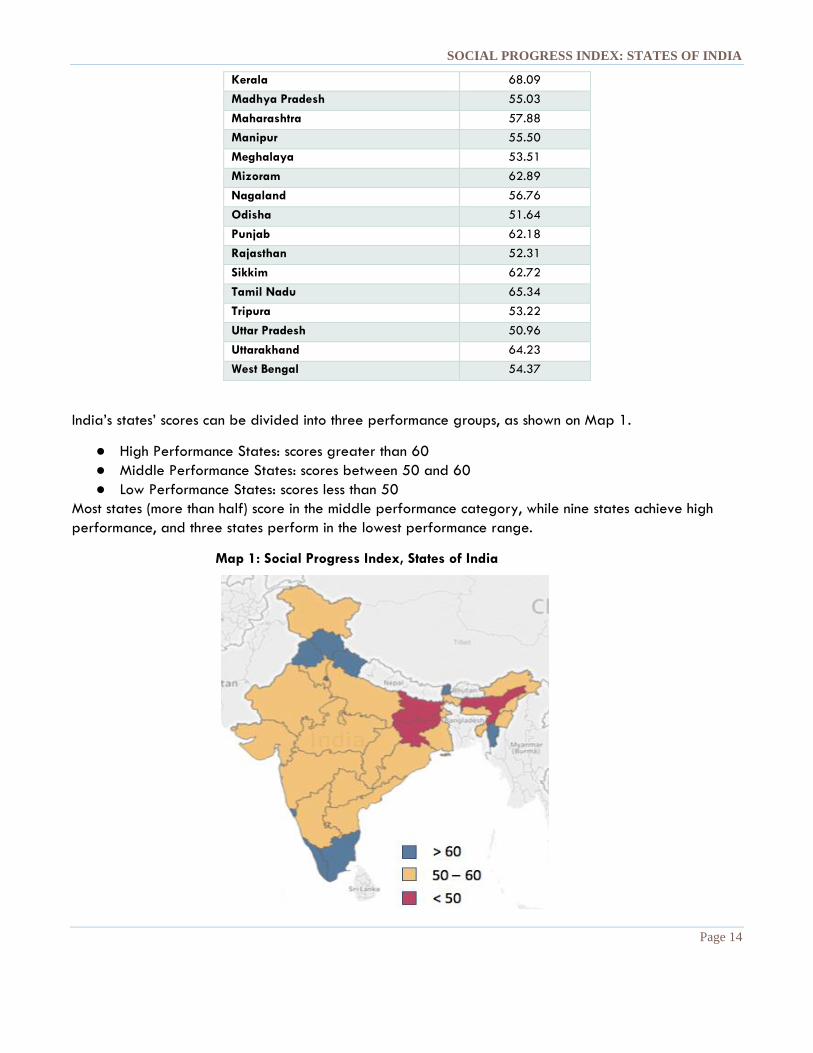
India’s states’ scores can be divided into three performance groups, as shown on Map 1.
● High Performance States: scores greater than 60
● Middle Performance States: scores between 50 and 60
● Low Performance States: scores less than 50
Most states (more than half) score in the middle performance category, while nine states achieve high
performance, and three states perform in the lowest performance range.
Map 1: Social Progress Index, States of India

SOCIAL PROGRESS INDEX: STATES OF INDIA
Page 15
A better picture of the level of progress is ascertained by analysing the dimension- and component-level
scores of the Social Progress Index, States of India presented in Table 2.
Table 2: Social Progress Index, States of India, Dimension- & Component-Level Scores
Note: Colouring of the table is based on the level of performance (scores) on Social Progress Index, its
dimensions and components. Green signifies high performance; yellow represents average, and red low
performance.
DIMENSION DIMENSION DIMENSION
States
Basic Human
Needs
Nutrition
& Basic
Medical
Care
Water &
Sanitatio
n Shelter
Personal
Safety
Foundations
of wellbeing
Access to
Knowled
ge
Access to
Informati
on &
Communi
cation
Health &
Wellness
Environm
ental
Quality Opportunity
Personal
Rights
Personal
Freedom
& Choice Inclusion
Access to
Advance
d
Educatio
nAndhra Pradesh 67.9618325 48.59736 74.0944 76.82709 72.32848 50.3485313 61.59442 40.46536 55.7262 43.60815 50.0734 66.55306 53.07619 42.52853 38.13582Arunachal Pradesh 57.410665 56.75748 71.59849 55.46412 45.82257 61.5779875 70.26563 29.23167 73.11054 73.70411 46.72096 50.90765 64.88482 44.18909 26.90228Assam 52.224005 47.91103 84.35249 34.40035 42.23215 54.696765 71.51325 17.84436 73.5209 55.90855 38.6549425 28.63632 70.71174 31.748 23.52371Bihar 52.728305 34.64409 81.27919 34.62123 60.36871 47.244365 55.35455 16.1483 72.1703 45.30431 34.7083025 32.55895 61.3979 32.95998 11.91638Chhattisgarh 63.1921275 44.72628 90.08514 58.74404 59.21305 51.959375 78.97866 30.57385 58.87414 39.41085 54.931865 63.9407 78.94313 48.0329 28.81073Delhi 62.918105 51.48847 90.21744 77.85752 32.10899 60.2513823 85.21506 76.82406 69.68323 9.283179 57.3408225 47.37616 79.09945 60.92397 41.96371Goa 76.6051925 62.80025 95.07322 81.45081 67.09649 55.4150888 91.18703 45.36218 58.0147 27.09645 58.1506 41.15385 68.35232 68.19209 54.90414Gujarat 73.294165 43.64156 92.59438 77.09358 79.84714 49.4318775 61.64482 44.16376 67.44236 24.47657 47.210355 52.61173 63.65639 32.64253 39.93077Haryana 64.2219275 43.09155 90.79107 69.96865 53.03644 53.2498025 63.8117 43.60931 75.11195 30.46625 54.63848 54.30895 79.04056 37.98692 47.21749Himachal Pradesh 68.071095 53.94114 64.17943 83.16927 70.99454 62.7215125 79.79337 52.5952 70.54385 47.95363 65.374825 56.23657 84.42144 56.0326 64.80869Jammu and Kashmir 61.1889 58.87211 65.02818 57.79733 63.05798 56.16571 53.17607 34.69018 80.91784 55.87875 48.8640825 55.78978 72.46214 32.35791 34.8465Jharkhand 56.0955675 32.09341 86.13969 48.71175 57.43742 46.9843913 62.40006 28.79424 75.66565 21.07762 40.33156 37.90145 65.11141 40.84197 17.47141Karnataka 65.6432225 48.60065 75.49776 71.06361 67.41087 55.9803213 75.25443 45.37072 63.21533 40.08081 57.54136 58.80406 53.22332 59.08414 59.05392Kerala 73.7788225 74.72464 79.58531 75.82936 64.97598 65.4191775 87.3221 54.70249 62.96911 56.68301 65.0768 60.70114 87.47211 58.76105 53.3729Madhya Pradesh 59.138845 29.79074 85.09184 61.59135 60.08145 53.9837975 66.83878 33.24579 70.9071 44.94352 51.9808625 56.00402 70.32619 41.56519 40.02805Maharashtra 70.7404 54.01147 90.00729 72.6702 66.27264 54.3244175 74.3047 46.61029 66.09577 30.28691 48.5810225 41.42377 59.63739 46.36344 46.89949Manipur 65.876445 76.20707 64.25451 60.8292 62.215 57.889025 76.14439 31.02842 69.92867 54.45462 42.7332825 32.98528 63.35987 32.48891 42.09907Meghalaya 52.6189675 48.1591 48.17204 57.3995 56.74523 61.8204825 77.20261 26.79726 77.31764 65.96442 46.09954 37.53439 65.72868 44.50663 36.62846Mizoram 71.02099 71.44125 79.19934 71.4163 62.02707 61.3200938 78.29114 33.87453 69.02246 64.09225 56.343425 71.46137 71.52077 49.35231 33.03925Nagaland 66.56538 73.07728 65.32644 55.32871 72.52909 55.60885 75.44963 28.01301 71.63363 47.33913 48.1170225 61.1074 66.70491 30.69154 33.96424Odisha 55.4407575 45.23007 80.88775 41.38429 54.26092 50.9789463 71.76331 21.08379 68.99971 42.06898 48.4986175 42.83357 75.56819 42.07465 33.51806Punjab 68.605585 57.522 86.65417 62.69906 67.54711 59.1424075 67.69781 56.84436 72.51109 39.51637 58.80029 66.81938 74.6296 41.58145 52.17073Rajasthan 59.11453 36.42887 76.40203 60.94159 62.68563 42.8418825 44.44722 31.88585 79.21125 15.82321 54.96412 59.90756 71.83593 43.98721 44.12578Sikkim 69.8630075 60.55199 67.16835 72.18298 79.54871 59.1655338 72.34893 38.3014 61.61645 64.39536 59.136225 72.94874 66.79859 54.43111 42.36646Tamil Nadu 76.25714 62.24794 91.28109 79.21461 72.28492 58.842115 75.10809 54.66309 61.16896 44.42832 60.92234 73.18471 61.66653 55.0685 53.76962Tripura 60.2873925 56.99293 69.05264 55.89442 59.20958 55.5574138 78.49772 30.68659 75.14913 37.89622 43.8190375 43.01923 69.81598 39.93658 22.50436Uttar Pradesh 57.930505 31.51614 93.3008 37.38005 69.52503 47.4112725 54.39805 25.62293 71.8954 37.72871 47.5306225 37.39493 71.57616 46.32146 34.82994Uttarakhand 67.5702125 44.83857 78.07775 76.20921 71.15532 66.41837 78.59201 47.94035 81.99058 57.15054 58.699315 66.04436 72.55401 43.08721 53.11168West Bengal 62.4568 53.29047 76.96689 51.30235 68.26749 58.0386388 74.54243 28.04283 69.95758 59.61172 42.6166375 35.81512 70.47006 43.42148 20.75989
SOCIAL PROGRESS INDEX, STATES OF INDIA: DIMENSION AND COMPONENT SCORES
COMPONENT COMPONENT COMPONENT
SOCIAL PROGRESS INDEX: STATES OF INDIA
Page 16
RELATIVE ANALYSIS The results that are presented in the absolute analysis do not distinguish states on the basis of economic
development. In some cases, it is more helpful to compare a state’s performance with its economic peers.
For instance, a state may score low on certain aspects of the social progress, but its performance could
exceed the scores for states with similar per capita income levels.
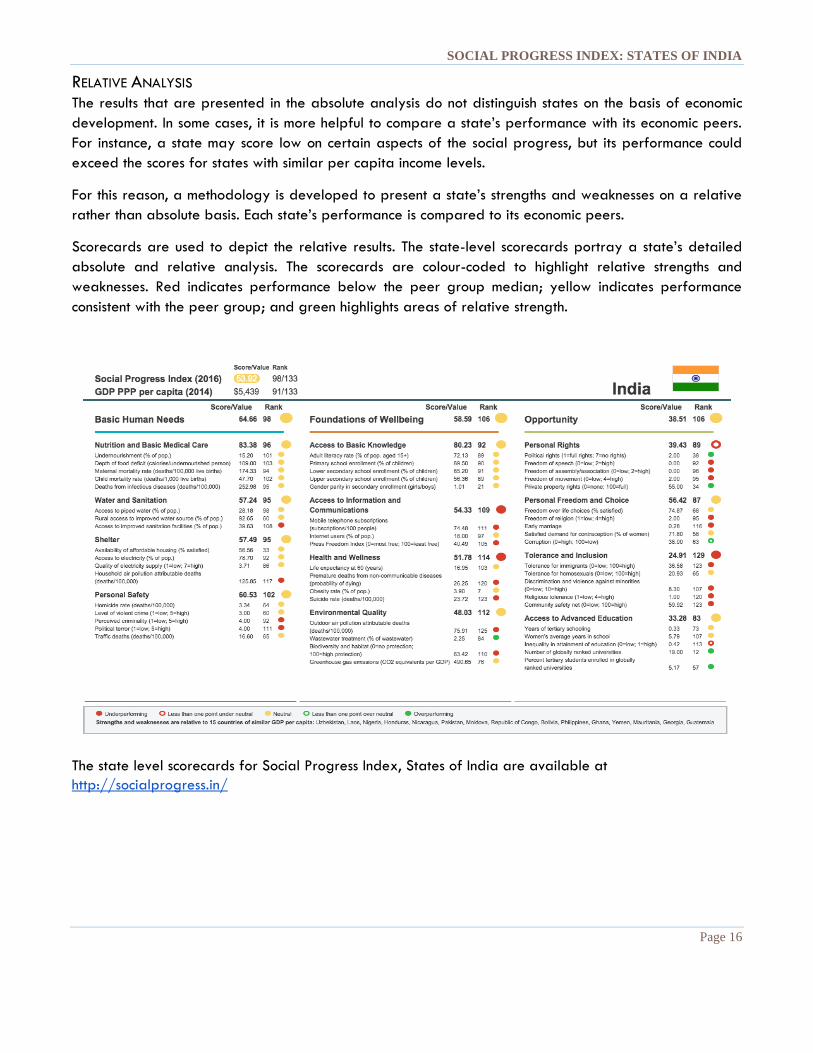
For this reason, a methodology is developed to present a state’s strengths and weaknesses on a relative
rather than absolute basis. Each state’s performance is compared to its economic peers.
Scorecards are used to depict the relative results. The state-level scorecards portray a state’s detailed
absolute and relative analysis. The scorecards are colour-coded to highlight relative strengths and
weaknesses. Red indicates performance below the peer group median; yellow indicates performance
consistent with the peer group; and green highlights areas of relative strength.
The state level scorecards for Social Progress Index, States of India are available at
http://socialprogress.in/

SOCIAL PROGRESS INDEX: STATES OF INDIA
Page 17
SOCIAL PROGRESS & ECONOMIC DEVELOPMENT: DEMYSTIFYING THE RELATIONSHIP
One of the primary objectives of the Social Progress Index, States of India is to provide an
understanding of the relationship between social and economic progress. The Social Progress Index
allows, for the first time, an analysis of the relationship between social progress and measures of
economic success. By measuring social progress independent of economic indicators, it provides empirical
evidence of the relationship of the two and helps in understanding whether economic performance is
being transformed into social progress or not.
Figure 7: Social Progress and Economic Development
Figure 7 shows that economic performance is not the whole story and should not be the ultimate goal.
While there is a relationship between economic development and social progress, the relationship is not
a direct one. For any level of economic development, there are states performing better or worse on
social progress.
This provides us with three key findings:
First, there is a positive and strong relationship between NSDP (Net State Domestic Product5) per capita
and the Social Progress Index. For instance, Bihar with a per capita NSDP of 15,506 scores 44.89 on the
Social Progress Index, States of India. On the other hand, Goa with NSDP per capita of 137,401 has a
5 The estimate of net state domestic product is arrived at by deducting the consumption of fixed capital from the
gross state domestic product for each sector.

SOCIAL PROGRESS INDEX: STATES OF INDIA
Page 18
Social Progress Index score of 63.39. At an aggregate level, a one percent increase in NSDP per capita
is associated with a 0.08-point increase in Social Progress Index score6.
Second, the relationship between social progress and NSDP (economic development) is not linear. At
lower levels of income, a small change in NSDP leads to great advancements in social progress scores.
However, as income levels rise, the rate of change slows.
Third, despite the correlation between NSDP per capita and the Social Progress Index, a considerable
amount of variability in social progress is observed among states with comparable levels of NSDP per
capita. Hence, economic performance alone does not fully explain social progress. This fact, which was
empirically established by the Global Social Progress Index holds true for the Indian states as well.
● Chhattisgarh attains a higher social progress score (56.69) than Rajasthan with a NSDP per
capita (28,373) lower than the latter. Rajasthan with a per capita NSDP of 31,836 scores 52.31
on social progress.
● Manipur and Maharashtra have a difference of two points on social progress when the former
belongs to the category of low-income states while Maharashtra has one of the highest per capita
incomes in the country.
● Despite not achieving highest NSDP levels, Kerala achieves the highest score on social progress,
while Goa and Delhi, the richest states (measured by NSDP), perform worse.
The evidence supports the conclusion that economic measures cannot be the sole driving force of inclusive
growth: it is important to focus on the social aspects as well. The Social Progress Index India provides the
tools to assess, track, and monitor social progress in order to better understand the performance, to be
able to identify and emulate best practices that can inform national as well as state-level policies.
SOCIAL PROGRESS INDEX AND INCOME: DIMENSION-LEVEL RELATIONSHIP
The relationship between social progress and economic development can be further examined at the
dimension level to understand better how different aspects of social progress vary with economic
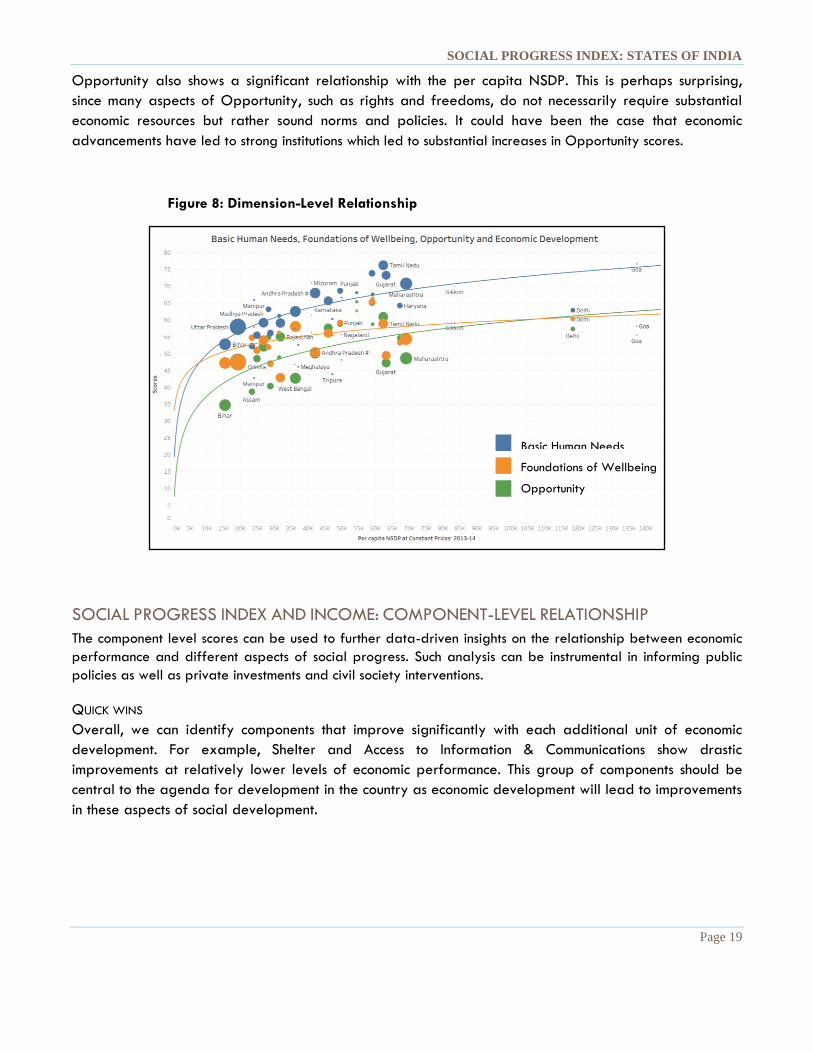
development (see Figure 8).
Again, a logarithmic model is established for Basic Human Needs, Foundations of Wellbeing, and
Opportunity. The model predicts that NSDP per capita explains 52 %, 19 % and 40 % of the variation
in Basic Human Needs, Foundations of Wellbeing and Opportunity scores respectively.
In real terms, this means that a small improvement in NSDP per capita yields higher gains in achieving
basic human needs for all.
Foundations of Wellbeing has the least correlation with NSDP per capita. The likely reason being that
two of the four components in this Dimension - Health and Wellness and Environmental quality, have
either no or even negative relationship with NSDP per capita.
6 The model has an R-squared value of 0.54 i.e. only 54% of the changes in social progress can be explained by the NSDP
per capita.
SOCIAL PROGRESS INDEX: STATES OF INDIA
Page 19
Opportunity also shows a significant relationship with the per capita NSDP. This is perhaps surprising,
since many aspects of Opportunity, such as rights and freedoms, do not necessarily require substantial
economic resources but rather sound norms and policies. It could have been the case that economic
advancements have led to strong institutions which led to substantial increases in Opportunity scores.
Figure 8: Dimension-Level Relationship
SOCIAL PROGRESS INDEX AND INCOME: COMPONENT-LEVEL RELATIONSHIP
The component level scores can be used to further data-driven insights on the relationship between economic
performance and different aspects of social progress. Such analysis can be instrumental in informing public
policies as well as private investments and civil society interventions.
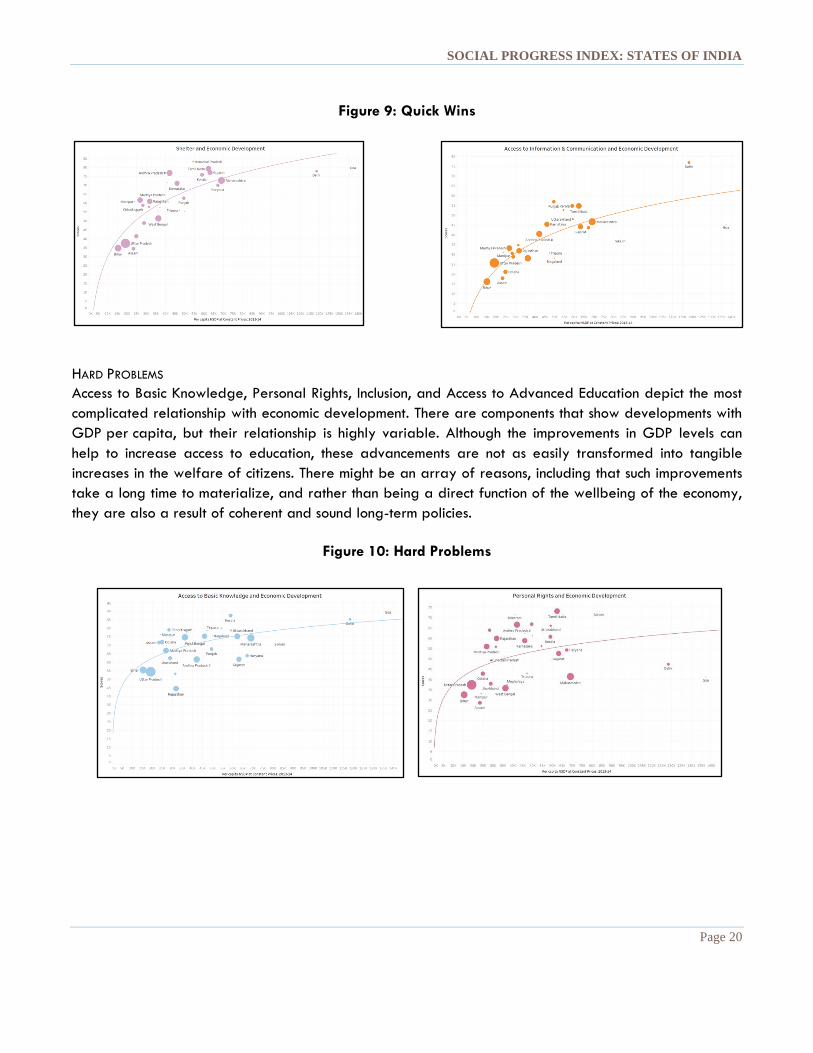
QUICK WINS
Overall, we can identify components that improve significantly with each additional unit of economic
development. For example, Shelter and Access to Information & Communications show drastic
improvements at relatively lower levels of economic performance. This group of components should be
central to the agenda for development in the country as economic development will lead to improvements
in these aspects of social development.
Basic Human Needs
Foundations of Wellbeing
Opportunity
SOCIAL PROGRESS INDEX: STATES OF INDIA
Page 20
Figure 9: Quick Wins
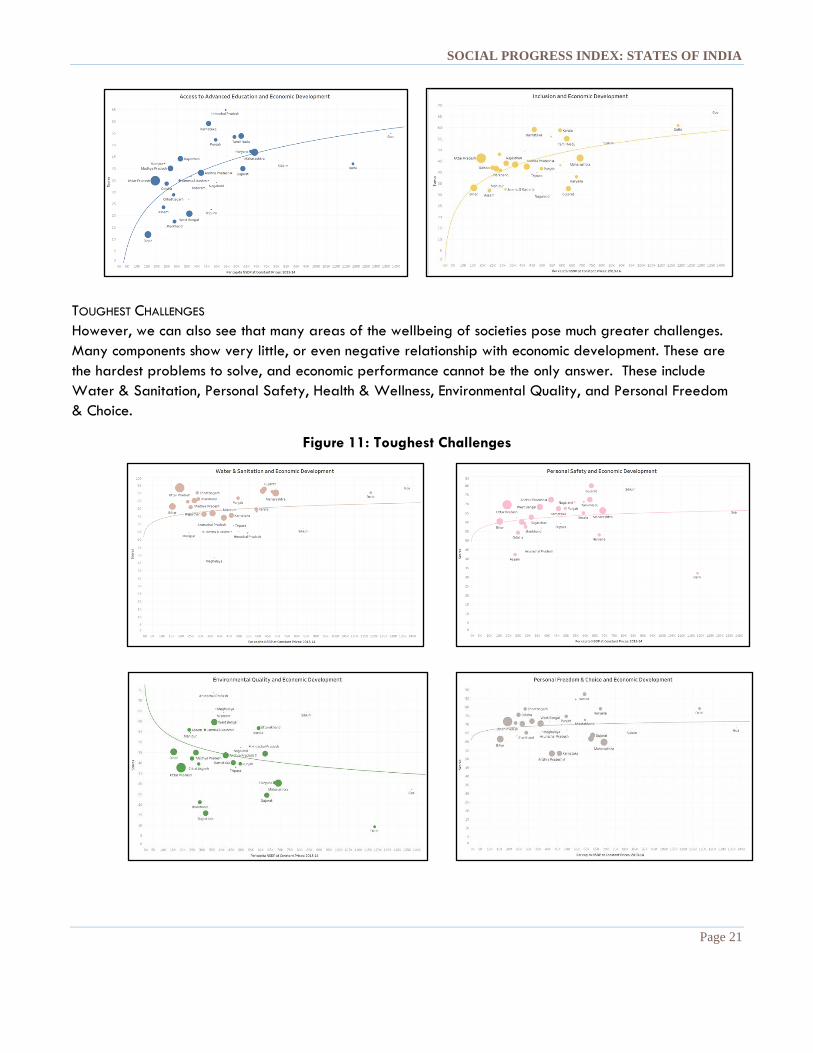
HARD PROBLEMS
Access to Basic Knowledge, Personal Rights, Inclusion, and Access to Advanced Education depict the most
complicated relationship with economic development. There are components that show developments with
GDP per capita, but their relationship is highly variable. Although the improvements in GDP levels can
help to increase access to education, these advancements are not as easily transformed into tangible
increases in the welfare of citizens. There might be an array of reasons, including that such improvements
take a long time to materialize, and rather than being a direct function of the wellbeing of the economy,
they are also a result of coherent and sound long-term policies.
Figure 10: Hard Problems
SOCIAL PROGRESS INDEX: STATES OF INDIA
Page 21
TOUGHEST CHALLENGES
However, we can also see that many areas of the wellbeing of societies pose much greater challenges.
Many components show very little, or even negative relationship with economic development. These are
the hardest problems to solve, and economic performance cannot be the only answer. These include
Water & Sanitation, Personal Safety, Health & Wellness, Environmental Quality, and Personal Freedom
& Choice.
Figure 11: Toughest Challenges

SOCIAL PROGRESS INDEX: STATES OF INDIA
Page 22

SOCIAL PROGRESS INDEX: STATES OF INDIA
Page 23
LONGITUDINAL ANALYSIS
One of the main objectives of this study is to provide a model to measure regional social progress
overtime. Longitudinal analysis is important as it helps in analysing whether the developments of states on
social and economic indicators are heading in the right direction. Such information is essential for
adjusting policies, as well as public and private investments. Especially in light of the SDGs, tracking
progress on societies’ wellbeing will be fundamental in the next decade. If India is going to achieve the
goals set out in this ambitious agenda, it needs a tool designed to measure progress for people.
This analysis will help in examining how the country has progressed over the years on different facets of
social progress leading to the following benefits:
● The analysis can be used to view a state’s performance overtime on the overall, dimension and
component level.
● This can help policy makers in understanding the impact of different policies and investments.
● The analysis is further enhanced by examining the changes in the average performances of the
states across peer groups.
For the period of 2005–2016 that we were able to measure, the results show that all states have
progressed. However, as shown in Figure 12, some states progressed more than others. On the one hand,
there are states like Rajasthan, Chhattisgarh, and Bihar that have advanced more than 25 %, and on the
other hand, Punjab, Delhi, and Assam have progressed less than 10 % on social progress scores.

SOCIAL PROGRESS INDEX: STATES OF INDIA
Page 24
Figure 12: Evolution of Social Progress Index, States of India 2005 – 2016
Figure 13 depicts the social progress and dimension scores for the timeframe 2005–2016. The social
advancements are clearly highlighted by the rising scores which are mainly driven by performance on
Basic Human Needs.
It is also noteworthy to highlight the progress made in the last years in the Basic Human Needs and
Opportunity dimensions.

SOCIAL PROGRESS INDEX: STATES OF INDIA
Page 25
Figure 13: Longitudinal Analysis – Social Progress Index, States of India
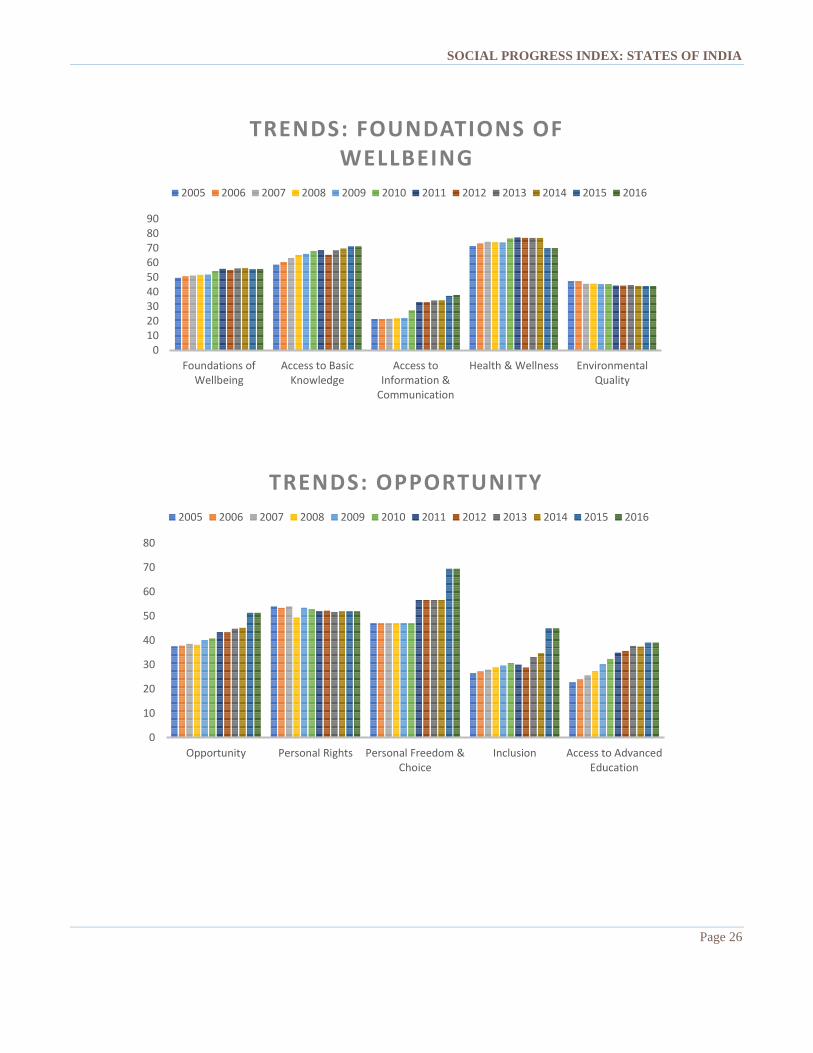
Further insights about how the country has progressed since 2005 are highlighted in Figure 14.
Figure 14: Longitudinal Analysis – Dimensions and Components
0
20
40
60
80
Social Progress Index Basic Human Needs Foundations ofWellbeing
Opportunity
TRENDS:SOCIAL PROGRESS INDEX, STATES OF INDIA AND ITS
DIMENSIONS
2005 2006 2007 2008 2009 2010 2011 2012 2013 2014 2015 2016
0
10
20
30
40
50
60
70
80
90
Basic HumanNeeds
Nutrition & BasicMedical Care
Water & Sanitation Shelter Personal Safety
TRENDS: BASIC HUMAN NEEDS
2005 2006 2007 2008 2009 2010 2011 2012 2013 2014 2015 2016
SOCIAL PROGRESS INDEX: STATES OF INDIA
Page 26
0102030405060708090
Foundations ofWellbeing
Access to BasicKnowledge
Access toInformation &
Communication
Health & Wellness EnvironmentalQuality
TRENDS: FOUNDATIONS OF WELLBEING
2005 2006 2007 2008 2009 2010 2011 2012 2013 2014 2015 2016
0
10
20
30
40
50
60
70
80
Opportunity Personal Rights Personal Freedom &Choice
Inclusion Access to AdvancedEducation
TRENDS: OPPORTUNITY
2005 2006 2007 2008 2009 2010 2011 2012 2013 2014 2015 2016
SOCIAL PROGRESS INDEX: STATES OF INDIA
Page 27
CONCLUSION
The Social Progress Index helps in identifying and prioritizing issues by measuring both a state’s
absolute performance as well as its performance relative to states at a similar level of per capita income.
These absolute and relative results enable states to not only assess their areas of strengths and
weaknesses but also to identify other states that may serve as role models, and prioritize actions
accordingly.
The performance of high (low) social progress states is not necessarily high (low) on all facets of
social progress. The top-ranking states Goa, Tamil Nadu, and Kerala show that high levels of social
progress are possible, however, even these states have their lows. Thus, it becomes important for states to
identify the most pressing issues and prioritize development agendas accordingly.
The Index provides valuable findings for two levels: state-specific and country-wide. On the one hand,
there are certain components on which all the states demonstrate low performance; on the other hand,
there are certain components on which variation is registered across states and where state governments
have to chalk out plans of action to drive improvements.
o State-specific Issues: Water & Sanitation, Shelter, Access to Information & Communication,
Health & Wellness, Personal Rights, and Personal Freedom & Choice.
o Country-wide Issues: Nutrition & Basic Medical Care, Personal Safety, Access to Basic
Knowledge, Environmental Quality, Inclusion, and Access to Advanced Education.
Economic performance alone does not fully explain social progress. Despite the correlation between
NSDP per capita and the Social Progress Index, States of India, a considerable amount of variability in
social progress is observed among states with comparable levels of GDP per capita.
The analysis of social progress over the years reveals that the average scores for the Indian states on the
Social Progress Index are tightly clustered between 48 and 57 for the period 2005–2016, reflecting
that the country has immense room for improvement.


