
VERiFiCATiON MANUALDesign Code Benchmarks
SOFiSTiK | 2018
VERiFiCATiON MANUAL
VERiFiCATiON MANUAL, Version 2018-4Software Version: SOFiSTiK 2018
Copyright © 2018 by SOFiSTiK AG, Oberschleissheim, Germany.
SOFiSTiK AG
HQ Oberschleissheim Office NurembergBruckmannring 38 Burgschmietstr. 40
85764 Oberschleissheim 90419 NurembergGermany Germany
T +49 (0)89 315878-0 T +49 (0)911 39901-0
F +49 (0)89 315878-23 F +49(0)911 397904
www.sofistik.com
This manual is protected by copyright laws. No part of it may be translated, copied or reproduced, in any form or by any means,without written permission from SOFiSTiK AG. SOFiSTiK reserves the right to modify or to release new editions of this manual.
The manual and the program have been thoroughly checked for errors. However, SOFiSTiK does not claim that either one iscompletely error free. Errors and omissions are corrected as soon as they are detected.
The user of the program is solely responsible for the applications. We strongly encourage the user to test the correctness of allcalculations at least by random sampling.
Front Cover
Project: New SOFiSTiK Office, Nuremberg | Contractor: WOLFF & MLLER, Stuttgart | Architecture: WABE-PLAN ARCHITEKTUR, Stuttgart |Structural Engineer: Boll und Partner. Beratende Ingenieure VBI, Stuttgart | MEP: GM Planen + Beraten, Griesheim | Lead Architect: Gerhard P.
Wirth gpwirtharchitekten, Nuremberg | Vizualisation: Armin Dariz, BiMOTiON GmbH
Contents
Contents
Introduction 3
1 About this Manual 31.1 Layout and Organization of a Benchmark .. . . . . . . . . . . . . . . . . . . . . . . . . . . . . . . . . . . . . . . . . . . . . 31.2 Finding the Benchmark of interest . . . . . . . . . . . . . . . . . . . . . . . . . . . . . . . . . . . . . . . . . . . . . . . . . . . . . . . 31.3 Symbols . . . . . . . . . . . . . . . . . . . . . . . . . . . . . . . . . . . . . . . . . . . . . . . . . . . . . . . . . . . . . . . . . . . . . . . . . . . . . . . . . . . . 5
2 Index by Categories 72.1 Design Code Benchmarks.. . . . . . . . . . . . . . . . . . . . . . . . . . . . . . . . . . . . . . . . . . . . . . . . . . . . . . . . . . . . . . . 7
I SOFiSTiK Software Quality Assurance (SQA) 9
3 SOFiSTiK SQA Policy 113.1 Objectives .. . . . . . . . . . . . . . . . . . . . . . . . . . . . . . . . . . . . . . . . . . . . . . . . . . . . . . . . . . . . . . . . . . . . . . . . . . . . . . . . . 11
3.1.1 About SOFiSTiK .. . . . . . . . . . . . . . . . . . . . . . . . . . . . . . . . . . . . . . . . . . . . . . . . . . . . . . . . . . . . . . . . . . . . . . . 113.1.2 Innovation and Reliability . . . . . . . . . . . . . . . . . . . . . . . . . . . . . . . . . . . . . . . . . . . . . . . . . . . . . . . . . . . . . . 11
3.2 Organisation .. . . . . . . . . . . . . . . . . . . . . . . . . . . . . . . . . . . . . . . . . . . . . . . . . . . . . . . . . . . . . . . . . . . . . . . . . . . . . . 113.2.1 Software Release Schedule . . . . . . . . . . . . . . . . . . . . . . . . . . . . . . . . . . . . . . . . . . . . . . . . . . . . . . . . . . . 113.2.2 SQA Modules - Classification .. . . . . . . . . . . . . . . . . . . . . . . . . . . . . . . . . . . . . . . . . . . . . . . . . . . . . . . . 123.2.3 Responsibilities . . . . . . . . . . . . . . . . . . . . . . . . . . . . . . . . . . . . . . . . . . . . . . . . . . . . . . . . . . . . . . . . . . . . . . . . . 123.2.4 Software Release Procedure .. . . . . . . . . . . . . . . . . . . . . . . . . . . . . . . . . . . . . . . . . . . . . . . . . . . . . . . . . 13
3.3 Instruments. . . . . . . . . . . . . . . . . . . . . . . . . . . . . . . . . . . . . . . . . . . . . . . . . . . . . . . . . . . . . . . . . . . . . . . . . . . . . . . . . 143.3.1 CRM System .. . . . . . . . . . . . . . . . . . . . . . . . . . . . . . . . . . . . . . . . . . . . . . . . . . . . . . . . . . . . . . . . . . . . . . . . . . . 143.3.2 Tracking System (internal) . . . . . . . . . . . . . . . . . . . . . . . . . . . . . . . . . . . . . . . . . . . . . . . . . . . . . . . . . . . . 143.3.3 Continuous Integration – Continuous Testing.. . . . . . . . . . . . . . . . . . . . . . . . . . . . . . . . . . . . . . . 14
3.4 Additional Provisions .. . . . . . . . . . . . . . . . . . . . . . . . . . . . . . . . . . . . . . . . . . . . . . . . . . . . . . . . . . . . . . . . . . . . . 153.4.1 Training.. . . . . . . . . . . . . . . . . . . . . . . . . . . . . . . . . . . . . . . . . . . . . . . . . . . . . . . . . . . . . . . . . . . . . . . . . . . . . . . . . . 153.4.2 Academia Network .. . . . . . . . . . . . . . . . . . . . . . . . . . . . . . . . . . . . . . . . . . . . . . . . . . . . . . . . . . . . . . . . . . . . 16
3.5 Disclaimer . . . . . . . . . . . . . . . . . . . . . . . . . . . . . . . . . . . . . . . . . . . . . . . . . . . . . . . . . . . . . . . . . . . . . . . . . . . . . . . . . . 16
II Design Code Benchmarks 17
4 DCE-EN1: Design of Slab for Bending 194.1 Problem Description.. . . . . . . . . . . . . . . . . . . . . . . . . . . . . . . . . . . . . . . . . . . . . . . . . . . . . . . . . . . . . . . . . . . . . . 194.2 Reference Solution .. . . . . . . . . . . . . . . . . . . . . . . . . . . . . . . . . . . . . . . . . . . . . . . . . . . . . . . . . . . . . . . . . . . . . . . 194.3 Model and Results . . . . . . . . . . . . . . . . . . . . . . . . . . . . . . . . . . . . . . . . . . . . . . . . . . . . . . . . . . . . . . . . . . . . . . . . 204.4 Design Process .. . . . . . . . . . . . . . . . . . . . . . . . . . . . . . . . . . . . . . . . . . . . . . . . . . . . . . . . . . . . . . . . . . . . . . . . . . . 214.5 Conclusion .. . . . . . . . . . . . . . . . . . . . . . . . . . . . . . . . . . . . . . . . . . . . . . . . . . . . . . . . . . . . . . . . . . . . . . . . . . . . . . . . 224.6 Literature .. . . . . . . . . . . . . . . . . . . . . . . . . . . . . . . . . . . . . . . . . . . . . . . . . . . . . . . . . . . . . . . . . . . . . . . . . . . . . . . . . . 22
5 DCE-EN2: Design of a Rectangular CS for Bending 235.1 Problem Description.. . . . . . . . . . . . . . . . . . . . . . . . . . . . . . . . . . . . . . . . . . . . . . . . . . . . . . . . . . . . . . . . . . . . . . 235.2 Reference Solution .. . . . . . . . . . . . . . . . . . . . . . . . . . . . . . . . . . . . . . . . . . . . . . . . . . . . . . . . . . . . . . . . . . . . . . . 235.3 Model and Results . . . . . . . . . . . . . . . . . . . . . . . . . . . . . . . . . . . . . . . . . . . . . . . . . . . . . . . . . . . . . . . . . . . . . . . . 24
SOFiSTiK 2018 | VERiFiCATiON MANUAL - Design Code Benchmarks i
Contents
5.4 Design Process .. . . . . . . . . . . . . . . . . . . . . . . . . . . . . . . . . . . . . . . . . . . . . . . . . . . . . . . . . . . . . . . . . . . . . . . . . . . 255.5 Conclusion .. . . . . . . . . . . . . . . . . . . . . . . . . . . . . . . . . . . . . . . . . . . . . . . . . . . . . . . . . . . . . . . . . . . . . . . . . . . . . . . . 275.6 Literature .. . . . . . . . . . . . . . . . . . . . . . . . . . . . . . . . . . . . . . . . . . . . . . . . . . . . . . . . . . . . . . . . . . . . . . . . . . . . . . . . . . 27
6 DCE-EN3: Design of a T-section for Bending 296.1 Problem Description.. . . . . . . . . . . . . . . . . . . . . . . . . . . . . . . . . . . . . . . . . . . . . . . . . . . . . . . . . . . . . . . . . . . . . . 296.2 Reference Solution .. . . . . . . . . . . . . . . . . . . . . . . . . . . . . . . . . . . . . . . . . . . . . . . . . . . . . . . . . . . . . . . . . . . . . . . 296.3 Model and Results . . . . . . . . . . . . . . . . . . . . . . . . . . . . . . . . . . . . . . . . . . . . . . . . . . . . . . . . . . . . . . . . . . . . . . . . 306.4 Design Process .. . . . . . . . . . . . . . . . . . . . . . . . . . . . . . . . . . . . . . . . . . . . . . . . . . . . . . . . . . . . . . . . . . . . . . . . . . . 326.5 Conclusion .. . . . . . . . . . . . . . . . . . . . . . . . . . . . . . . . . . . . . . . . . . . . . . . . . . . . . . . . . . . . . . . . . . . . . . . . . . . . . . . . 336.6 Literature .. . . . . . . . . . . . . . . . . . . . . . . . . . . . . . . . . . . . . . . . . . . . . . . . . . . . . . . . . . . . . . . . . . . . . . . . . . . . . . . . . . 33
7 DCE-EN4: Design of a Rectangular CS for Bending and Axial Force 357.1 Problem Description.. . . . . . . . . . . . . . . . . . . . . . . . . . . . . . . . . . . . . . . . . . . . . . . . . . . . . . . . . . . . . . . . . . . . . . 357.2 Reference Solution .. . . . . . . . . . . . . . . . . . . . . . . . . . . . . . . . . . . . . . . . . . . . . . . . . . . . . . . . . . . . . . . . . . . . . . . 357.3 Model and Results . . . . . . . . . . . . . . . . . . . . . . . . . . . . . . . . . . . . . . . . . . . . . . . . . . . . . . . . . . . . . . . . . . . . . . . . 367.4 Design Process .. . . . . . . . . . . . . . . . . . . . . . . . . . . . . . . . . . . . . . . . . . . . . . . . . . . . . . . . . . . . . . . . . . . . . . . . . . . 377.5 Conclusion .. . . . . . . . . . . . . . . . . . . . . . . . . . . . . . . . . . . . . . . . . . . . . . . . . . . . . . . . . . . . . . . . . . . . . . . . . . . . . . . . 387.6 Literature .. . . . . . . . . . . . . . . . . . . . . . . . . . . . . . . . . . . . . . . . . . . . . . . . . . . . . . . . . . . . . . . . . . . . . . . . . . . . . . . . . . 38
8 DCE-EN5: Design of a Rectangular CS for Double Bending and Axial Force 398.1 Problem Description.. . . . . . . . . . . . . . . . . . . . . . . . . . . . . . . . . . . . . . . . . . . . . . . . . . . . . . . . . . . . . . . . . . . . . . 398.2 Reference Solution .. . . . . . . . . . . . . . . . . . . . . . . . . . . . . . . . . . . . . . . . . . . . . . . . . . . . . . . . . . . . . . . . . . . . . . . 398.3 Model and Results . . . . . . . . . . . . . . . . . . . . . . . . . . . . . . . . . . . . . . . . . . . . . . . . . . . . . . . . . . . . . . . . . . . . . . . . 408.4 Design Process .. . . . . . . . . . . . . . . . . . . . . . . . . . . . . . . . . . . . . . . . . . . . . . . . . . . . . . . . . . . . . . . . . . . . . . . . . . . 428.5 Conclusion .. . . . . . . . . . . . . . . . . . . . . . . . . . . . . . . . . . . . . . . . . . . . . . . . . . . . . . . . . . . . . . . . . . . . . . . . . . . . . . . . 438.6 Literature .. . . . . . . . . . . . . . . . . . . . . . . . . . . . . . . . . . . . . . . . . . . . . . . . . . . . . . . . . . . . . . . . . . . . . . . . . . . . . . . . . . 43
9 DCE-EN6: Design of a Rectangular CS for Shear Force 459.1 Problem Description.. . . . . . . . . . . . . . . . . . . . . . . . . . . . . . . . . . . . . . . . . . . . . . . . . . . . . . . . . . . . . . . . . . . . . . 459.2 Reference Solution .. . . . . . . . . . . . . . . . . . . . . . . . . . . . . . . . . . . . . . . . . . . . . . . . . . . . . . . . . . . . . . . . . . . . . . . 459.3 Model and Results . . . . . . . . . . . . . . . . . . . . . . . . . . . . . . . . . . . . . . . . . . . . . . . . . . . . . . . . . . . . . . . . . . . . . . . . 469.4 Design Process .. . . . . . . . . . . . . . . . . . . . . . . . . . . . . . . . . . . . . . . . . . . . . . . . . . . . . . . . . . . . . . . . . . . . . . . . . . . 479.5 Conclusion .. . . . . . . . . . . . . . . . . . . . . . . . . . . . . . . . . . . . . . . . . . . . . . . . . . . . . . . . . . . . . . . . . . . . . . . . . . . . . . . . 489.6 Literature .. . . . . . . . . . . . . . . . . . . . . . . . . . . . . . . . . . . . . . . . . . . . . . . . . . . . . . . . . . . . . . . . . . . . . . . . . . . . . . . . . . 48
10 DCE-EN7: Design of a T-section for Shear 4910.1 Problem Description.. . . . . . . . . . . . . . . . . . . . . . . . . . . . . . . . . . . . . . . . . . . . . . . . . . . . . . . . . . . . . . . . . . . . . . 4910.2 Reference Solution .. . . . . . . . . . . . . . . . . . . . . . . . . . . . . . . . . . . . . . . . . . . . . . . . . . . . . . . . . . . . . . . . . . . . . . . 4910.3 Model and Results . . . . . . . . . . . . . . . . . . . . . . . . . . . . . . . . . . . . . . . . . . . . . . . . . . . . . . . . . . . . . . . . . . . . . . . . 5010.4 Design Process .. . . . . . . . . . . . . . . . . . . . . . . . . . . . . . . . . . . . . . . . . . . . . . . . . . . . . . . . . . . . . . . . . . . . . . . . . . . 5210.5 Conclusion .. . . . . . . . . . . . . . . . . . . . . . . . . . . . . . . . . . . . . . . . . . . . . . . . . . . . . . . . . . . . . . . . . . . . . . . . . . . . . . . . 5510.6 Literature .. . . . . . . . . . . . . . . . . . . . . . . . . . . . . . . . . . . . . . . . . . . . . . . . . . . . . . . . . . . . . . . . . . . . . . . . . . . . . . . . . . 55
11 DCE-EN8: Design of a Rectangular CS for Shear and Axial Force 5711.1 Problem Description.. . . . . . . . . . . . . . . . . . . . . . . . . . . . . . . . . . . . . . . . . . . . . . . . . . . . . . . . . . . . . . . . . . . . . . 5711.2 Reference Solution .. . . . . . . . . . . . . . . . . . . . . . . . . . . . . . . . . . . . . . . . . . . . . . . . . . . . . . . . . . . . . . . . . . . . . . . 5711.3 Model and Results . . . . . . . . . . . . . . . . . . . . . . . . . . . . . . . . . . . . . . . . . . . . . . . . . . . . . . . . . . . . . . . . . . . . . . . . 5811.4 Design Process .. . . . . . . . . . . . . . . . . . . . . . . . . . . . . . . . . . . . . . . . . . . . . . . . . . . . . . . . . . . . . . . . . . . . . . . . . . . 5911.5 Conclusion .. . . . . . . . . . . . . . . . . . . . . . . . . . . . . . . . . . . . . . . . . . . . . . . . . . . . . . . . . . . . . . . . . . . . . . . . . . . . . . . . 6111.6 Literature .. . . . . . . . . . . . . . . . . . . . . . . . . . . . . . . . . . . . . . . . . . . . . . . . . . . . . . . . . . . . . . . . . . . . . . . . . . . . . . . . . . 61
12 DCE-EN9: Design of a Rectangular CS for Shear and Torsion 6312.1 Problem Description.. . . . . . . . . . . . . . . . . . . . . . . . . . . . . . . . . . . . . . . . . . . . . . . . . . . . . . . . . . . . . . . . . . . . . . 6312.2 Reference Solution .. . . . . . . . . . . . . . . . . . . . . . . . . . . . . . . . . . . . . . . . . . . . . . . . . . . . . . . . . . . . . . . . . . . . . . . 63
ii VERiFiCATiON MANUAL - Design Code Benchmarks | SOFiSTiK 2018

Contents
12.3 Model and Results . . . . . . . . . . . . . . . . . . . . . . . . . . . . . . . . . . . . . . . . . . . . . . . . . . . . . . . . . . . . . . . . . . . . . . . . 6412.4 Design Process .. . . . . . . . . . . . . . . . . . . . . . . . . . . . . . . . . . . . . . . . . . . . . . . . . . . . . . . . . . . . . . . . . . . . . . . . . . . 6612.5 Conclusion .. . . . . . . . . . . . . . . . . . . . . . . . . . . . . . . . . . . . . . . . . . . . . . . . . . . . . . . . . . . . . . . . . . . . . . . . . . . . . . . . 6912.6 Literature .. . . . . . . . . . . . . . . . . . . . . . . . . . . . . . . . . . . . . . . . . . . . . . . . . . . . . . . . . . . . . . . . . . . . . . . . . . . . . . . . . . 69
13 DCE-EN10: Shear between web and flanges of T-sections 7113.1 Problem Description.. . . . . . . . . . . . . . . . . . . . . . . . . . . . . . . . . . . . . . . . . . . . . . . . . . . . . . . . . . . . . . . . . . . . . . 7113.2 Reference Solution .. . . . . . . . . . . . . . . . . . . . . . . . . . . . . . . . . . . . . . . . . . . . . . . . . . . . . . . . . . . . . . . . . . . . . . . 7113.3 Model and Results . . . . . . . . . . . . . . . . . . . . . . . . . . . . . . . . . . . . . . . . . . . . . . . . . . . . . . . . . . . . . . . . . . . . . . . . 7213.4 Design Process .. . . . . . . . . . . . . . . . . . . . . . . . . . . . . . . . . . . . . . . . . . . . . . . . . . . . . . . . . . . . . . . . . . . . . . . . . . . 7513.5 Conclusion .. . . . . . . . . . . . . . . . . . . . . . . . . . . . . . . . . . . . . . . . . . . . . . . . . . . . . . . . . . . . . . . . . . . . . . . . . . . . . . . . 7813.6 Literature .. . . . . . . . . . . . . . . . . . . . . . . . . . . . . . . . . . . . . . . . . . . . . . . . . . . . . . . . . . . . . . . . . . . . . . . . . . . . . . . . . . 78
14 DCE-EN11: Shear at the interface between concrete cast 7914.1 Problem Description.. . . . . . . . . . . . . . . . . . . . . . . . . . . . . . . . . . . . . . . . . . . . . . . . . . . . . . . . . . . . . . . . . . . . . . 7914.2 Reference Solution .. . . . . . . . . . . . . . . . . . . . . . . . . . . . . . . . . . . . . . . . . . . . . . . . . . . . . . . . . . . . . . . . . . . . . . . 7914.3 Model and Results . . . . . . . . . . . . . . . . . . . . . . . . . . . . . . . . . . . . . . . . . . . . . . . . . . . . . . . . . . . . . . . . . . . . . . . . 8014.4 Design Process .. . . . . . . . . . . . . . . . . . . . . . . . . . . . . . . . . . . . . . . . . . . . . . . . . . . . . . . . . . . . . . . . . . . . . . . . . . . 8214.5 Conclusion .. . . . . . . . . . . . . . . . . . . . . . . . . . . . . . . . . . . . . . . . . . . . . . . . . . . . . . . . . . . . . . . . . . . . . . . . . . . . . . . . 8514.6 Literature .. . . . . . . . . . . . . . . . . . . . . . . . . . . . . . . . . . . . . . . . . . . . . . . . . . . . . . . . . . . . . . . . . . . . . . . . . . . . . . . . . . 85
15 DCE-EN12: Crack width calculation of reinforced beam acc. DIN EN 1992-1-1 8715.1 Problem Description.. . . . . . . . . . . . . . . . . . . . . . . . . . . . . . . . . . . . . . . . . . . . . . . . . . . . . . . . . . . . . . . . . . . . . . 8715.2 Reference Solution .. . . . . . . . . . . . . . . . . . . . . . . . . . . . . . . . . . . . . . . . . . . . . . . . . . . . . . . . . . . . . . . . . . . . . . . 8715.3 Model and Results . . . . . . . . . . . . . . . . . . . . . . . . . . . . . . . . . . . . . . . . . . . . . . . . . . . . . . . . . . . . . . . . . . . . . . . . 8815.4 Design Process .. . . . . . . . . . . . . . . . . . . . . . . . . . . . . . . . . . . . . . . . . . . . . . . . . . . . . . . . . . . . . . . . . . . . . . . . . . . 9015.5 Conclusion .. . . . . . . . . . . . . . . . . . . . . . . . . . . . . . . . . . . . . . . . . . . . . . . . . . . . . . . . . . . . . . . . . . . . . . . . . . . . . . . . 9515.6 Literature .. . . . . . . . . . . . . . . . . . . . . . . . . . . . . . . . . . . . . . . . . . . . . . . . . . . . . . . . . . . . . . . . . . . . . . . . . . . . . . . . . . 95
16 DCE-EN13: Design of a Steel I-section for Bending and Shear 9716.1 Problem Description.. . . . . . . . . . . . . . . . . . . . . . . . . . . . . . . . . . . . . . . . . . . . . . . . . . . . . . . . . . . . . . . . . . . . . . 9716.2 Reference Solution .. . . . . . . . . . . . . . . . . . . . . . . . . . . . . . . . . . . . . . . . . . . . . . . . . . . . . . . . . . . . . . . . . . . . . . . 9716.3 Model and Results . . . . . . . . . . . . . . . . . . . . . . . . . . . . . . . . . . . . . . . . . . . . . . . . . . . . . . . . . . . . . . . . . . . . . . . . 9716.4 Design Process .. . . . . . . . . . . . . . . . . . . . . . . . . . . . . . . . . . . . . . . . . . . . . . . . . . . . . . . . . . . . . . . . . . . . . . . . . . . 9916.5 Conclusion .. . . . . . . . . . . . . . . . . . . . . . . . . . . . . . . . . . . . . . . . . . . . . . . . . . . . . . . . . . . . . . . . . . . . . . . . . . . . . . . . 10216.6 Literature .. . . . . . . . . . . . . . . . . . . . . . . . . . . . . . . . . . . . . . . . . . . . . . . . . . . . . . . . . . . . . . . . . . . . . . . . . . . . . . . . . . 103
17 DCE-EN14: Classification of Steel Cross-sections 10517.1 Problem Description.. . . . . . . . . . . . . . . . . . . . . . . . . . . . . . . . . . . . . . . . . . . . . . . . . . . . . . . . . . . . . . . . . . . . . . 10517.2 Reference Solution .. . . . . . . . . . . . . . . . . . . . . . . . . . . . . . . . . . . . . . . . . . . . . . . . . . . . . . . . . . . . . . . . . . . . . . . 10517.3 Model and Results . . . . . . . . . . . . . . . . . . . . . . . . . . . . . . . . . . . . . . . . . . . . . . . . . . . . . . . . . . . . . . . . . . . . . . . . 10617.4 Design Process .. . . . . . . . . . . . . . . . . . . . . . . . . . . . . . . . . . . . . . . . . . . . . . . . . . . . . . . . . . . . . . . . . . . . . . . . . . . 10817.5 Conclusion .. . . . . . . . . . . . . . . . . . . . . . . . . . . . . . . . . . . . . . . . . . . . . . . . . . . . . . . . . . . . . . . . . . . . . . . . . . . . . . . . 10917.6 Literature .. . . . . . . . . . . . . . . . . . . . . . . . . . . . . . . . . . . . . . . . . . . . . . . . . . . . . . . . . . . . . . . . . . . . . . . . . . . . . . . . . . 109
18 DCE-EN15: Buckling Resistance of Steel Members 11118.1 Problem Description.. . . . . . . . . . . . . . . . . . . . . . . . . . . . . . . . . . . . . . . . . . . . . . . . . . . . . . . . . . . . . . . . . . . . . . 11118.2 Reference Solution .. . . . . . . . . . . . . . . . . . . . . . . . . . . . . . . . . . . . . . . . . . . . . . . . . . . . . . . . . . . . . . . . . . . . . . . 11118.3 Model and Results . . . . . . . . . . . . . . . . . . . . . . . . . . . . . . . . . . . . . . . . . . . . . . . . . . . . . . . . . . . . . . . . . . . . . . . . 11218.4 Design Process .. . . . . . . . . . . . . . . . . . . . . . . . . . . . . . . . . . . . . . . . . . . . . . . . . . . . . . . . . . . . . . . . . . . . . . . . . . . 11318.5 Conclusion .. . . . . . . . . . . . . . . . . . . . . . . . . . . . . . . . . . . . . . . . . . . . . . . . . . . . . . . . . . . . . . . . . . . . . . . . . . . . . . . . 11418.6 Literature .. . . . . . . . . . . . . . . . . . . . . . . . . . . . . . . . . . . . . . . . . . . . . . . . . . . . . . . . . . . . . . . . . . . . . . . . . . . . . . . . . . 114
19 DCE-EN17: Stress Calculation at a Rectangular Prestressed Concrete CS 11519.1 Problem Description.. . . . . . . . . . . . . . . . . . . . . . . . . . . . . . . . . . . . . . . . . . . . . . . . . . . . . . . . . . . . . . . . . . . . . . 115
SOFiSTiK 2018 | VERiFiCATiON MANUAL - Design Code Benchmarks iii
Contents
19.2 Reference Solution .. . . . . . . . . . . . . . . . . . . . . . . . . . . . . . . . . . . . . . . . . . . . . . . . . . . . . . . . . . . . . . . . . . . . . . . 11519.3 Model and Results . . . . . . . . . . . . . . . . . . . . . . . . . . . . . . . . . . . . . . . . . . . . . . . . . . . . . . . . . . . . . . . . . . . . . . . . 11619.4 Design Process .. . . . . . . . . . . . . . . . . . . . . . . . . . . . . . . . . . . . . . . . . . . . . . . . . . . . . . . . . . . . . . . . . . . . . . . . . . . 11919.5 Conclusion .. . . . . . . . . . . . . . . . . . . . . . . . . . . . . . . . . . . . . . . . . . . . . . . . . . . . . . . . . . . . . . . . . . . . . . . . . . . . . . . . 12219.6 Literature .. . . . . . . . . . . . . . . . . . . . . . . . . . . . . . . . . . . . . . . . . . . . . . . . . . . . . . . . . . . . . . . . . . . . . . . . . . . . . . . . . . 122
20 DCE-EN18: Creep and Shrinkage Calculation of a Rectangular Prestressed Con-crete CS 12320.1 Problem Description.. . . . . . . . . . . . . . . . . . . . . . . . . . . . . . . . . . . . . . . . . . . . . . . . . . . . . . . . . . . . . . . . . . . . . . 12320.2 Reference Solution .. . . . . . . . . . . . . . . . . . . . . . . . . . . . . . . . . . . . . . . . . . . . . . . . . . . . . . . . . . . . . . . . . . . . . . . 12320.3 Model and Results . . . . . . . . . . . . . . . . . . . . . . . . . . . . . . . . . . . . . . . . . . . . . . . . . . . . . . . . . . . . . . . . . . . . . . . . 12420.4 Design Process .. . . . . . . . . . . . . . . . . . . . . . . . . . . . . . . . . . . . . . . . . . . . . . . . . . . . . . . . . . . . . . . . . . . . . . . . . . . 12520.5 Conclusion .. . . . . . . . . . . . . . . . . . . . . . . . . . . . . . . . . . . . . . . . . . . . . . . . . . . . . . . . . . . . . . . . . . . . . . . . . . . . . . . . 12920.6 Literature .. . . . . . . . . . . . . . . . . . . . . . . . . . . . . . . . . . . . . . . . . . . . . . . . . . . . . . . . . . . . . . . . . . . . . . . . . . . . . . . . . . 129
21 DCE-EN19: Fatigue of a Rectangular Reinforced Concrete CS 13121.1 Problem Description.. . . . . . . . . . . . . . . . . . . . . . . . . . . . . . . . . . . . . . . . . . . . . . . . . . . . . . . . . . . . . . . . . . . . . . 13121.2 Reference Solution .. . . . . . . . . . . . . . . . . . . . . . . . . . . . . . . . . . . . . . . . . . . . . . . . . . . . . . . . . . . . . . . . . . . . . . . 13121.3 Model and Results . . . . . . . . . . . . . . . . . . . . . . . . . . . . . . . . . . . . . . . . . . . . . . . . . . . . . . . . . . . . . . . . . . . . . . . . 13121.4 Design Process .. . . . . . . . . . . . . . . . . . . . . . . . . . . . . . . . . . . . . . . . . . . . . . . . . . . . . . . . . . . . . . . . . . . . . . . . . . . 13321.5 Conclusion .. . . . . . . . . . . . . . . . . . . . . . . . . . . . . . . . . . . . . . . . . . . . . . . . . . . . . . . . . . . . . . . . . . . . . . . . . . . . . . . . 13921.6 Literature .. . . . . . . . . . . . . . . . . . . . . . . . . . . . . . . . . . . . . . . . . . . . . . . . . . . . . . . . . . . . . . . . . . . . . . . . . . . . . . . . . . 139
22 DCE-EN20: Design of a Steel I-section for Bending, Shear and Axial Force 14122.1 Problem Description.. . . . . . . . . . . . . . . . . . . . . . . . . . . . . . . . . . . . . . . . . . . . . . . . . . . . . . . . . . . . . . . . . . . . . . 14122.2 Reference Solution .. . . . . . . . . . . . . . . . . . . . . . . . . . . . . . . . . . . . . . . . . . . . . . . . . . . . . . . . . . . . . . . . . . . . . . . 14222.3 Model and Results . . . . . . . . . . . . . . . . . . . . . . . . . . . . . . . . . . . . . . . . . . . . . . . . . . . . . . . . . . . . . . . . . . . . . . . . 14222.4 Design Process .. . . . . . . . . . . . . . . . . . . . . . . . . . . . . . . . . . . . . . . . . . . . . . . . . . . . . . . . . . . . . . . . . . . . . . . . . . . 14322.5 Conclusion .. . . . . . . . . . . . . . . . . . . . . . . . . . . . . . . . . . . . . . . . . . . . . . . . . . . . . . . . . . . . . . . . . . . . . . . . . . . . . . . . 14622.6 Literature .. . . . . . . . . . . . . . . . . . . . . . . . . . . . . . . . . . . . . . . . . . . . . . . . . . . . . . . . . . . . . . . . . . . . . . . . . . . . . . . . . . 147
23 DCE-EN21: Real Creep and Shrinkage Calculation of a T-Beam Prestressed CS 14923.1 Problem Description.. . . . . . . . . . . . . . . . . . . . . . . . . . . . . . . . . . . . . . . . . . . . . . . . . . . . . . . . . . . . . . . . . . . . . . 14923.2 Reference Solution .. . . . . . . . . . . . . . . . . . . . . . . . . . . . . . . . . . . . . . . . . . . . . . . . . . . . . . . . . . . . . . . . . . . . . . . 14923.3 Model and Results . . . . . . . . . . . . . . . . . . . . . . . . . . . . . . . . . . . . . . . . . . . . . . . . . . . . . . . . . . . . . . . . . . . . . . . . 14923.4 Design Process .. . . . . . . . . . . . . . . . . . . . . . . . . . . . . . . . . . . . . . . . . . . . . . . . . . . . . . . . . . . . . . . . . . . . . . . . . . . 15223.5 Conclusion .. . . . . . . . . . . . . . . . . . . . . . . . . . . . . . . . . . . . . . . . . . . . . . . . . . . . . . . . . . . . . . . . . . . . . . . . . . . . . . . . 16323.6 Literature .. . . . . . . . . . . . . . . . . . . . . . . . . . . . . . . . . . . . . . . . . . . . . . . . . . . . . . . . . . . . . . . . . . . . . . . . . . . . . . . . . . 163
24 DCE-EN22: Stress Relaxation of Prestressing Steel - EN 1992-1-1 16524.1 Problem Description.. . . . . . . . . . . . . . . . . . . . . . . . . . . . . . . . . . . . . . . . . . . . . . . . . . . . . . . . . . . . . . . . . . . . . . 16524.2 Reference Solution .. . . . . . . . . . . . . . . . . . . . . . . . . . . . . . . . . . . . . . . . . . . . . . . . . . . . . . . . . . . . . . . . . . . . . . . 16524.3 Model and Results . . . . . . . . . . . . . . . . . . . . . . . . . . . . . . . . . . . . . . . . . . . . . . . . . . . . . . . . . . . . . . . . . . . . . . . . 16524.4 Design Process .. . . . . . . . . . . . . . . . . . . . . . . . . . . . . . . . . . . . . . . . . . . . . . . . . . . . . . . . . . . . . . . . . . . . . . . . . . . 16724.5 Conclusion .. . . . . . . . . . . . . . . . . . . . . . . . . . . . . . . . . . . . . . . . . . . . . . . . . . . . . . . . . . . . . . . . . . . . . . . . . . . . . . . . 17124.6 Literature .. . . . . . . . . . . . . . . . . . . . . . . . . . . . . . . . . . . . . . . . . . . . . . . . . . . . . . . . . . . . . . . . . . . . . . . . . . . . . . . . . . 171
25 DCE-EN23: Stress Relaxation of Prestressing Steel - DIN EN 1992-1-1 17325.1 Problem Description.. . . . . . . . . . . . . . . . . . . . . . . . . . . . . . . . . . . . . . . . . . . . . . . . . . . . . . . . . . . . . . . . . . . . . . 17325.2 Reference Solution .. . . . . . . . . . . . . . . . . . . . . . . . . . . . . . . . . . . . . . . . . . . . . . . . . . . . . . . . . . . . . . . . . . . . . . . 17325.3 Model and Results . . . . . . . . . . . . . . . . . . . . . . . . . . . . . . . . . . . . . . . . . . . . . . . . . . . . . . . . . . . . . . . . . . . . . . . . 17325.4 Design Process .. . . . . . . . . . . . . . . . . . . . . . . . . . . . . . . . . . . . . . . . . . . . . . . . . . . . . . . . . . . . . . . . . . . . . . . . . . . 17525.5 Conclusion .. . . . . . . . . . . . . . . . . . . . . . . . . . . . . . . . . . . . . . . . . . . . . . . . . . . . . . . . . . . . . . . . . . . . . . . . . . . . . . . . 17925.6 Literature .. . . . . . . . . . . . . . . . . . . . . . . . . . . . . . . . . . . . . . . . . . . . . . . . . . . . . . . . . . . . . . . . . . . . . . . . . . . . . . . . . . 179
iv VERiFiCATiON MANUAL - Design Code Benchmarks | SOFiSTiK 2018
Contents
26 DCE-EN24: Lateral Torsional Buckling 18126.1 Problem Description.. . . . . . . . . . . . . . . . . . . . . . . . . . . . . . . . . . . . . . . . . . . . . . . . . . . . . . . . . . . . . . . . . . . . . . 18126.2 Reference Solution .. . . . . . . . . . . . . . . . . . . . . . . . . . . . . . . . . . . . . . . . . . . . . . . . . . . . . . . . . . . . . . . . . . . . . . . 18126.3 Model and Results . . . . . . . . . . . . . . . . . . . . . . . . . . . . . . . . . . . . . . . . . . . . . . . . . . . . . . . . . . . . . . . . . . . . . . . . 18226.4 Design Process .. . . . . . . . . . . . . . . . . . . . . . . . . . . . . . . . . . . . . . . . . . . . . . . . . . . . . . . . . . . . . . . . . . . . . . . . . . . 18426.5 Conclusion .. . . . . . . . . . . . . . . . . . . . . . . . . . . . . . . . . . . . . . . . . . . . . . . . . . . . . . . . . . . . . . . . . . . . . . . . . . . . . . . . 19126.6 Literature .. . . . . . . . . . . . . . . . . . . . . . . . . . . . . . . . . . . . . . . . . . . . . . . . . . . . . . . . . . . . . . . . . . . . . . . . . . . . . . . . . . 191
27 DCE-EN25: Shear between web and flanges of Hollow CS acc. DIN EN 1992-2 19327.1 Problem Description.. . . . . . . . . . . . . . . . . . . . . . . . . . . . . . . . . . . . . . . . . . . . . . . . . . . . . . . . . . . . . . . . . . . . . . 19327.2 Reference Solution .. . . . . . . . . . . . . . . . . . . . . . . . . . . . . . . . . . . . . . . . . . . . . . . . . . . . . . . . . . . . . . . . . . . . . . . 19327.3 Model and Results . . . . . . . . . . . . . . . . . . . . . . . . . . . . . . . . . . . . . . . . . . . . . . . . . . . . . . . . . . . . . . . . . . . . . . . . 19427.4 Design Process .. . . . . . . . . . . . . . . . . . . . . . . . . . . . . . . . . . . . . . . . . . . . . . . . . . . . . . . . . . . . . . . . . . . . . . . . . . . 19727.5 Conclusion .. . . . . . . . . . . . . . . . . . . . . . . . . . . . . . . . . . . . . . . . . . . . . . . . . . . . . . . . . . . . . . . . . . . . . . . . . . . . . . . . 20127.6 Literature .. . . . . . . . . . . . . . . . . . . . . . . . . . . . . . . . . . . . . . . . . . . . . . . . . . . . . . . . . . . . . . . . . . . . . . . . . . . . . . . . . . 202
28 DCE-EN27: Design of Quad Elements - Layer Design and Baumann Method 20328.1 Problem Description.. . . . . . . . . . . . . . . . . . . . . . . . . . . . . . . . . . . . . . . . . . . . . . . . . . . . . . . . . . . . . . . . . . . . . . 20328.2 Reference Solution .. . . . . . . . . . . . . . . . . . . . . . . . . . . . . . . . . . . . . . . . . . . . . . . . . . . . . . . . . . . . . . . . . . . . . . . 20328.3 Model and Results . . . . . . . . . . . . . . . . . . . . . . . . . . . . . . . . . . . . . . . . . . . . . . . . . . . . . . . . . . . . . . . . . . . . . . . . 20428.4 Design Process .. . . . . . . . . . . . . . . . . . . . . . . . . . . . . . . . . . . . . . . . . . . . . . . . . . . . . . . . . . . . . . . . . . . . . . . . . . . 20828.5 Conclusion .. . . . . . . . . . . . . . . . . . . . . . . . . . . . . . . . . . . . . . . . . . . . . . . . . . . . . . . . . . . . . . . . . . . . . . . . . . . . . . . . 21528.6 Literature .. . . . . . . . . . . . . . . . . . . . . . . . . . . . . . . . . . . . . . . . . . . . . . . . . . . . . . . . . . . . . . . . . . . . . . . . . . . . . . . . . . 215
29 DCE-EN28: Design of a T-section for bending and shear using Design Elements 21729.1 Problem Description.. . . . . . . . . . . . . . . . . . . . . . . . . . . . . . . . . . . . . . . . . . . . . . . . . . . . . . . . . . . . . . . . . . . . . . 21729.2 Reference Solution .. . . . . . . . . . . . . . . . . . . . . . . . . . . . . . . . . . . . . . . . . . . . . . . . . . . . . . . . . . . . . . . . . . . . . . . 21729.3 Model and Results . . . . . . . . . . . . . . . . . . . . . . . . . . . . . . . . . . . . . . . . . . . . . . . . . . . . . . . . . . . . . . . . . . . . . . . . 21729.4 Design Process .. . . . . . . . . . . . . . . . . . . . . . . . . . . . . . . . . . . . . . . . . . . . . . . . . . . . . . . . . . . . . . . . . . . . . . . . . . . 22029.5 Conclusion .. . . . . . . . . . . . . . . . . . . . . . . . . . . . . . . . . . . . . . . . . . . . . . . . . . . . . . . . . . . . . . . . . . . . . . . . . . . . . . . . 22229.6 Literature .. . . . . . . . . . . . . . . . . . . . . . . . . . . . . . . . . . . . . . . . . . . . . . . . . . . . . . . . . . . . . . . . . . . . . . . . . . . . . . . . . . 222
30 DCE-EN29: Design of restrained steel column 22330.1 Problem Description.. . . . . . . . . . . . . . . . . . . . . . . . . . . . . . . . . . . . . . . . . . . . . . . . . . . . . . . . . . . . . . . . . . . . . . 22330.2 Reference Solution .. . . . . . . . . . . . . . . . . . . . . . . . . . . . . . . . . . . . . . . . . . . . . . . . . . . . . . . . . . . . . . . . . . . . . . . 22430.3 Model and Results . . . . . . . . . . . . . . . . . . . . . . . . . . . . . . . . . . . . . . . . . . . . . . . . . . . . . . . . . . . . . . . . . . . . . . . . 22430.4 Design Process .. . . . . . . . . . . . . . . . . . . . . . . . . . . . . . . . . . . . . . . . . . . . . . . . . . . . . . . . . . . . . . . . . . . . . . . . . . . 22630.5 Conclusion .. . . . . . . . . . . . . . . . . . . . . . . . . . . . . . . . . . . . . . . . . . . . . . . . . . . . . . . . . . . . . . . . . . . . . . . . . . . . . . . . 23030.6 Literature .. . . . . . . . . . . . . . . . . . . . . . . . . . . . . . . . . . . . . . . . . . . . . . . . . . . . . . . . . . . . . . . . . . . . . . . . . . . . . . . . . . 230
31 DCE-EN30: Steel column with a class 4 cross-section 23131.1 Problem Description.. . . . . . . . . . . . . . . . . . . . . . . . . . . . . . . . . . . . . . . . . . . . . . . . . . . . . . . . . . . . . . . . . . . . . . 23131.2 Reference Solution .. . . . . . . . . . . . . . . . . . . . . . . . . . . . . . . . . . . . . . . . . . . . . . . . . . . . . . . . . . . . . . . . . . . . . . . 23231.3 Model and Results . . . . . . . . . . . . . . . . . . . . . . . . . . . . . . . . . . . . . . . . . . . . . . . . . . . . . . . . . . . . . . . . . . . . . . . . 23331.4 Design Process .. . . . . . . . . . . . . . . . . . . . . . . . . . . . . . . . . . . . . . . . . . . . . . . . . . . . . . . . . . . . . . . . . . . . . . . . . . . 23531.5 Conclusion .. . . . . . . . . . . . . . . . . . . . . . . . . . . . . . . . . . . . . . . . . . . . . . . . . . . . . . . . . . . . . . . . . . . . . . . . . . . . . . . . 24331.6 Literature .. . . . . . . . . . . . . . . . . . . . . . . . . . . . . . . . . . . . . . . . . . . . . . . . . . . . . . . . . . . . . . . . . . . . . . . . . . . . . . . . . . 243
32 DCE-EN31: Punching of flat slab acc. DIN EN 1992-1-1 24532.1 Problem Description.. . . . . . . . . . . . . . . . . . . . . . . . . . . . . . . . . . . . . . . . . . . . . . . . . . . . . . . . . . . . . . . . . . . . . . 24532.2 Reference Solution .. . . . . . . . . . . . . . . . . . . . . . . . . . . . . . . . . . . . . . . . . . . . . . . . . . . . . . . . . . . . . . . . . . . . . . . 24632.3 Model and Results . . . . . . . . . . . . . . . . . . . . . . . . . . . . . . . . . . . . . . . . . . . . . . . . . . . . . . . . . . . . . . . . . . . . . . . . 24632.4 Design Process .. . . . . . . . . . . . . . . . . . . . . . . . . . . . . . . . . . . . . . . . . . . . . . . . . . . . . . . . . . . . . . . . . . . . . . . . . . . 248
32.4.1 Material . . . . . . . . . . . . . . . . . . . . . . . . . . . . . . . . . . . . . . . . . . . . . . . . . . . . . . . . . . . . . . . . . . . . . . . . . . . . . . . . . . 248
SOFiSTiK 2018 | VERiFiCATiON MANUAL - Design Code Benchmarks v
Contents
32.4.2 Actions and Loads .. . . . . . . . . . . . . . . . . . . . . . . . . . . . . . . . . . . . . . . . . . . . . . . . . . . . . . . . . . . . . . . . . . . . . 24832.4.3 Punching check for inner Column .. . . . . . . . . . . . . . . . . . . . . . . . . . . . . . . . . . . . . . . . . . . . . . . . . . . . 24832.4.4 Punching check for edge column .. . . . . . . . . . . . . . . . . . . . . . . . . . . . . . . . . . . . . . . . . . . . . . . . . . . . 25332.4.5 Punching check for wall . . . . . . . . . . . . . . . . . . . . . . . . . . . . . . . . . . . . . . . . . . . . . . . . . . . . . . . . . . . . . . . . 256
32.5 Conclusion .. . . . . . . . . . . . . . . . . . . . . . . . . . . . . . . . . . . . . . . . . . . . . . . . . . . . . . . . . . . . . . . . . . . . . . . . . . . . . . . . 26132.6 Literature .. . . . . . . . . . . . . . . . . . . . . . . . . . . . . . . . . . . . . . . . . . . . . . . . . . . . . . . . . . . . . . . . . . . . . . . . . . . . . . . . . . 261
33 DCE-EN32: Crack width calculation of reinforced slab acc. DIN EN 1992-1-1 26333.1 Problem Description.. . . . . . . . . . . . . . . . . . . . . . . . . . . . . . . . . . . . . . . . . . . . . . . . . . . . . . . . . . . . . . . . . . . . . . 26333.2 Reference Solution .. . . . . . . . . . . . . . . . . . . . . . . . . . . . . . . . . . . . . . . . . . . . . . . . . . . . . . . . . . . . . . . . . . . . . . . 26333.3 Model and Results . . . . . . . . . . . . . . . . . . . . . . . . . . . . . . . . . . . . . . . . . . . . . . . . . . . . . . . . . . . . . . . . . . . . . . . . 26433.4 Design Process .. . . . . . . . . . . . . . . . . . . . . . . . . . . . . . . . . . . . . . . . . . . . . . . . . . . . . . . . . . . . . . . . . . . . . . . . . . . 267
33.4.1 Material . . . . . . . . . . . . . . . . . . . . . . . . . . . . . . . . . . . . . . . . . . . . . . . . . . . . . . . . . . . . . . . . . . . . . . . . . . . . . . . . . . 26733.4.2 Without direct calculation .. . . . . . . . . . . . . . . . . . . . . . . . . . . . . . . . . . . . . . . . . . . . . . . . . . . . . . . . . . . . . 26733.4.3 With direct calculation .. . . . . . . . . . . . . . . . . . . . . . . . . . . . . . . . . . . . . . . . . . . . . . . . . . . . . . . . . . . . . . . . . 268
33.5 Conclusion .. . . . . . . . . . . . . . . . . . . . . . . . . . . . . . . . . . . . . . . . . . . . . . . . . . . . . . . . . . . . . . . . . . . . . . . . . . . . . . . . 27133.6 Literature .. . . . . . . . . . . . . . . . . . . . . . . . . . . . . . . . . . . . . . . . . . . . . . . . . . . . . . . . . . . . . . . . . . . . . . . . . . . . . . . . . . 271
34 DCE-EN33: Designing a Reinforced Concrete Column acc. DIN EN 1992-1-1 27334.1 Problem Description.. . . . . . . . . . . . . . . . . . . . . . . . . . . . . . . . . . . . . . . . . . . . . . . . . . . . . . . . . . . . . . . . . . . . . . 27334.2 Reference Solution .. . . . . . . . . . . . . . . . . . . . . . . . . . . . . . . . . . . . . . . . . . . . . . . . . . . . . . . . . . . . . . . . . . . . . . . 27334.3 Model and Results . . . . . . . . . . . . . . . . . . . . . . . . . . . . . . . . . . . . . . . . . . . . . . . . . . . . . . . . . . . . . . . . . . . . . . . . 27434.4 Design Process .. . . . . . . . . . . . . . . . . . . . . . . . . . . . . . . . . . . . . . . . . . . . . . . . . . . . . . . . . . . . . . . . . . . . . . . . . . . 276
34.4.1 Exposure class .. . . . . . . . . . . . . . . . . . . . . . . . . . . . . . . . . . . . . . . . . . . . . . . . . . . . . . . . . . . . . . . . . . . . . . . . . 27634.4.2 Actions .. . . . . . . . . . . . . . . . . . . . . . . . . . . . . . . . . . . . . . . . . . . . . . . . . . . . . . . . . . . . . . . . . . . . . . . . . . . . . . . . . . 27634.4.3 Materials . . . . . . . . . . . . . . . . . . . . . . . . . . . . . . . . . . . . . . . . . . . . . . . . . . . . . . . . . . . . . . . . . . . . . . . . . . . . . . . . . 27634.4.4 Buckling length .. . . . . . . . . . . . . . . . . . . . . . . . . . . . . . . . . . . . . . . . . . . . . . . . . . . . . . . . . . . . . . . . . . . . . . . . . 27734.4.5 Imperfections .. . . . . . . . . . . . . . . . . . . . . . . . . . . . . . . . . . . . . . . . . . . . . . . . . . . . . . . . . . . . . . . . . . . . . . . . . . . 27834.4.6 Min. and max. required reinforcement . . . . . . . . . . . . . . . . . . . . . . . . . . . . . . . . . . . . . . . . . . . . . . . 27834.4.7 Design of longitudinal reinforcement . . . . . . . . . . . . . . . . . . . . . . . . . . . . . . . . . . . . . . . . . . . . . . . . . 27934.4.8 Design of shear reinforcement . . . . . . . . . . . . . . . . . . . . . . . . . . . . . . . . . . . . . . . . . . . . . . . . . . . . . . . . 281
34.5 Conclusion .. . . . . . . . . . . . . . . . . . . . . . . . . . . . . . . . . . . . . . . . . . . . . . . . . . . . . . . . . . . . . . . . . . . . . . . . . . . . . . . . 28234.6 Literature .. . . . . . . . . . . . . . . . . . . . . . . . . . . . . . . . . . . . . . . . . . . . . . . . . . . . . . . . . . . . . . . . . . . . . . . . . . . . . . . . . . 283
35 DCE-EN34: Elastic Critical Plate Buckling Stress 28535.1 Problem Description.. . . . . . . . . . . . . . . . . . . . . . . . . . . . . . . . . . . . . . . . . . . . . . . . . . . . . . . . . . . . . . . . . . . . . . 28535.2 Reference Solution .. . . . . . . . . . . . . . . . . . . . . . . . . . . . . . . . . . . . . . . . . . . . . . . . . . . . . . . . . . . . . . . . . . . . . . . 28635.3 Model and Results . . . . . . . . . . . . . . . . . . . . . . . . . . . . . . . . . . . . . . . . . . . . . . . . . . . . . . . . . . . . . . . . . . . . . . . . 28635.4 Design Process .. . . . . . . . . . . . . . . . . . . . . . . . . . . . . . . . . . . . . . . . . . . . . . . . . . . . . . . . . . . . . . . . . . . . . . . . . . . 289
35.4.1 Kloppel . . . . . . . . . . . . . . . . . . . . . . . . . . . . . . . . . . . . . . . . . . . . . . . . . . . . . . . . . . . . . . . . . . . . . . . . . . . . . . . . . . . 28935.4.2 EBPlate .. . . . . . . . . . . . . . . . . . . . . . . . . . . . . . . . . . . . . . . . . . . . . . . . . . . . . . . . . . . . . . . . . . . . . . . . . . . . . . . . . 29035.4.3 EN 1993-1-5, Annex A.2 .. . . . . . . . . . . . . . . . . . . . . . . . . . . . . . . . . . . . . . . . . . . . . . . . . . . . . . . . . . . . . . 29135.4.4 ABAQUS ... . . . . . . . . . . . . . . . . . . . . . . . . . . . . . . . . . . . . . . . . . . . . . . . . . . . . . . . . . . . . . . . . . . . . . . . . . . . . . . 294
35.5 Conclusion .. . . . . . . . . . . . . . . . . . . . . . . . . . . . . . . . . . . . . . . . . . . . . . . . . . . . . . . . . . . . . . . . . . . . . . . . . . . . . . . . 29535.6 Literature .. . . . . . . . . . . . . . . . . . . . . . . . . . . . . . . . . . . . . . . . . . . . . . . . . . . . . . . . . . . . . . . . . . . . . . . . . . . . . . . . . . 295
36 DCE-MC1: Creep and Shrinkage Calculation using the Model Code 2010 29736.1 Problem Description.. . . . . . . . . . . . . . . . . . . . . . . . . . . . . . . . . . . . . . . . . . . . . . . . . . . . . . . . . . . . . . . . . . . . . . 29736.2 Reference Solution .. . . . . . . . . . . . . . . . . . . . . . . . . . . . . . . . . . . . . . . . . . . . . . . . . . . . . . . . . . . . . . . . . . . . . . . 29736.3 Model and Results . . . . . . . . . . . . . . . . . . . . . . . . . . . . . . . . . . . . . . . . . . . . . . . . . . . . . . . . . . . . . . . . . . . . . . . . 29736.4 Design Process .. . . . . . . . . . . . . . . . . . . . . . . . . . . . . . . . . . . . . . . . . . . . . . . . . . . . . . . . . . . . . . . . . . . . . . . . . . . 29936.5 Conclusion .. . . . . . . . . . . . . . . . . . . . . . . . . . . . . . . . . . . . . . . . . . . . . . . . . . . . . . . . . . . . . . . . . . . . . . . . . . . . . . . . 30336.6 Literature .. . . . . . . . . . . . . . . . . . . . . . . . . . . . . . . . . . . . . . . . . . . . . . . . . . . . . . . . . . . . . . . . . . . . . . . . . . . . . . . . . . 303
vi VERiFiCATiON MANUAL - Design Code Benchmarks | SOFiSTiK 2018
Contents
37 DCE-MC2: Creep and Shrinkage Calculation using the Model Code 1990 30537.1 Problem Description.. . . . . . . . . . . . . . . . . . . . . . . . . . . . . . . . . . . . . . . . . . . . . . . . . . . . . . . . . . . . . . . . . . . . . . 30537.2 Reference Solution .. . . . . . . . . . . . . . . . . . . . . . . . . . . . . . . . . . . . . . . . . . . . . . . . . . . . . . . . . . . . . . . . . . . . . . . 30537.3 Model and Results . . . . . . . . . . . . . . . . . . . . . . . . . . . . . . . . . . . . . . . . . . . . . . . . . . . . . . . . . . . . . . . . . . . . . . . . 30537.4 Design Process .. . . . . . . . . . . . . . . . . . . . . . . . . . . . . . . . . . . . . . . . . . . . . . . . . . . . . . . . . . . . . . . . . . . . . . . . . . . 30737.5 Conclusion .. . . . . . . . . . . . . . . . . . . . . . . . . . . . . . . . . . . . . . . . . . . . . . . . . . . . . . . . . . . . . . . . . . . . . . . . . . . . . . . . 31037.6 Literature .. . . . . . . . . . . . . . . . . . . . . . . . . . . . . . . . . . . . . . . . . . . . . . . . . . . . . . . . . . . . . . . . . . . . . . . . . . . . . . . . . . 310
38 DCE-SIA1: Punching of flat slabs 31138.1 Problem Description.. . . . . . . . . . . . . . . . . . . . . . . . . . . . . . . . . . . . . . . . . . . . . . . . . . . . . . . . . . . . . . . . . . . . . . 31138.2 Reference Solution .. . . . . . . . . . . . . . . . . . . . . . . . . . . . . . . . . . . . . . . . . . . . . . . . . . . . . . . . . . . . . . . . . . . . . . . 31338.3 Model and Results . . . . . . . . . . . . . . . . . . . . . . . . . . . . . . . . . . . . . . . . . . . . . . . . . . . . . . . . . . . . . . . . . . . . . . . . 31338.4 Design Process .. . . . . . . . . . . . . . . . . . . . . . . . . . . . . . . . . . . . . . . . . . . . . . . . . . . . . . . . . . . . . . . . . . . . . . . . . . . 31438.5 Conclusion .. . . . . . . . . . . . . . . . . . . . . . . . . . . . . . . . . . . . . . . . . . . . . . . . . . . . . . . . . . . . . . . . . . . . . . . . . . . . . . . . 31938.6 Literature .. . . . . . . . . . . . . . . . . . . . . . . . . . . . . . . . . . . . . . . . . . . . . . . . . . . . . . . . . . . . . . . . . . . . . . . . . . . . . . . . . . 319
SOFiSTiK 2018 | VERiFiCATiON MANUAL - Design Code Benchmarks vii

Contents
viii VERiFiCATiON MANUAL - Design Code Benchmarks | SOFiSTiK 2018

Contents
Introduction
SOFiSTiK 2018 | VERiFiCATiON MANUAL - Design Code Benchmarks 1


About this Manual
1 About this Manual
The primary objective of this manual is to verify the capabilities of SOFiSTiK by means of nontrivialproblems which are bound to reference solutions.
To this end, this manual contains a compilation of a number of selected computational benchmarks, eachbenchmark focusing on a specific (mechanical/design) topic. The obtained results from the SOFiSTiKanalysis are contrasted with corresponding reference solutions1.
The tasks covered by SOFiSTiK, address a broad scope of engineering applications and it is thereforenot possible to validate all specific features with known reference solutions in terms of this VerificationManual. An attempt has been made though, to include most significant features of the software withrespect to common problems of general static and dynamic analysis of structures.
1.1 Layout and Organization of a Benchmark
For the description of each Benchmark, a standard format is employed, where the following topics arealways treated:
• Problem Description
• Reference Solution
• Model and Results
• Conclusion
• Literature
First, the problem description is given, where the target of the benchmark is stated, followed by thereference solution, where usually a closed-form analytical solution is presented, when available. Thenext section is the description of the model, where its properties, the loading configuration, the analysismethod and assumptions, further information on the finite element model, are presented in detail. Finally,the results are discussed and evaluated with respect to the reference solution and a final conclusion forthe response of the software to the specific problem is drawn. Last but not least, the textbooks andreferences used for the verification examples are listed, which are usually well known and come fromwidely acclaimed engineering literature sources.
1.2 Finding the Benchmark of interest
There are several ways of locating a Benchmark that is of interest for the user. For each example adescription table is provided in the beginning of the document, where all corresponding categories, thatare treated by the specific benchmark, are tabulated, as well as the name of the corresponding inputfile. Such a description table with some example entries, follows next.
Overview
Element Type(s): C2D
Analysis Type(s): STAT, MNL
1Where available, analytical solutions serve as reference. Where this is not feasible, numerical or empirical solutions arereferred to. In any case, the origin of the reference solution is explicitly stated.
SOFiSTiK 2018 | VERiFiCATiON MANUAL - Design Code Benchmarks 3

About this Manual
Procedure(s): LSTP
Topic(s): SOIL
Module(s): TALPA
Input file(s): passive earth pressure.dat
As it can be seen, the available categories are the element type, the analysis type, the procedure, thetopics and the modules. For each category that is provided in the description table, a hyperlink is created,linking each example to the global categories tables. In this manner, the user has a direct overview ofthe attributes involved in each problem, and at the same time is able to browse by category through theVerification Manual focusing only on the one of his interest. Table 1.1 provides an overview of all thecategories options that are available.
Table 1.1: Categories Overview
Categories Options
Element Type
Continuum 3D
Continuum 2D (plane strain)
Continuum axisymmetric
Shell
FE beam 3D
Nonlinear FE beam 3D (AQB)
Fiber beam 2D
Fiber beam 3D
Truss element
Cable element
Spring element
Damping element
Couplings
Analysis Type
Geometrically nonlinear
Physically nonlinear
Dynamic
Static
Potential problem
Procedure
Buckling analysis
Eigenvalue/ Modal analysis
Time stepping
Load stepping
Phi-C reduction
Topic
Soil related
4 VERiFiCATiON MANUAL - Design Code Benchmarks | SOFiSTiK 2018

About this Manual
Table 1.1: (continued)
Categories Options
Seismic
Fire design
Module
AQB
AQUA
ASE
BDK
BEMESS
CSM
DYNA
SOFiLOAD
SOFiMSHC
STAR2
TALPA
TENDON
1.3 Symbols
For the purpose of this manual the following symbols and abbreviations apply.
SOF. SOFiSTiK
Ref. reference
Tol. tolerance
cs cross-section
sect. section
temp. temperature
homog. homogeneous
Be. benchmark
con. construction
SDOF single degree of freedom
er relative error of the approximate number
|er | absolute relative error of the approximate number
e error of the approximate number
|e| absolute error of the approximate number
ep () same as e()
SOFiSTiK 2018 | VERiFiCATiON MANUAL - Design Code Benchmarks 5

About this Manual
6 VERiFiCATiON MANUAL - Design Code Benchmarks | SOFiSTiK 2018

Index by Categories
2 Index by Categories
Subsequent tables show all Benchmarks included in this Verification Manual, indexed by category.
2.1 Design Code Benchmarks
DESIGN CODE FAMILY Keyword Benchmark Examples
Eurocodes EN DCE-EN6, DCE-EN7, DCE-EN13, DCE-EN14,DCE-EN15, DCE-EN20, DCE-EN21, DCE-EN22,DCE-EN24, DCE-EN27, DCE-EN30, DCE-EN31, DCE-EN32, DCE-EN33,DCE-EN34
German Standards DIN DCE-EN1, DCE-EN2, DCE-EN3, DCE-EN4, DCE-EN5, DCE-EN6, DCE-EN8, DCE-EN9, DCE-EN10,DCE-EN11, DCE-EN12, DCE-EN17, DCE-EN18,DCE-EN19, DCE-EN23, DCE-EN25, DCE-EN28, DCE-EN29, DCE-EN31, DCE-EN32,DCE-EN33
CEB-FIB Model Code MC DCE-MC1, DCE-MC2
Swiss Standards SIA DCE-SIA1
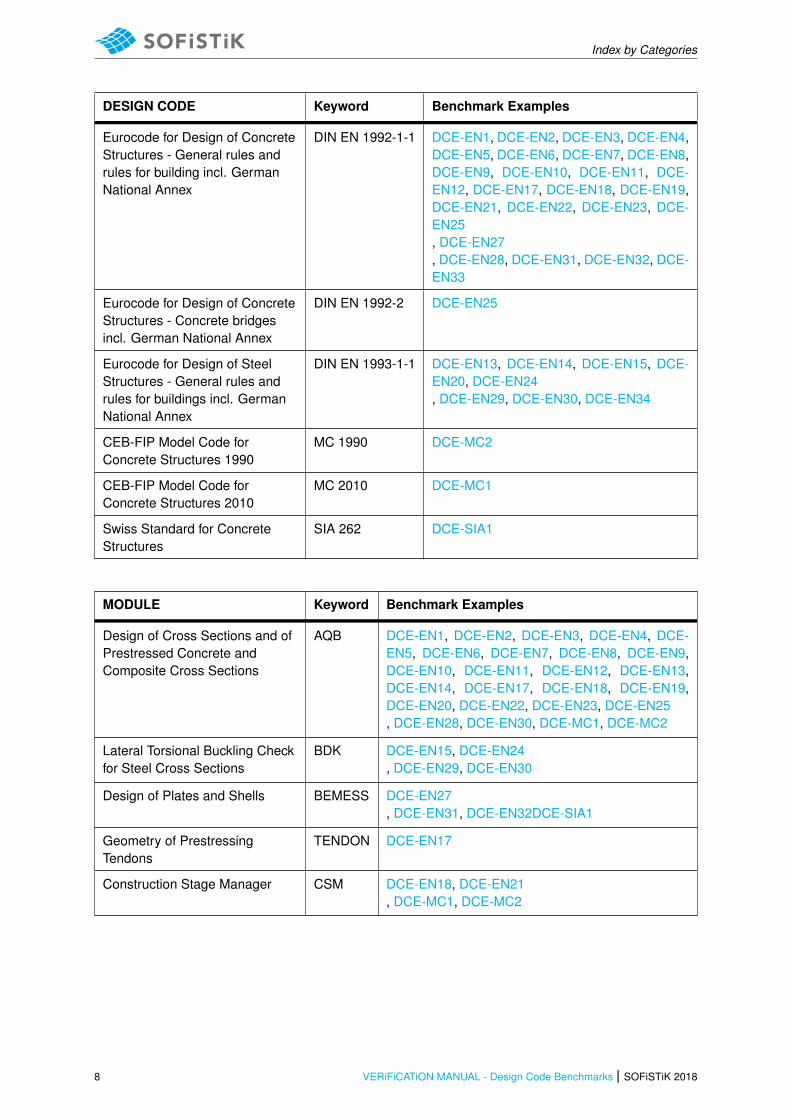
DESIGN CODE Keyword Benchmark Examples
Eurocode for Design of ConcreteStructures - General rules andrules for buildings
EN 1992-1-1 DCE-EN1, DCE-EN2, DCE-EN3, DCE-EN4,DCE-EN5, DCE-EN6, DCE-EN7, DCE-EN8,DCE-EN9, DCE-EN10, DCE-EN11, DCE-EN12, DCE-EN17, DCE-EN18, DCE-EN19,DCE-EN21, DCE-EN22, DCE-EN23, DCE-EN25, DCE-EN27, DCE-EN28, DCE-EN31, DCE-EN32, DCE-EN33
Eurocode for Design of ConcreteStructures - Concrete bridges
EN 1992-2 DCE-EN25
Eurocode for Design of SteelStructures - General rules andrules for buildings
EN 1993-1-1 DCE-EN13, DCE-EN14, DCE-EN15, DCE-EN20, DCE-EN24, DCE-EN29, DCE-EN30, DCE-EN34
Table continued on next page.
SOFiSTiK 2018 | VERiFiCATiON MANUAL - Design Code Benchmarks 7
Index by Categories
DESIGN CODE Keyword Benchmark Examples
Eurocode for Design of ConcreteStructures - General rules andrules for building incl. GermanNational Annex
DIN EN 1992-1-1 DCE-EN1, DCE-EN2, DCE-EN3, DCE-EN4,DCE-EN5, DCE-EN6, DCE-EN7, DCE-EN8,DCE-EN9, DCE-EN10, DCE-EN11, DCE-EN12, DCE-EN17, DCE-EN18, DCE-EN19,DCE-EN21, DCE-EN22, DCE-EN23, DCE-EN25, DCE-EN27, DCE-EN28, DCE-EN31, DCE-EN32, DCE-EN33
Eurocode for Design of ConcreteStructures - Concrete bridgesincl. German National Annex
DIN EN 1992-2 DCE-EN25
Eurocode for Design of SteelStructures - General rules andrules for buildings incl. GermanNational Annex
DIN EN 1993-1-1 DCE-EN13, DCE-EN14, DCE-EN15, DCE-EN20, DCE-EN24, DCE-EN29, DCE-EN30, DCE-EN34
CEB-FIP Model Code forConcrete Structures 1990
MC 1990 DCE-MC2
CEB-FIP Model Code forConcrete Structures 2010
MC 2010 DCE-MC1
Swiss Standard for ConcreteStructures
SIA 262 DCE-SIA1
MODULE Keyword Benchmark Examples
Design of Cross Sections and ofPrestressed Concrete andComposite Cross Sections
AQB DCE-EN1, DCE-EN2, DCE-EN3, DCE-EN4, DCE-EN5, DCE-EN6, DCE-EN7, DCE-EN8, DCE-EN9,DCE-EN10, DCE-EN11, DCE-EN12, DCE-EN13,DCE-EN14, DCE-EN17, DCE-EN18, DCE-EN19,DCE-EN20, DCE-EN22, DCE-EN23, DCE-EN25, DCE-EN28, DCE-EN30, DCE-MC1, DCE-MC2
Lateral Torsional Buckling Checkfor Steel Cross Sections
BDK DCE-EN15, DCE-EN24, DCE-EN29, DCE-EN30
Design of Plates and Shells BEMESS DCE-EN27, DCE-EN31, DCE-EN32DCE-SIA1
Geometry of PrestressingTendons
TENDON DCE-EN17
Construction Stage Manager CSM DCE-EN18, DCE-EN21, DCE-MC1, DCE-MC2
8 VERiFiCATiON MANUAL - Design Code Benchmarks | SOFiSTiK 2018

Part I
SOFiSTiK Software QualityAssurance (SQA)
SOFiSTiK 2018 | VERiFiCATiON MANUAL - Design Code Benchmarks 9


SOFiSTiK SQA Policy
3 SOFiSTiK SQA Policy
3.1 Objectives
3.1.1 About SOFiSTiK
SOFiSTiK finite element software has been continuously developed since 1981. It is currently usedby more than 10000 customers worldwide. SOFiSTiK is a multipurpose tool with extensive capabilitieswhich fall into a wide spectrum of engineering analyses such as static and dynamic structural analysis,modal and buckling eigenvalue problems, nonlinearities and higher order effects, geotechnics and tunnelanalysis, heat transfer and fire analysis, as well as numerous types of other applications.
3.1.2 Innovation and Reliability
As a provider of cutting-edge engineering software, confidence in robustness and reliability of the productis an issue of outstanding relevance for SOFiSTiK. To some degree, however, innovation and reliabilityare conflicting targets, since every change introduces new possible sources of uncertainty and error.To meet both demands on a sustainable basis, SOFiSTiK has installed a comprehensive quality assur-ance system. The involved organizational procedures and instruments are documented in the followingSections.
3.2 Organisation
3.2.1 Software Release Schedule
The SOFiSTiK software release schedule is characterized by a two-year major release cycle. Thefirst customer shipment (FCS) of a SOFiSTiK major release is preceded by an extensive BETA testingperiod. In this phase - after having passed all internal test procedures (Section 3.2.4: Software ReleaseProcedure) - the new product is adopted for authentic engineering projects both by SOFiSTiK and byselected customers. For a two-year transition period, subsequent major releases are fully supported inparallel, as shown in Fig. 3.1.
2015 2016 2017 2018 2019 2020 2021 2022 2023
BETA
BETA
BETA
Start of Transition Phase07.08.2017 30.09.2019
Discontinuation of Maintenance07.09.2015
Planned: Summer 2019
FCS
07.08.2017FCS Start of Transition Phase
Planned: Summer 2019
FCS
SOFiSTiK 2016
SOFiSTiK 2018
SOFiSTiK 2020
Figure 3.1: SOFiSTiK Release Schedule
The major release cycle is supplemented by a two-month service pack cycle. Service packs are qualityassured, which means they have passed both the continuous testing procedures and the functional tests(Section 3.2.2: SQA Modules - Classification). They are available for download via the SOFiSTiK updatetool SONAR.
SOFiSTiK 2018 | VERiFiCATiON MANUAL - Design Code Benchmarks 11
SOFiSTiK SQA Policy
Software updates for the current version (service packs) include bug-fixes and minor new features only;major new developments with increased potential regarding side- effects are reserved for major releaseswith an obligatory extensive testing period.
3.2.2 SQA Modules - Classification
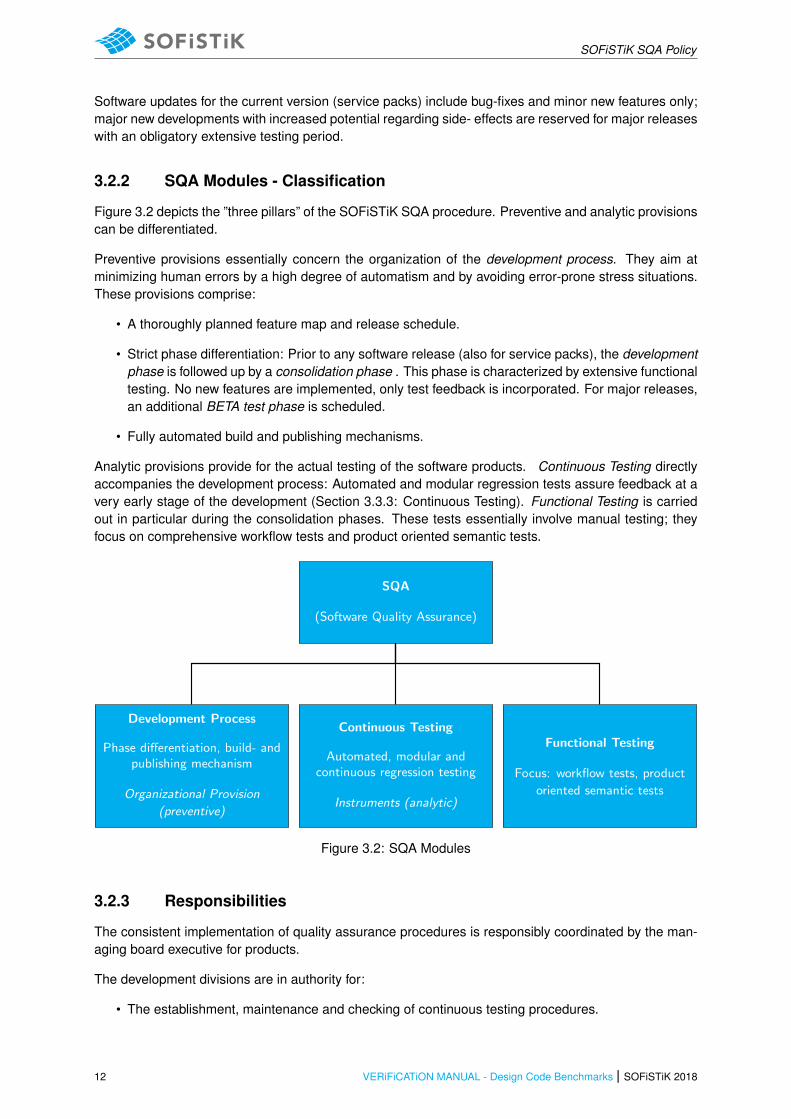
Figure 3.2 depicts the ”three pillars” of the SOFiSTiK SQA procedure. Preventive and analytic provisionscan be differentiated.
Preventive provisions essentially concern the organization of the development process. They aim atminimizing human errors by a high degree of automatism and by avoiding error-prone stress situations.These provisions comprise:
• A thoroughly planned feature map and release schedule.
• Strict phase differentiation: Prior to any software release (also for service packs), the developmentphase is followed up by a consolidation phase . This phase is characterized by extensive functionaltesting. No new features are implemented, only test feedback is incorporated. For major releases,an additional BETA test phase is scheduled.
• Fully automated build and publishing mechanisms.
Analytic provisions provide for the actual testing of the software products. Continuous Testing directlyaccompanies the development process: Automated and modular regression tests assure feedback at avery early stage of the development (Section 3.3.3: Continuous Testing). Functional Testing is carriedout in particular during the consolidation phases. These tests essentially involve manual testing; theyfocus on comprehensive workflow tests and product oriented semantic tests.
SQA
(Software Quality Assurance)
Development Process
Phase differentiation, build- andpublishing mechanism
Organizational Provision
(preventive)
Continuous Testing
Automated, modular andcontinuous regression testing
Instruments (analytic)
Functional Testing
Focus: workflow tests, product
oriented semantic tests
Figure 3.2: SQA Modules
3.2.3 Responsibilities
The consistent implementation of quality assurance procedures is responsibly coordinated by the man-aging board executive for products.
The development divisions are in authority for:
• The establishment, maintenance and checking of continuous testing procedures.
12 VERiFiCATiON MANUAL - Design Code Benchmarks | SOFiSTiK 2018

SOFiSTiK SQA Policy
• The implementation of corresponding feedback.
The product management is responsible for:
• The coordination and execution of functional testing.
• The integration of customer feedback into the QA process.
As a corporate activity is carried out:
• Continuous review of processes.
• The identification of supplemental objectives.
• Identification and implementation of possible optimizations.
ProductManagement
Functional testingIntegrating customer
feedback
DevelopmentContinuous Integration
Continuous TestingImplementing feedback
Corporate ActivityAdaption of processesDefinition of objectives
Coordinated by managing board
Figure 3.3: SQA Responsibilities
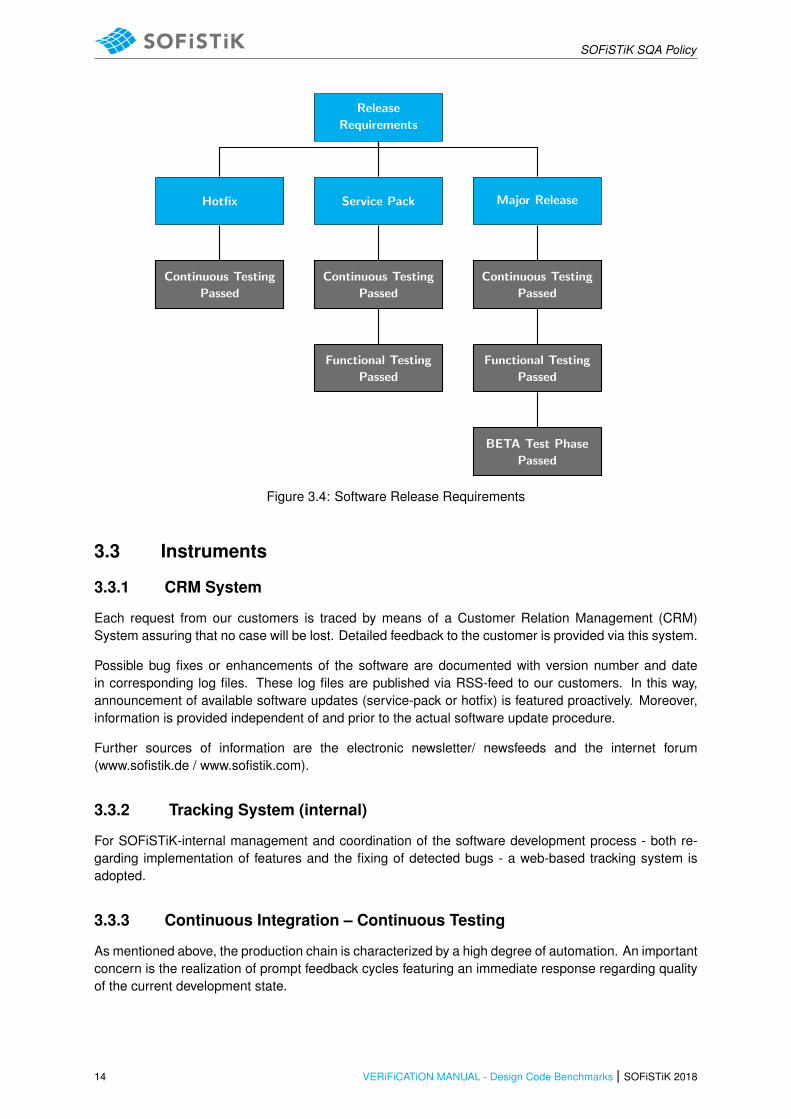
3.2.4 Software Release Procedure
The defined minimum requirements for software releases of type Hotfix, Service Pack and Major Releaseare illustrated by Figure 3.4. Approval of individual products is accomplished by the respective personin charge; the overall approval is in authority of the managing board executive for products.
SOFiSTiK 2018 | VERiFiCATiON MANUAL - Design Code Benchmarks 13
SOFiSTiK SQA Policy
Release
Requirements
Hotfix
Continuous Testing
Passed
Service Pack
Continuous Testing
Passed
Functional Testing
Passed
Major Release
Continuous Testing
Passed
Functional Testing
Passed
BETA Test Phase
Passed
Figure 3.4: Software Release Requirements
3.3 Instruments
3.3.1 CRM System
Each request from our customers is traced by means of a Customer Relation Management (CRM)System assuring that no case will be lost. Detailed feedback to the customer is provided via this system.
Possible bug fixes or enhancements of the software are documented with version number and datein corresponding log files. These log files are published via RSS-feed to our customers. In this way,announcement of available software updates (service-pack or hotfix) is featured proactively. Moreover,information is provided independent of and prior to the actual software update procedure.
Further sources of information are the electronic newsletter/ newsfeeds and the internet forum(www.sofistik.de / www.sofistik.com).
3.3.2 Tracking System (internal)
For SOFiSTiK-internal management and coordination of the software development process - both re-garding implementation of features and the fixing of detected bugs - a web-based tracking system isadopted.
3.3.3 Continuous Integration – Continuous Testing
As mentioned above, the production chain is characterized by a high degree of automation. An importantconcern is the realization of prompt feedback cycles featuring an immediate response regarding qualityof the current development state.
14 VERiFiCATiON MANUAL - Design Code Benchmarks | SOFiSTiK 2018
SOFiSTiK SQA Policy
AutomatedContinuous Integration
procedure
AutomatedContinuous Testing
procedure
Development/ PMAssessing feedback
Committing modifications
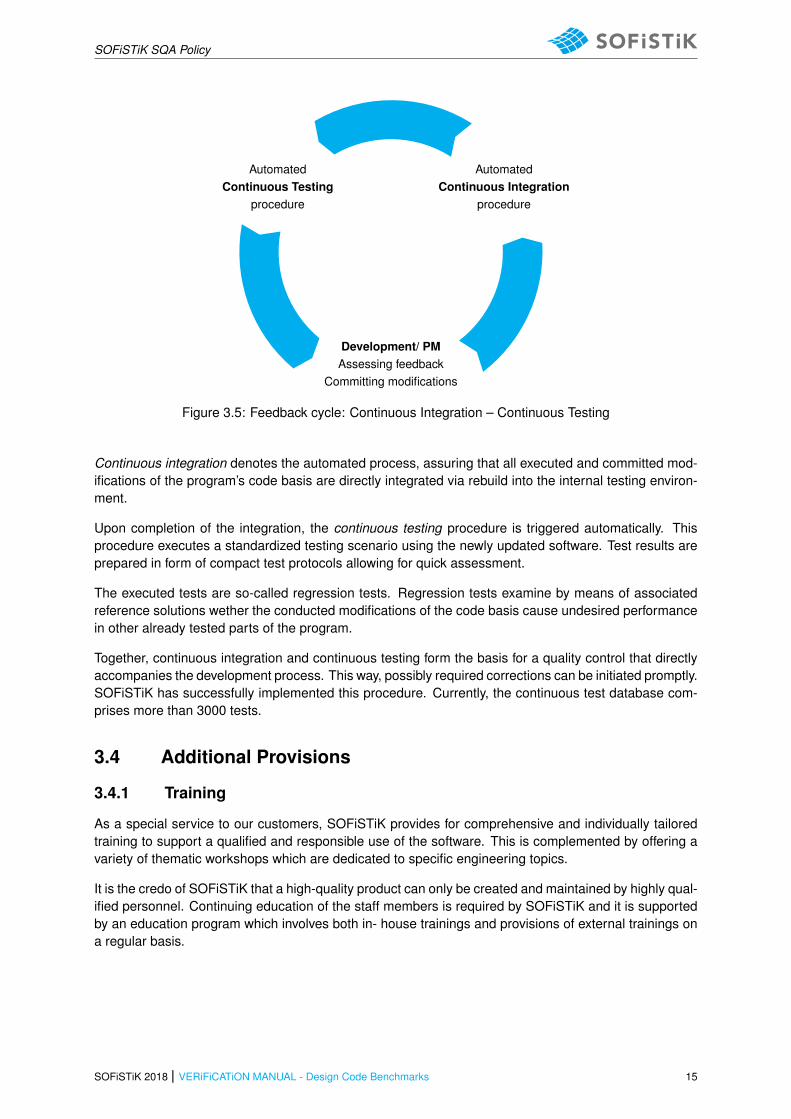
Figure 3.5: Feedback cycle: Continuous Integration – Continuous Testing
Continuous integration denotes the automated process, assuring that all executed and committed mod-ifications of the program’s code basis are directly integrated via rebuild into the internal testing environ-ment.
Upon completion of the integration, the continuous testing procedure is triggered automatically. Thisprocedure executes a standardized testing scenario using the newly updated software. Test results areprepared in form of compact test protocols allowing for quick assessment.
The executed tests are so-called regression tests. Regression tests examine by means of associatedreference solutions wether the conducted modifications of the code basis cause undesired performancein other already tested parts of the program.
Together, continuous integration and continuous testing form the basis for a quality control that directlyaccompanies the development process. This way, possibly required corrections can be initiated promptly.SOFiSTiK has successfully implemented this procedure. Currently, the continuous test database com-prises more than 3000 tests.
3.4 Additional Provisions
3.4.1 Training
As a special service to our customers, SOFiSTiK provides for comprehensive and individually tailoredtraining to support a qualified and responsible use of the software. This is complemented by offering avariety of thematic workshops which are dedicated to specific engineering topics.
It is the credo of SOFiSTiK that a high-quality product can only be created and maintained by highly qual-ified personnel. Continuing education of the staff members is required by SOFiSTiK and it is supportedby an education program which involves both in- house trainings and provisions of external trainings ona regular basis.
SOFiSTiK 2018 | VERiFiCATiON MANUAL - Design Code Benchmarks 15

SOFiSTiK SQA Policy
3.4.2 Academia Network
Arising questions are treated by an intense discussion with customers, authorities and scientists to findthe best interpretation.
3.5 Disclaimer
Despite all efforts to achieve the highest possible degree of reliability, SOFiSTiK cannot assure that theprovided software is bug-free or that it will solve a particular problem in a way which is implied with theopinion of the user in all details. Engineering skill is required when assessing the software results.
16 VERiFiCATiON MANUAL - Design Code Benchmarks | SOFiSTiK 2018

Part II
Design Code Benchmarks
SOFiSTiK 2018 | VERiFiCATiON MANUAL - Design Code Benchmarks 17

DCE-EN1: Design of Slab for Bending
4 DCE-EN1: Design of Slab for Bending
Overview
Design Code Family(s): DIN
Design Code(s): DIN EN 1992-1-1
Module(s): AQB
Input file(s): slab bending.dat
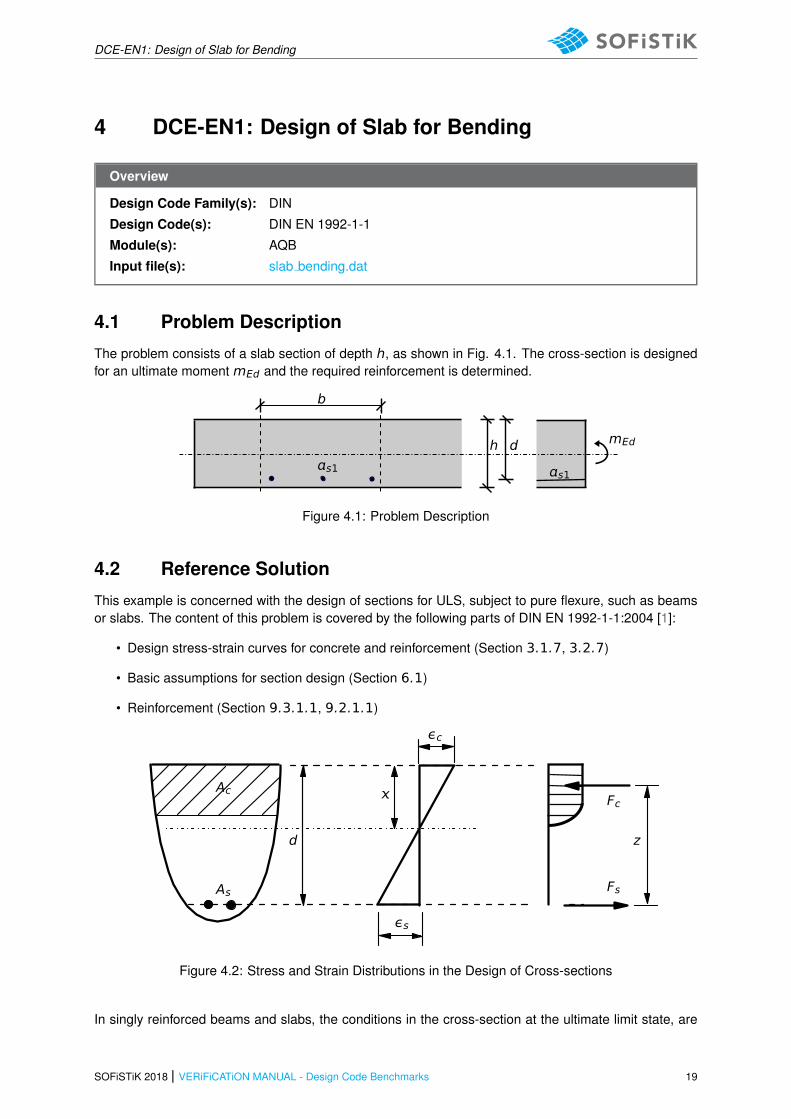
4.1 Problem Description
The problem consists of a slab section of depth h, as shown in Fig. 4.1. The cross-section is designedfor an ultimate moment mEd and the required reinforcement is determined.
mEd
s1s1
b
dh
Figure 4.1: Problem Description
4.2 Reference Solution
This example is concerned with the design of sections for ULS, subject to pure flexure, such as beamsor slabs. The content of this problem is covered by the following parts of DIN EN 1992-1-1:2004 [1]:
• Design stress-strain curves for concrete and reinforcement (Section 3.1.7, 3.2.7)
• Basic assumptions for section design (Section 6.1)
• Reinforcement (Section 9.3.1.1, 9.2.1.1)
εc
εs
z
Fc
Fs
d
As
Ac
Figure 4.2: Stress and Strain Distributions in the Design of Cross-sections
In singly reinforced beams and slabs, the conditions in the cross-section at the ultimate limit state, are
SOFiSTiK 2018 | VERiFiCATiON MANUAL - Design Code Benchmarks 19
DCE-EN1: Design of Slab for Bending
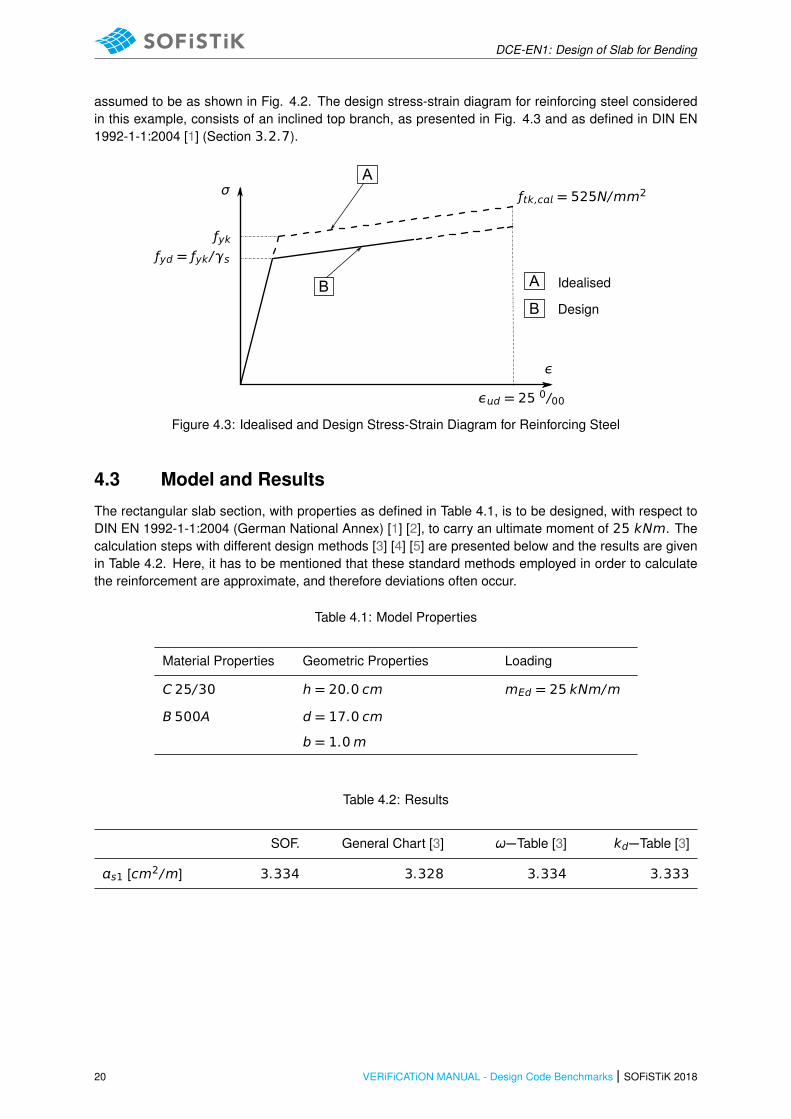
assumed to be as shown in Fig. 4.2. The design stress-strain diagram for reinforcing steel consideredin this example, consists of an inclined top branch, as presented in Fig. 4.3 and as defined in DIN EN1992-1-1:2004 [1] (Section 3.2.7).
A
B A
B
Idealised
Design
ƒyk
ƒtk,c = 525N/mm2
ε
εd = 25 0/00
ƒyd = ƒyk/γs
σ
Figure 4.3: Idealised and Design Stress-Strain Diagram for Reinforcing Steel
4.3 Model and Results
The rectangular slab section, with properties as defined in Table 4.1, is to be designed, with respect toDIN EN 1992-1-1:2004 (German National Annex) [1] [2], to carry an ultimate moment of 25 kNm. Thecalculation steps with different design methods [3] [4] [5] are presented below and the results are givenin Table 4.2. Here, it has to be mentioned that these standard methods employed in order to calculatethe reinforcement are approximate, and therefore deviations often occur.
Table 4.1: Model Properties
Material Properties Geometric Properties Loading
C 25/30 h = 20.0 cm mEd = 25 kNm/m
B 500A d = 17.0 cm
b = 1.0m
Table 4.2: Results
SOF. General Chart [3] ω−Table [3] kd−Table [3]
s1 [cm2/m] 3.334 3.328 3.334 3.333
20 VERiFiCATiON MANUAL - Design Code Benchmarks | SOFiSTiK 2018

DCE-EN1: Design of Slab for Bending
4.4 Design Process1
Design with respect to DIN EN 1992-1-1:2004 (NA) [1] [2]:2
Material:
Concrete: γc = 1.50 (NDP) 2.4.2.4: (1), Tab. 2.1DE: Partialfactors for materialsSteel: γs = 1.15
ƒck = 25 MP Tab. 3.1: Strength for concrete
ƒcd = cc · ƒck/γc = 0.85 · 25/1.5 = 14.17 MP 3.1.6: (1)P, Eq. (3.15): cc = 0.85 con-sidering long term effects
ƒyk = 500 MP 3.2.2: (3)P: yield strength ƒyk = 500MPƒyd = ƒyk/γs = 500/1.15 = 434.78 MP3.2.7: (2), Fig. 3.8
Design Load:
MEd =mEd · b = 25 kNm; NEd = 0MEds = MEd − NEd · zs1 = 25 kNm
Design with respect to General Design Chart Bending with axialforce for rectangular cross-sections:
μEds =MEds
b · d2 · ƒcd=
25 · 10−3
1.0 · 0.172 · 14.17= 0.061
Tab. 9.1 [3]: General Chart for up toC50/60 - Cross-section without com-pression reinforcement
ε = 25 · 10−3; ζ = 0.97 → σs1d = 456.52 MP
s1 =1
σs1d·�
MEds
ζ · d+ NEd
�
= 3.328 cm2/m
Design with respect to ω− (or μs− ) Design Table for rectangularcross-sections:
μEds =MEds
b · d2 · ƒcd=
25 · 10−3
1.0 · 0.172 · 14.17= 0.061
Tab. 9.2 [3]: ω−Table for up to C50/60- Rectangular section without compres-sion reinforcement
ω = 0.0632 (interpolated) and σsd = 456.52 MP
s1 =1
σsd· (ω · b · d · ƒcd + NEd) = 3.334 cm2/m
Design with respect to kd− Design Table for rectangular cross-sections:
kd =d
p
MEds/b=
17p
25/1.0= 3.40
Tab. 9.3 [3]: kd−Table for up toC50/60 - Rectangular section withoutcompression reinforcementks = 2.381, κs = 0.952 (interpolated values)
s1 =�
ks ·MEds
d+NEd
σs1d
�
· κs = 3.333 cm2/m
1The tools used in the design process are based on steel stress-strain diagrams, asdefined in [1] 3.2.7:(2), Fig. 3.8, which can be seen in Fig. 4.3.
2The sections mentioned in the margins refer to DIN EN 1992-1-1:2004 (German Na-tional Annex) [1], [2], unless otherwise specified.
SOFiSTiK 2018 | VERiFiCATiON MANUAL - Design Code Benchmarks 21

DCE-EN1: Design of Slab for Bending
4.5 Conclusion
This example shows the calculation of the required reinforcement for a slab section under bending.Various different reference solutions are employed in order to compare the SOFiSTiK results to. It hasbeen shown that the results are reproduced with excellent accuracy.
4.6 Literature
[1] DIN EN 1992-1-1/NA: Eurocode 2: Design of concrete structures, Part 1-1/NA: General rules andrules for buildings - German version EN 1992-1-1:2005 (D), Nationaler Anhang Deutschland -Stand Februar 2010. CEN. 2010.
[2] F. Fingerloos, J. Hegger, and K. Zilch. DIN EN 1992-1-1 Bemessung und Konstruktion vonStahlbeton- und Spannbetontragwerken - Teil 1-1: Allgemeine Bemessungsregeln und Regelnfur den Hochbau. BVPI, DBV, ISB, VBI. Ernst & Sohn, Beuth, 2012.
[3] K. Holschemacher, T. Muller, and F. Lobisch. Bemessungshilfsmittel fur Betonbauteile nach Eu-rocode 2 Bauingenieure. 3rd. Ernst & Sohn, 2012.
[4] Beispiele zur Bemessung nach Eurocode 2 - Band 1: Hochbau. Ernst & Sohn. Deutschen Beton-und Bautechnik-Verein E.V. 2011.
[5] R. S. Narayanan and A. W. Beeby. Designers’ Guide to EN 1992-1-1 and EN 1992-1-2 - Eurocode2: Design of Concrete Structures. Thomas Telford, 2005.
22 VERiFiCATiON MANUAL - Design Code Benchmarks | SOFiSTiK 2018

DCE-EN2: Design of a Rectangular CS for Bending
5 DCE-EN2: Design of a Rectangular CS for Bending
Overview
Design Code Family(s): DIN
Design Code(s): DIN EN 1992-1-1
Module(s): AQB
Input file(s): rectangular bending.dat
5.1 Problem Description
The problem consists of a rectangular section, as shown in Fig. 5.1. The cross-section is designed foran ultimate moment MEd and the required reinforcement is determined.
MEd
As1
As2
b
d d2h
Figure 5.1: Problem Description
5.2 Reference Solution
This example is concerned with the design of doubly reinforced sections for ULS, subject to pure flexure,such as beams. The content of this problem is covered by the following parts of DIN EN 1992-1-1:2004[1]:
• Design stress-strain curves for concrete and reinforcement (Section 3.1.7, 3.2.7)
• Basic assumptions for section design (Section 6.1)
• Reinforcement (Section 9.3.1.1, 9.2.1.1)
εc
εs1
εs2
σs1d
σs2d
σcd
z
Fc
Fs2d
Fs1d
zs2
d2
zs1
d1
d
As1
As2
Figure 5.2: Stress and Strain Distributions in the Design of Doubly Reinforced Cross-sections
SOFiSTiK 2018 | VERiFiCATiON MANUAL - Design Code Benchmarks 23

DCE-EN2: Design of a Rectangular CS for Bending
In doubly reinforced rectangular beams, the conditions in the cross-section at the ultimate limit state, areassumed to be as shown in Fig. 5.2. The design stress-strain diagram for reinforcing steel consideredin this example, consists of an inclined top branch, as presented in Fig. 5.3 and as defined in DIN EN1992-1-1:2004 [1] (Section 3.2.7).
A
B A
B
Idealised
Design
ƒyk
ƒtk,c = 525N/mm2
ε
εd = 25 0/00
ƒyd = ƒyk/γs
σ
Figure 5.3: Idealised and Design Stress-Strain Diagram for Reinforcing Steel
5.3 Model and Results
The rectangular cross- section, with properties as defined in Table 5.1, is to be designed, with respect toDIN EN 1992-1-1:2004 (German National Annex) [1], [2], to carry an ultimate moment of 135 kNm. Thecalculation steps with different design methods [3] [4] [5] are presented below and the results are givenin Table 5.2. Here, it has to be mentioned that these standard methods employed in order to calculatethe reinforcement are approximate, and therefore deviations often occur.
Table 5.1: Model Properties
Material Properties Geometric Properties Loading
C 20/25 h = 40.0 cm MEd = 135 kNm
B 500A d = 35.0 cm
d2 = 5.0 cm
b = 25 cm
Table 5.2: Results
SOF. General Chart [3] ω−Table [3] kd−Table [3]
As1 [cm2/m] 10.73 10.73 10.77 10.79
As2 [cm2/m] 2.47 2.47 2.52 2.43
24 VERiFiCATiON MANUAL - Design Code Benchmarks | SOFiSTiK 2018
DCE-EN2: Design of a Rectangular CS for Bending
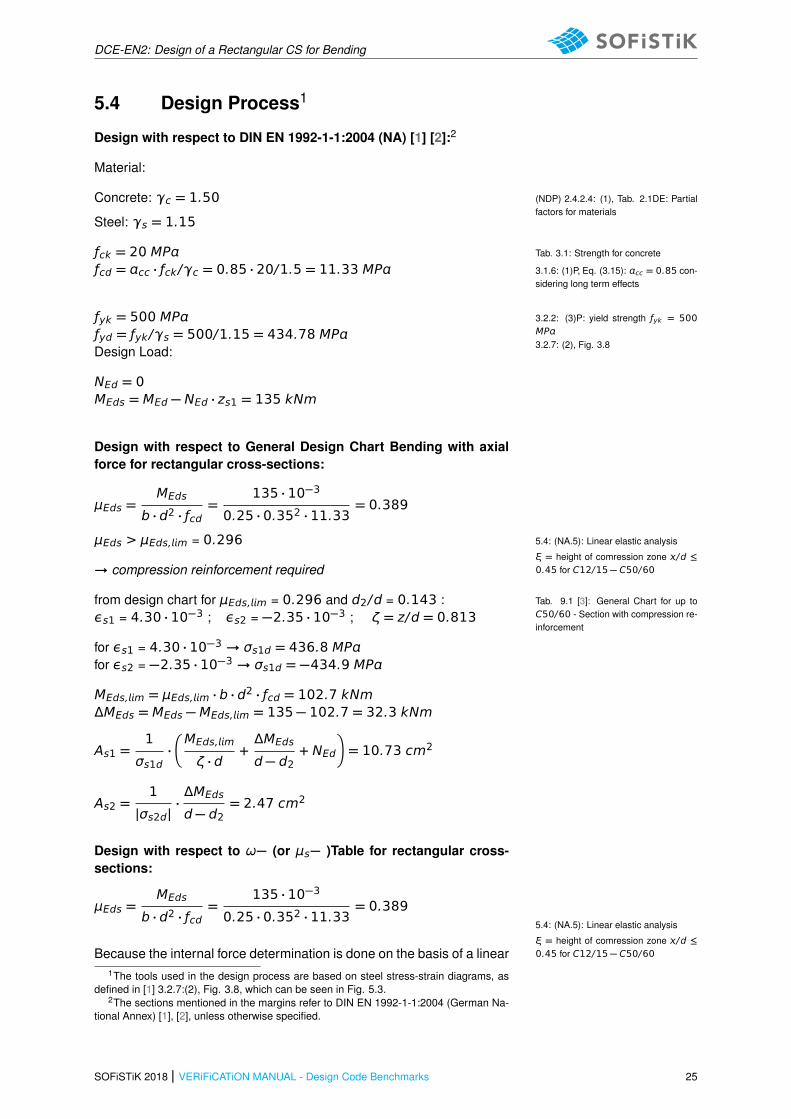
5.4 Design Process1
Design with respect to DIN EN 1992-1-1:2004 (NA) [1] [2]:2
Material:
Concrete: γc = 1.50 (NDP) 2.4.2.4: (1), Tab. 2.1DE: Partialfactors for materials
Steel: γs = 1.15
ƒck = 20 MP Tab. 3.1: Strength for concrete
ƒcd = cc · ƒck/γc = 0.85 · 20/1.5 = 11.33 MP 3.1.6: (1)P, Eq. (3.15): cc = 0.85 con-sidering long term effects
ƒyk = 500 MP 3.2.2: (3)P: yield strength ƒyk = 500MPƒyd = ƒyk/γs = 500/1.15 = 434.78 MP3.2.7: (2), Fig. 3.8
Design Load:
NEd = 0MEds = MEd − NEd · zs1 = 135 kNm
Design with respect to General Design Chart Bending with axialforce for rectangular cross-sections:
μEds =MEds
b · d2 · ƒcd=
135 · 10−3
0.25 · 0.352 · 11.33= 0.389
μEds > μEds,m = 0.296 5.4: (NA.5): Linear elastic analysis
ξ = height of comression zone /d ≤0.45 for C12/15 − C50/60→ compression reinforcement required
from design chart for μEds,m = 0.296 and d2/d = 0.143 : Tab. 9.1 [3]: General Chart for up toC50/60 - Section with compression re-inforcement
εs1 = 4.30 · 10−3 ; εs2 = −2.35 · 10−3 ; ζ = z/d = 0.813
for εs1 = 4.30 · 10−3 → σs1d = 436.8 MPfor εs2 = −2.35 · 10−3 → σs1d = −434.9 MP
MEds,m = μEds,m · b · d2 · ƒcd = 102.7 kNmΔMEds = MEds − MEds,m = 135 − 102.7 = 32.3 kNm
As1 =1
σs1d·�
MEds,m
ζ · d+ΔMEds
d − d2+ NEd
�
= 10.73 cm2
As2 =1
|σs2d|·ΔMEds
d − d2= 2.47 cm2
Design with respect to ω− (or μs− )Table for rectangular cross-sections:
μEds =MEds
b · d2 · ƒcd=
135 · 10−3
0.25 · 0.352 · 11.33= 0.389
5.4: (NA.5): Linear elastic analysis
ξ = height of comression zone /d ≤0.45 for C12/15 − C50/60Because the internal force determination is done on the basis of a linear
1The tools used in the design process are based on steel stress-strain diagrams, asdefined in [1] 3.2.7:(2), Fig. 3.8, which can be seen in Fig. 5.3.
2The sections mentioned in the margins refer to DIN EN 1992-1-1:2004 (German Na-tional Annex) [1], [2], unless otherwise specified.
SOFiSTiK 2018 | VERiFiCATiON MANUAL - Design Code Benchmarks 25
DCE-EN2: Design of a Rectangular CS for Bending
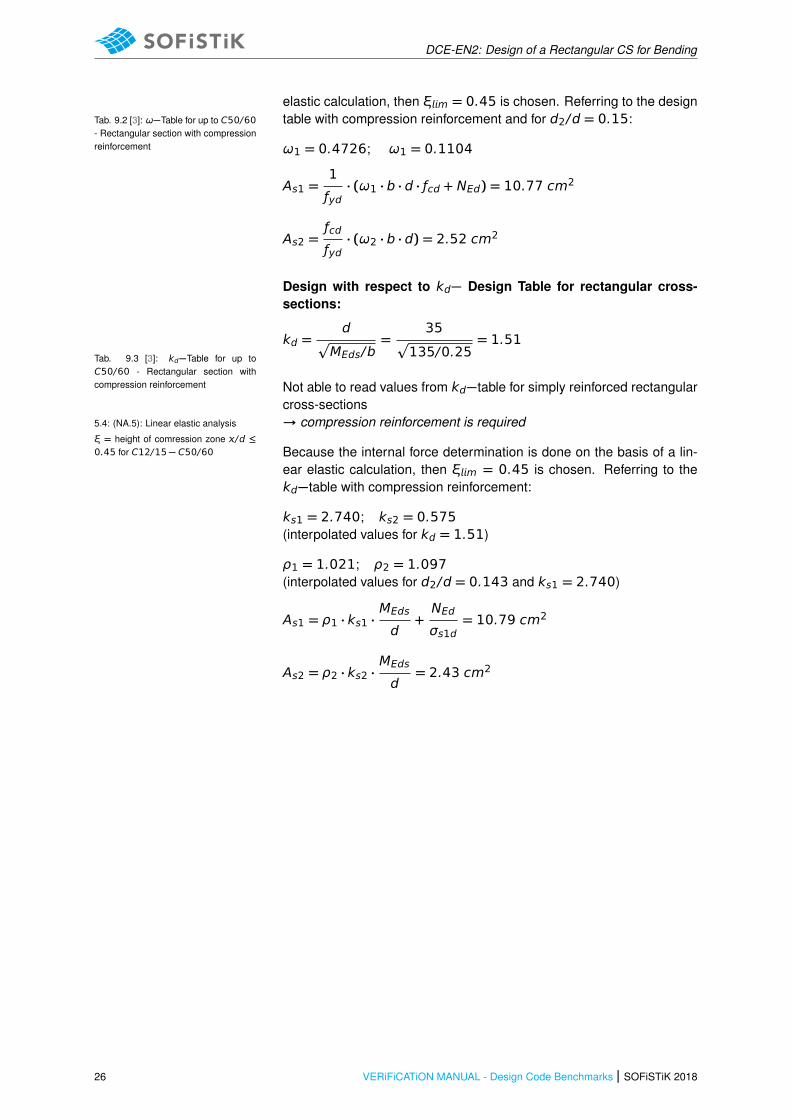
elastic calculation, then ξm = 0.45 is chosen. Referring to the designtable with compression reinforcement and for d2/d = 0.15:Tab. 9.2 [3]: ω−Table for up to C50/60
- Rectangular section with compressionreinforcement ω1 = 0.4726; ω1 = 0.1104
As1 =1
ƒyd· (ω1 · b · d · ƒcd + NEd) = 10.77 cm2
As2 =ƒcd
ƒyd· (ω2 · b · d) = 2.52 cm2
Design with respect to kd− Design Table for rectangular cross-sections:
kd =d
p
MEds/b=
35p
135/0.25= 1.51
Tab. 9.3 [3]: kd−Table for up toC50/60 - Rectangular section withcompression reinforcement Not able to read values from kd−table for simply reinforced rectangular
cross-sections→ compression reinforcement is required5.4: (NA.5): Linear elastic analysis
ξ = height of comression zone /d ≤0.45 for C12/15 − C50/60 Because the internal force determination is done on the basis of a lin-
ear elastic calculation, then ξm = 0.45 is chosen. Referring to thekd−table with compression reinforcement:
ks1 = 2.740; ks2 = 0.575(interpolated values for kd = 1.51)
ρ1 = 1.021; ρ2 = 1.097(interpolated values for d2/d = 0.143 and ks1 = 2.740)
As1 = ρ1 · ks1 ·MEds
d+NEd
σs1d= 10.79 cm2
As2 = ρ2 · ks2 ·MEds
d= 2.43 cm2
26 VERiFiCATiON MANUAL - Design Code Benchmarks | SOFiSTiK 2018
DCE-EN2: Design of a Rectangular CS for Bending
5.5 Conclusion
This example shows the calculation of the required reinforcement for a rectangular beam cross-sectionunder bending. Various different reference solutions are employed in order to compare the SOFiSTiKresults to. It has been shown that the results are reproduced with excellent accuracy.
5.6 Literature
[1] DIN EN 1992-1-1/NA: Eurocode 2: Design of concrete structures, Part 1-1/NA: General rules andrules for buildings - German version EN 1992-1-1:2005 (D), Nationaler Anhang Deutschland -Stand Februar 2010. CEN. 2010.
[2] F. Fingerloos, J. Hegger, and K. Zilch. DIN EN 1992-1-1 Bemessung und Konstruktion vonStahlbeton- und Spannbetontragwerken - Teil 1-1: Allgemeine Bemessungsregeln und Regelnfur den Hochbau. BVPI, DBV, ISB, VBI. Ernst & Sohn, Beuth, 2012.
[3] K. Holschemacher, T. Muller, and F. Lobisch. Bemessungshilfsmittel fur Betonbauteile nach Eu-rocode 2 Bauingenieure. 3rd. Ernst & Sohn, 2012.
[4] Beispiele zur Bemessung nach Eurocode 2 - Band 1: Hochbau. Ernst & Sohn. Deutschen Beton-und Bautechnik-Verein E.V. 2011.
[5] R. S. Narayanan and A. W. Beeby. Designers’ Guide to EN 1992-1-1 and EN 1992-1-2 - Eurocode2: Design of Concrete Structures. Thomas Telford, 2005.
SOFiSTiK 2018 | VERiFiCATiON MANUAL - Design Code Benchmarks 27

DCE-EN2: Design of a Rectangular CS for Bending
28 VERiFiCATiON MANUAL - Design Code Benchmarks | SOFiSTiK 2018
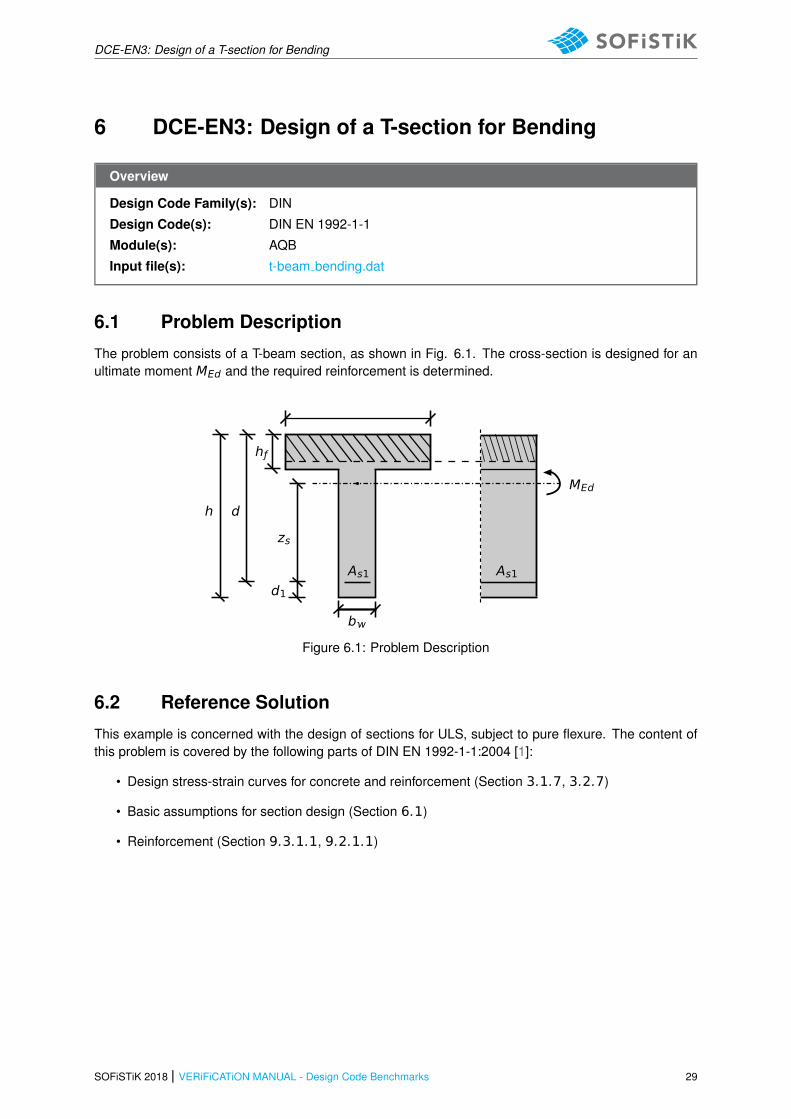
DCE-EN3: Design of a T-section for Bending
6 DCE-EN3: Design of a T-section for Bending
Overview
Design Code Family(s): DIN
Design Code(s): DIN EN 1992-1-1
Module(s): AQB
Input file(s): t-beam bending.dat
6.1 Problem Description
The problem consists of a T-beam section, as shown in Fig. 6.1. The cross-section is designed for anultimate moment MEd and the required reinforcement is determined.
MEd
As1d1
zs
As1
hƒ
b
h d
Figure 6.1: Problem Description
6.2 Reference Solution
This example is concerned with the design of sections for ULS, subject to pure flexure. The content ofthis problem is covered by the following parts of DIN EN 1992-1-1:2004 [1]:
• Design stress-strain curves for concrete and reinforcement (Section 3.1.7, 3.2.7)
• Basic assumptions for section design (Section 6.1)
• Reinforcement (Section 9.3.1.1, 9.2.1.1)
SOFiSTiK 2018 | VERiFiCATiON MANUAL - Design Code Benchmarks 29

DCE-EN3: Design of a T-section for Bending
εc
εs1
zs
As1
Figure 6.2: Stress and Strain Distributions in the Design of T-beams
In doubly reinforced rectangular beams, the conditions in the cross-section at the ultimate limit state, areassumed to be as shown in Fig. 6.2. The design stress-strain diagram for reinforcing steel consideredin this example, consists of an inclined top branch, as presented in Fig. 6.3 and as defined in DIN EN1992-1-1:2004 [1] (Section 3.2.7).
A
B A
B
Idealised
Design
ƒyk
ƒtk,c = 525N/mm2
ε
εd = 25 0/00
ƒyd = ƒyk/γs
σ
Figure 6.3: Idealised and Design Stress-Strain Diagram for Reinforcing Steel
6.3 Model and Results
The T-beam, with properties as defined in Table 6.1, is to be designed, with respect to DIN EN 1992-1-1:2004 (German National Annex) [1], [2], to carry an ultimate moment of 425 kNm. The calculationsteps with different design methods [3] [4] [5] are presented below and the results are given in Table6.2. Here, it has to be mentioned that these standard methods employed in order to calculate thereinforcement are approximate, and therefore deviations often occur.
Table 6.1: Model Properties
Material Properties Geometric Properties Loading
C 20/25 h = 65.0 cm MEd = 425 kNm
B 500A d = 60.0 cm
d1 = 5.0 cm
b = 30 cm
beƒ ƒ = 258 cm
30 VERiFiCATiON MANUAL - Design Code Benchmarks | SOFiSTiK 2018

DCE-EN3: Design of a T-section for Bending
Table 6.1: (continued)
Material Properties Geometric Properties Loading
hƒ = 18 cm
Table 6.2: Results
SOF. ω−Table [3] kd−Table [3]
As1 [cm2/m] 15.90 15.74 15.85
SOFiSTiK 2018 | VERiFiCATiON MANUAL - Design Code Benchmarks 31

DCE-EN3: Design of a T-section for Bending
6.4 Design Process1
Design with respect to DIN EN 1992-1-1:2004 (NA) [1] [2]:2
Material:
Concrete: γc = 1.50(NDP) 2.4.2.4: (1), Tab. 2.1DE: Partialfactors for materials Steel: γs = 1.15
ƒck = 20 MPTab. 3.1: Strength for concrete
ƒcd = cc · ƒck/γc = 0.85 · 20/1.5 = 11.33 MP3.1.6: (1)P, Eq. (3.15): cc = 0.85 con-sidering long term effects
ƒyk = 500 MP3.2.2: (3)P: yield strength ƒyk = 500MP ƒyd = ƒyk/γs = 500/1.15 = 434.78 MP3.2.7: (2), Fig. 3.8
Design Load:
NEd = 0
MEds = MEd − NEd · zs1 = 425 kNm
Design with respect to ω− (or μs− )Table for T-beams:
μEds =MEds
beƒ ƒ · d2 · ƒcd=
425 · 10−3
2.58 · 0.602 · 11.33= 0.040Tab. 9.4 [3]: ω−Table for up to C50/60
- T-beam
Referring to the design table for T-beams for:
μEds = 0.040 and
hƒ
d=0.18
0.60= 0.30;
beƒ ƒ
b=2.58
0.30= 8.6
→ ω1 = 0.039
As1 =1
ƒyd·�
ω1 · beƒ ƒ · d · ƒcd + NEd�
= 15.74 cm2
Design with respect to kd− Design Table for T-beams:
Alternatively, the kd−Tables can be applied, demonstrated that the neu-tral line lies inside the flange.
kd =d
p
MEds/b=
60p
425/2.58= 4.67Tab. 9.3 [3]: kd−Table for up to
C50/60 - Rectangular section withoutcompression reinforcement
Referring to the table for kd = 4.67 and after interpolation
→ ks = 2.351; ξ = 0.060 ; κs = 0.952
= ξ · d = 0.060 · 60 = 3.6 cm ¡ hƒ = 18 cmkd−Table is applicable since the neutralline lies inside the flange
As1 =�
ks ·MEds
d+NEd
σs1d
�
· κs = 15.85 cm2
1The tools used in the design process are based on steel stress-strain diagrams, asdefined in [1] 3.2.7:(2), Fig. 3.8, which can be seen in Fig. 6.3.
2The sections mentioned in the margins refer to DIN EN 1992-1-1:2004 (German Na-tional Annex) [1], [2], unless otherwise specified.
32 VERiFiCATiON MANUAL - Design Code Benchmarks | SOFiSTiK 2018

DCE-EN3: Design of a T-section for Bending
6.5 Conclusion
This example shows the calculation of the required reinforcement for a T-beam under bending. Twodifferent reference solutions are employed in order to compare the SOFiSTiK results to. It has beenshown that the results are reproduced with excellent accuracy.
6.6 Literature
[1] DIN EN 1992-1-1/NA: Eurocode 2: Design of concrete structures, Part 1-1/NA: General rules andrules for buildings - German version EN 1992-1-1:2005 (D), Nationaler Anhang Deutschland -Stand Februar 2010. CEN. 2010.
[2] F. Fingerloos, J. Hegger, and K. Zilch. DIN EN 1992-1-1 Bemessung und Konstruktion vonStahlbeton- und Spannbetontragwerken - Teil 1-1: Allgemeine Bemessungsregeln und Regelnfur den Hochbau. BVPI, DBV, ISB, VBI. Ernst & Sohn, Beuth, 2012.
[3] K. Holschemacher, T. Muller, and F. Lobisch. Bemessungshilfsmittel fur Betonbauteile nach Eu-rocode 2 Bauingenieure. 3rd. Ernst & Sohn, 2012.
[4] Beispiele zur Bemessung nach Eurocode 2 - Band 1: Hochbau. Ernst & Sohn. Deutschen Beton-und Bautechnik-Verein E.V. 2011.
[5] R. S. Narayanan and A. W. Beeby. Designers’ Guide to EN 1992-1-1 and EN 1992-1-2 - Eurocode2: Design of Concrete Structures. Thomas Telford, 2005.
SOFiSTiK 2018 | VERiFiCATiON MANUAL - Design Code Benchmarks 33

DCE-EN3: Design of a T-section for Bending
34 VERiFiCATiON MANUAL - Design Code Benchmarks | SOFiSTiK 2018
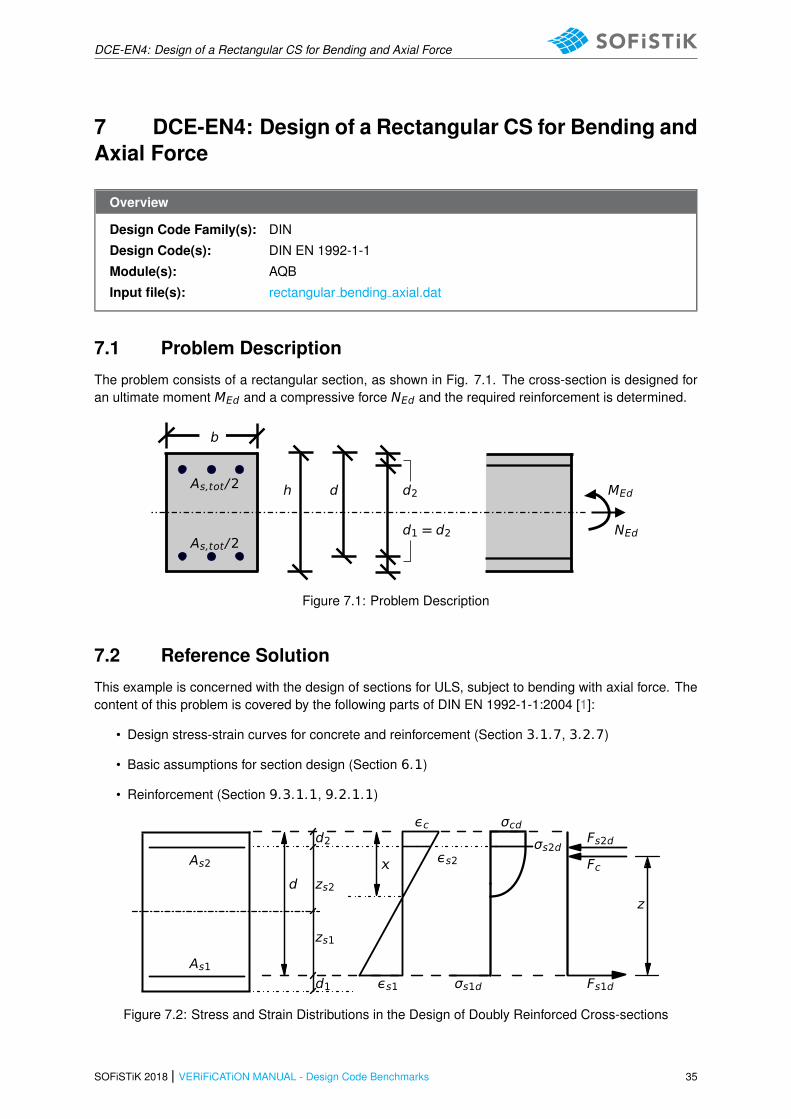
DCE-EN4: Design of a Rectangular CS for Bending and Axial Force
7 DCE-EN4: Design of a Rectangular CS for Bending andAxial Force
Overview
Design Code Family(s): DIN
Design Code(s): DIN EN 1992-1-1
Module(s): AQB
Input file(s): rectangular bending axial.dat
7.1 Problem Description
The problem consists of a rectangular section, as shown in Fig. 7.1. The cross-section is designed foran ultimate moment MEd and a compressive force NEd and the required reinforcement is determined.
MEd
NEdAs,tot/2
As,tot/2
b
d d2
d1 = d2
h
Figure 7.1: Problem Description
7.2 Reference Solution
This example is concerned with the design of sections for ULS, subject to bending with axial force. Thecontent of this problem is covered by the following parts of DIN EN 1992-1-1:2004 [1]:
• Design stress-strain curves for concrete and reinforcement (Section 3.1.7, 3.2.7)
• Basic assumptions for section design (Section 6.1)
• Reinforcement (Section 9.3.1.1, 9.2.1.1)
εc
εs1
εs2
σs1d
σs2d
σcd
z
Fc
Fs2d
Fs1d
zs2
d2
zs1
d1
d
As1
As2
Figure 7.2: Stress and Strain Distributions in the Design of Doubly Reinforced Cross-sections
SOFiSTiK 2018 | VERiFiCATiON MANUAL - Design Code Benchmarks 35

DCE-EN4: Design of a Rectangular CS for Bending and Axial Force
In doubly reinforced rectangular beams, the conditions in the cross-section at the ultimate limit state, areassumed to be as shown in Fig. 7.2. The design stress-strain diagram for reinforcing steel consideredin this example, consists of an horizontal top branch, as presented in Fig. 7.3 and as defined in DIN EN1992-1-1:2004 [1] (Section 3.2.7).
A
B A
B
Idealised
Design
ƒyk
ƒtk,c
ε
ƒyd = ƒyk/γs
σ
Figure 7.3: Idealised and Design Stress-Strain Diagram for Reinforcing Steel
7.3 Model and Results
The rectangular cross- section, with properties as defined in Table 7.1, is to be designed, with respect toDIN EN 1992-1-1:2004 (German National Annex) [1], [2], to carry an ultimate moment of 382 kNm withan axial compressive force of 1785 kN. The calculation steps with a commonly used design method[3] [4] are presented below and the results are given in Table 7.2. Here, it has to be mentioned thatthe standard methods employed in order to calculate the reinforcement are approximate, and thereforedeviations often occur.
Table 7.1: Model Properties
Material Properties Geometric Properties Loading
C 30/37 h = 50.0 cm MEd = 382 kNm
B 500A d = 45.0 cm NEd = −1785 kN
d1 = d2 = 5.0 cm
b = 30 cm
Table 7.2: Results
SOF. Interaction Diagram [3]
As,tot [cm2/m] 35.03 35.19
36 VERiFiCATiON MANUAL - Design Code Benchmarks | SOFiSTiK 2018

DCE-EN4: Design of a Rectangular CS for Bending and Axial Force
7.4 Design Process1
Design with respect to DIN EN 1992-1-1:2004 (NA) [1] [2]:2
Material:
Concrete: γc = 1.50 (NDP) 2.4.2.4: (1), Tab. 2.1DE: Partialfactors for materialsSteel: γs = 1.15
ƒck = 30 MP Tab. 3.1: Strength for concrete
ƒcd = cc · ƒck/γc = 0.85 · 30/1.5 = 17.0 MP 3.1.6: (1)P, Eq. (3.15): cc = 0.85 con-sidering long term effects
ƒyk = 500 MP 3.2.2: (3)P: yield strength ƒyk = 500MPƒyd = ƒyk/γs = 500/1.15 = 434.78 MP3.2.7: (2), Fig. 3.8
Design Load:
NEd = −1785 kNMEd = 382 kNm
ed
h=�
�
�
�
MEd
NEd · h
�
�
�
�
=�
�
�
�
382
−1785 · 0.50
�
�
�
�
= 0.428 < 3.5
→ Axial force dominant → Design with respect to μ − ν interactiondiagram is suggested
Design with respect to Interaction diagram for Bending with axialforce for rectangular cross-sections:
μEd =MEd
b · h2 · ƒcd=
382 · 10−3
0.30 · 0.502 · 17.0= 0.30 Tab. 9.6 [3]: μ − ν Interaction diagram
for concrete C12/15− C50/60 - Rect-angular cross-section with double sym-metric reinforcement.
νEd =NEd
b · h2 · ƒcd=
−1785 · 10−3
0.30 · 0.50 · 17.0= −0.70
from design chart for d1/h = 0.05/0.5 = 0.10:
ωtot = 0.60
As,tot = ωtot ·b · h
ƒyd/ ƒcd= 35.19 cm2
As1 = As2 =As,tot
2= 17.6 cm2
1The tools used in the design process are based on steel stress-strain diagrams, asdefined in [1] 3.2.7:(2), Fig. 3.8, which can be seen in Fig. 7.3.
2The sections mentioned in the margins refer to DIN EN 1992-1-1:2004 (German Na-tional Annex) [1], [2], unless otherwise specified.
SOFiSTiK 2018 | VERiFiCATiON MANUAL - Design Code Benchmarks 37
DCE-EN4: Design of a Rectangular CS for Bending and Axial Force
7.5 Conclusion
This example shows the calculation of the required reinforcement for a rectangular beam cross-sectionunder bending with axial force. It has been shown that the results are reproduced with excellent accu-racy.
7.6 Literature
[1] DIN EN 1992-1-1/NA: Eurocode 2: Design of concrete structures, Part 1-1/NA: General rules andrules for buildings - German version EN 1992-1-1:2005 (D), Nationaler Anhang Deutschland -Stand Februar 2010. CEN. 2010.
[2] F. Fingerloos, J. Hegger, and K. Zilch. DIN EN 1992-1-1 Bemessung und Konstruktion vonStahlbeton- und Spannbetontragwerken - Teil 1-1: Allgemeine Bemessungsregeln und Regelnfur den Hochbau. BVPI, DBV, ISB, VBI. Ernst & Sohn, Beuth, 2012.
[3] K. Holschemacher, T. Muller, and F. Lobisch. Bemessungshilfsmittel fur Betonbauteile nach Eu-rocode 2 Bauingenieure. 3rd. Ernst & Sohn, 2012.
[4] Beispiele zur Bemessung nach Eurocode 2 - Band 1: Hochbau. Ernst & Sohn. Deutschen Beton-und Bautechnik-Verein E.V. 2011.
38 VERiFiCATiON MANUAL - Design Code Benchmarks | SOFiSTiK 2018
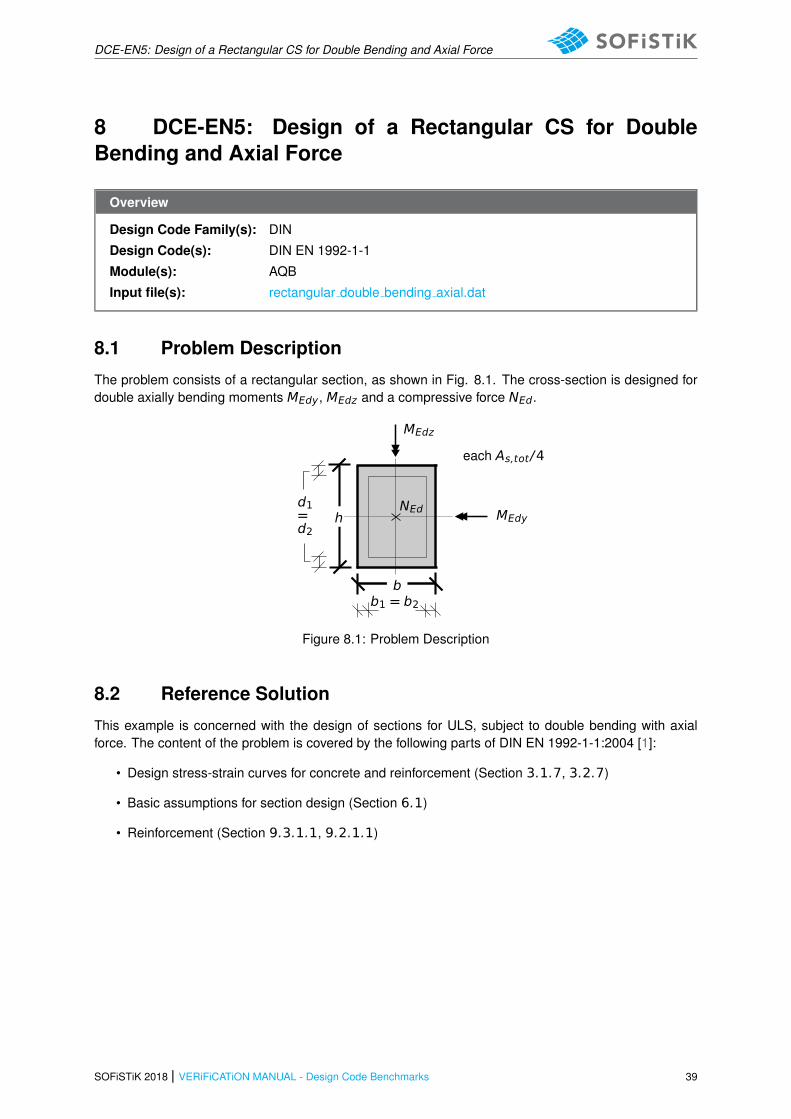
DCE-EN5: Design of a Rectangular CS for Double Bending and Axial Force
8 DCE-EN5: Design of a Rectangular CS for DoubleBending and Axial Force
Overview
Design Code Family(s): DIN
Design Code(s): DIN EN 1992-1-1
Module(s): AQB
Input file(s): rectangular double bending axial.dat
8.1 Problem Description
The problem consists of a rectangular section, as shown in Fig. 8.1. The cross-section is designed fordouble axially bending moments MEdy, MEdz and a compressive force NEd.
MEdyNEd
MEdz
each As,tot/4
bb1 = b2
d1=d2
h
Figure 8.1: Problem Description
8.2 Reference Solution
This example is concerned with the design of sections for ULS, subject to double bending with axialforce. The content of the problem is covered by the following parts of DIN EN 1992-1-1:2004 [1]:
• Design stress-strain curves for concrete and reinforcement (Section 3.1.7, 3.2.7)
• Basic assumptions for section design (Section 6.1)
• Reinforcement (Section 9.3.1.1, 9.2.1.1)
SOFiSTiK 2018 | VERiFiCATiON MANUAL - Design Code Benchmarks 39
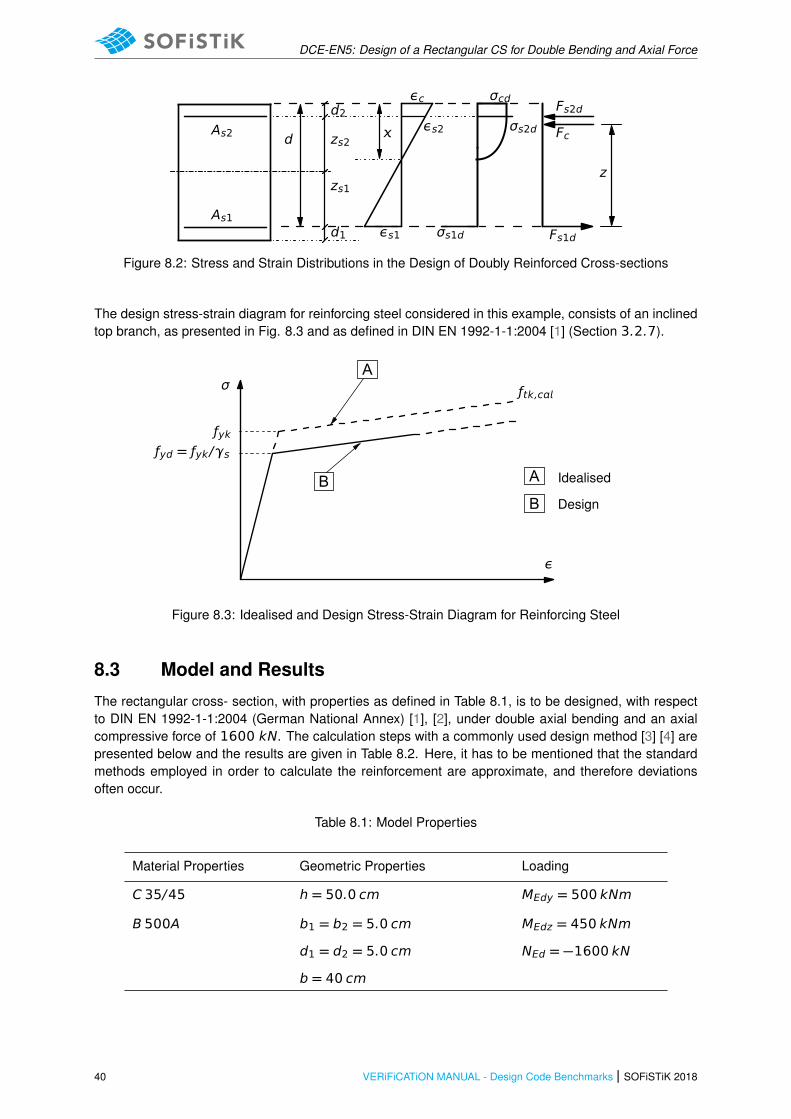
DCE-EN5: Design of a Rectangular CS for Double Bending and Axial Force
εc
εs1
εs2
σs1d
σs2d
σcd
z
Fc
Fs2d
Fs1d
zs2
d2
zs1
d1
d
As1
As2
Figure 8.2: Stress and Strain Distributions in the Design of Doubly Reinforced Cross-sections
The design stress-strain diagram for reinforcing steel considered in this example, consists of an inclinedtop branch, as presented in Fig. 8.3 and as defined in DIN EN 1992-1-1:2004 [1] (Section 3.2.7).
A
B A
B
Idealised
Design
ƒyk
ƒtk,c
ε
ƒyd = ƒyk/γs
σ
Figure 8.3: Idealised and Design Stress-Strain Diagram for Reinforcing Steel
8.3 Model and Results
The rectangular cross- section, with properties as defined in Table 8.1, is to be designed, with respectto DIN EN 1992-1-1:2004 (German National Annex) [1], [2], under double axial bending and an axialcompressive force of 1600 kN. The calculation steps with a commonly used design method [3] [4] arepresented below and the results are given in Table 8.2. Here, it has to be mentioned that the standardmethods employed in order to calculate the reinforcement are approximate, and therefore deviationsoften occur.
Table 8.1: Model Properties
Material Properties Geometric Properties Loading
C 35/45 h = 50.0 cm MEdy = 500 kNm
B 500A b1 = b2 = 5.0 cm MEdz = 450 kNm
d1 = d2 = 5.0 cm NEd = −1600 kN
b = 40 cm
40 VERiFiCATiON MANUAL - Design Code Benchmarks | SOFiSTiK 2018

DCE-EN5: Design of a Rectangular CS for Double Bending and Axial Force
Table 8.2: Results
SOF. Interaction Diagram [3]
As,tot [cm2/m] 115.9 113.1
SOFiSTiK 2018 | VERiFiCATiON MANUAL - Design Code Benchmarks 41

DCE-EN5: Design of a Rectangular CS for Double Bending and Axial Force
8.4 Design Process1
Design with respect to DIN EN 1992-1-1:2004 (NA) [1] [2]:2
Material:
Concrete: γc = 1.50(NDP) 2.4.2.4: (1), Tab. 2.1DE: Partialfactors for materials
Steel: γs = 1.15
ƒck = 30 MPTab. 3.1: Strength for concrete
ƒcd = cc · ƒck/γc = 0.85 · 35/1.5 = 19.8 MP3.1.6: (1)P, Eq. (3.15): cc = 0.85 con-sidering long term effects
ƒyk = 500 MP3.2.2: (3)P: yield strength ƒyk = 500MP ƒyd = ƒyk/γs = 500/1.15 = 434.78 MP3.2.7: (2), Fig. 3.8
Design Load:
NEd = −1600 kNMEdy = 500 kNmMEdz = 450 kNm
Design with respect to Interaction diagram for Double Bendingwith axial force for rectangular cross-sections:
μEdy =MEd
b · h2 · ƒcd=
500 · 10−3
0.40 · 0.502 · 19.8= 0.252
μEdz =MEd
b · h2 · ƒcd=
450 · 10−3
0.40 · 0.502 · 19.8= 0.284
νEd =NEd
b · h2 · ƒcd=
−1600 · 10−3
0.40 · 0.50 · 19.8= −0.403
from design chart→ ωtot = 1.24 for:Tab. 9.7 [3]: μ − ν Interaction diagramfor concrete C12/15− C50/60 - Rect-angular cross-section with all-roundsymmetric reinforcement.
• d1/h = d2/h = 0.05/0.5 = 0.10
• b1/b = b2/b = 0.05/0.4 = 0.08 ≈ 0.10
• ν = −0.4
• μ1 =m�
μEdy;μEdz�
= 0.284
• μ2 =mn�
μEdy;μEdz�
= 0.252
As,tot = ωtot ·b · h
ƒyd/ ƒcd= 113.1 cm2
As,tot/4 = 28.28 cm2
1The tools used in the design process are based on steel stress-strain diagrams, asdefined in [1] 3.2.7:(2), Fig. 3.8, which can be seen in Fig. 8.3.
2The sections mentioned in the margins refer to DIN EN 1992-1-1:2004 (German Na-tional Annex) [1], [2], unless otherwise specified.
42 VERiFiCATiON MANUAL - Design Code Benchmarks | SOFiSTiK 2018
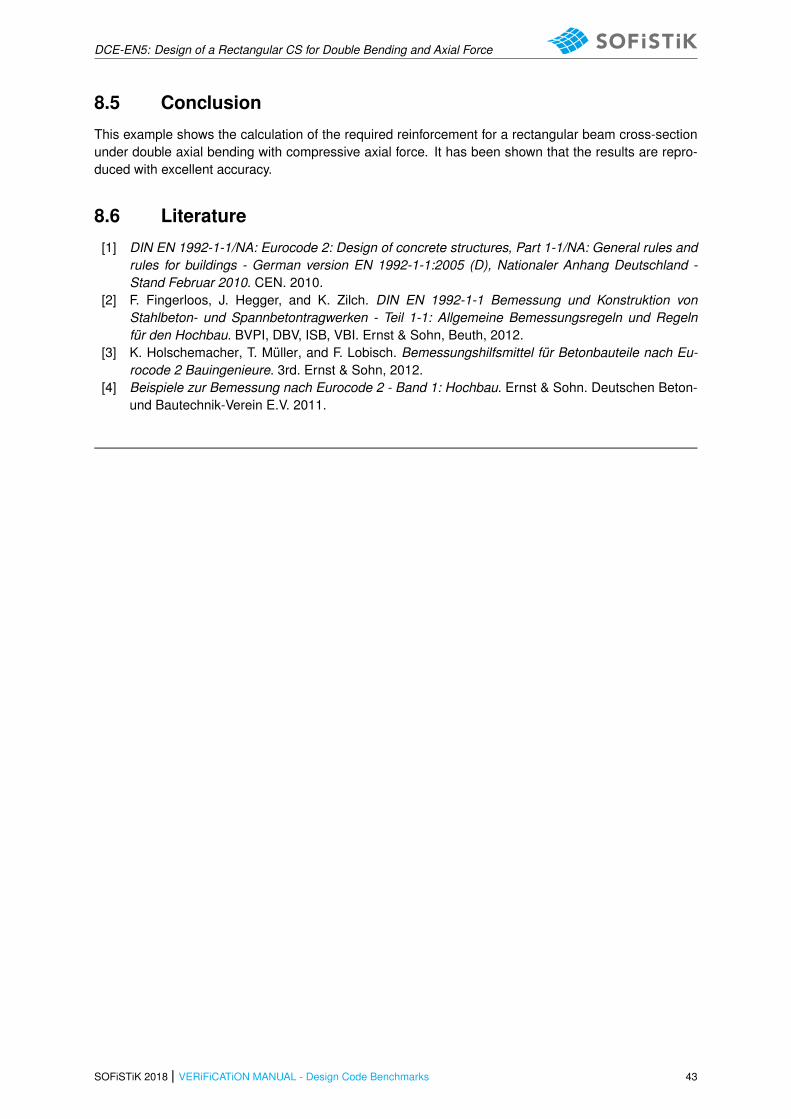
DCE-EN5: Design of a Rectangular CS for Double Bending and Axial Force
8.5 Conclusion
This example shows the calculation of the required reinforcement for a rectangular beam cross-sectionunder double axial bending with compressive axial force. It has been shown that the results are repro-duced with excellent accuracy.
8.6 Literature
[1] DIN EN 1992-1-1/NA: Eurocode 2: Design of concrete structures, Part 1-1/NA: General rules andrules for buildings - German version EN 1992-1-1:2005 (D), Nationaler Anhang Deutschland -Stand Februar 2010. CEN. 2010.
[2] F. Fingerloos, J. Hegger, and K. Zilch. DIN EN 1992-1-1 Bemessung und Konstruktion vonStahlbeton- und Spannbetontragwerken - Teil 1-1: Allgemeine Bemessungsregeln und Regelnfur den Hochbau. BVPI, DBV, ISB, VBI. Ernst & Sohn, Beuth, 2012.
[3] K. Holschemacher, T. Muller, and F. Lobisch. Bemessungshilfsmittel fur Betonbauteile nach Eu-rocode 2 Bauingenieure. 3rd. Ernst & Sohn, 2012.
[4] Beispiele zur Bemessung nach Eurocode 2 - Band 1: Hochbau. Ernst & Sohn. Deutschen Beton-und Bautechnik-Verein E.V. 2011.
SOFiSTiK 2018 | VERiFiCATiON MANUAL - Design Code Benchmarks 43

DCE-EN5: Design of a Rectangular CS for Double Bending and Axial Force
44 VERiFiCATiON MANUAL - Design Code Benchmarks | SOFiSTiK 2018

DCE-EN6: Design of a Rectangular CS for Shear Force
9 DCE-EN6: Design of a Rectangular CS for Shear Force
Overview
Design Code Family(s): EN, DIN
Design Code(s): DIN EN 1992-1-1, EN 1992-1-1
Module(s): AQB
Input file(s): rectangular shear.dat
9.1 Problem Description
The problem consists of a rectangular section, symmetrically reinforced for bending, as shown in Fig.9.1. The cross-section is designed for shear force VEd and the required shear reinforcement is deter-mined.
VEdzdh
b
As,tot/2
As,tot/2
Figure 9.1: Problem Description
9.2 Reference Solution
This example is concerned with the design of sections for ULS, subject to shear force. The content ofthis problem is covered by the following parts of DIN EN 1992-1-1:2004 [1] [2]:
• Design stress-strain curves for concrete and reinforcement (Section 3.1.7, 3.2.7)
• Guidelines for shear design (Section 6.2)
• Reinforcement (Section 9.2.2)
VN
MV(cotθ − cotα)V
Ftd
Fcd
θα
d z
s
shear reinforcement
Figure 9.2: Shear Reinforced Members
The design stress-strain diagram for reinforcing steel considered in this example, consists of an inclined
SOFiSTiK 2018 | VERiFiCATiON MANUAL - Design Code Benchmarks 45
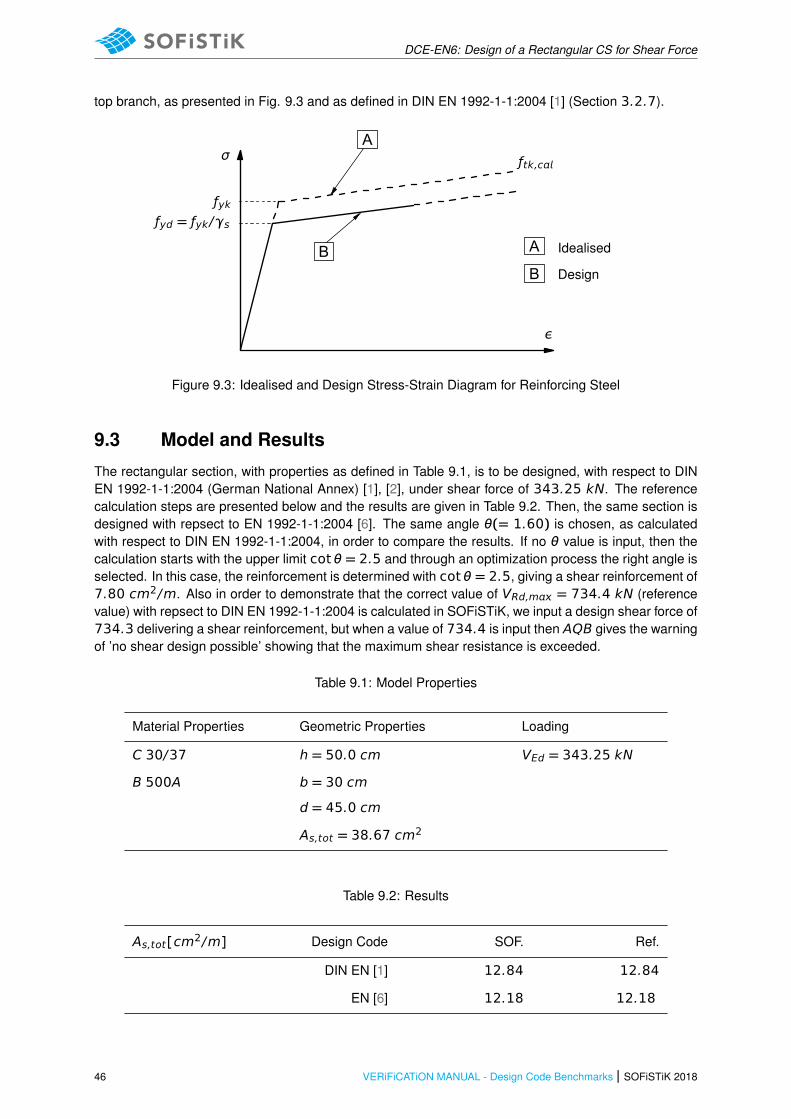
DCE-EN6: Design of a Rectangular CS for Shear Force
top branch, as presented in Fig. 9.3 and as defined in DIN EN 1992-1-1:2004 [1] (Section 3.2.7).
A
B A
B
Idealised
Design
ƒyk
ƒtk,c
ε
ƒyd = ƒyk/γs
σ
Figure 9.3: Idealised and Design Stress-Strain Diagram for Reinforcing Steel
9.3 Model and Results
The rectangular section, with properties as defined in Table 9.1, is to be designed, with respect to DINEN 1992-1-1:2004 (German National Annex) [1], [2], under shear force of 343.25 kN. The referencecalculation steps are presented below and the results are given in Table 9.2. Then, the same section isdesigned with repsect to EN 1992-1-1:2004 [6]. The same angle θ(= 1.60) is chosen, as calculatedwith respect to DIN EN 1992-1-1:2004, in order to compare the results. If no θ value is input, then thecalculation starts with the upper limit cotθ = 2.5 and through an optimization process the right angle isselected. In this case, the reinforcement is determined with cotθ = 2.5, giving a shear reinforcement of7.80 cm2/m. Also in order to demonstrate that the correct value of VRd,m = 734.4 kN (referencevalue) with repsect to DIN EN 1992-1-1:2004 is calculated in SOFiSTiK, we input a design shear force of734.3 delivering a shear reinforcement, but when a value of 734.4 is input then AQB gives the warningof ’no shear design possible’ showing that the maximum shear resistance is exceeded.
Table 9.1: Model Properties
Material Properties Geometric Properties Loading
C 30/37 h = 50.0 cm VEd = 343.25 kN
B 500A b = 30 cm
d = 45.0 cm
As,tot = 38.67 cm2
Table 9.2: Results
As,tot[cm2/m] Design Code SOF. Ref.
DIN EN [1] 12.84 12.84
EN [6] 12.18 12.18
46 VERiFiCATiON MANUAL - Design Code Benchmarks | SOFiSTiK 2018
DCE-EN6: Design of a Rectangular CS for Shear Force
9.4 Design Process1
Material:
Concrete: γc = 1.50 (NDP) 2.4.2.4: (1), Tab. 2.1DE: Partialfactors for materials
Steel: γs = 1.15
ƒck = 30 MP Tab. 3.1: Strength for concrete
ƒcd = cc · ƒck/γc = 0.85 · 30/1.5 = 17.0 MP 3.1.6: (1)P, Eq. (3.15): cc = 0.85 con-sidering long term effects
ƒyk = 500 MP 3.2.2: (3)P: yield strength ƒyk = 500MPƒyd = ƒyk/γs = 500/1.15 = 434.78 MP3.2.7: (2), Fig. 3.8
Design Load: VEd = 343.25 kN
Design with respect to DIN EN 1992-1-1:2004 (NA) [1] [2]:2
z =mx�
d − cV, − 30 mm; d − 2 cV,
(NDP) 6.2.3 (1): Inner lever arm z
z =mx{384; 378} = 384 mm
1.0 ≤ cotθ ≤1.2 + 1.4 σcd / ƒcd1 − VRd,cc / VEd
≤ 3.0 (NDP) 6.2.3 (2): Eq. 6.7aDE
VRd,cc = c · 0.48 · ƒ 1/3ck ·�
1 − 1.2σcd
ƒcd
�
· b · z (NDP) Eq. 6.2.3 (2): 6.7bDEc = 0.5
VRd,cc = 0.5 · 0.48 · 30 1/3 · (1 − 0) · 0.3 · 0.384 (NDP) 6.2.3 (2): σcd = NEd / Ac
VRd,cc = 0.08591 MN = 85.91kN
cotθ =1.2 + 0
1 − 85.91 / 343.25= 1.60 (NDP) 6.2.3 (2): The angle θ should be
limited by Eq. 6.7DE
As,req / s = VEd / (ƒyd · z · cotθ) = 12.84 cm2/m 6.2.3 (3): Eq. 6.8ƒyd = ƒyk /γs = 435 MP
VRd,m = b · z · ν1 · ƒcd / (cotθ + tnθ) (NDP) 6.2.3 (3): Eq. 6.9Maximum shear force VRd,m occursfor θ = 45◦: cotθ = tnθ = 1ν1 = 0.75 · ν2 = 0.75, ν2 = 1 for≤ C50/60
VRd,m = 0.3 · 0.384 · 0.75 · 17 / (1 + 1) = 734.4 kN
Design with respect to EN 1992-1-1:2004 [6]: 3
z = 0.9 · d 6.2.3 (1): Inner lever arm z
z = 0.9 · 450 = 405 mm
1.0 ≤ cotθ ≤ 2.5 → cotθ = 1.60 (choose for comparison) 6.2.3 (2): Eq. 6.7NThe angle θ should be limited by Eq.6.7NAs,req / s = VEd / (ƒyd · z · cotθ) = 12.18 cm2/m
1The tools used in the design process are based on steel stress-strain diagrams, asdefined in [1] 3.2.7:(2), Fig. 3.8, which can be seen in Fig. 9.3.
2The sections mentioned in the margins refer to DIN EN 1992-1-1:2004 (German Na-tional Annex) [1], [2], unless otherwise specified.
3The sections mentioned in the margins refer to EN 1992-1-1:2004 [6], unless other-wise specified.
SOFiSTiK 2018 | VERiFiCATiON MANUAL - Design Code Benchmarks 47
DCE-EN6: Design of a Rectangular CS for Shear Force
9.5 Conclusion
This example shows the calculation of the required reinforcement for a rectangular cross-section undershear force. It has been shown that the results are reproduced with excellent accuracy.
9.6 Literature
[1] DIN EN 1992-1-1/NA: Eurocode 2: Design of concrete structures, Part 1-1/NA: General rules andrules for buildings - German version EN 1992-1-1:2005 (D), Nationaler Anhang Deutschland -Stand Februar 2010. CEN. 2010.
[2] F. Fingerloos, J. Hegger, and K. Zilch. DIN EN 1992-1-1 Bemessung und Konstruktion vonStahlbeton- und Spannbetontragwerken - Teil 1-1: Allgemeine Bemessungsregeln und Regelnfur den Hochbau. BVPI, DBV, ISB, VBI. Ernst & Sohn, Beuth, 2012.
[6] EN 1992-1-1: Eurocode 2: Design of concrete structures, Part 1-1: General rules and rules forbuildings. CEN. 2004.
48 VERiFiCATiON MANUAL - Design Code Benchmarks | SOFiSTiK 2018

DCE-EN7: Design of a T-section for Shear
10 DCE-EN7: Design of a T-section for Shear
Overview
Design Code Family(s): EN
Design Code(s): EN 1992-1-1
Module(s): AQB
Input file(s): t-beam shear.dat
10.1 Problem Description
The problem consists of a T-section, as shown in Fig. 10.1. The cross-section is designed for an ultimateshear force VEd and the required reinforcement is determined.
VEd
As1d1
zs
As1
hƒ
beƒ ƒ
b
h d
Figure 10.1: Problem Description
10.2 Reference Solution
This example is concerned with the design of sections for ULS, subject to shear force. The content ofthis problem is covered by the following parts of EN 1992-1-1:2004 [6]:
• Design stress-strain curves for concrete and reinforcement (Section 3.1.7, 3.2.7)
• Guidelines for shear design (Section 6.2)
• Reinforcement (Section 9.2.2)
VN
MV(cotθ − cotα)V
Ftd
Fcd
θα
d z
s
shear reinforcement
Figure 10.2: Shear Reinforced Members
SOFiSTiK 2018 | VERiFiCATiON MANUAL - Design Code Benchmarks 49

DCE-EN7: Design of a T-section for Shear
The design stress-strain diagram for reinforcing steel considered in this example, consists of an inclinedtop branch, as presented in Fig. 10.3 and as defined in EN 1992-1-1:2004 [6] (Section 3.2.7).
A
B A
B
Idealised
Design
ƒyk
ƒtk,c
ε
ƒyd = ƒyk/γs
σ
Figure 10.3: Idealised and Design Stress-Strain Diagram for Reinforcing Steel
10.3 Model and Results
The T-section, with properties as defined in Table 10.1, is to be designed, with respect to EN 1992-1-1:2004 [6] to carry an ultimate shear force of 450 kN. The reference calculation steps are presentedbelow and the results are given in Table 10.2.
Table 10.1: Model Properties
Material Properties Geometric Properties Loading
C 30/37 h = 60.0 cm VEd = 450 kN
B 500A d = 53.0 cm
d1 = 7.0 cm
b = 30 cm
beƒ ƒ = 180 cm
hƒ = 15 cm
As1 = 15 cm2
The intermediate steps of calculating the required reinforcement are also validated in this example.First we calculate the design value for the shear resistance VRd,c for members not requiring shearreinforcement.
It gives a value of VRd,c = 62.52 kN.
Checking the results in AQB, we can see that SOFiSTiK outputs also Vrd1,c = 62.52 kN.
Just to test this result, if we input a shear force of VEd = 62.51 kN just below the value for VRd,c, AQBwill not output any value for cotθ and the minimum reinforcement will be printed (M). If we now give avalue of VEd = 62.53 kN just larger than VRd,c, then AQB will start increasing cotθ and the minimum
50 VERiFiCATiON MANUAL - Design Code Benchmarks | SOFiSTiK 2018
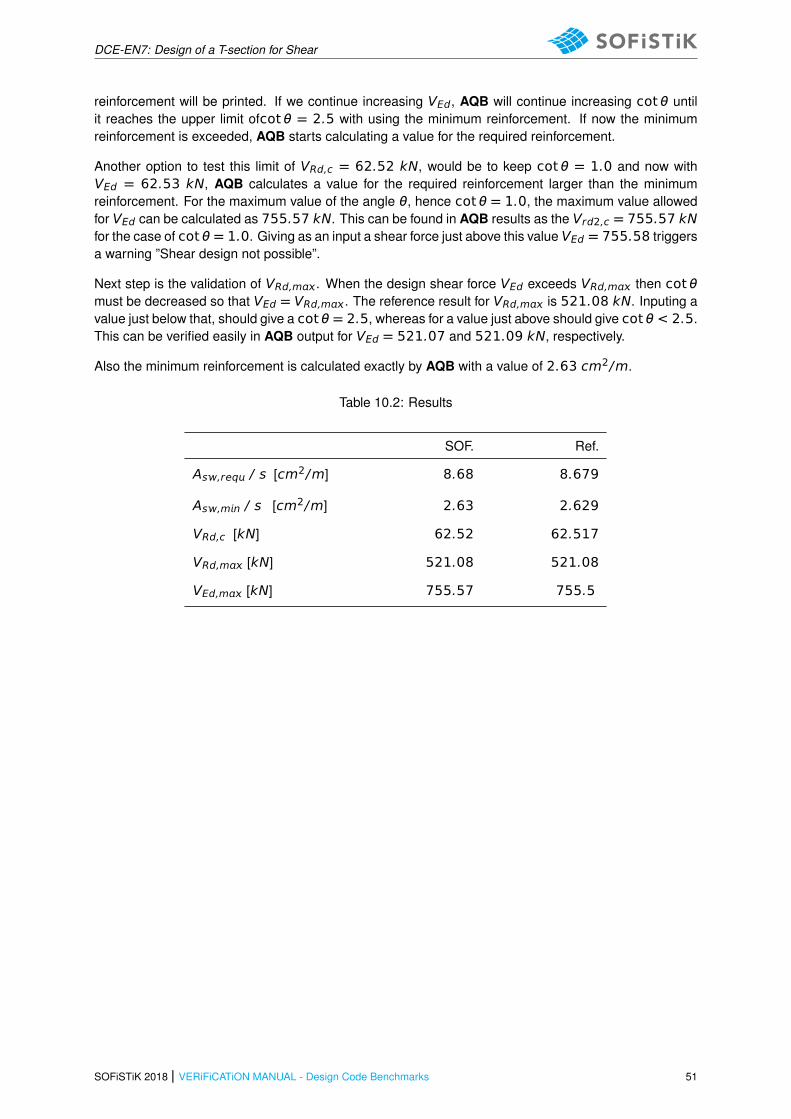
DCE-EN7: Design of a T-section for Shear
reinforcement will be printed. If we continue increasing VEd, AQB will continue increasing cotθ untilit reaches the upper limit ofcotθ = 2.5 with using the minimum reinforcement. If now the minimumreinforcement is exceeded, AQB starts calculating a value for the required reinforcement.
Another option to test this limit of VRd,c = 62.52 kN, would be to keep cotθ = 1.0 and now withVEd = 62.53 kN, AQB calculates a value for the required reinforcement larger than the minimumreinforcement. For the maximum value of the angle θ, hence cotθ = 1.0, the maximum value allowedfor VEd can be calculated as 755.57 kN. This can be found in AQB results as the Vrd2,c = 755.57 kNfor the case of cotθ = 1.0. Giving as an input a shear force just above this value VEd = 755.58 triggersa warning ”Shear design not possible”.
Next step is the validation of VRd,m. When the design shear force VEd exceeds VRd,m then cotθmust be decreased so that VEd = VRd,m. The reference result for VRd,m is 521.08 kN. Inputing avalue just below that, should give a cotθ = 2.5, whereas for a value just above should give cotθ < 2.5.This can be verified easily in AQB output for VEd = 521.07 and 521.09 kN, respectively.
Also the minimum reinforcement is calculated exactly by AQB with a value of 2.63 cm2/m.
Table 10.2: Results
SOF. Ref.
As,req / s [cm2/m] 8.68 8.679
As,mn / s [cm2/m] 2.63 2.629
VRd,c [kN] 62.52 62.517
VRd,m [kN] 521.08 521.08
VEd,m [kN] 755.57 755.5
SOFiSTiK 2018 | VERiFiCATiON MANUAL - Design Code Benchmarks 51

DCE-EN7: Design of a T-section for Shear
10.4 Design Process1
Material: Concrete: γc = 1.50(NDP) 2.4.2.4: (1), Tab. 2.1DE: Partialfactors for materials
Steel: γs = 1.15
ƒck = 30 MPTab. 3.1: Strength for concrete
ƒcd = cc · ƒck/γc = 1.0 · 30/1.5 = 20.0 MP
αcc = 1.03.1.6: (1)P, Eq. (3.15): cc = 0.85 con-sidering long term effects
ƒyk = 500 MP3.2.2: (3)P: yield strength ƒyk = 500MP ƒyd = ƒyk/γs = 500/1.15 = 434.78 MP3.2.7: (2), Fig. 3.8
Design Load: VEd = 450.0 kN
Design with respect to EN 1992-1-1:2004 [6]:2
z ≈ 0.9 · d = 0.9 · 530 = 477 mm6.2.3 (1): Inner lever arm z
VRd,c =�
CRd,c · k · (100 · ρ1 · ƒck) 1/3 + k1 · σcp�
· b · d6.2.2 (1): Design value for shear resis-tance VRd,c for members not requiringdesign shear reinforcement CRd,c = 0.18/γc = 0.12
k = 1 +
√
√200
d= 1.6143 < 2.0
ρ1 =As
bd= 0.00 < 0.02
VRd,c =�
0.12 · 1.6143 · (100 · 0.0 · 30) 1/3 + 0�
· 0.3 · 0.53
VRd,c = 0.00 kN ≥ VRd,c,mn
VRd,c,mn = (mn + k1 · σcp) · b · d
mn = 0.035 · k3/2 · ƒ1/2ck
mn = 0.035 · 1.6143 · 301/2 = 0.39319
VRd,c,mn = (0.39319 + 0.0) · 0.3 · 0.53 = 0.062517 MN
VRd,c,mn = 62.517 kN→ VRd,c = 62.517 kN
VEd > VRd,c → shear reinforcement is required
1.0 ≤ cotθ ≤ 2.5→ start with cotθ = 2.506.2.3 (2): Eq. 6.7N: The angle θ shouldbe limited by Eq. 6.7N
VRd,m = b · z · ν · ƒcd /(cotθ + tnθ)6.2.3 (3): Eq. 6.9
ν = 0.6 ·�
1 −ƒck
250
�
= 0.5286.2.2 (6): Eq. 6.6N
Min. reinforcement:1The tools used in the design process are based on steel stress-strain diagrams, as
defined in [6] 3.2.7:(2), Fig. 3.8, which can be seen in Fig. 10.3.2The sections mentioned in the margins refer to EN 1992-1-1:2004 [6], unless other-
wise specified.
52 VERiFiCATiON MANUAL - Design Code Benchmarks | SOFiSTiK 2018
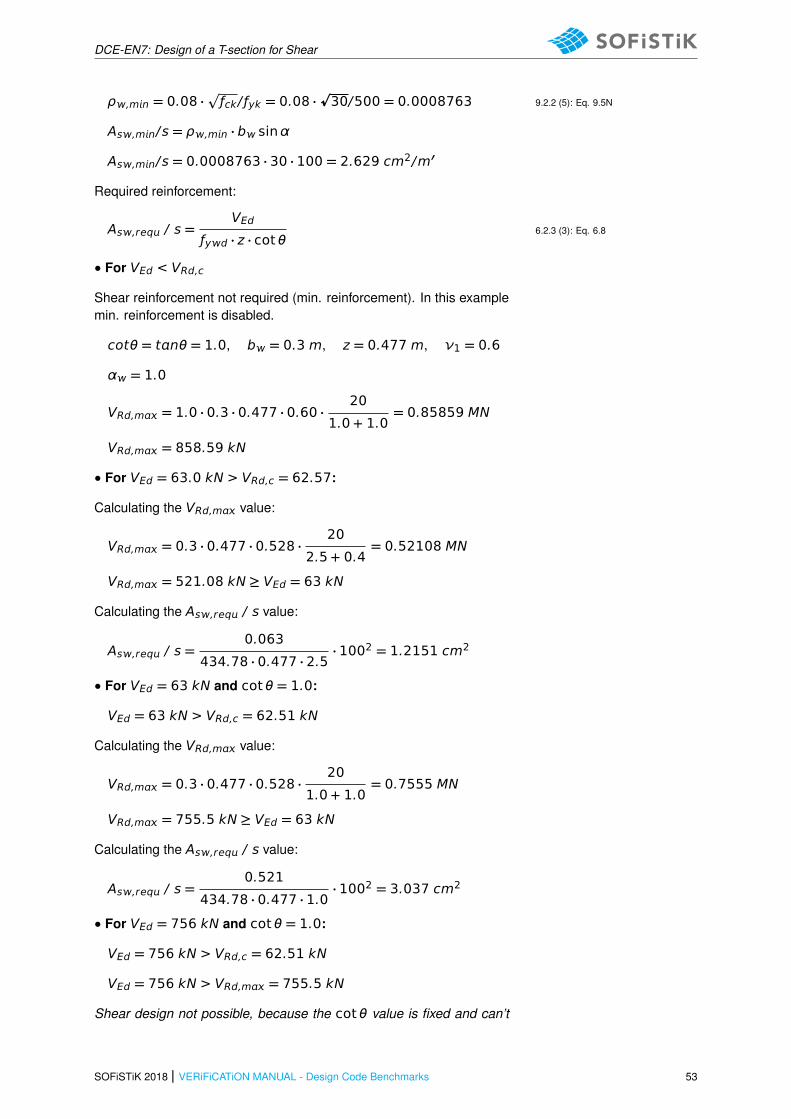
DCE-EN7: Design of a T-section for Shear
ρ,mn = 0.08 ·p
ƒck/ ƒyk = 0.08 ·p30/500 = 0.0008763 9.2.2 (5): Eq. 9.5N
As,mn/s = ρ,mn · b sinα
As,mn/s = 0.0008763 · 30 · 100 = 2.629 cm2/m′
Required reinforcement:
As,req / s =VEd
ƒyd · z · cotθ6.2.3 (3): Eq. 6.8
• For VEd < VRd,c
Shear reinforcement not required (min. reinforcement). In this examplemin. reinforcement is disabled.
cotθ = tnθ = 1.0, b = 0.3 m, z = 0.477 m, ν1 = 0.6
α = 1.0
VRd,m = 1.0 · 0.3 · 0.477 · 0.60 ·20
1.0 + 1.0= 0.85859 MN
VRd,m = 858.59 kN
• For VEd = 63.0 kN > VRd,c = 62.57:
Calculating the VRd,m value:
VRd,m = 0.3 · 0.477 · 0.528 ·20
2.5 + 0.4= 0.52108 MN
VRd,m = 521.08 kN ≥ VEd = 63 kN
Calculating the As,req / s value:
As,req / s =0.063
434.78 · 0.477 · 2.5· 1002 = 1.2151 cm2
• For VEd = 63 kN and cotθ = 1.0:
VEd = 63 kN > VRd,c = 62.51 kN
Calculating the VRd,m value:
VRd,m = 0.3 · 0.477 · 0.528 ·20
1.0 + 1.0= 0.7555 MN
VRd,m = 755.5 kN ≥ VEd = 63 kN
Calculating the As,req / s value:
As,req / s =0.521
434.78 · 0.477 · 1.0· 1002 = 3.037 cm2
• For VEd = 756 kN and cotθ = 1.0:
VEd = 756 kN > VRd,c = 62.51 kN
VEd = 756 kN > VRd,m = 755.5 kN
Shear design not possible, because the cotθ value is fixed and can’t
SOFiSTiK 2018 | VERiFiCATiON MANUAL - Design Code Benchmarks 53
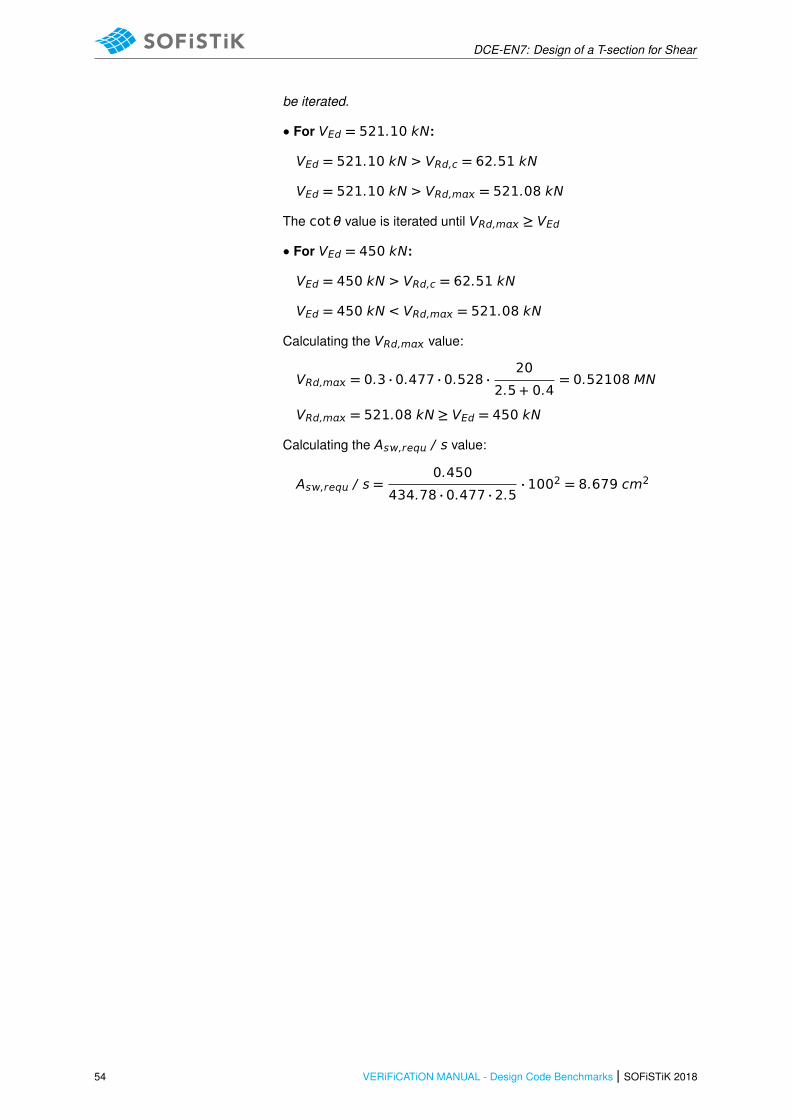
DCE-EN7: Design of a T-section for Shear
be iterated.
• For VEd = 521.10 kN:
VEd = 521.10 kN > VRd,c = 62.51 kN
VEd = 521.10 kN > VRd,m = 521.08 kN
The cotθ value is iterated until VRd,m ≥ VEd
• For VEd = 450 kN:
VEd = 450 kN > VRd,c = 62.51 kN
VEd = 450 kN < VRd,m = 521.08 kN
Calculating the VRd,m value:
VRd,m = 0.3 · 0.477 · 0.528 ·20
2.5 + 0.4= 0.52108 MN
VRd,m = 521.08 kN ≥ VEd = 450 kN
Calculating the As,req / s value:
As,req / s =0.450
434.78 · 0.477 · 2.5· 1002 = 8.679 cm2
54 VERiFiCATiON MANUAL - Design Code Benchmarks | SOFiSTiK 2018
DCE-EN7: Design of a T-section for Shear
10.5 Conclusion
This example shows the calculation of the required reinforcement for a T-beam under shear force. It hasbeen shown that the results are reproduced with excellent accuracy.
10.6 Literature
[6] EN 1992-1-1: Eurocode 2: Design of concrete structures, Part 1-1: General rules and rules forbuildings. CEN. 2004.
SOFiSTiK 2018 | VERiFiCATiON MANUAL - Design Code Benchmarks 55

DCE-EN7: Design of a T-section for Shear
56 VERiFiCATiON MANUAL - Design Code Benchmarks | SOFiSTiK 2018
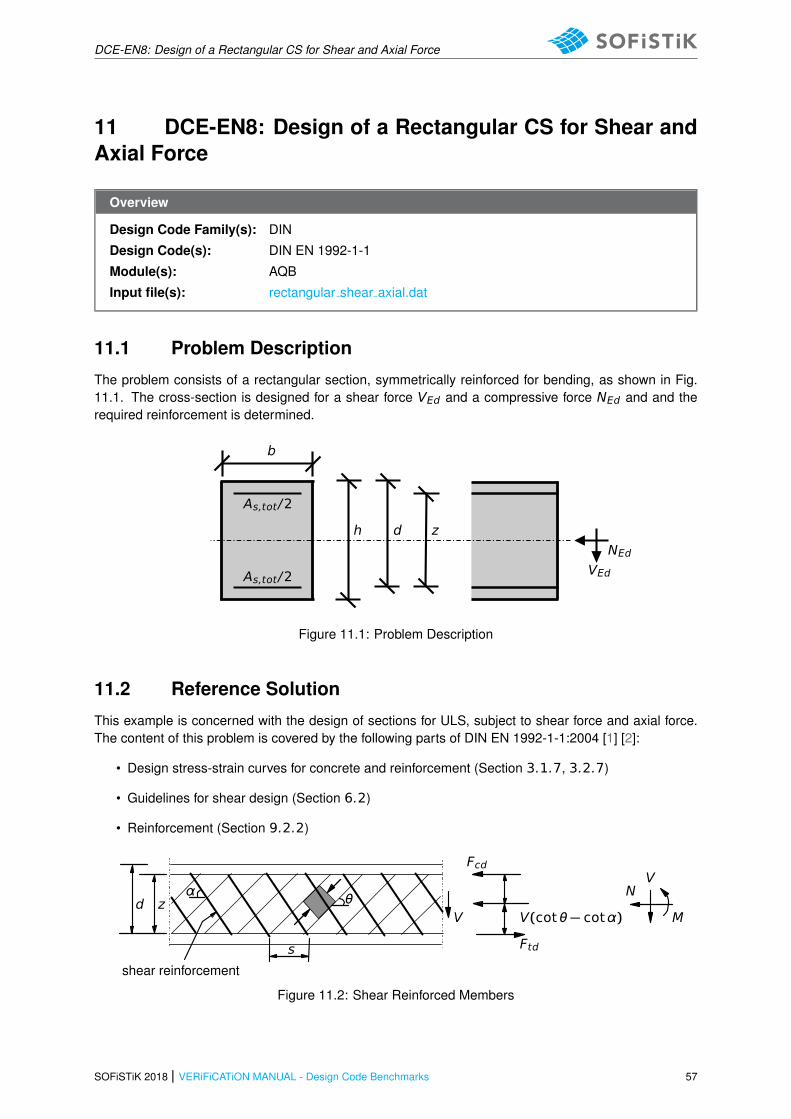
DCE-EN8: Design of a Rectangular CS for Shear and Axial Force
11 DCE-EN8: Design of a Rectangular CS for Shear andAxial Force
Overview
Design Code Family(s): DIN
Design Code(s): DIN EN 1992-1-1
Module(s): AQB
Input file(s): rectangular shear axial.dat
11.1 Problem Description
The problem consists of a rectangular section, symmetrically reinforced for bending, as shown in Fig.11.1. The cross-section is designed for a shear force VEd and a compressive force NEd and and therequired reinforcement is determined.
VEd
NEd
zdh
b
As,tot/2
As,tot/2
Figure 11.1: Problem Description
11.2 Reference Solution
This example is concerned with the design of sections for ULS, subject to shear force and axial force.The content of this problem is covered by the following parts of DIN EN 1992-1-1:2004 [1] [2]:
• Design stress-strain curves for concrete and reinforcement (Section 3.1.7, 3.2.7)
• Guidelines for shear design (Section 6.2)
• Reinforcement (Section 9.2.2)
VN
MV(cotθ − cotα)V
Ftd
Fcd
θα
d z
s
shear reinforcement
Figure 11.2: Shear Reinforced Members
SOFiSTiK 2018 | VERiFiCATiON MANUAL - Design Code Benchmarks 57

DCE-EN8: Design of a Rectangular CS for Shear and Axial Force
The design stress-strain diagram for reinforcing steel considered in this example, consists of an inclinedtop branch, as presented in Fig. 11.3 and defined in DIN EN 1992-1-1:2004 [1].
A
B A
B
Idealised
Design
ƒyk
ε
ƒyd = ƒyk/γs
σ
Figure 11.3: Idealised and Design Stress-Strain Diagram for Reinforcing Steel
11.3 Model and Results
The rectangular cross-section, with properties as defined in Table 11.1, is to be designed, with respectto DIN EN 1992-1-1:2004 (German National Annex) [1], [2], under a shear force of 343.25 kN and acompressive axial force of 500.0 kN . The reference calculation steps are presented below and theresults are given in Table 11.2.
Table 11.1: Model Properties
Material Properties Geometric Properties Loading
C 30/37 h = 50.0 cm VEd = 343.25 kN
B 500A b = 30 cm NEd = 500.0 kN
d = 45.0 cm
As,tot = 38.67 cm2
cV, = 3.6 cm
Table 11.2: Results
SOF. Ref.
As / s [cm2/m] 11.27 11.27
VRd,c [kN] 132.71 132.71
cotθ 1.82 1.82
58 VERiFiCATiON MANUAL - Design Code Benchmarks | SOFiSTiK 2018
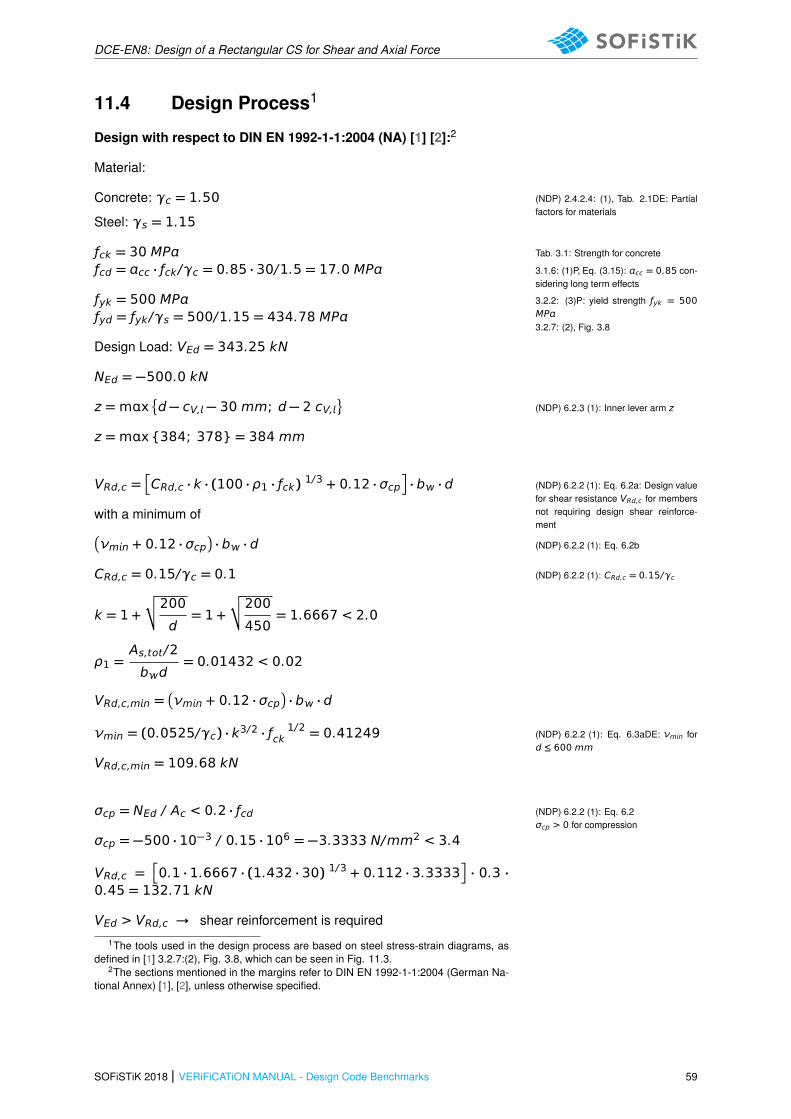
DCE-EN8: Design of a Rectangular CS for Shear and Axial Force
11.4 Design Process1
Design with respect to DIN EN 1992-1-1:2004 (NA) [1] [2]:2
Material:
Concrete: γc = 1.50 (NDP) 2.4.2.4: (1), Tab. 2.1DE: Partialfactors for materials
Steel: γs = 1.15
ƒck = 30 MP Tab. 3.1: Strength for concrete
ƒcd = cc · ƒck/γc = 0.85 · 30/1.5 = 17.0 MP 3.1.6: (1)P, Eq. (3.15): cc = 0.85 con-sidering long term effects
ƒyk = 500 MP 3.2.2: (3)P: yield strength ƒyk = 500MPƒyd = ƒyk/γs = 500/1.15 = 434.78 MP3.2.7: (2), Fig. 3.8
Design Load: VEd = 343.25 kN
NEd = −500.0 kN
z =mx�
d − cV, − 30 mm; d − 2 cV,
(NDP) 6.2.3 (1): Inner lever arm z
z =mx{384; 378} = 384 mm
VRd,c =�
CRd,c · k · (100 · ρ1 · ƒck) 1/3 + 0.12 · σcp�
· b · d (NDP) 6.2.2 (1): Eq. 6.2a: Design valuefor shear resistance VRd,c for membersnot requiring design shear reinforce-ment
with a minimum of�
νmn + 0.12 · σcp�
· b · d (NDP) 6.2.2 (1): Eq. 6.2b
CRd,c = 0.15/γc = 0.1 (NDP) 6.2.2 (1): CRd,c = 0.15/γc
k = 1 +
√
√200
d= 1 +
√
√200
450= 1.6667 < 2.0
ρ1 =As,tot/2
bd= 0.01432 < 0.02
VRd,c,mn =�
νmn + 0.12 · σcp�
· b · d
νmn = (0.0525/γc) · k3/2 · ƒ 1/2ck = 0.41249 (NDP) 6.2.2 (1): Eq. 6.3aDE: νmn for
d ≤ 600 mm
VRd,c,mn = 109.68 kN
σcp = NEd / Ac < 0.2 · ƒcd (NDP) 6.2.2 (1): Eq. 6.2σcp > 0 for compression
σcp = −500 · 10−3 / 0.15 · 106 = −3.3333 N/mm2 < 3.4
VRd,c =�
0.1 · 1.6667 · (1.432 · 30) 1/3 + 0.112 · 3.3333�
· 0.3 ·0.45 = 132.71 kN
VEd > VRd,c → shear reinforcement is required
1The tools used in the design process are based on steel stress-strain diagrams, asdefined in [1] 3.2.7:(2), Fig. 3.8, which can be seen in Fig. 11.3.
2The sections mentioned in the margins refer to DIN EN 1992-1-1:2004 (German Na-tional Annex) [1], [2], unless otherwise specified.
SOFiSTiK 2018 | VERiFiCATiON MANUAL - Design Code Benchmarks 59
DCE-EN8: Design of a Rectangular CS for Shear and Axial Force
1.0 ≤ cotθ ≤1.2 + 1.4 σcd / ƒcd1 − VRd,cc / VEd
≤ 3.0(NDP) 6.2.3 (2): Eq. 6.7aDE
VRd,cc = c · 0.48 · ƒ 1/3ck ·�
1 − 1.2σcd
ƒcd
�
· b · z(NDP) 6.2.3 (2): Eq. 6.7bDEc = 0.5
σcp = NEd / Ac(NDP) 6.2.3 (2): σcd = NEd / Ac
σcd = −500 · 10−3 / 0.15 · 106 = −3.3333 N/mm2
VRd,cc = 0.5 · 0.48 · 30 1/3 ·�
1 − 1.23.3333
17.0
�
· 0.3 · 0.3846.7DE: σcd > 0 for compression
VRd,cc = 65.6948 kN
cotθ =1.2 + 1.4 · 3.3333 / 17.0
1 − 65.6948 / 343.25= 1.823(NDP) 6.2.3 (2): The angle θ should be
limited by Eq. 6.7DE
As,req / s = VEd / (ƒyd · z · cotθ) = 11.27 cm2/m6.2.3 (3): Eq. 6.8ƒyd = ƒyk /γs = 435 MP
VRd,m = b · z · ν1 · ƒcd / (cotθ + tnθ)(NDP) 6.2.3 (3): Eq. 6.9Maximum shear force VRd,m occursfor θ = 45◦: cotθ = tnθ = 1(NDP) ν1 = 0.75 · ν2 = 0.75, ν2 = 1for ≤ C50/60
VRd,m = 0.3 · 0.384 · 0.75 · 17 / (1 + 1) = 734.4 kN
60 VERiFiCATiON MANUAL - Design Code Benchmarks | SOFiSTiK 2018
DCE-EN8: Design of a Rectangular CS for Shear and Axial Force
11.5 Conclusion
This example shows the calculation of the required reinforcement for a rectangular beam cross-sectionunder shear with compressive axial force. It has been shown that the results are reproduced withexcellent accuracy.
11.6 Literature
[1] DIN EN 1992-1-1/NA: Eurocode 2: Design of concrete structures, Part 1-1/NA: General rules andrules for buildings - German version EN 1992-1-1:2005 (D), Nationaler Anhang Deutschland -Stand Februar 2010. CEN. 2010.
[2] F. Fingerloos, J. Hegger, and K. Zilch. DIN EN 1992-1-1 Bemessung und Konstruktion vonStahlbeton- und Spannbetontragwerken - Teil 1-1: Allgemeine Bemessungsregeln und Regelnfur den Hochbau. BVPI, DBV, ISB, VBI. Ernst & Sohn, Beuth, 2012.
SOFiSTiK 2018 | VERiFiCATiON MANUAL - Design Code Benchmarks 61

DCE-EN8: Design of a Rectangular CS for Shear and Axial Force
62 VERiFiCATiON MANUAL - Design Code Benchmarks | SOFiSTiK 2018
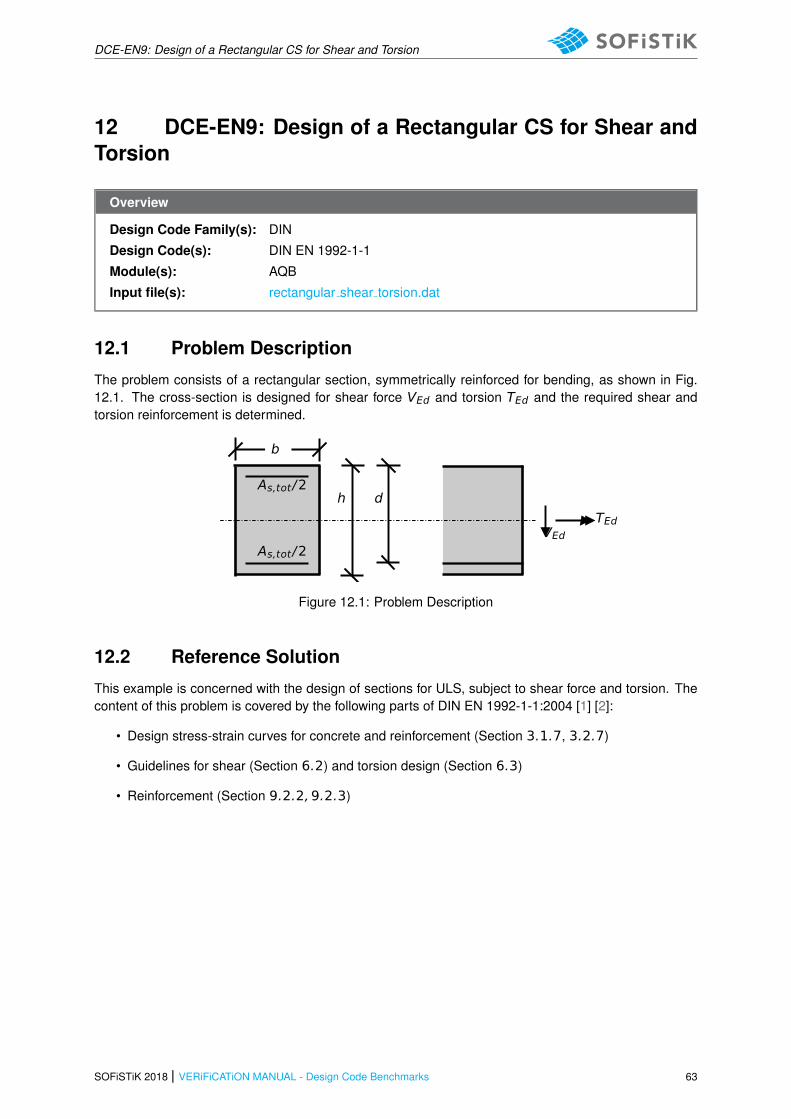
DCE-EN9: Design of a Rectangular CS for Shear and Torsion
12 DCE-EN9: Design of a Rectangular CS for Shear andTorsion
Overview
Design Code Family(s): DIN
Design Code(s): DIN EN 1992-1-1
Module(s): AQB
Input file(s): rectangular shear torsion.dat
12.1 Problem Description
The problem consists of a rectangular section, symmetrically reinforced for bending, as shown in Fig.12.1. The cross-section is designed for shear force VEd and torsion TEd and the required shear andtorsion reinforcement is determined.
TEdVEd
dh
b
As,tot/2
As,tot/2
Figure 12.1: Problem Description
12.2 Reference Solution
This example is concerned with the design of sections for ULS, subject to shear force and torsion. Thecontent of this problem is covered by the following parts of DIN EN 1992-1-1:2004 [1] [2]:
• Design stress-strain curves for concrete and reinforcement (Section 3.1.7, 3.2.7)
• Guidelines for shear (Section 6.2) and torsion design (Section 6.3)
• Reinforcement (Section 9.2.2,9.2.3)
SOFiSTiK 2018 | VERiFiCATiON MANUAL - Design Code Benchmarks 63

DCE-EN9: Design of a Rectangular CS for Shear and Torsion
V
TEd
teƒ
teƒ /2
centre-line
Ak
cover
z
Figure 12.2: Torsion Reinforced Members
The design stress-strain diagram for reinforcing steel considered in this example, consists of an inclinedtop branch, as presented in Fig. 12.3 and as defined in DIN EN 1992-1-1:2004 [1] (Section 3.2.7).
A
B A
B
Idealised
Design
ƒyk
ƒtk,c
ε
ƒyd = ƒyk/γs
σ
Figure 12.3: Idealised and Design Stress-Strain Diagram for Reinforcing Steel
12.3 Model and Results
The rectangular cross-section, with properties as defined in Table 12.1, is to be designed, with respect toDIN EN 1992-1-1:2004 (German National Annex) [1], [2], under shear force of 175.0 kN and torsionalmoment 35 kNm. The reference calculation steps [4] are presented below and the results are given inTable 12.2.
Table 12.1: Model Properties
Material Properties Geometric Properties Loading
C 35/45 h = 70.0 cm VEd = 175.0 kN
B 500A b = 30 cm TEd = 35.0 kNm
d = 65.0 cm
As,tot = 26.8 cm2
64 VERiFiCATiON MANUAL - Design Code Benchmarks | SOFiSTiK 2018

DCE-EN9: Design of a Rectangular CS for Shear and Torsion
Table 12.2: Results
SOF. Ref.
As / s (T) [cm2/m] 3.35 3.35
As (T) [cm2] 5.37 5.37
As,tot / s [cm2/m] 13.60 13.59
VRd,m [kN] 1303.04 1303.03
TRd,m [kNm] 124.95 124.95
SOFiSTiK 2018 | VERiFiCATiON MANUAL - Design Code Benchmarks 65
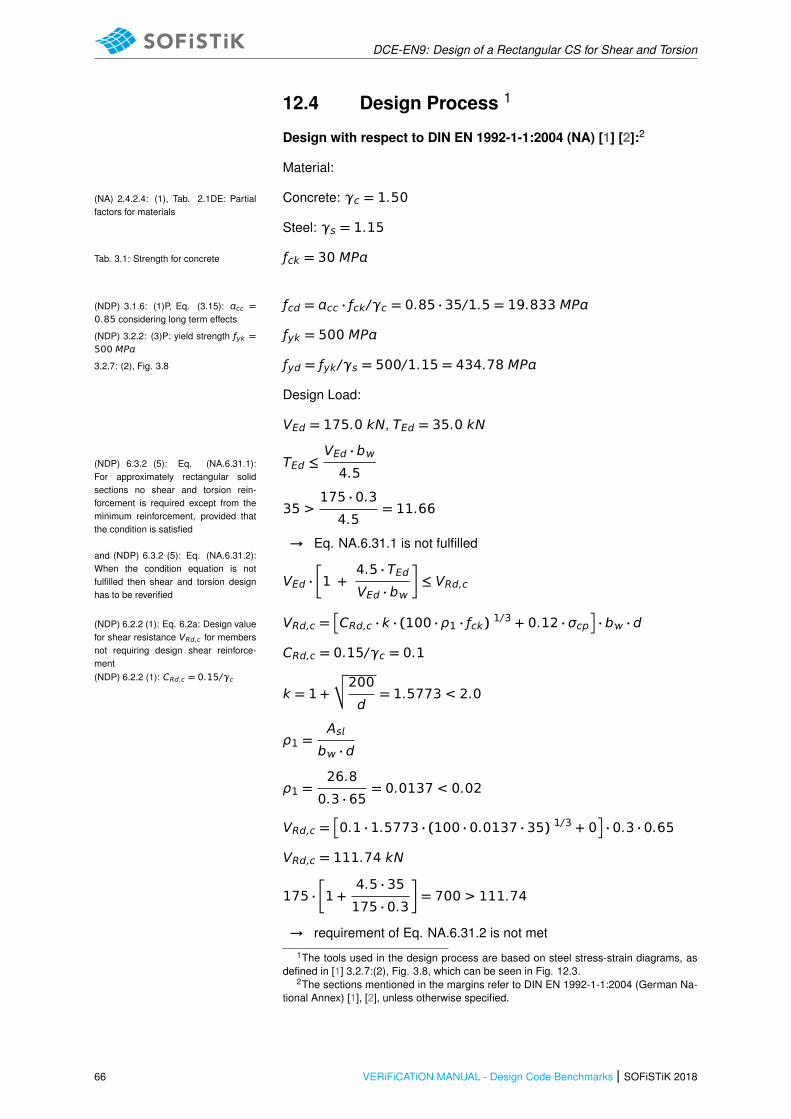
DCE-EN9: Design of a Rectangular CS for Shear and Torsion
12.4 Design Process 1
Design with respect to DIN EN 1992-1-1:2004 (NA) [1] [2]:2
Material:
Concrete: γc = 1.50(NA) 2.4.2.4: (1), Tab. 2.1DE: Partialfactors for materials
Steel: γs = 1.15
ƒck = 30 MPTab. 3.1: Strength for concrete
ƒcd = cc · ƒck/γc = 0.85 · 35/1.5 = 19.833 MP(NDP) 3.1.6: (1)P, Eq. (3.15): cc =0.85 considering long term effects
ƒyk = 500 MP(NDP) 3.2.2: (3)P: yield strength ƒyk =500 MP
ƒyd = ƒyk/γs = 500/1.15 = 434.78 MP3.2.7: (2), Fig. 3.8
Design Load:
VEd = 175.0 kN, TEd = 35.0 kN
TEd ≤VEd · b4.5
(NDP) 6.3.2 (5): Eq. (NA.6.31.1):For approximately rectangular solidsections no shear and torsion rein-forcement is required except from theminimum reinforcement, provided thatthe condition is satisfied
and (NDP) 6.3.2 (5): Eq. (NA.6.31.2):When the condition equation is notfulfilled then shear and torsion designhas to be reverified
35 >175 · 0.3
4.5= 11.66
→ Eq. NA.6.31.1 is not fulfilled
VEd ·�
1 +4.5 · TEdVEd · b
�
≤ VRd,c
VRd,c =�
CRd,c · k · (100 · ρ1 · ƒck) 1/3 + 0.12 · σcp�
· b · d(NDP) 6.2.2 (1): Eq. 6.2a: Design valuefor shear resistance VRd,c for membersnot requiring design shear reinforce-ment
CRd,c = 0.15/γc = 0.1
(NDP) 6.2.2 (1): CRd,c = 0.15/γc
k = 1 +
√
√200
d= 1.5773 < 2.0
ρ1 =As
b · d
ρ1 =26.8
0.3 · 65= 0.0137 < 0.02
VRd,c =�
0.1 · 1.5773 · (100 · 0.0137 · 35) 1/3 + 0�
· 0.3 · 0.65
VRd,c = 111.74 kN
175 ·�
1 +4.5 · 35
175 · 0.3
�
= 700 > 111.74
→ requirement of Eq. NA.6.31.2 is not met1The tools used in the design process are based on steel stress-strain diagrams, as
defined in [1] 3.2.7:(2), Fig. 3.8, which can be seen in Fig. 12.3.2The sections mentioned in the margins refer to DIN EN 1992-1-1:2004 (German Na-
tional Annex) [1], [2], unless otherwise specified.
66 VERiFiCATiON MANUAL - Design Code Benchmarks | SOFiSTiK 2018

DCE-EN9: Design of a Rectangular CS for Shear and Torsion
Torsional reinforcement
teƒ ƒ ,1 = teƒ ƒ ,2 = 2 · 50 = 100 mm (so = s = ss = 50 mm) 6.3.1 (3): Solid sections may be mod-elled by equivalent thin-walled sections(Fig. 12.2)Ak = (h − s − so) ·
�
b − teƒ ƒ ,1�
= 100 mmAk : area enclosed by the centre-line
Ak = (700 − 50 − 50) · (300 − 100) = 120000 mm2 = 0.12 m2
k = 2 · [(700 − 50 − 50) + (300 − 100)] = 1600 mm = 1.6 m k : circumference of area Ak
6.3.2 (2): The effects of torsionand shear may be superimposed,assuming the same value for θ
Simplifying, the reinforcement for torsion may be determined alone un-der the assumption of cotθ = 1.0, θ = 45◦ and be added to theindependently calculated shear force reinforcement.
As,req / s = TEd · tnθ / (ƒyd · 2Ak) (NDP) 6.3.2 (3): Eq. (NA.6.28.1)
As,req / s = 350 · 1.0 / (435 · 2 · 0.12) = 3.35 cm2/m (T)
As,req = TEd · k · cotθ / (ƒyd · 2Ak) = 5.37 cm2 (T) 6.3.2 (3): Eq. 6.28
Torsional resistance moment
TRd,m = 2 · ν · ƒcd · Ak · teƒ ƒ , · sinθ · cosθ 6.3.2 (4): Eq. 6.30
(NDP): ν = 0.525sinθ · cosθ = 0.5 since θ = 45◦
TRd,m = 124.95 kNm
Check of the concrete compressive strut bearing capacity for theload combination of shear force and torsion
The maximum resistance of a member subjected to torsion and shearis limited by the capacity of the concrete struts. The following conditionshould be satisfied:�
TEd
TRd,m
�2
+�
VEd
VRd,m
�2
≤ 1.0 (NDP) 6.3.2 (4): Eq. (NA.6.29.1) forsolid cross-sections
For the T+V utilization, SOFiSTiK uses:√
√
√
�
TEd
TRd,m
�2
+�
VEd
VRd,m
�2
≤ 1.0
z =mx�
d − cV, − 30 mm; d − 2 cV,
(NDP) 6.2.3 (1): Inner lever arm z
cV, = so − Do/2 = 50 − 28/2 = 36 mm so: offset of reinforcementDo: bar diameter
z =mx{584; 578} = 584 mm
VRd,m = b · z · ν1 · ƒcd / (cotθ + tnθ) (NDP) 6.2.3 (3): Eq. 6.9Maximum shear force VRd,m occursfor θ = 45◦: cotθ = tnθ = 1(NDP) 6.2.3 (3):ν1 = 0.75 ·ν2 = 0.75,ν2 = 1 for ≤ C50/60
VRd,m = 0.3 · 0.584 · 0.75 · 19.833 / (1 + 1) = 1303.03 kN�
35
124.95
�2
+�
175
1303.04
�2
= 0.0965 < 1
Shear reinforcement
As,req / s = VEd / (ƒyd · z · cotθ) = 6.89 cm2/m 6.2.3 (3): Eq. 6.8ƒyd = ƒyk /γs = 435 MP
SOFiSTiK 2018 | VERiFiCATiON MANUAL - Design Code Benchmarks 67

DCE-EN9: Design of a Rectangular CS for Shear and Torsion
Total required reinforcement
Required torsional reinforcement:
2 · As/s = 2 · 3.35 = 6.7 cm2/m (double-shear connection)
Total reinforcement: As,tot/s = 6.7 + 6.89 = 13.59 cm2/m
68 VERiFiCATiON MANUAL - Design Code Benchmarks | SOFiSTiK 2018

DCE-EN9: Design of a Rectangular CS for Shear and Torsion
12.5 Conclusion
This example shows the calculation of the required reinforcement for a rectangular beam cross-sectionunder shear and torsion. It has been shown that the results are reproduced with excellent accuracy.
12.6 Literature
[1] DIN EN 1992-1-1/NA: Eurocode 2: Design of concrete structures, Part 1-1/NA: General rules andrules for buildings - German version EN 1992-1-1:2005 (D), Nationaler Anhang Deutschland -Stand Februar 2010. CEN. 2010.
[2] F. Fingerloos, J. Hegger, and K. Zilch. DIN EN 1992-1-1 Bemessung und Konstruktion vonStahlbeton- und Spannbetontragwerken - Teil 1-1: Allgemeine Bemessungsregeln und Regelnfur den Hochbau. BVPI, DBV, ISB, VBI. Ernst & Sohn, Beuth, 2012.
[4] Beispiele zur Bemessung nach Eurocode 2 - Band 1: Hochbau. Ernst & Sohn. Deutschen Beton-und Bautechnik-Verein E.V. 2011.
SOFiSTiK 2018 | VERiFiCATiON MANUAL - Design Code Benchmarks 69

DCE-EN9: Design of a Rectangular CS for Shear and Torsion
70 VERiFiCATiON MANUAL - Design Code Benchmarks | SOFiSTiK 2018

DCE-EN10: Shear between web and flanges of T-sections
13 DCE-EN10: Shear between web and flanges of T-sections
Overview
Design Code Family(s): DIN
Design Code(s): DIN EN 1992-1-1
Module(s): AQB
Input file(s): t-beam shear web flange.dat
13.1 Problem Description
The problem consists of a T-beam section, as shown in Fig. 13.1. The cs is designed for shear, the shearbetween web and flanges of T-sections is considered and the required reinforcement is determined.
VEd
As1d1
As1
hƒ
beƒ ƒ
h d
Figure 13.1: Problem Description
13.2 Reference Solution
This example is concerned with the shear design of T-sections, for the ultimate limit state. The contentof this problem is covered by the following parts of DIN EN 1992-1-1:2004 [1]:
• Design stress-strain curves for concrete and reinforcement (Section 3.1.7, 3.2.7)
• Guidelines for shear design (Section 6.2)
SOFiSTiK 2018 | VERiFiCATiON MANUAL - Design Code Benchmarks 71
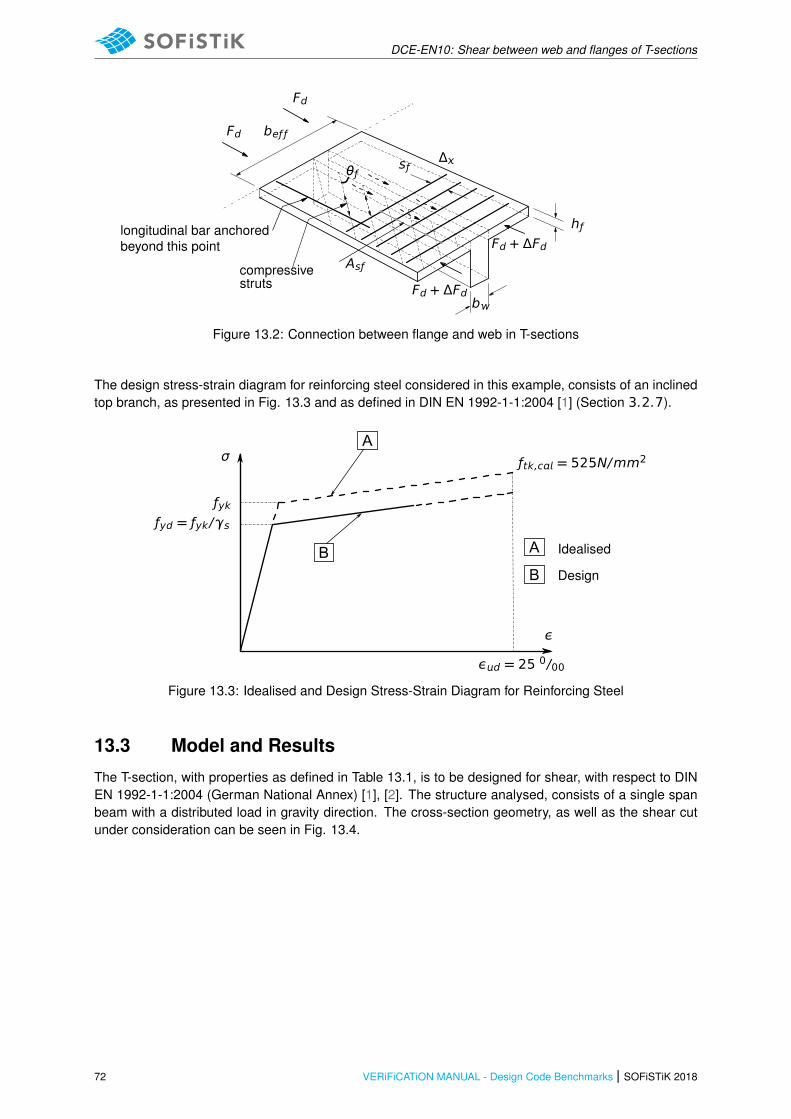
DCE-EN10: Shear between web and flanges of T-sections
Fd
Fd
beƒ ƒ
sƒ
hƒ
bFd + ΔFd
Fd + ΔFd
Δθƒ
Asƒ
longitudinal bar anchoredbeyond this point
compressivestruts
Figure 13.2: Connection between flange and web in T-sections
The design stress-strain diagram for reinforcing steel considered in this example, consists of an inclinedtop branch, as presented in Fig. 13.3 and as defined in DIN EN 1992-1-1:2004 [1] (Section 3.2.7).
A
B A
B
Idealised
Design
ƒyk
ƒtk,c = 525N/mm2
ε
εd = 25 0/00
ƒyd = ƒyk/γs
σ
Figure 13.3: Idealised and Design Stress-Strain Diagram for Reinforcing Steel
13.3 Model and Results
The T-section, with properties as defined in Table 13.1, is to be designed for shear, with respect to DINEN 1992-1-1:2004 (German National Annex) [1], [2]. The structure analysed, consists of a single spanbeam with a distributed load in gravity direction. The cross-section geometry, as well as the shear cutunder consideration can be seen in Fig. 13.4.
72 VERiFiCATiON MANUAL - Design Code Benchmarks | SOFiSTiK 2018
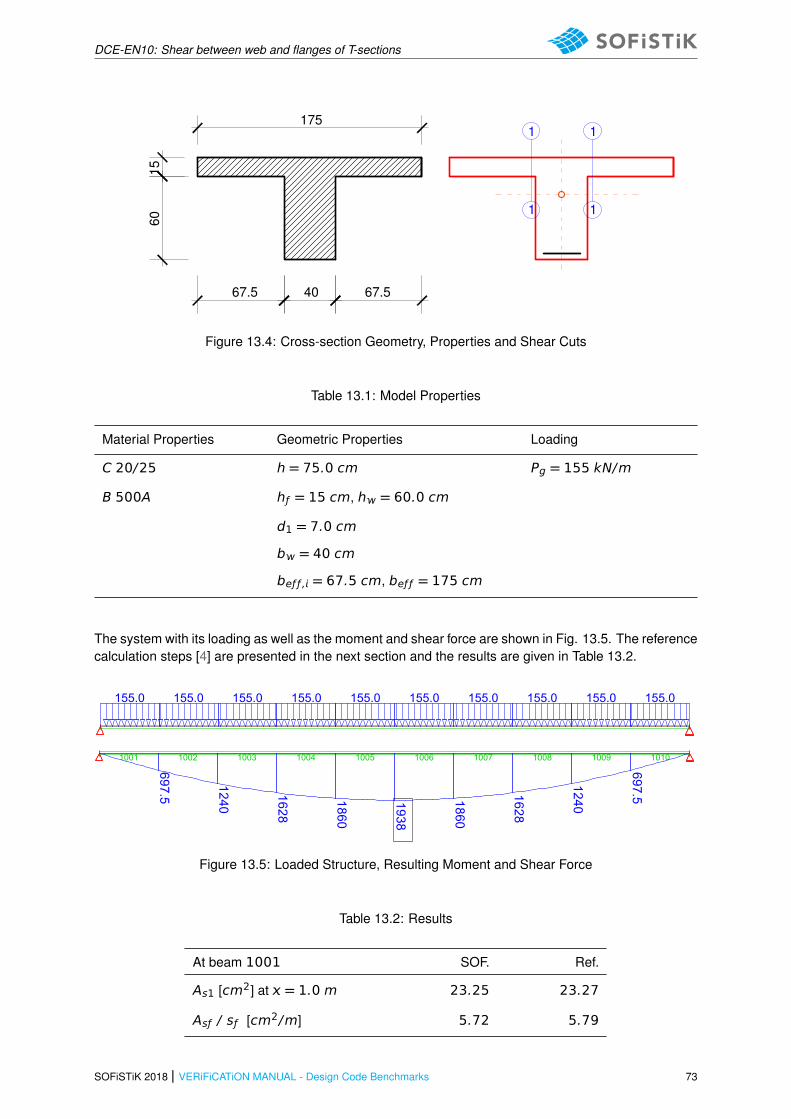
DCE-EN10: Shear between web and flanges of T-sections
4067.5 67.5
6015
175
1
1
1
1
Figure 13.4: Cross-section Geometry, Properties and Shear Cuts
Table 13.1: Model Properties
Material Properties Geometric Properties Loading
C 20/25 h = 75.0 cm Pg = 155 kN/m
B 500A hƒ = 15 cm, h = 60.0 cm
d1 = 7.0 cm
b = 40 cm
beƒ ƒ , = 67.5 cm, beƒ ƒ = 175 cm
The system with its loading as well as the moment and shear force are shown in Fig. 13.5. The referencecalculation steps [4] are presented in the next section and the results are given in Table 13.2.
SOFiSTiK AG * Bruckmannring 38 * 85764 OberschleißheimSOFiSTiK 2016-3 WINGRAF - GRAPHICS FOR FINITE ELEMENTS (V 18.03)
Page 12016-01-15
Single span beam
SOFi
STiK
AG
- w
ww.
sofis
tik.d
e
M 1 : 41XY
Z
1010100910081007100610051004100310021001
Beam Elements , Number of element (Max=1010)
m0.00 2.00 4.00 6.00 8.00 10.00
0.00
1938
1860
1860
1628
1628
1240
1240
697.5
697.5
Beam Elements , Bending moment My, Loadcase 1 sum_PZ=1550.0 kN . , 1 cm 3D = 1000. kNm (Max=1938.)
M 1 : 41XY
Z
155.0155.0155.0155.0155.0155.0155.0155.0155.0155.0
All loads (in components), Loadcase 1 sum_PZ=1550.0 kN . , (1 cm 3D = unit) Beam line load (force) in global Z (Unit=160.2kN/m ) (Max=155.0)
m0.00 2.00 4.00 6.00 8.00 10.00
0.00
SOFiSTiK AG * Bruckmannring 38 * 85764 OberschleißheimSOFiSTiK 2016-3 WINGRAF - GRAPHICS FOR FINITE ELEMENTS (V 18.03)
Page 12016-01-15
Single span beam
SOFi
STiK
AG
- w
ww.
sofis
tik.d
e
M 1 : 41XY
Z
1010100910081007100610051004100310021001
Beam Elements , Number of element (Max=1010)
m0.00 2.00 4.00 6.00 8.00 10.00
2.00
0.00
1938
1860
1860
1628
1628
1240
1240
697.5
697.5
Beam Elements , Bending moment My, Loadcase 1 sum_PZ=1550.0 kN . , 1 cm 3D = 1000. kNm (Max=1938.)
M 1 : 41XY
Z
155.0155.0155.0155.0155.0155.0155.0155.0155.0155.0
All loads (in components), Loadcase 1 sum_PZ=1550.0 kN . , (1 cm 3D = unit) Beam line load (force) in global Z (Unit=160.2kN/m ) (Max=155.0)
m0.00 2.00 4.00 6.00 8.00 10.00
0.00
Figure 13.5: Loaded Structure, Resulting Moment and Shear Force
Table 13.2: Results
At beam 1001 SOF. Ref.
As1 [cm2] at = 1.0 m 23.25 23.27
Asƒ / sƒ [cm2/m] 5.72 5.79
SOFiSTiK 2018 | VERiFiCATiON MANUAL - Design Code Benchmarks 73
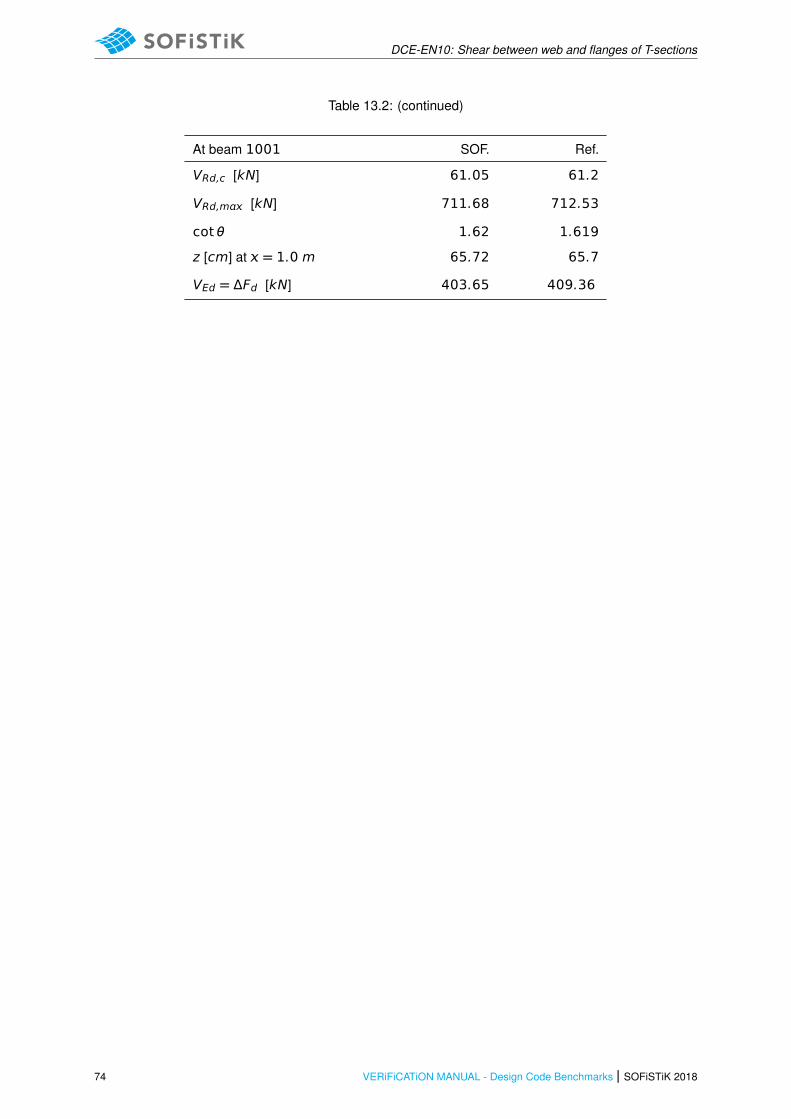
DCE-EN10: Shear between web and flanges of T-sections
Table 13.2: (continued)
At beam 1001 SOF. Ref.
VRd,c [kN] 61.05 61.2
VRd,m [kN] 711.68 712.53
cotθ 1.62 1.619
z [cm] at = 1.0 m 65.72 65.7
VEd = ΔFd [kN] 403.65 409.36
74 VERiFiCATiON MANUAL - Design Code Benchmarks | SOFiSTiK 2018
DCE-EN10: Shear between web and flanges of T-sections
13.4 Design Process1
Design with respect to DIN EN 1992-1-1:2004 (NA) [1] [2]:2
Material:
Concrete: γc = 1.50 (NDP) 2.4.2.4: (1), Tab. 2.1DE: Partialfactors for materials
Steel: γs = 1.15
ƒck = 25 MP Tab. 3.1: Strength for concrete
ƒcd = cc · ƒck/γc = 0.85 · 25/1.5 = 14.17 MP 3.1.6: (1)P, Eq. (3.15): cc = 0.85 con-sidering long term effects
ƒyk = 500 MP 3.2.2: (3)P: yield strength ƒyk = 500MPƒyd = ƒyk/γs = 500/1.15 = 434.78 MP3.2.7: (2), Fig. 3.8
σsd = 456.52 MP
Design loads
• Design Load for beam 1001, x=0.0 m:
MEd,=0.0 m = 0.0 kNm
• Design Load for beam 1001, x=1.0 m:
MEd,=1.0 m = 697.5 kNm
Calculating the longitudinal reinforcement:
• For beam 1001, x=0.0 m
μEds =MEds
beƒ ƒ · d2 · ƒcd=
0.0 · 10−3
1.75 · 0.682 · 14.17= 0.00 μ = 0→ As1 = 0
• For beam 1001, x=1.0 m
μEds =MEds
beƒ ƒ · d2 · ƒcd=
697.5 · 10−3
1.75 · 0.682 · 14.17= 0.0608
ω ≈ 0.063, ζ ≈ 0.967 and ξ ≈ 0.086 (interpolated) Tab. 9.2 [3]: ω−Table for up to C50/60without compression reinforcement
As1 =1
σsd· (ω · b · d · ƒcd + NEd) NEd = 0
As1 =1
456.52· (0.063 · 1.75 · 0.68 · 14.17) · 1002 = 23.27 cm2
z = ζ · d = 0.967 · 0.68 m ≈ 65.7 cm
Calculating the shear between flange and web
The shear force, is determined by the change of the longitudinal force, atthe junction between one side of a flange and the web, in the separatedflange: 6.2.4 (3): Eq. 6.20
1The tools used in the design process are based on steel stress-strain diagrams, asdefined in [1] 3.2.7:(2), Fig. 3.8, which can be seen in Fig. 13.3.
2The sections mentioned in the margins refer to DIN EN 1992-1-1:2004 (German Na-tional Annex) [1], [2], unless otherwise specified.
SOFiSTiK 2018 | VERiFiCATiON MANUAL - Design Code Benchmarks 75

DCE-EN10: Shear between web and flanges of T-sections
ΔFd =�
MEd,=1.0
z−MEd,=0.0
z
�
·hƒ · beƒ ƒ ,hƒ · beƒ ƒ
For beam 1001 (x=0.00 m)→ MEd = 0.00 therefore:
ΔFd =�
697.5
0.657− 0
�
·0.675
1.75= 409.36 kNIn AQB output ΔFd = T[kN/m]
The longitudinal shear stress Ed at the junction between one side of aflange and the web is determined by the change of the normal (longitu-dinal) force in the part of the flange considered, according to:
Ed =ΔFd
hƒ · ΔDIN EN 1992, 6.2.4 (3),Eq. 6.20: hƒis the thickness of flange at the junc-tions, Δ is the length under consider-ation, ΔFd is the change of the normalforce in the flange over the length Δ
In our case Δ = 1.0 because the beam length is = 1.00 m.
Please note that AQB is outputting the results per length.
Ed =409.36
15 · 100= 0.272 kN/m2 = 2.72 MPIn AQB output Ed = τ − V
Checking the maximum Rd,m value to prevent crushing of thestruts in the flange
To prevent crushing of the compression struts in the flange, the followingcondition should be satisfied:
Ed ≤ Rd,m = ν · ƒcd · snθƒ · cosθƒDIN EN 1992, 6.2.4 (4),Eq. 6.22
Rd,m = ν · ƒcd · snθƒ · cosθƒ
According to DIN EN 1992-1-1, NDP 6.2.4(4):
ν = ν1
ν1 = 0.75 · ν2DIN EN 1992, NDP 6.2.3 (3),Eq. 6.22
ν2 = 1.1 −ƒck
500≤ 1.0
ν2 = 1.1 −20
500= 1.1 − 0.04 = 1.06 ≥ 1.0→ ν2 = 1.0
ν1 = 0.75 · 1.0 = 0.75→ ν = 0.75
The θ value is calculated:
VRd,cc = c · 0.48 · ƒ1/3ck ·�
1 − 1.2 ·σcd
ƒcd
�
· b · zDIN EN 1992, NDP 6.2.3 (2),Eq.NA.6.7b: σcd = NEd/AC, c=0.5
b → hƒ , z→ Δ, c = 0.5
VRd,cc = c · 0.48 · ƒ1/3ck ·�
1 − 1.2 ·σcd
ƒcd
�
· hƒ · Δ
VRd,cc = 0.5 · 0.48 · 251/3 ·�
1 − 1.2 ·0
14.17
�
· 0.15 · 1.0
VRd,cc = 0.1052 MN = 105.26 kN
76 VERiFiCATiON MANUAL - Design Code Benchmarks | SOFiSTiK 2018
DCE-EN10: Shear between web and flanges of T-sections
1.0 ≤ cotθ ≤1.2 + 1.4 · Δσcd/ ƒcd1 − VRd,cc/VEd
≤ 3.0 DIN EN 1992, NDP 6.2.3 (2),Eq.NA.6.7a
cotθ =1.2
1 − 105.26/409.36= 1.619
tnθ =1
cotθ=
1
1.619= 0.619→ θ = 31.75◦
Rd,m = 0.75 · 14.17 · sn31.75 · cos31.75 = 4.7502 MP
VRd,m = Rd,m · hƒ · Δ = 4.7502 · 0.15 · 1.0 = 0.71253 MN
VRd,m = 712.53 kN
Checking the value Rd,c
If Ed is less than or equal to Rd,c = k · ƒctd no extra reinforcementabove that for flexure is required.
Rd,c = k · ƒctd
For concrete C 25/30→ ƒctd = 1.02 MP
Rd,c = 0.4 · 1.02 = 0.408 MP
VRd,c = Rd,c · hƒ · Δ = 0.0408 · 15 · 100 = 61.2 kN
• Calculating the necessary transverse reinforcement:
sƒ =Ed · hƒ
cotθƒ · ƒydDIN EN 1992, 6.2.4 (4),Eq. 6.21
sƒ =2.72 · 0.15
1.619 · 434.78· 1002 = 5.79 cm2
SOFiSTiK 2018 | VERiFiCATiON MANUAL - Design Code Benchmarks 77
DCE-EN10: Shear between web and flanges of T-sections
13.5 Conclusion
This example is concerned with the calculation of the shear between web and flanges of T-sections. Ithas been shown that the results are reproduced with good accuracy.
13.6 Literature
[1] DIN EN 1992-1-1/NA: Eurocode 2: Design of concrete structures, Part 1-1/NA: General rules andrules for buildings - German version EN 1992-1-1:2005 (D), Nationaler Anhang Deutschland -Stand Februar 2010. CEN. 2010.
[2] F. Fingerloos, J. Hegger, and K. Zilch. DIN EN 1992-1-1 Bemessung und Konstruktion vonStahlbeton- und Spannbetontragwerken - Teil 1-1: Allgemeine Bemessungsregeln und Regelnfur den Hochbau. BVPI, DBV, ISB, VBI. Ernst & Sohn, Beuth, 2012.
[3] K. Holschemacher, T. Muller, and F. Lobisch. Bemessungshilfsmittel fur Betonbauteile nach Eu-rocode 2 Bauingenieure. 3rd. Ernst & Sohn, 2012.
[4] Beispiele zur Bemessung nach Eurocode 2 - Band 1: Hochbau. Ernst & Sohn. Deutschen Beton-und Bautechnik-Verein E.V. 2011.
78 VERiFiCATiON MANUAL - Design Code Benchmarks | SOFiSTiK 2018

DCE-EN11: Shear at the interface between concrete cast
14 DCE-EN11: Shear at the interface between concretecast
Overview
Design Code Family(s): DIN
Design Code(s): DIN EN 1992-1-1
Module(s): AQB
Input file(s): shear interface.dat
14.1 Problem Description
The problem consists of a T-beam section, as shown in Fig. 14.1. The cs is designed for shear, the shearat the interface between concrete cast at different times is considered and the required reinforcement isdetermined.
VEd
As1
Shear section
d1
zs
As1
hƒ
beƒ ƒ
b
h d
Figure 14.1: Problem Description
14.2 Reference Solution
This example is concerned with the shear design of T-sections, for the ultimate limit state. The contentof this problem is covered by the following parts of DIN EN 1992-1-1:2004 [1]:
• Design stress-strain curves for concrete and reinforcement (Section 3.1.7, 3.2.3)
• Guidelines for shear design (Section 6.2)
SOFiSTiK 2018 | VERiFiCATiON MANUAL - Design Code Benchmarks 79
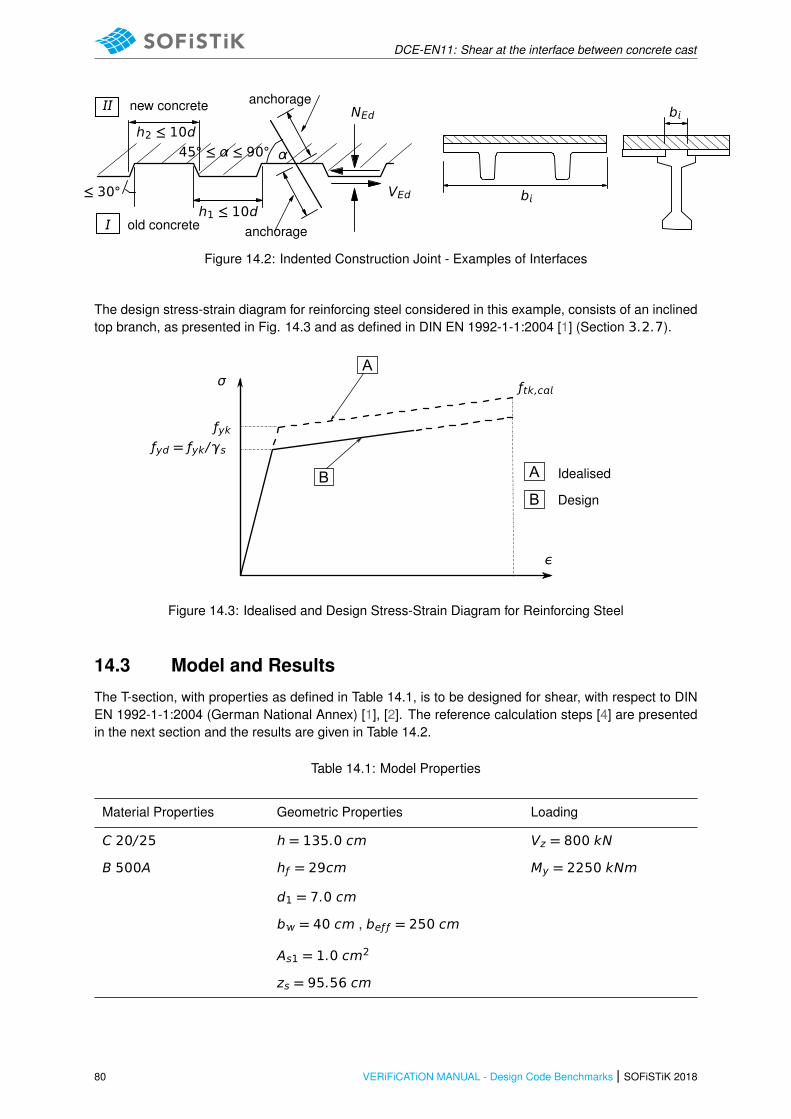
DCE-EN11: Shear at the interface between concrete cast
≤ 30◦
h2 ≤ 10d
h1 ≤ 10danchorage
anchorage
VEd
NEd
α45◦ ≤ α ≤ 90◦
new concrete
old concrete
b
b
Figure 14.2: Indented Construction Joint - Examples of Interfaces
The design stress-strain diagram for reinforcing steel considered in this example, consists of an inclinedtop branch, as presented in Fig. 14.3 and as defined in DIN EN 1992-1-1:2004 [1] (Section 3.2.7).
A
B A
B
Idealised
Design
ƒyk
ƒtk,c
ε
ƒyd = ƒyk/γs
σ
Figure 14.3: Idealised and Design Stress-Strain Diagram for Reinforcing Steel
14.3 Model and Results
The T-section, with properties as defined in Table 14.1, is to be designed for shear, with respect to DINEN 1992-1-1:2004 (German National Annex) [1], [2]. The reference calculation steps [4] are presentedin the next section and the results are given in Table 14.2.
Table 14.1: Model Properties
Material Properties Geometric Properties Loading
C 20/25 h = 135.0 cm Vz = 800 kN
B 500A hƒ = 29cm My = 2250 kNm
d1 = 7.0 cm
b = 40 cm , beƒ ƒ = 250 cm
As1 = 1.0 cm2
zs = 95.56 cm
80 VERiFiCATiON MANUAL - Design Code Benchmarks | SOFiSTiK 2018

DCE-EN11: Shear at the interface between concrete cast
Table 14.2: Results
s [cm2/m] SOF. Ref.
state 7.04 7.07
state only V 4.89 4.90
state V + M 4.99 4.99
SOFiSTiK 2018 | VERiFiCATiON MANUAL - Design Code Benchmarks 81

DCE-EN11: Shear at the interface between concrete cast
14.4 Design Process 1
Design with respect to DIN EN 1992-1-1:2004 (NA) [1] [2]:2
Material:
Concrete: γc = 1.50(NDP) 2.4.2.4: (1), Tab. 2.1DE: Partialfactors for materials
Steel: γs = 1.15
ƒck = 25 MPTab. 3.1: Strength for concrete
ƒcd = cc · ƒck/γc = 0.85 · 25/1.5 = 14.17 MP3.1.6: (1)P, Eq. (3.15): cc = 0.85 con-sidering long term effects
ƒyk = 500 MP3.2.2: (3)P: yield strength ƒyk = 500MP ƒyd = ƒyk/γs = 500/1.15 = 434.78 MP3.2.7: (2), Fig. 3.8
σsd = 456.52 MP
τ =T
b=
V · S
y · b
where S is the static moment of the separated area
S = h · b · (zs − h/2) = 0.18058 m3
τ =0.8 · 0.18058
0.16667 · 0.4= 2.1669 MP
T =0.8 · 0.18058
0.16667= 0.86676 MN/m = 866.76 kN/m
The shear section with a length of 0.4m is split into two equal parts with b =0.2 m T = 866.76 / 2 = 433.38 kN/m
State :
Design Load:The associated design shear flow VEdis:
VEd = T = 433.38 kN/m
Ed = τ = 2.1669 MP
VRd,c =�
CRd,c · k · (100 · ρ1 · ƒck) 1/3 + 0.12 · σcp�
· b · d(NDP) 6.2.2 (1): Eq. 6.2a: Design valuefor shear resistance VRd,c for membersnot requiring design shear reinforce-ment Rd,c = CRd,c · k · (100 · ρ1 · ƒck) 1/3 + 0.12 · σcp
ρ1 =As
bd= 0.0 → Rd,c = 0.0
with a minimum of
VRd,c,mn =�
νmn + 0.12 · σcp�
· b · d(NDP) 6.2.2 (1): Eq. 6.2b
Rd,c,mn = νmn + 0.12 · σcp
νmn = (0.0375/γc) · k3/2 · ƒ 1/2ck = 0.20833 MP(NDP) 6.2.2 (1): Eq. 6.3bDE
1The tools used in the design process are based on steel stress-strain diagrams, asdefined in [1] 3.2.7:(2), Fig. 3.8, which can be seen in Fig. 14.3.
2The sections mentioned in the margins refer to DIN EN 1992-1-1:2004 (German Na-tional Annex) [1], [2], unless otherwise specified.
82 VERiFiCATiON MANUAL - Design Code Benchmarks | SOFiSTiK 2018
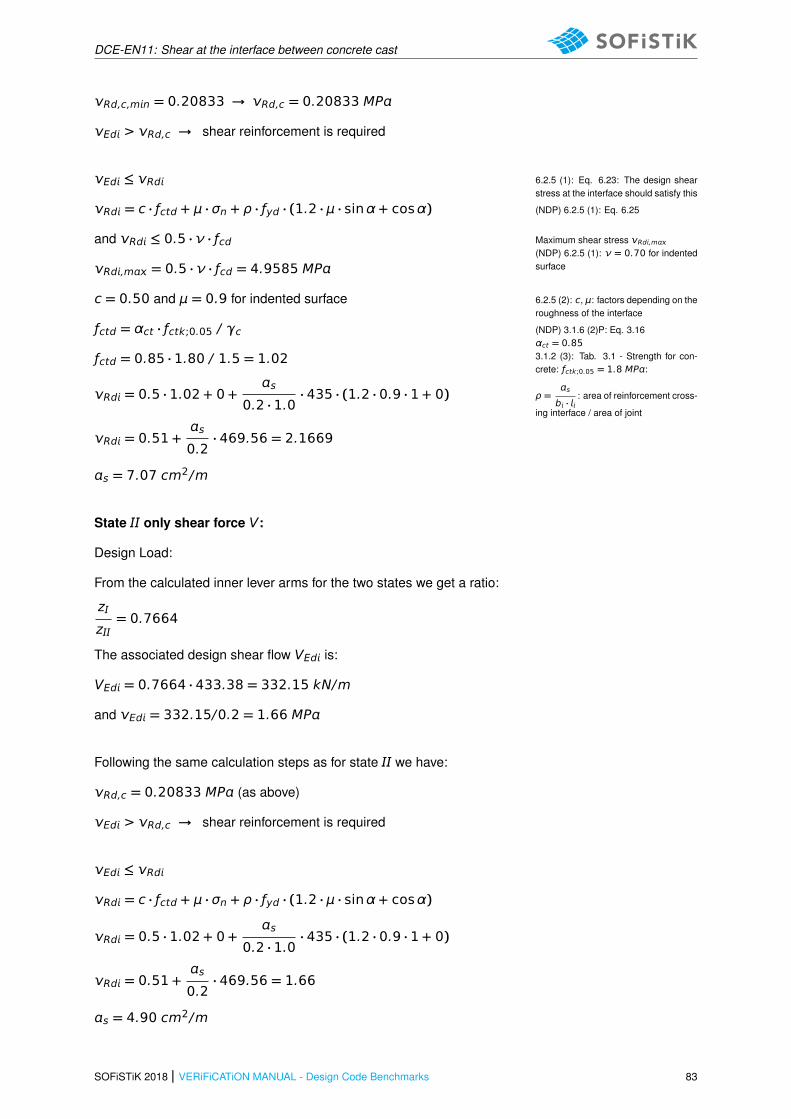
DCE-EN11: Shear at the interface between concrete cast
Rd,c,mn = 0.20833 → Rd,c = 0.20833 MP
Ed > Rd,c → shear reinforcement is required
Ed ≤ Rd 6.2.5 (1): Eq. 6.23: The design shearstress at the interface should satisfy this
Rd = c · ƒctd + μ · σn + ρ · ƒyd · (1.2 · μ · sinα + cosα) (NDP) 6.2.5 (1): Eq. 6.25
and Rd ≤ 0.5 · ν · ƒcd Maximum shear stress Rd,m
(NDP) 6.2.5 (1): ν = 0.70 for indentedsurfaceRd,m = 0.5 · ν · ƒcd = 4.9585 MP
c = 0.50 and μ = 0.9 for indented surface 6.2.5 (2): c, μ: factors depending on theroughness of the interface
ƒctd = αct · ƒctk;0.05 / γc (NDP) 3.1.6 (2)P: Eq. 3.16αct = 0.853.1.2 (3): Tab. 3.1 - Strength for con-crete: ƒctk;0.05 = 1.8 MP:
ƒctd = 0.85 · 1.80 / 1.5 = 1.02
Rd = 0.5 · 1.02 + 0 +s
0.2 · 1.0· 435 · (1.2 · 0.9 · 1 + 0) ρ =
s
b · : area of reinforcement cross-
ing interface / area of joint
Rd = 0.51 +s
0.2· 469.56 = 2.1669
s = 7.07 cm2/m
State only shear force V:
Design Load:
From the calculated inner lever arms for the two states we get a ratio:
z
z= 0.7664
The associated design shear flow VEd is:
VEd = 0.7664 · 433.38 = 332.15 kN/m
and Ed = 332.15/0.2 = 1.66 MP
Following the same calculation steps as for state we have:
Rd,c = 0.20833 MP (as above)
Ed > Rd,c → shear reinforcement is required
Ed ≤ Rd
Rd = c · ƒctd + μ · σn + ρ · ƒyd · (1.2 · μ · sinα + cosα)
Rd = 0.5 · 1.02 + 0 +s
0.2 · 1.0· 435 · (1.2 · 0.9 · 1 + 0)
Rd = 0.51 +s
0.2· 469.56 = 1.66
s = 4.90 cm2/m
SOFiSTiK 2018 | VERiFiCATiON MANUAL - Design Code Benchmarks 83
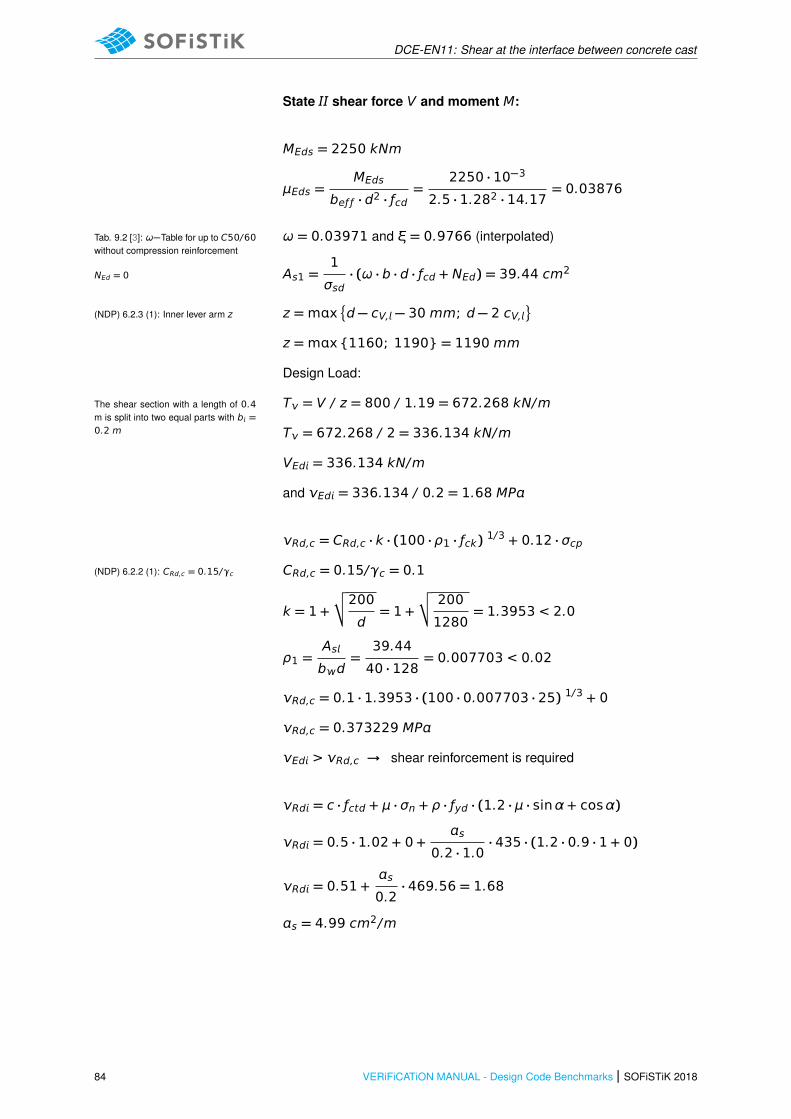
DCE-EN11: Shear at the interface between concrete cast
State shear force V and moment M:
MEds = 2250 kNm
μEds =MEds
beƒ ƒ · d2 · ƒcd=
2250 · 10−3
2.5 · 1.282 · 14.17= 0.03876
ω = 0.03971 and ξ = 0.9766 (interpolated)Tab. 9.2 [3]: ω−Table for up to C50/60without compression reinforcement
As1 =1
σsd· (ω · b · d · ƒcd + NEd) = 39.44 cm2NEd = 0
z =mx�
d − cV, − 30 mm; d − 2 cV,
(NDP) 6.2.3 (1): Inner lever arm z
z =mx{1160; 1190} = 1190 mm
Design Load:
T = V / z = 800 / 1.19 = 672.268 kN/mThe shear section with a length of 0.4m is split into two equal parts with b =0.2 m T = 672.268 / 2 = 336.134 kN/m
VEd = 336.134 kN/m
and Ed = 336.134 / 0.2 = 1.68 MP
Rd,c = CRd,c · k · (100 · ρ1 · ƒck) 1/3 + 0.12 · σcp
CRd,c = 0.15/γc = 0.1(NDP) 6.2.2 (1): CRd,c = 0.15/γc
k = 1 +
√
√200
d= 1 +
√
√ 200
1280= 1.3953 < 2.0
ρ1 =As
bd=
39.44
40 · 128= 0.007703 < 0.02
Rd,c = 0.1 · 1.3953 · (100 · 0.007703 · 25) 1/3 + 0
Rd,c = 0.373229 MP
Ed > Rd,c → shear reinforcement is required
Rd = c · ƒctd + μ · σn + ρ · ƒyd · (1.2 · μ · sinα + cosα)
Rd = 0.5 · 1.02 + 0 +s
0.2 · 1.0· 435 · (1.2 · 0.9 · 1 + 0)
Rd = 0.51 +s
0.2· 469.56 = 1.68
s = 4.99 cm2/m
84 VERiFiCATiON MANUAL - Design Code Benchmarks | SOFiSTiK 2018

DCE-EN11: Shear at the interface between concrete cast
14.5 Conclusion
This example shows the calculation of the required reinforcement for a T-section under shear at theinterface between concrete cast at different times. It has been shown that the results are reproducedwith excellent accuracy. Small deviations occur because AQUA calculates (by using FEM analysis) theshear stresses more accurate compared to the reference example.
14.6 Literature
[1] DIN EN 1992-1-1/NA: Eurocode 2: Design of concrete structures, Part 1-1/NA: General rules andrules for buildings - German version EN 1992-1-1:2005 (D), Nationaler Anhang Deutschland -Stand Februar 2010. CEN. 2010.
[2] F. Fingerloos, J. Hegger, and K. Zilch. DIN EN 1992-1-1 Bemessung und Konstruktion vonStahlbeton- und Spannbetontragwerken - Teil 1-1: Allgemeine Bemessungsregeln und Regelnfur den Hochbau. BVPI, DBV, ISB, VBI. Ernst & Sohn, Beuth, 2012.
[3] K. Holschemacher, T. Muller, and F. Lobisch. Bemessungshilfsmittel fur Betonbauteile nach Eu-rocode 2 Bauingenieure. 3rd. Ernst & Sohn, 2012.
[4] Beispiele zur Bemessung nach Eurocode 2 - Band 1: Hochbau. Ernst & Sohn. Deutschen Beton-und Bautechnik-Verein E.V. 2011.
SOFiSTiK 2018 | VERiFiCATiON MANUAL - Design Code Benchmarks 85

DCE-EN11: Shear at the interface between concrete cast
86 VERiFiCATiON MANUAL - Design Code Benchmarks | SOFiSTiK 2018
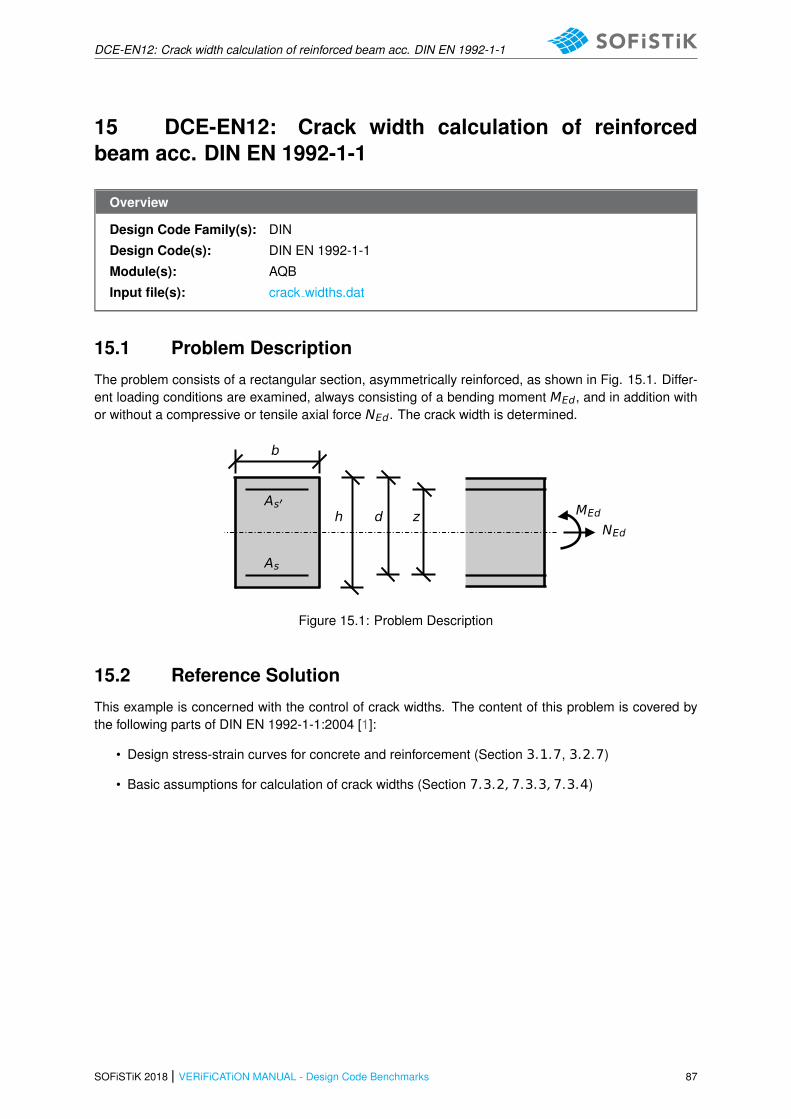
DCE-EN12: Crack width calculation of reinforced beam acc. DIN EN 1992-1-1
15 DCE-EN12: Crack width calculation of reinforcedbeam acc. DIN EN 1992-1-1
Overview
Design Code Family(s): DIN
Design Code(s): DIN EN 1992-1-1
Module(s): AQB
Input file(s): crack widths.dat
15.1 Problem Description
The problem consists of a rectangular section, asymmetrically reinforced, as shown in Fig. 15.1. Differ-ent loading conditions are examined, always consisting of a bending moment MEd, and in addition withor without a compressive or tensile axial force NEd. The crack width is determined.
NEd
MEdzdh
b
As
As′
Figure 15.1: Problem Description
15.2 Reference Solution
This example is concerned with the control of crack widths. The content of this problem is covered bythe following parts of DIN EN 1992-1-1:2004 [1]:
• Design stress-strain curves for concrete and reinforcement (Section 3.1.7, 3.2.7)
• Basic assumptions for calculation of crack widths (Section 7.3.2,7.3.3,7.3.4)
SOFiSTiK 2018 | VERiFiCATiON MANUAL - Design Code Benchmarks 87
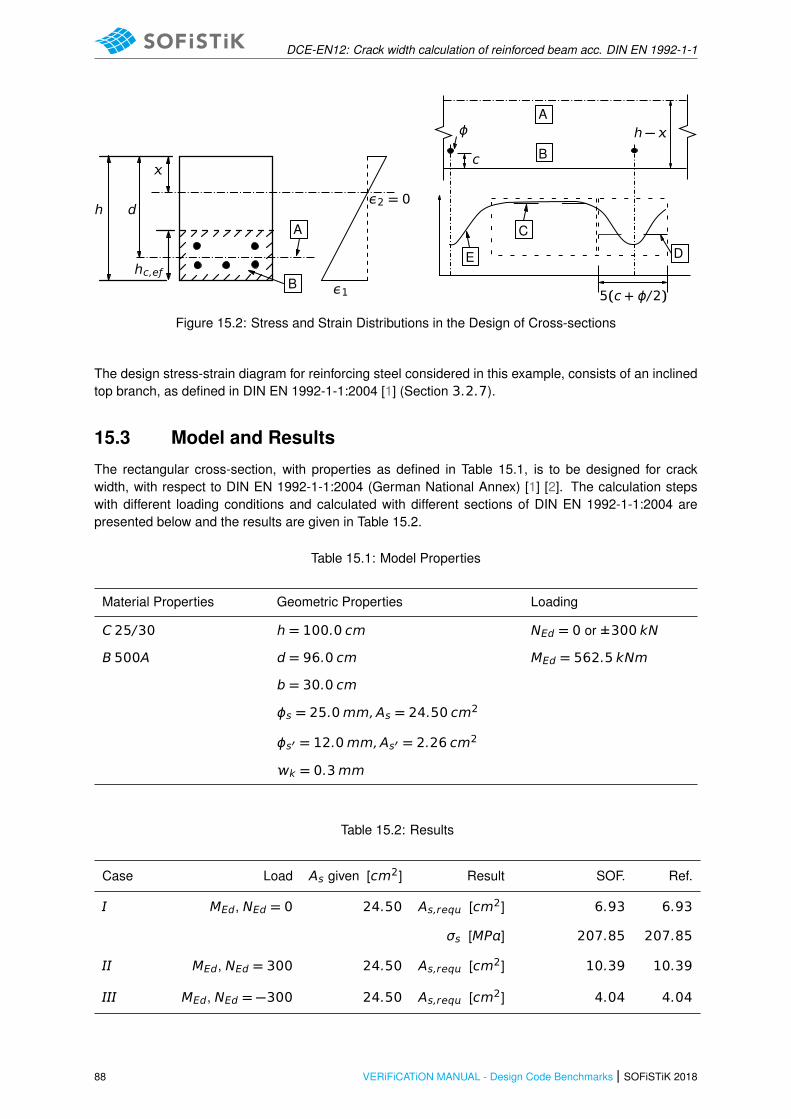
DCE-EN12: Crack width calculation of reinforced beam acc. DIN EN 1992-1-1
A
B
5(c + ϕ/2)
h −
DE
C
ϕ
c
hc,eƒ
dh
A
ε1
ε2 = 0
B
Figure 15.2: Stress and Strain Distributions in the Design of Cross-sections
The design stress-strain diagram for reinforcing steel considered in this example, consists of an inclinedtop branch, as defined in DIN EN 1992-1-1:2004 [1] (Section 3.2.7).
15.3 Model and Results
The rectangular cross-section, with properties as defined in Table 15.1, is to be designed for crackwidth, with respect to DIN EN 1992-1-1:2004 (German National Annex) [1] [2]. The calculation stepswith different loading conditions and calculated with different sections of DIN EN 1992-1-1:2004 arepresented below and the results are given in Table 15.2.
Table 15.1: Model Properties
Material Properties Geometric Properties Loading
C 25/30 h = 100.0 cm NEd = 0 or ±300 kN
B 500A d = 96.0 cm MEd = 562.5 kNm
b = 30.0 cm
ϕs = 25.0mm,As = 24.50 cm2
ϕs′ = 12.0mm,As′ = 2.26 cm2
k = 0.3mm
Table 15.2: Results
Case Load As given [cm2] Result SOF. Ref.
MEd, NEd = 0 24.50 As,req [cm2] 6.93 6.93
σs [MP] 207.85 207.85
MEd, NEd = 300 24.50 As,req [cm2] 10.39 10.39
MEd, NEd = −300 24.50 As,req [cm2] 4.04 4.04
88 VERiFiCATiON MANUAL - Design Code Benchmarks | SOFiSTiK 2018
DCE-EN12: Crack width calculation of reinforced beam acc. DIN EN 1992-1-1
Table 15.2: (continued)
Case Load As given [cm2] Result SOF. Ref.
V MEd, NEd = 0 24.50 As [cm2] passed with
given reinforcement
σs [MP] 440.57 440.53
V MEd, NEd = 0 12.0 As [cm2] not passed with
given reinforcement
→ new: 14.54 σs [MP] 436.30 436.28
V MEd, NEd = 0 24.50 k [mm] 0.13 0.13
SOFiSTiK 2018 | VERiFiCATiON MANUAL - Design Code Benchmarks 89
DCE-EN12: Crack width calculation of reinforced beam acc. DIN EN 1992-1-1
15.4 Design Process 1
Design with respect to DIN EN 1992-1-1:2004 (NA) [1] [2]:2
Material:
Concrete: γc = 1.50(NDP) 2.4.2.4: (1), Tab. 2.1DE: Partialfactors for materials Steel: γs = 1.15
ƒck = 25 MPTab. 3.1 : Strength for concrete
ƒcd = cc · ƒck/γc = 0.85 · 25/1.5 = 14.17 MP3.1.6: (1)P, Eq. (3.15): cc = 0.85 con-sidering long term effects
ƒyk = 500 MP3.2.2: (3)P: yield strength ƒyk = 500MP
ƒyd = ƒyk/γs = 500/1.15 = 434.78 MP3.2.7: (2), Fig. 3.8
Design Load:
MEd = 562.5 kNm
NEd = 0.0 or ±300 kN
Minimum reinforcement areas7.3.2: If crack control is required, a min-imum amount of bonded reinforcementis required to control cracking in areaswhere tension is expected
• Case : MEd, NEd = 0.0
As,mn · σs = kc · k · ƒct,eƒ ƒ · Act7.3.2 (2): Eq. 7.1: As,mn minimum areaof reinforcing steel within tensile zone
ƒct,eƒ ƒ = ƒctm ≥ 3.0 MP(NDP) 7.3.2 (2): ƒct,eƒ ƒ mean value ofconcrete tensile strengthWhen the cracking time can’t be placedwith certainty in the first 28 days thenƒct,eƒ ƒ ≥ 3.0 MP for normal concrete
ƒct,eƒ ƒ = 2.6 < 3.0 MP → ƒct,eƒ ƒ = 3.0 MP
Tab. 3.1: ƒctm = 2.6 MP for C 25
7.3.2 (2): Act is the area of concretewithin tensile zone, for pure bending ofa rectangular section its height is h/2
Act = b · heƒ ƒ = 0.3 · 0.5 = 0.15 m2
fct,eff
heƒ ƒ = h/2
7.3.2 (2): Eq. 7.2: kc for bending ofrectangular sections
kc = 0.4 ·�
1 −σc
k1 · (h/h∗) · ƒct,eƒ ƒ
�
≤ 17.3.2 (2): Eq. 7.4: σc mean stress ofthe concrete
σc = NEd/(b · h) = 0.0→ kc = 0.47.3.2 (2): h is the lesser value of b, hh = min{300,1000} = 300 mm k = 0.8 for h ≤ 3007.3.2 (NA.5): Eq. NA.7.5.2: For deter-mination of the reinforcement stress themaximum bar diameter has to be modi-fied
ϕs = ϕ∗s · ƒct,eƒ ƒ / 2.9 N/mm2
ϕ∗s= 25 · 2.9 / 3.0 = 24.16667
1The tools used in the design process are based on steel stress-strain diagrams, asdefined in [1] 3.2.7:(2), Fig. 3.8.
2The sections mentioned in the margins refer to DIN EN 1992-1-1:2004 (German Na-tional Annex) [1], [2], unless otherwise specified.
90 VERiFiCATiON MANUAL - Design Code Benchmarks | SOFiSTiK 2018

DCE-EN12: Crack width calculation of reinforced beam acc. DIN EN 1992-1-1
σs =Ç
k · 3.48 · 106 / ϕ∗s = 207.846 MP (NDP) 7.3.3 Tab. 7.2DE (a)where k = 0.3 m the prescribedmaximum crack widthAs,req = 0.4 · 0.8 · 3.0 · 0.15 · 104/207.846 = 6.928cm2
• Case : NEd = 300 kN
As,mn · σs = kc · k · ƒct,eƒ ƒ · Act 7.3.2 (2): Eq. 7.1: As,mn minimum areaof reinforcing steel within tensile zone
ƒct,eƒ ƒ = ƒctm ≥ 3.0 MP
ƒct,eƒ ƒ = 2.6 < 3.0 MP → ƒct,eƒ ƒ = 3.0 MP Tab. 3.1: ƒctm = 2.6 MP for C 25
Act = b · heƒ ƒ = 0.15 m2 7.3.2 (2): Act is the area of concretewithin tensile zone
σc =NEd
b · h=
300 · 103
300 · 1000= 1.0 MP 7.3.2 (2): Eq. 7.4: σc mean stress of
the concrete, tensile stress σc < 0
k = 0.8 for h ≤ 300 7.3.2 (2): h is the lesser value of b, hh = min{300,1000} = 300 mm
(NDP) 7.3.2 (NA.5): Eq. NA.7.5.2:For determination of the reinforcementstress the maximum bar diameter hasto be modified
ϕs = ϕ∗s · ƒct,eƒ ƒ / 2.9 N/mm2
ϕ∗s= 25 · 2.9 / 3.0 = 24.16667
σs =Ç
k · 3.48 · 106 / ϕ∗s = 207.846 MP (NDP) 7.3.3 Tab. 7.2DE (a)where k = 0.3 m the prescribedmaximum crack width
kc = 0.4 ·�
1 −σc
k1 · (h/h∗) · ƒct,eƒ ƒ
�
≤ 1 7.3.2 (2): Eq. 7.2: kc for bending withaxial force of rectangular sections
k1 = 2 · h∗ / (3 · h) = 2/3 h∗ = 1.0 m for h ≥ 1.0 mk1 = 2 · h∗ / (3 · h) if NEd tensile force
kc = 0.4 ·�
1 +1.0
(2/3) · 1 · 3.0
�
= 0.6 ≤ 1 7.3.2 (2): Eq. 7.1: Tensile stress σc < 0
As,req = 0.6 · 0.8 · 3.0 · 0.15 · 104/207.846 = 10.39cm2
• Case : NEd = −300 kN
As,mn · σs = kc · k · ƒct,eƒ ƒ · Act 7.3.2 (2): Eq. 7.1: As,mn minimum areaof reinforcing steel within tensile zone
ƒct,eƒ ƒ = ƒctm ≥ 3.0 MP
ƒct,eƒ ƒ = 2.6 < 3.0 MP → ƒct,eƒ ƒ = 3.0 MP Tab. 3.1: ƒctm = 2.6 MP for C 25
Act = b · heƒ ƒ 7.3.2 (2): Act is the area of concretewithin tensile zone
The height of the tensile zone is determined through the stresses:
σc =NEd
b · h=
300 · 103
300 · 1000= 1.0 MP 7.3.2 (2): Eq. 7.4: σc mean stress of the
concrete, compressive stress σc > 0
σ = ƒct,eƒ ƒ = 3.0 MP
⇒ heƒ ƒ =3.0 · 50
3.0 + 1.0= 37.5cm
Act = 0.3 · 0.375 = 0.1125 m2
k = 0.8 for h ≤ 300 7.3.2 (2): h is the lesser value of b, hh = min{300,1000} = 300 mm
(NDP) 7.3.2 (NA.5): Eq. NA.7.5.2:For determination of the reinforcementstress the maximum bar diameter hasto be modifiedSOFiSTiK 2018 | VERiFiCATiON MANUAL - Design Code Benchmarks 91
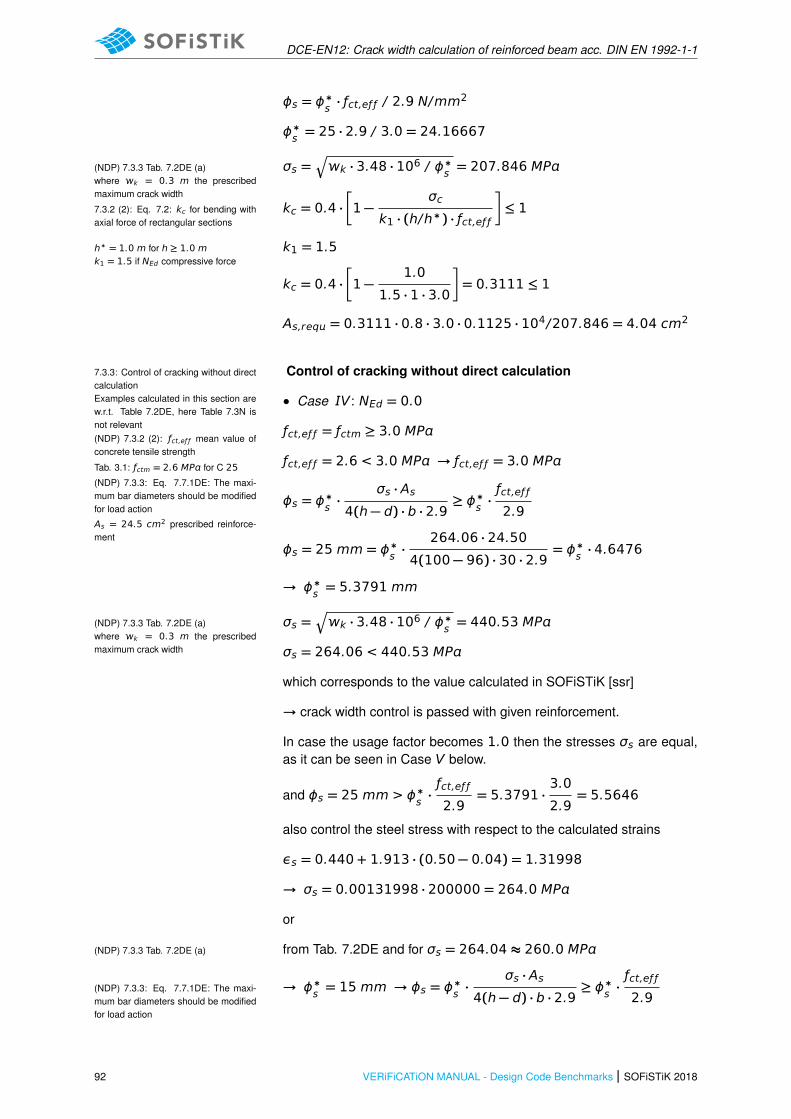
DCE-EN12: Crack width calculation of reinforced beam acc. DIN EN 1992-1-1
ϕs = ϕ∗s · ƒct,eƒ ƒ / 2.9 N/mm2
ϕ∗s= 25 · 2.9 / 3.0 = 24.16667
σs =Ç
k · 3.48 · 106 / ϕ∗s = 207.846 MP(NDP) 7.3.3 Tab. 7.2DE (a)where k = 0.3 m the prescribedmaximum crack width
kc = 0.4 ·�
1 −σc
k1 · (h/h∗) · ƒct,eƒ ƒ
�
≤ 17.3.2 (2): Eq. 7.2: kc for bending withaxial force of rectangular sections
k1 = 1.5h∗ = 1.0 m for h ≥ 1.0 mk1 = 1.5 if NEd compressive force
kc = 0.4 ·�
1 −1.0
1.5 · 1 · 3.0
�
= 0.3111 ≤ 1
As,req = 0.3111 · 0.8 · 3.0 · 0.1125 · 104/207.846 = 4.04 cm2
Control of cracking without direct calculation7.3.3: Control of cracking without directcalculationExamples calculated in this section arew.r.t. Table 7.2DE, here Table 7.3N isnot relevant
• Case V: NEd = 0.0
ƒct,eƒ ƒ = ƒctm ≥ 3.0 MP(NDP) 7.3.2 (2): ƒct,eƒ ƒ mean value ofconcrete tensile strength
ƒct,eƒ ƒ = 2.6 < 3.0 MP → ƒct,eƒ ƒ = 3.0 MPTab. 3.1: ƒctm = 2.6 MP for C 25
(NDP) 7.3.3: Eq. 7.7.1DE: The maxi-mum bar diameters should be modifiedfor load action
ϕs = ϕ∗s ·σs · As
4(h − d) · b · 2.9≥ ϕ∗
s·ƒct,eƒ ƒ
2.9As = 24.5 cm2 prescribed reinforce-ment
ϕs = 25 mm = ϕ∗s·
264.06 · 24.50
4(100 − 96) · 30 · 2.9= ϕ∗
s· 4.6476
→ ϕ∗s= 5.3791 mm
σs =Ç
k · 3.48 · 106 / ϕ∗s = 440.53 MP(NDP) 7.3.3 Tab. 7.2DE (a)where k = 0.3 m the prescribedmaximum crack width σs = 264.06 < 440.53 MP
which corresponds to the value calculated in SOFiSTiK [ssr]
→ crack width control is passed with given reinforcement.
In case the usage factor becomes 1.0 then the stresses σs are equal,as it can be seen in Case V below.
and ϕs = 25 mm> ϕ∗s·ƒct,eƒ ƒ
2.9= 5.3791 ·
3.0
2.9= 5.5646
also control the steel stress with respect to the calculated strains
εs = 0.440 + 1.913 · (0.50 − 0.04) = 1.31998
→ σs = 0.00131998 · 200000 = 264.0 MP
or
from Tab. 7.2DE and for σs = 264.04 ≈ 260.0 MP(NDP) 7.3.3 Tab. 7.2DE (a)
→ ϕ∗s= 15 mm → ϕs = ϕ∗s ·
σs · As4(h − d) · b · 2.9
≥ ϕ∗s·ƒct,eƒ ƒ
2.9(NDP) 7.3.3: Eq. 7.7.1DE: The maxi-mum bar diameters should be modifiedfor load action
92 VERiFiCATiON MANUAL - Design Code Benchmarks | SOFiSTiK 2018

DCE-EN12: Crack width calculation of reinforced beam acc. DIN EN 1992-1-1
ϕs = 15 ·264.06 · 24.50
4(100 − 96) · 30 · 2.9= 69.69 mm> 25 mm
→ crack width control is passed with given reinforcement.
• Case V: NEd = 0.0, As = 12.0 cm2
In this case, the prescribed reinforcement is decreased from As =24.5 cm2 to As = 12.0 cm2 in order to examine a case where thethe crack width control is not passed with the given reinforcement.
ƒct,eƒ ƒ = ƒctm ≥ 3.0 MP (NDP) 7.3.2 (2): ƒct,eƒ ƒ mean value ofconcrete tensile strength
ƒct,eƒ ƒ = 2.6 < 3.0 MP → ƒct,eƒ ƒ = 3.0 MP Tab. 3.1: ƒctm = 2.6 MP for C 25
from Tab. 7.2DE and for σs = 509.15 ≈ 510.0 MP (NDP) 7.3.3 Tab. 7.2DE (a)
→ ϕ∗s≈ 3.9 mm → ϕs = ϕ∗s ·
σs · As4(h − d) · b · 2.9
(NDP) 7.3.3: Eq. 7.7.1DE: The maxi-mum bar diameters should be modifiedfor load action
ϕs = 3.9 ·509.15 · 12.0
4(100 − 96) · 30 · 2.9= 17.12 mm< 25 mm
→ crack width control is not passed with given reinforcement.
→ start increasing reinforcement in order to be in the limits of admissiblesteel stresses
from Tab. 7.2DE and for σs = 436.43 MP (NDP) 7.3.3 Tab. 7.2DE (a)
→ ϕ∗s≈ 5.6 mm → ϕs = ϕ∗s ·
σs · As4(h − d) · b · 2.9
7.3.3: Eq. 7.7.1DE: The maximum bardiameters should be modified for loadaction
ϕs = 5.6 ·436.43 · 14.54
4(100 − 96) · 30 · 2.9= 25.45 mm ≥ 25 mm
→ crack width control passed with additional reinforcement.
If we now input as prescribed reinforcement the reinforcement that iscalculated in order to pass crack control, i.e. As = 14.54 cm2 we geta steel stress of σs = 436.36 MP which gives
ϕs = 25 mm = ϕ∗s·
436.36 · 14.54
4(100 − 96) · 30 · 2.9
→ ϕ∗s= 5.4849 mm
σs =Ç
k · 3.48 · 106 / ϕ∗s (NDP) 7.3.3 Tab. 7.2DE (a)where k = 0.3 m the prescribedmaximum crack width
σs =p
0.3 · 3.48 · 106 / 5.4849 = 436.28 MP
Here we can notice that the stresses are equal leading to a usagefactor of 1.0
Control of cracking with directcalculation 7.3.4: Control of cracking with direct cal-
culation
SOFiSTiK 2018 | VERiFiCATiON MANUAL - Design Code Benchmarks 93
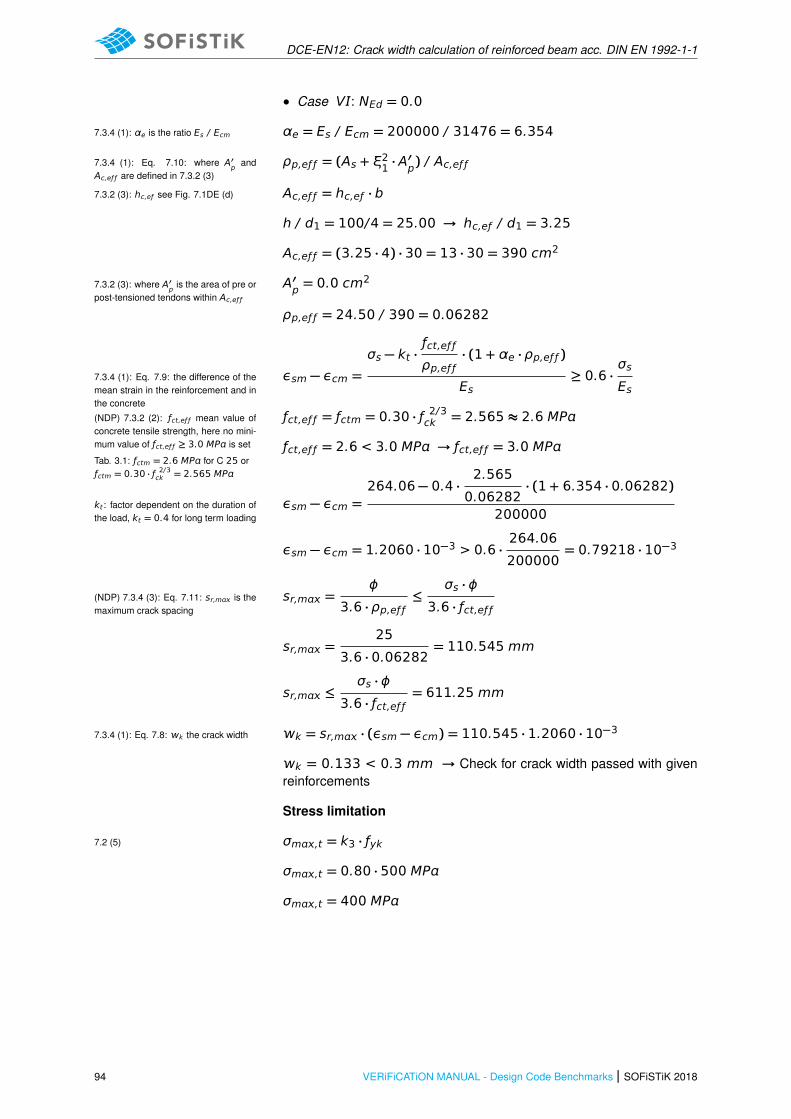
DCE-EN12: Crack width calculation of reinforced beam acc. DIN EN 1992-1-1
• Case V: NEd = 0.0
αe = Es / Ecm = 200000 / 31476 = 6.3547.3.4 (1): αe is the ratio Es / Ecm
ρp,eƒ ƒ = (As + ξ21 · A′p) / Ac,eƒ ƒ7.3.4 (1): Eq. 7.10: where A′
pand
Ac,eƒ ƒ are defined in 7.3.2 (3)
Ac,eƒ ƒ = hc,eƒ · b7.3.2 (3): hc,eƒ see Fig. 7.1DE (d)
h / d1 = 100/4 = 25.00 → hc,eƒ / d1 = 3.25
Ac,eƒ ƒ = (3.25 · 4) · 30 = 13 · 30 = 390 cm2
A′p= 0.0 cm27.3.2 (3): where A′
pis the area of pre or
post-tensioned tendons within Ac,eƒ ƒ
ρp,eƒ ƒ = 24.50 / 390 = 0.06282
εsm − εcm =σs − kt ·
ƒct,eƒ ƒ
ρp,eƒ ƒ· (1 + αe · ρp,eƒ ƒ )
Es≥ 0.6 ·
σs
Es7.3.4 (1): Eq. 7.9: the difference of themean strain in the reinforcement and inthe concrete
ƒct,eƒ ƒ = ƒctm = 0.30 · ƒ 2/3ck = 2.565 ≈ 2.6 MP(NDP) 7.3.2 (2): ƒct,eƒ ƒ mean value ofconcrete tensile strength, here no mini-mum value of ƒct,eƒ ƒ ≥ 3.0 MP is set ƒct,eƒ ƒ = 2.6 < 3.0 MP → ƒct,eƒ ƒ = 3.0 MPTab. 3.1: ƒctm = 2.6 MP for C 25 orƒctm = 0.30 · ƒ 2/3ck = 2.565 MP
εsm − εcm =264.06 − 0.4 ·
2.565
0.06282· (1 + 6.354 · 0.06282)
200000kt : factor dependent on the duration ofthe load, kt = 0.4 for long term loading
εsm − εcm = 1.2060 · 10−3 > 0.6 ·264.06
200000= 0.79218 · 10−3
sr,m =ϕ
3.6 · ρp,eƒ ƒ≤
σs · ϕ
3.6 · ƒct,eƒ ƒ(NDP) 7.3.4 (3): Eq. 7.11: sr,m is themaximum crack spacing
sr,m =25
3.6 · 0.06282= 110.545 mm
sr,m ≤σs · ϕ
3.6 · ƒct,eƒ ƒ= 611.25 mm
k = sr,m · (εsm − εcm) = 110.545 · 1.2060 · 10−37.3.4 (1): Eq. 7.8: k the crack width
k = 0.133 < 0.3 mm → Check for crack width passed with givenreinforcements
Stress limitation
σm,t = k3 · ƒyk7.2 (5)
σm,t = 0.80 · 500 MP
σm,t = 400 MP
94 VERiFiCATiON MANUAL - Design Code Benchmarks | SOFiSTiK 2018
DCE-EN12: Crack width calculation of reinforced beam acc. DIN EN 1992-1-1
15.5 Conclusion
This example shows the calculation of crack widths. Various ways of reference calculations are demon-strated, in order to compare the SOFiSTiK results to. It has been shown that the results are reproducedwith excellent accuracy.
15.6 Literature
[1] DIN EN 1992-1-1/NA: Eurocode 2: Design of concrete structures, Part 1-1/NA: General rules andrules for buildings - German version EN 1992-1-1:2005 (D), Nationaler Anhang Deutschland -Stand Februar 2010. CEN. 2010.
[2] F. Fingerloos, J. Hegger, and K. Zilch. DIN EN 1992-1-1 Bemessung und Konstruktion vonStahlbeton- und Spannbetontragwerken - Teil 1-1: Allgemeine Bemessungsregeln und Regelnfur den Hochbau. BVPI, DBV, ISB, VBI. Ernst & Sohn, Beuth, 2012.
SOFiSTiK 2018 | VERiFiCATiON MANUAL - Design Code Benchmarks 95

DCE-EN12: Crack width calculation of reinforced beam acc. DIN EN 1992-1-1
96 VERiFiCATiON MANUAL - Design Code Benchmarks | SOFiSTiK 2018

DCE-EN13: Design of a Steel I-section for Bending and Shear
16 DCE-EN13: Design of a Steel I-section for Bendingand Shear
Overview
Design Code Family(s): EN
Design Code(s): EN 1993-1-1
Module(s): AQB, AQUA
Input file(s): usage steel.dat
16.1 Problem Description
The problem consists of a steel I- section, as shown in Fig. 16.1. The cross-section is designed forbending and shear.
y
z
b
hVy
Mz
tr
tƒ
Figure 16.1: Problem Description
16.2 Reference Solution
This example is concerned with the resistance of steel cross-sections for bending and shear. The contentof this problem is covered by the following parts of EN 1993-1-1:2005 [7]:
• Structural steel (Section 3.2 )
• Resistance of cross-sections (Section 6.2)
16.3 Model and Results
The I-section, a HEA 200, with properties as defined in Table 16.1, is to be designed for an ultimatemoment Mz and a shear force Vy, with respect to EN 1993-1-1:2005 [7]. The calculation steps are
SOFiSTiK 2018 | VERiFiCATiON MANUAL - Design Code Benchmarks 97

DCE-EN13: Design of a Steel I-section for Bending and Shear
presented below and the results are given in Table 16.2. The utilisation level of allowable plastic forcesare calculated and compared to SOFiSTiK results.
Table 16.1: Model Properties
Material Properties Geometric Properties Loading
S 235 HEA 200 Vy = 200 or 300 kN
b = 20.0 cm Mz = 20 kNm
h = 19.0 cm
tƒ = 1.0 cm, t = 0.65 cm
r = 1.8 cm
Table 16.2: Results
Case Result SOF.(EC3 Tables)
SOF.(FEM)
Ref.
Vp,Rd,y [kN] 542.71 611.85 542.71
Vp,Rd,z [kN] 245.32 228.38 245.32
Util. level Vy 0.369 0.326 0.369
Util. level Mz 0.418 0.418 0.418
Util. level Vy 0.553 0.490 0.553
Util. level Mz 0.422 0.417 0.422
98 VERiFiCATiON MANUAL - Design Code Benchmarks | SOFiSTiK 2018
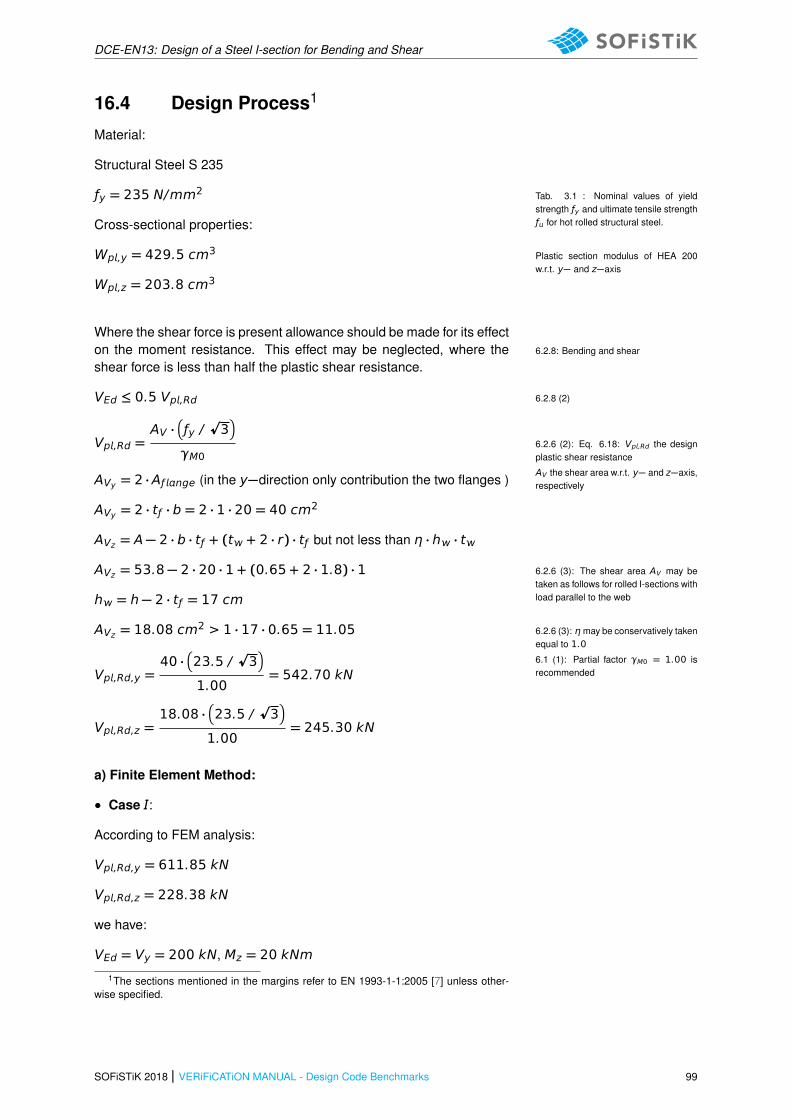
DCE-EN13: Design of a Steel I-section for Bending and Shear
16.4 Design Process1
Material:
Structural Steel S 235
ƒy = 235 N/mm2 Tab. 3.1 : Nominal values of yieldstrength ƒy and ultimate tensile strengthƒ for hot rolled structural steel.Cross-sectional properties:
Wp,y = 429.5 cm3 Plastic section modulus of HEA 200w.r.t. y− and z−axis
Wp,z = 203.8 cm3
Where the shear force is present allowance should be made for its effecton the moment resistance. This effect may be neglected, where the 6.2.8: Bending and shear
shear force is less than half the plastic shear resistance.
VEd ≤ 0.5 Vp,Rd 6.2.8 (2)
Vp,Rd =AV ·
�
ƒy /p3�
γM06.2.6 (2): Eq. 6.18: Vp,Rd the designplastic shear resistance
AV the shear area w.r.t. y− and z−axis,respectivelyAVy = 2 ·Aƒ nge (in the y−direction only contribution the two flanges )
AVy = 2 · tƒ · b = 2 · 1 · 20 = 40 cm2
AVz = A − 2 · b · tƒ + (t + 2 · r) · tƒ but not less than η · h · t
AVz = 53.8 − 2 · 20 · 1 + (0.65 + 2 · 1.8) · 1 6.2.6 (3): The shear area AV may betaken as follows for rolled I-sections withload parallel to the webh = h − 2 · tƒ = 17 cm
AVz = 18.08 cm2 > 1 · 17 · 0.65 = 11.05 6.2.6 (3): ηmay be conservatively taken
equal to 1.0
6.1 (1): Partial factor γM0 = 1.00 isrecommendedVp,Rd,y =
40 ·�
23.5 /p3�
1.00= 542.70 kN
Vp,Rd,z =18.08 ·
�
23.5 /p3�
1.00= 245.30 kN
a) Finite Element Method:
• Case :
According to FEM analysis:
Vp,Rd,y = 611.85 kN
Vp,Rd,z = 228.38 kN
we have:
VEd = Vy = 200 kN, Mz = 20 kNm
1The sections mentioned in the margins refer to EN 1993-1-1:2005 [7] unless other-wise specified.
SOFiSTiK 2018 | VERiFiCATiON MANUAL - Design Code Benchmarks 99

DCE-EN13: Design of a Steel I-section for Bending and Shear
VEd
Vp,Rd,y=
200
611.85= 0.3268 < 0.5
→ no reduction of moment resistance due to shear
Mz,V,Rd =Wp,z · ƒyγM0
=203.8 · 23.5
1= 4789 kNcm = 47.89 kNm6.2.8 (5): Eq. 6.30: The reduced design
plastic resistance moment (for ρ = 0)
Mz
Mz,V,Rd=
20
47.89= 0.418
• Case :
VEd = Vy = 300 kN, Mz = 20 kNm
VEd
Vp,Rd,y=
300
611.85= 0.490 < 0.5
→ no reduction of moment resistance due to shear
Mz,V,Rd =Wp,z · ƒyγM0
Mz,V,Rd = 47.89kNm
Mz
Mz,V,Rd=
20
47.89= 0.418
b) EC3 Tables:
Vp,Rd,y = 542.71 kN
Vp,Rd,z = 245.32 kN
• Case :
VEd = Vy = 200 kN, Mz = 20 kNm
VEd
Vp,Rd,y=
200
542.71= 0.368 < 0.5
→ no reduction of moment resistance due to shear
Mz,V,Rd =Wp,z · ƒyγM0
=203.8 · 23.5
1= 4789 kNcm = 47.89 kNm6.2.8 (5): Eq. 6.30: The reduced design
plastic resistance moment (for ρ = 0)
Mz
Mz,V,Rd=
20
47.89= 0.418
• Case :
VEd = Vy = 300 kN, Mz = 20 kNm
VEd
Vp,Rd,y=
300
542.71= 0.552 > 0.5
→ reduction of moment resistance due to shear6.2.8 (3): The reduced moment resis-tance should be taken as the design re-sistance of the cross-section, calculatedusing a reduced yield strength (1 − ρ) ·ƒy for the shear area100 VERiFiCATiON MANUAL - Design Code Benchmarks | SOFiSTiK 2018
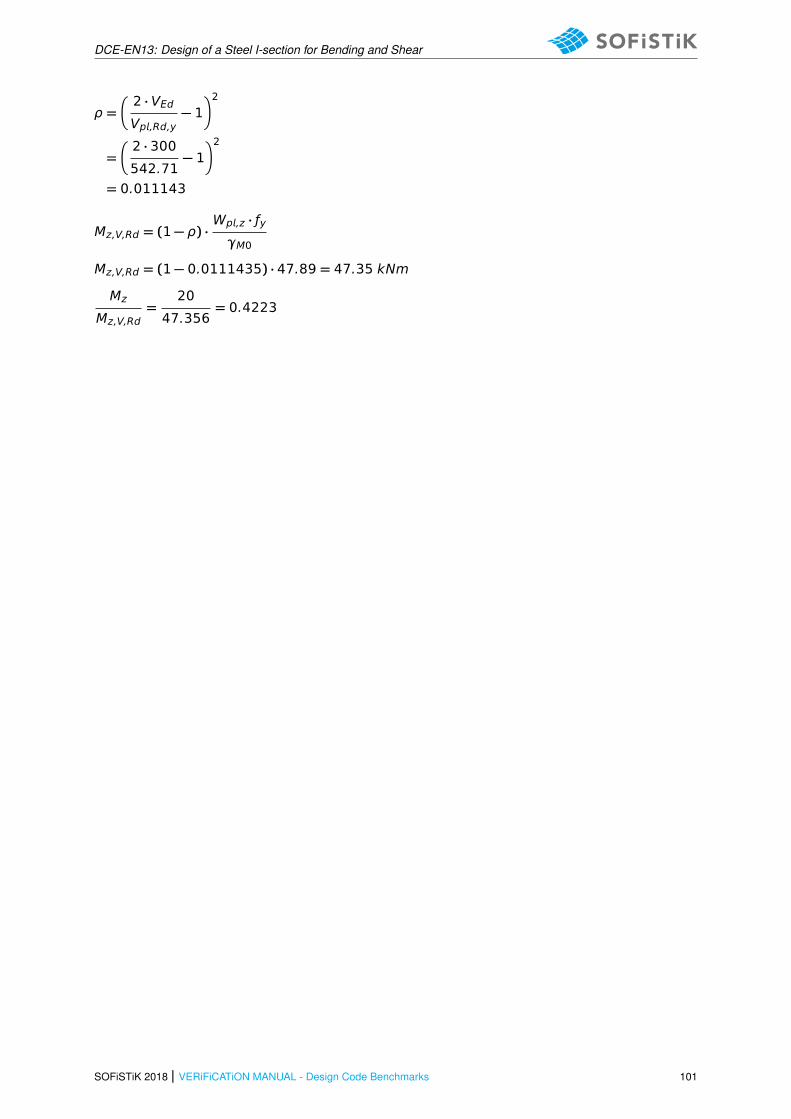
DCE-EN13: Design of a Steel I-section for Bending and Shear
ρ =�
2 · VEdVp,Rd,y
− 1�2
=�
2 · 300
542.71− 1
�2
= 0.011143
Mz,V,Rd = (1 − ρ) ·Wp,z · ƒyγM0
Mz,V,Rd = (1 − 0.0111435) · 47.89 = 47.35 kNm
Mz
Mz,V,Rd=
20
47.356= 0.4223
SOFiSTiK 2018 | VERiFiCATiON MANUAL - Design Code Benchmarks 101
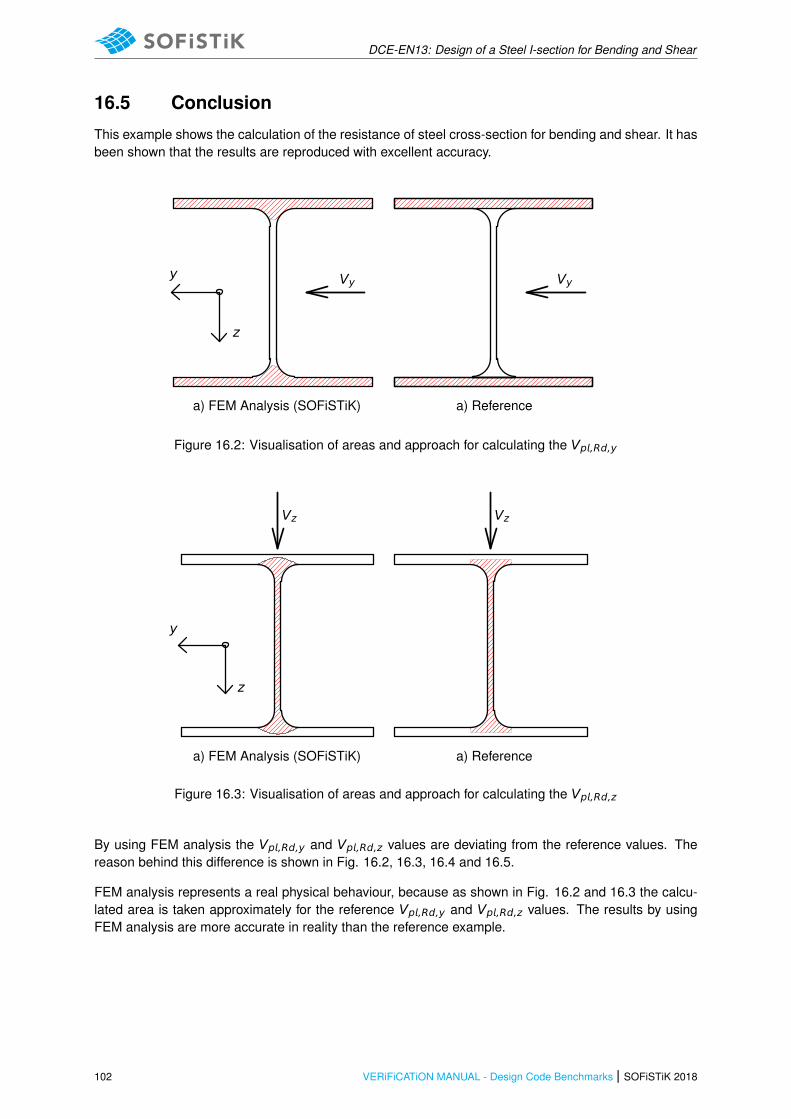
DCE-EN13: Design of a Steel I-section for Bending and Shear
16.5 Conclusion
This example shows the calculation of the resistance of steel cross-section for bending and shear. It hasbeen shown that the results are reproduced with excellent accuracy.
z
y Vy Vy
a) FEM Analysis (SOFiSTiK) a) Reference
Figure 16.2: Visualisation of areas and approach for calculating the Vp,Rd,y
z
y
Vz Vz
a) FEM Analysis (SOFiSTiK) a) Reference
Figure 16.3: Visualisation of areas and approach for calculating the Vp,Rd,z
By using FEM analysis the Vp,Rd,y and Vp,Rd,z values are deviating from the reference values. Thereason behind this difference is shown in Fig. 16.2, 16.3, 16.4 and 16.5.
FEM analysis represents a real physical behaviour, because as shown in Fig. 16.2 and 16.3 the calcu-lated area is taken approximately for the reference Vp,Rd,y and Vp,Rd,z values. The results by usingFEM analysis are more accurate in reality than the reference example.
102 VERiFiCATiON MANUAL - Design Code Benchmarks | SOFiSTiK 2018
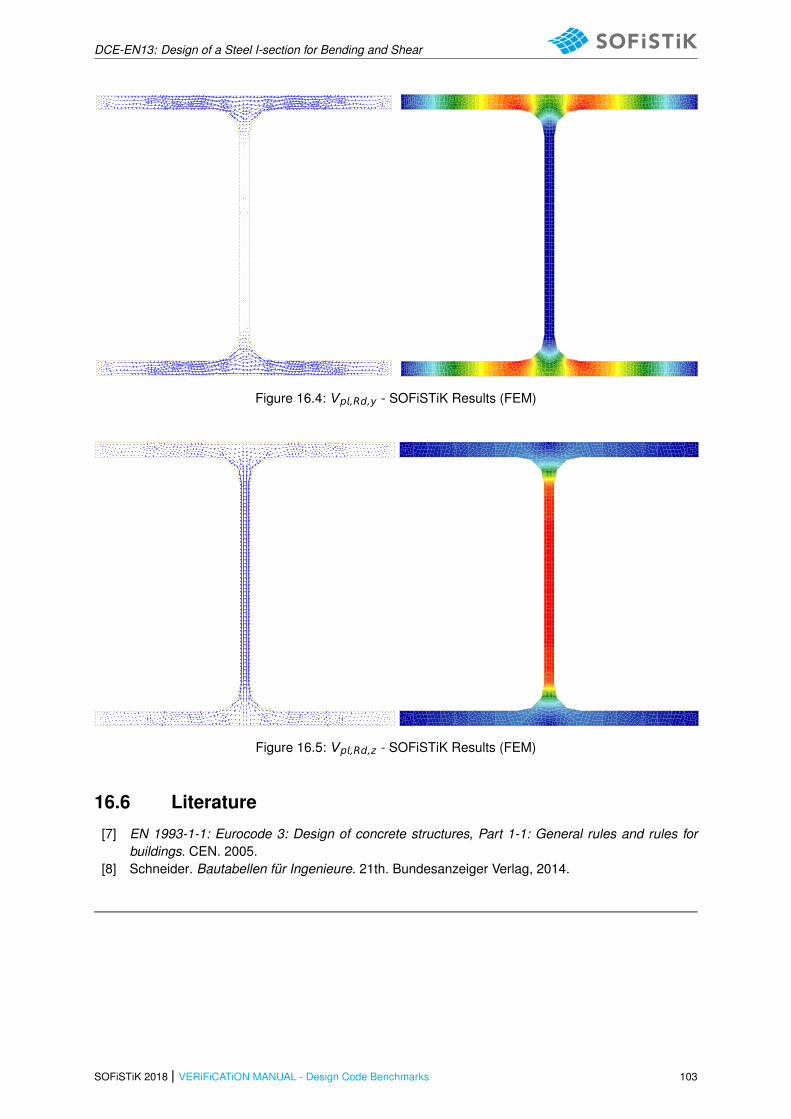
DCE-EN13: Design of a Steel I-section for Bending and Shear
SOFiSTiK AG * Bruckmannring 38 * 85764 OberschleißheimSOFiSTiK 2018 WINGRAF - GRAPHICS FOR FINITE ELEMENTS (V 19.00)
Page 12016-06-03
SOFi
STiK
AG
- w
ww.
sofis
tik.d
e
M 1 : 1.23XYZ
Shear stress of the Cross section in Element, Loadcase 2 Vy = 1.0 , 1 cm 3D = 0.866 MPa (Max=0.377)
m0.15 0.10 0.05 0.00 -0.05 -0.10 -0.15
0.05
0.00
-0.0
5
SOFiSTiK AG * Bruckmannring 38 * 85764 OberschleißheimSOFiSTiK 2018 WINGRAF - GRAPHICS FOR FINITE ELEMENTS (V 19.00)
Page 12016-06-03
SOFi
STiK
AG
- w
ww.
sofis
tik.d
e
M 1 : 1.23XYZ
Shear stress of the Cross section from middle of element, Loadcase 2 Vy = 1.0 , from 1.6442e-04 to 0.375 step 0.0094 MPa
0.000
0.009
0.019
0.028
0.037
0.047
0.056
0.066
0.075
0.084
0.094
0.103
0.112
0.122
0.131
0.141
0.150
0.159
0.169
0.178
0.187
0.197
0.206
0.216
0.225
0.234
0.244
0.253
0.262
0.272
0.281
0.291
0.300
0.309
0.319
0.328
0.337
0.347
0.356
0.3660.375
m0.15 0.10 0.05 0.00 -0.05 -0.10
0.05
0.00
-0.0
5
Figure 16.4: Vp,Rd,y - SOFiSTiK Results (FEM)
SOFiSTiK AG * Bruckmannring 38 * 85764 OberschleißheimSOFiSTiK 2018 WINGRAF - GRAPHICS FOR FINITE ELEMENTS (V 19.00)
Page 12016-06-03
SOFi
STiK
AG
- w
ww.
sofis
tik.d
e
M 1 : 1.23XYZ
Shear stress of the Cross section in Element, Loadcase 3 Vz = 1.0 , 1 cm 3D = 2.16 MPa (Max=0.895)
m0.15 0.10 0.05 0.00 -0.05 -0.10 -0.15
0.05
0.00
-0.0
5
SOFiSTiK AG * Bruckmannring 38 * 85764 OberschleißheimSOFiSTiK 2018 WINGRAF - GRAPHICS FOR FINITE ELEMENTS (V 19.00)
Page 12016-06-03
SOFi
STiK
AG
- w
ww.
sofis
tik.d
e
M 1 : 1.23XYZ
Shear stress of the Cross section from middle of element, Loadcase 3 Vz = 1.0 , from 0.0024 to 0.895 step 0.0223 MPa
0.002
0.022
0.045
0.067
0.089
0.112
0.134
0.156
0.178
0.201
0.223
0.245
0.268
0.290
0.312
0.335
0.357
0.379
0.402
0.424
0.446
0.469
0.491
0.513
0.535
0.558
0.580
0.602
0.625
0.647
0.669
0.692
0.714
0.736
0.759
0.781
0.803
0.825
0.848
0.8700.895
m0.15 0.10 0.05 0.00 -0.05 -0.10
0.05
0.00
-0.0
5
Figure 16.5: Vp,Rd,z - SOFiSTiK Results (FEM)
16.6 Literature
[7] EN 1993-1-1: Eurocode 3: Design of concrete structures, Part 1-1: General rules and rules forbuildings. CEN. 2005.
[8] Schneider. Bautabellen fur Ingenieure. 21th. Bundesanzeiger Verlag, 2014.
SOFiSTiK 2018 | VERiFiCATiON MANUAL - Design Code Benchmarks 103

DCE-EN13: Design of a Steel I-section for Bending and Shear
104 VERiFiCATiON MANUAL - Design Code Benchmarks | SOFiSTiK 2018
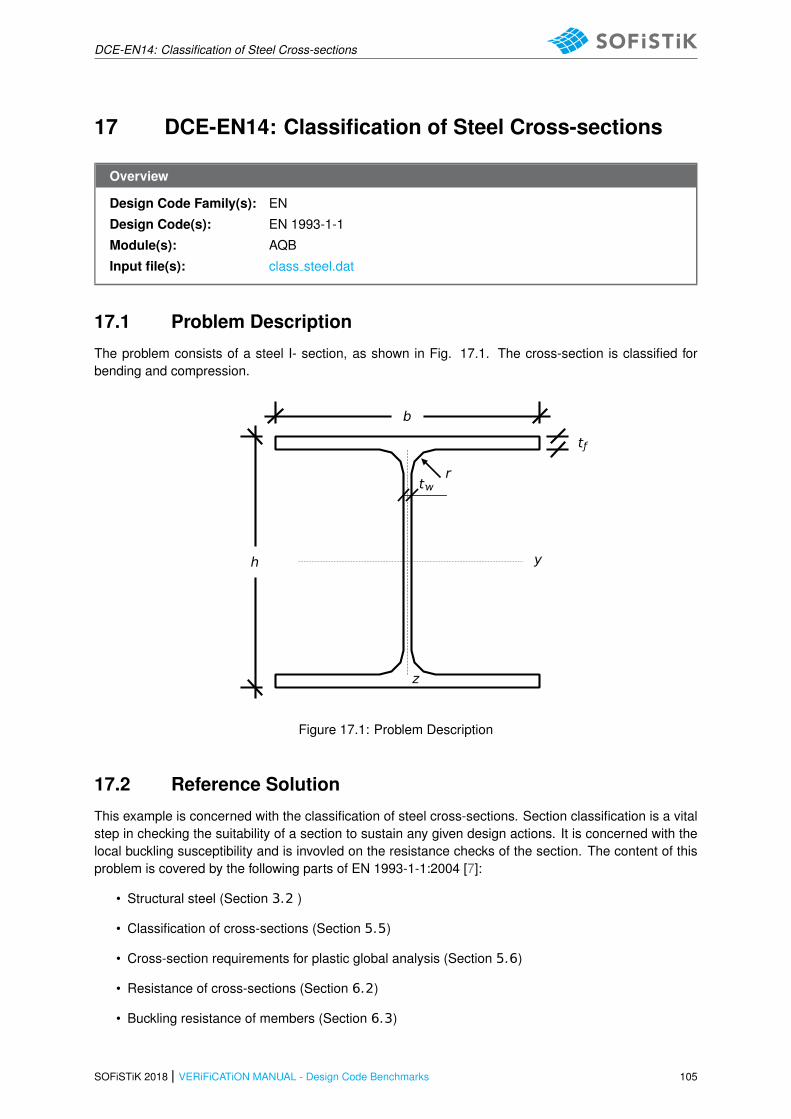
DCE-EN14: Classification of Steel Cross-sections
17 DCE-EN14: Classification of Steel Cross-sections
Overview
Design Code Family(s): EN
Design Code(s): EN 1993-1-1
Module(s): AQB
Input file(s): class steel.dat
17.1 Problem Description
The problem consists of a steel I- section, as shown in Fig. 17.1. The cross-section is classified forbending and compression.
y
z
b
h
tr
tƒ
Figure 17.1: Problem Description
17.2 Reference Solution
This example is concerned with the classification of steel cross-sections. Section classification is a vitalstep in checking the suitability of a section to sustain any given design actions. It is concerned with thelocal buckling susceptibility and is invovled on the resistance checks of the section. The content of thisproblem is covered by the following parts of EN 1993-1-1:2004 [7]:
• Structural steel (Section 3.2 )
• Classification of cross-sections (Section 5.5)
• Cross-section requirements for plastic global analysis (Section 5.6)
• Resistance of cross-sections (Section 6.2)
• Buckling resistance of members (Section 6.3)
SOFiSTiK 2018 | VERiFiCATiON MANUAL - Design Code Benchmarks 105

DCE-EN14: Classification of Steel Cross-sections
A diagrammatic representation of the four classes of section is given in Fig. 17.2, where a cross-sectionis subjected to an increasing major axis bending moment until failure [9].
Class 1: Fullly plastic moment is reached
Class 2: Fullly plastic moment reached but unloading occurs
Class 3: Partial yielding occurs, parts of section still elastic
Class 4: Local buckling causes unloading in the elastic range
Curvature
Bending Moment
Fully PlasticMoment
Figure 17.2: Idealized Moment Curvature Behaviour for Four Classes of Cross-sections
17.3 Model and Results
The I-section, a UB 457x152x74, with properties as defined in Table 17.1, is to be classified for bendingand compression, with respect to EN 1993-1-1:2005 [7]. For the compression case, an axial load of N =3000 kN is applied and for the bending case a moment of My = 500 kNm. In AQB the classificationof the cross-sections is done taking into account the stress levels and the respective design request.Thus, a Class 1 cross-section can be reached, only if a nonlinear design (plastic-plastic) is requestedand if the loading is such as to cause the yield stress to be exceeded. Therefore, in order to derive thehigher Class possible for this cross-section, we consider these loads, which will cause higher stressesthan the yield stress. The calculation steps are presented below and the results are given in Table 17.2.
Table 17.1: Model Properties
Material Properties Geometric Properties Loading
S 275 UB 457x152x74 N = −3000 kN
b = 154.4mm My = 500 kNm
h = 462.0mm
tƒ = 17.0mm
t = 9.6mm
r = 10.2mm
106 VERiFiCATiON MANUAL - Design Code Benchmarks | SOFiSTiK 2018

DCE-EN14: Classification of Steel Cross-sections
Table 17.2: Results
Case Part Result SOF. Ref.
Flangec/t
3.66 3.66
Web 42.46 42.46
BendingFlange
Class1 1
Web 1 1
CompressionFlange
Class1 1
Web 4 4
SOFiSTiK 2018 | VERiFiCATiON MANUAL - Design Code Benchmarks 107
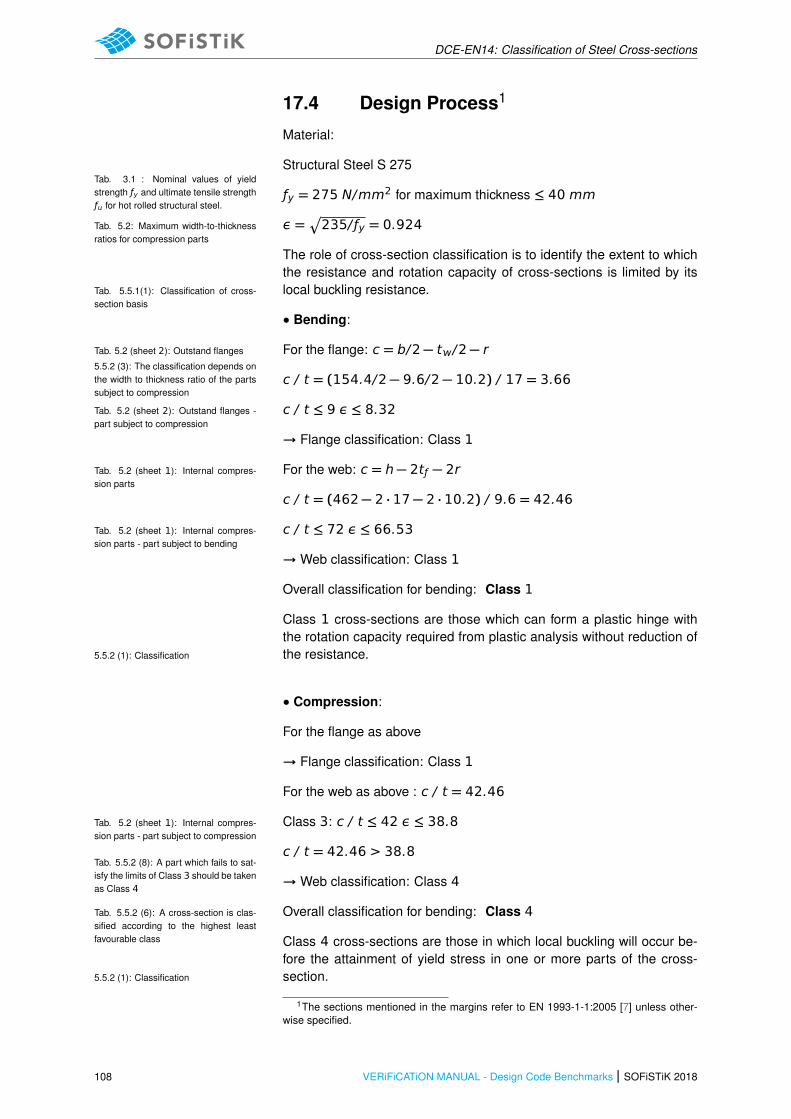
DCE-EN14: Classification of Steel Cross-sections
17.4 Design Process1
Material:
Structural Steel S 275Tab. 3.1 : Nominal values of yieldstrength ƒy and ultimate tensile strengthƒ for hot rolled structural steel.
ƒy = 275 N/mm2 for maximum thickness ≤ 40 mm
ε =Æ
235/ ƒy = 0.924Tab. 5.2: Maximum width-to-thicknessratios for compression parts
The role of cross-section classification is to identify the extent to whichthe resistance and rotation capacity of cross-sections is limited by itslocal buckling resistance.Tab. 5.5.1(1): Classification of cross-
section basis
• Bending:
For the flange: c = b/2 − t/2 − rTab. 5.2 (sheet 2): Outstand flanges
5.5.2 (3): The classification depends onthe width to thickness ratio of the partssubject to compression
c / t = (154.4/2 − 9.6/2 − 10.2) / 17 = 3.66
c / t ≤ 9 ε ≤ 8.32Tab. 5.2 (sheet 2): Outstand flanges -part subject to compression
→ Flange classification: Class 1
For the web: c = h − 2tƒ − 2rTab. 5.2 (sheet 1): Internal compres-sion parts
c / t = (462 − 2 · 17 − 2 · 10.2) / 9.6 = 42.46
c / t ≤ 72 ε ≤ 66.53Tab. 5.2 (sheet 1): Internal compres-sion parts - part subject to bending
→ Web classification: Class 1
Overall classification for bending: Class 1
Class 1 cross-sections are those which can form a plastic hinge withthe rotation capacity required from plastic analysis without reduction ofthe resistance.5.5.2 (1): Classification
• Compression:
For the flange as above
→ Flange classification: Class 1
For the web as above : c / t = 42.46
Class 3: c / t ≤ 42 ε ≤ 38.8Tab. 5.2 (sheet 1): Internal compres-sion parts - part subject to compression
Tab. 5.5.2 (8): A part which fails to sat-isfy the limits of Class 3 should be takenas Class 4
c / t = 42.46 > 38.8
→ Web classification: Class 4
Overall classification for bending: Class 4Tab. 5.5.2 (6): A cross-section is clas-sified according to the highest leastfavourable class Class 4 cross-sections are those in which local buckling will occur be-
fore the attainment of yield stress in one or more parts of the cross-section.5.5.2 (1): Classification
1The sections mentioned in the margins refer to EN 1993-1-1:2005 [7] unless other-wise specified.
108 VERiFiCATiON MANUAL - Design Code Benchmarks | SOFiSTiK 2018
DCE-EN14: Classification of Steel Cross-sections
17.5 Conclusion
This example shows the classification of steel cross-sections for bending and compression. It has beenshown that the results are reproduced with excellent accuracy.
17.6 Literature
[7] EN 1993-1-1: Eurocode 3: Design of concrete structures, Part 1-1: General rules and rules forbuildings. CEN. 2005.
[9] Structural Eurocodes - Extracts from the structural Eurocodes for students of structural design.BSI - British Standards Institution. 2007.
SOFiSTiK 2018 | VERiFiCATiON MANUAL - Design Code Benchmarks 109

DCE-EN14: Classification of Steel Cross-sections
110 VERiFiCATiON MANUAL - Design Code Benchmarks | SOFiSTiK 2018

DCE-EN15: Buckling Resistance of Steel Members
18 DCE-EN15: Buckling Resistance of Steel Members
Overview
Design Code Family(s): EN
Design Code(s): EN 1993-1-1
Module(s): BDK
Input file(s): buckling steel.dat
18.1 Problem Description
The problem consists of a simply supported beam with a steel I-section subject to uniform end moments,as shown in Fig. 18.1. The cross-section is checked against buckling.
b
h
My
My
y
L
tr
tƒ
Figure 18.1: Problem Description
18.2 Reference Solution
This example is concerned with the buckling resistance of steel members. Lateral torsional bucklingoccurs in unrestrained, or inadequately restrained beams bent about the major axis and this causes thecompression flange to buckle and deflect sideways, thus inducing twisting of the section. The content ofthis problem is covered by the following parts of EN 1993-1-1:2005 [7]:
• Structural steel (Section 3.2 )
• Classification of cross-sections (Section 5.5)
• Buckling resistance of members (Section 6.3)
SOFiSTiK 2018 | VERiFiCATiON MANUAL - Design Code Benchmarks 111
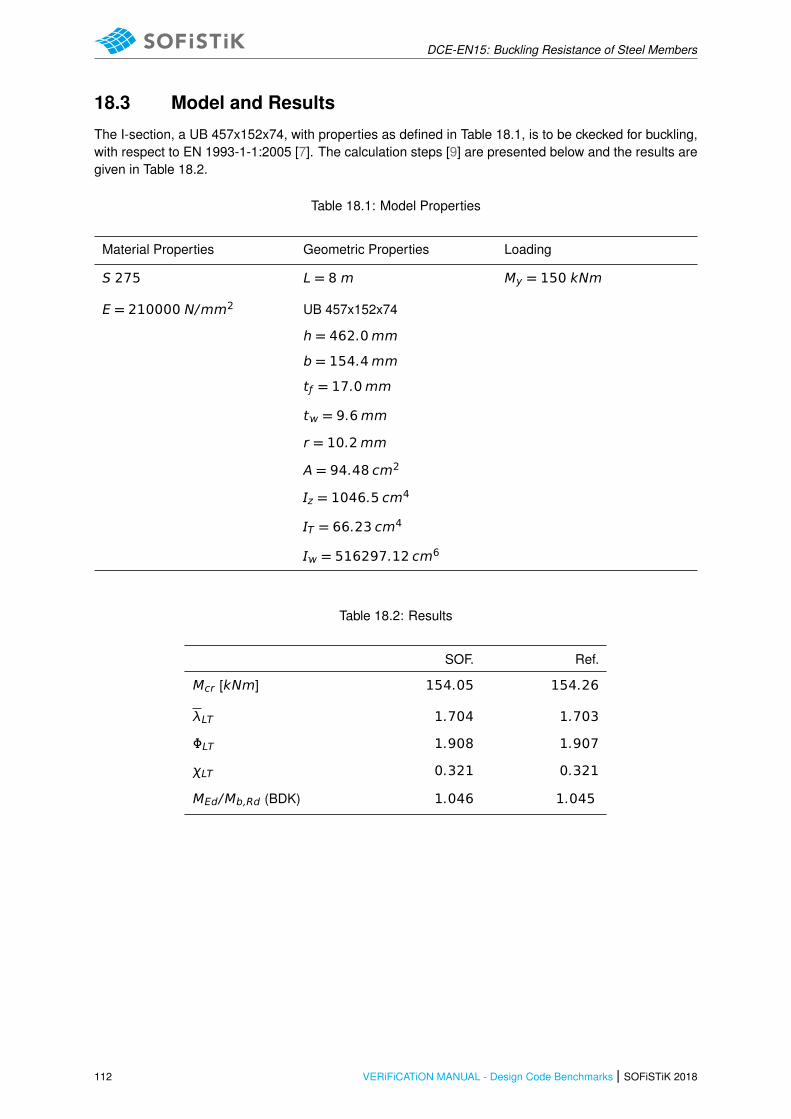
DCE-EN15: Buckling Resistance of Steel Members
18.3 Model and Results
The I-section, a UB 457x152x74, with properties as defined in Table 18.1, is to be ckecked for buckling,with respect to EN 1993-1-1:2005 [7]. The calculation steps [9] are presented below and the results aregiven in Table 18.2.
Table 18.1: Model Properties
Material Properties Geometric Properties Loading
S 275 L = 8 m My = 150 kNm
E = 210000 N/mm2 UB 457x152x74
h = 462.0mm
b = 154.4mm
tƒ = 17.0mm
t = 9.6mm
r = 10.2mm
A = 94.48 cm2
z = 1046.5 cm4
T = 66.23 cm4
= 516297.12 cm6
Table 18.2: Results
SOF. Ref.
Mcr [kNm] 154.05 154.26
λLT 1.704 1.703
LT 1.908 1.907
χLT 0.321 0.321
MEd/Mb,Rd (BDK) 1.046 1.045
112 VERiFiCATiON MANUAL - Design Code Benchmarks | SOFiSTiK 2018
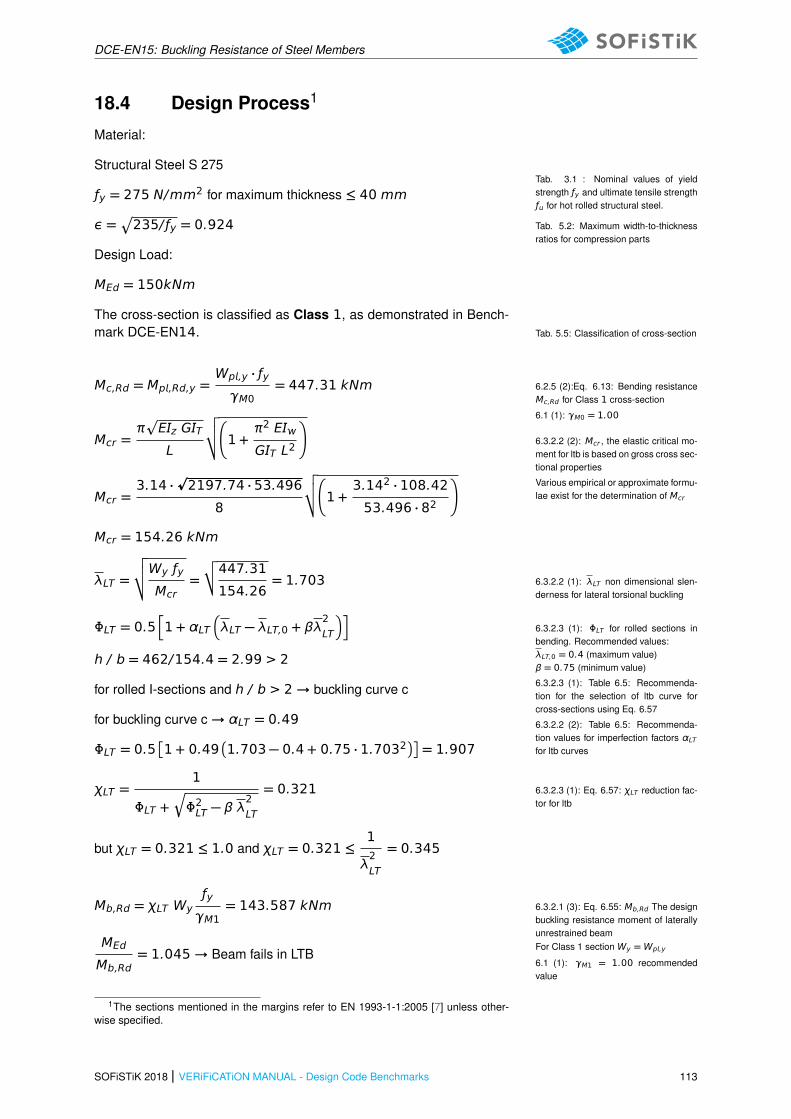
DCE-EN15: Buckling Resistance of Steel Members
18.4 Design Process1
Material:
Structural Steel S 275Tab. 3.1 : Nominal values of yieldstrength ƒy and ultimate tensile strengthƒ for hot rolled structural steel.
ƒy = 275 N/mm2 for maximum thickness ≤ 40 mm
ε =Æ
235/ ƒy = 0.924 Tab. 5.2: Maximum width-to-thicknessratios for compression parts
Design Load:
MEd = 150kNm
The cross-section is classified as Class 1, as demonstrated in Bench-mark DCE-EN14. Tab. 5.5: Classification of cross-section
Mc,Rd = Mp,Rd,y =Wp,y · ƒyγM0
= 447.31 kNm 6.2.5 (2):Eq. 6.13: Bending resistanceMc,Rd for Class 1 cross-section
6.1 (1): γM0 = 1.00
Mcr =πp
Ez GT
L
√
√
√
�
1 +π2 E
GT L2
�
6.3.2.2 (2): Mcr , the elastic critical mo-ment for ltb is based on gross cross sec-tional properties
Various empirical or approximate formu-lae exist for the determination of McrMcr =
3.14 ·p2197.74 · 53.496
8
√
√
√
�
1 +3.142 · 108.42
53.496 · 82
�
Mcr = 154.26 kNm
λLT =
√
√
√
Wy ƒy
Mcr=
√
√447.31
154.26= 1.703 6.3.2.2 (1): λLT non dimensional slen-
derness for lateral torsional buckling
LT = 0.5h
1 + αLT�
λLT − λLT,0 + βλ2LT
�i
6.3.2.3 (1): LT for rolled sections inbending. Recommended values:λLT,0 = 0.4 (maximum value)β = 0.75 (minimum value)
6.3.2.3 (1): Table 6.5: Recommenda-tion for the selection of ltb curve forcross-sections using Eq. 6.57
h / b = 462/154.4 = 2.99 > 2
for rolled I-sections and h / b > 2→ buckling curve c
for buckling curve c→ αLT = 0.49 6.3.2.2 (2): Table 6.5: Recommenda-tion values for imperfection factors αLTfor ltb curvesLT = 0.5
�
1 + 0.49�
1.703 − 0.4 + 0.75 · 1.7032��
= 1.907
χLT =1
LT +r
2LT − β λ2LT
= 0.321 6.3.2.3 (1): Eq. 6.57: χLT reduction fac-tor for ltb
but χLT = 0.321 ≤ 1.0 and χLT = 0.321 ≤1
λ2LT
= 0.345
Mb,Rd = χLT Wyƒy
γM1= 143.587 kNm 6.3.2.1 (3): Eq. 6.55: Mb,Rd The design
buckling resistance moment of laterallyunrestrained beamFor Class 1 section Wy =Wp,y
6.1 (1): γM1 = 1.00 recommendedvalue
MEd
Mb,Rd= 1.045→ Beam fails in LTB
1The sections mentioned in the margins refer to EN 1993-1-1:2005 [7] unless other-wise specified.
SOFiSTiK 2018 | VERiFiCATiON MANUAL - Design Code Benchmarks 113

DCE-EN15: Buckling Resistance of Steel Members
18.5 Conclusion
This example shows the ckeck for lateral torsional buckling of steel members. It has been shown thatthe results are reproduced with excellent accuracy.
18.6 Literature
[7] EN 1993-1-1: Eurocode 3: Design of concrete structures, Part 1-1: General rules and rules forbuildings. CEN. 2005.
[9] Structural Eurocodes - Extracts from the structural Eurocodes for students of structural design.BSI - British Standards Institution. 2007.
114 VERiFiCATiON MANUAL - Design Code Benchmarks | SOFiSTiK 2018
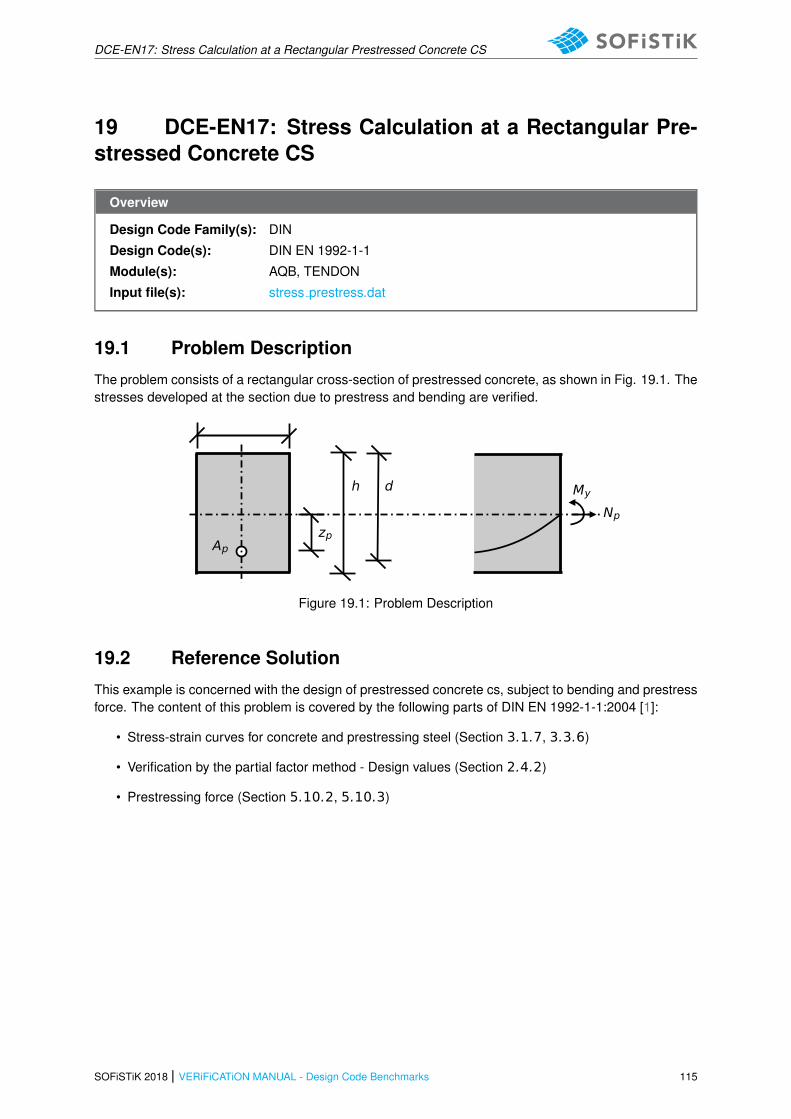
DCE-EN17: Stress Calculation at a Rectangular Prestressed Concrete CS
19 DCE-EN17: Stress Calculation at a Rectangular Pre-stressed Concrete CS
Overview
Design Code Family(s): DIN
Design Code(s): DIN EN 1992-1-1
Module(s): AQB, TENDON
Input file(s): stress prestress.dat
19.1 Problem Description
The problem consists of a rectangular cross-section of prestressed concrete, as shown in Fig. 19.1. Thestresses developed at the section due to prestress and bending are verified.
My
Np
Ap
h d
zp
Figure 19.1: Problem Description
19.2 Reference Solution
This example is concerned with the design of prestressed concrete cs, subject to bending and prestressforce. The content of this problem is covered by the following parts of DIN EN 1992-1-1:2004 [1]:
• Stress-strain curves for concrete and prestressing steel (Section 3.1.7, 3.3.6)
• Verification by the partial factor method - Design values (Section 2.4.2)
• Prestressing force (Section 5.10.2, 5.10.3)
SOFiSTiK 2018 | VERiFiCATiON MANUAL - Design Code Benchmarks 115
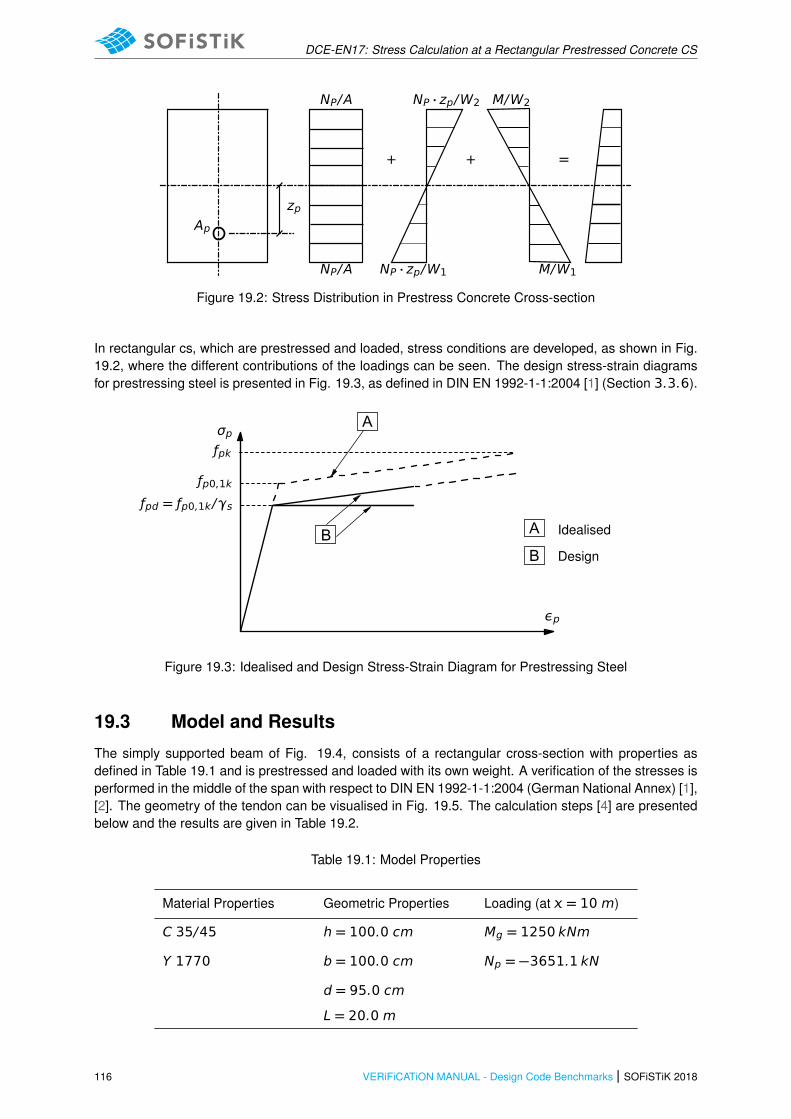
DCE-EN17: Stress Calculation at a Rectangular Prestressed Concrete CS
M/W2NP/A NP · zp/W2
+ + =
Ap
zp
M/W1NP/A NP · zp/W1
Figure 19.2: Stress Distribution in Prestress Concrete Cross-section
In rectangular cs, which are prestressed and loaded, stress conditions are developed, as shown in Fig.19.2, where the different contributions of the loadings can be seen. The design stress-strain diagramsfor prestressing steel is presented in Fig. 19.3, as defined in DIN EN 1992-1-1:2004 [1] (Section 3.3.6).
A
B A
B
Idealised
Design
ƒp0,1k
ƒpk
εp
ƒpd = ƒp0,1k/γs
σp
Figure 19.3: Idealised and Design Stress-Strain Diagram for Prestressing Steel
19.3 Model and Results
The simply supported beam of Fig. 19.4, consists of a rectangular cross-section with properties asdefined in Table 19.1 and is prestressed and loaded with its own weight. A verification of the stresses isperformed in the middle of the span with respect to DIN EN 1992-1-1:2004 (German National Annex) [1],[2]. The geometry of the tendon can be visualised in Fig. 19.5. The calculation steps [4] are presentedbelow and the results are given in Table 19.2.
Table 19.1: Model Properties
Material Properties Geometric Properties Loading (at = 10 m)
C 35/45 h = 100.0 cm Mg = 1250 kNm
Y 1770 b = 100.0 cm Np = −3651.1 kN
d = 95.0 cm
L = 20.0 m
116 VERiFiCATiON MANUAL - Design Code Benchmarks | SOFiSTiK 2018
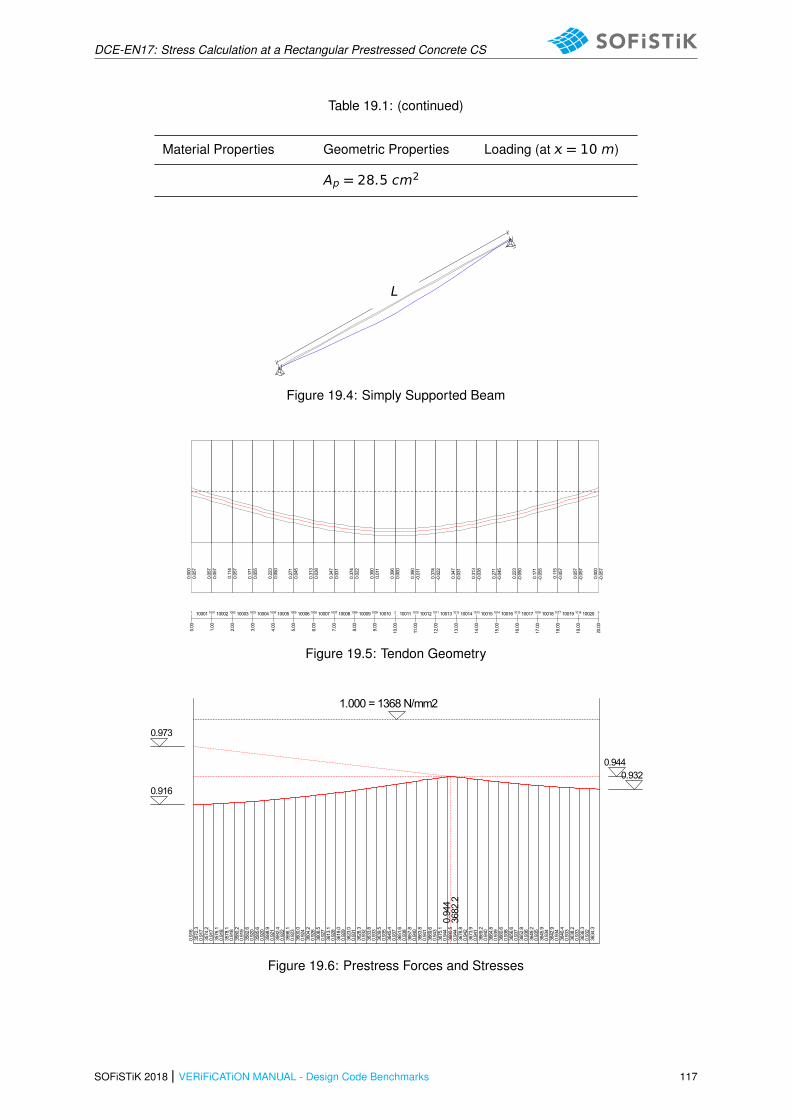
DCE-EN17: Stress Calculation at a Rectangular Prestressed Concrete CS
Table 19.1: (continued)
Material Properties Geometric Properties Loading (at = 10 m)
Ap = 28.5 cm2
L
Figure 19.4: Simply Supported Beam
1 10001
0.00
1001 10002
1.00
1002 10003
2.00
1003 10004
3.00
1004 10005
4.00
1005 10006
5.00
1006 10007
6.00
1007 10008
7.00
1008 10009
8.00
1009 10010
9.00
2 10011
10.00
1010 10012
11.00
1011 10013
12.00
1012 10014
13.00
1013 10015
14.00
1014 10016
15.00
1015 10017
16.00
1016 10018
17.00
1017 10019
18.00
1018 10020
19.00
3
20.00
0.000
0.057
0.057
0.057
0.114
0.057
0.171
0.055
0.223
0.050
0.271
0.045
0.313
0.038
0.347
0.031
0.374
0.022
0.390
0.011
0.396
0.000
0.390
-0.011
0.374
-0.022
0.347
-0.031
0.313
-0.038
0.271
-0.045
0.223
-0.050
0.171
-0.055
0.115
-0.057
0.057
-0.057
0.000
-0.057
Figure 19.5: Tendon Geometry
0.916
0.932
0.91
635
72.3
0.91
735
74.2
0.91
735
76.1
0.91
835
78.1
0.91
835
80.2
0.91
935
82.6
0.92
035
85.6
0.92
035
88.9
0.92
135
92.4
0.92
235
96.1
0.92
336
00.0
0.92
436
04.2
0.92
636
08.5
0.92
736
13.1
0.92
836
18.0
0.92
936
23.0
0.93
136
28.3
0.93
236
33.8
0.93
336
39.5
0.93
536
45.4
0.93
736
51.6
0.93
836
57.8
0.94
036
63.8
0.94
136
69.6
0.94
336
75.1
0.94
436
80.5
0.94
436
78.8
0.94
236
73.9
0.94
136
69.2
0.94
036
64.8
0.93
936
60.6
0.93
836
56.6
0.93
736
52.8
0.93
636
49.2
0.93
536
45.9
0.93
436
42.9
0.93
436
40.4
0.93
336
38.2
0.93
336
36.3
0.93
236
34.3
0.94
436
82.2
0.973
1.000 = 1368 N/mm2
0.944
Figure 19.6: Prestress Forces and Stresses
SOFiSTiK 2018 | VERiFiCATiON MANUAL - Design Code Benchmarks 117

DCE-EN17: Stress Calculation at a Rectangular Prestressed Concrete CS
Table 19.2: Results
Case CS Result SOF. Ref.
0 σc,b [MP] −12.47 −12.47
My [kNm] −1435.91 −1435.91
0 −4.82 −4.82
My [kNm] −185.91 −185.91
1 −11.76 −11.76
My [kNm] −1406.11 −1406.11
V 1 −4.51 −4.51
My [kNm] −156.11 −156.11
118 VERiFiCATiON MANUAL - Design Code Benchmarks | SOFiSTiK 2018

DCE-EN17: Stress Calculation at a Rectangular Prestressed Concrete CS
19.4 Design Process1
Design with respect to DIN EN 1992-1-1:2004 (NA) [1] [2]:2
Material:
Concrete: C 35/45 3.1: Concrete
Ecm = 34000 N/mm2 3.1.2: Tab. 3.1: Ecm for C 35/45
Prestressing Steel: Y 1770 3.3: Prestressing Steel
Ep = 195000 N/mm2 3.3.6 (3): Ep for wires
ƒpk = 1770 N/mm2 3.3.2, 3.3.3: ƒpk Characteristic tensilestrength of prestressing steel
ƒp0,1k = 1520 N/mm2
3.3.2, 3.3.3: ƒp0,1k 0.1% proof-stress ofprestressing steel, yield strength
Prestressing system: BBV L19 150 mm2
19 wires with area of 150mm2 each, giving a total of Ap = 28.5 cm2
Cross-section:
Ac = 1.0 · 1.0 = 1 m2
Diameter of duct ϕdct = 97 mm
Ratio αE,p = Ep / Ecm = 195000 / 34000 = 5.74
Ac,netto = Ac − π · (ϕdct/2)2 = 0.9926 m2
Ade = Ac + Ap · αE,p = 1.013 m2
The force applied to a tendon, i.e. the force at the active end duringtensioning, should not exceed the following value 5.10.2.1 (1)P: Prestressing force during
tensioning - Maximum stressing force
Pm = Ap · σp,m 5.10.2.1 (1)P: Eq. 5.41: Pm maximumstressing force
where σp,m =min�
0.80ƒpk; 0.90ƒp0,1k
(NDP) 5.10.2.1 (1)P: σp,m maximumstress applied to the tendon
Pm = Ap · 0.80 · ƒpk = 28.5 · 10−4 · 0.80 · 1770 = 4035.6 kN
Pm = Ap · 0.90 · ƒp0,1k = 28.5 · 10−4 · 0.90 · 1520 = 3898.8 kN
→ Pm = 3898.8 kN and σp,m = 1368 N/mm2
The value of the initial prestress force at time t = t0 applied to theconcrete immediately after tensioning and anchoring should not exceedthe following value 5.10.3 (2): Prestress force
Pm0() = Ap · σp,m0() 5.10.3 (2): Eq. 5.43: Pm0 initial pre-stress force at time t = t0
1The tools used in the design process are based on steel stress-strain diagrams, asdefined in [1] 3.3.6: Fig. 3.10, which can be seen in Fig 19.3.
2The sections mentioned in the margins refer to DIN EN 1992-1-1:2004 (German Na-tional Annex) [1], [2], unless otherwise specified.
SOFiSTiK 2018 | VERiFiCATiON MANUAL - Design Code Benchmarks 119

DCE-EN17: Stress Calculation at a Rectangular Prestressed Concrete CS
where σp,m0() =min�
0.75ƒpk; 0.85ƒp0,1k
(NDP) 5.10.3 (2): σp,m0() stress in thetendon immediately after tensioning ortransfer Pm0 = Ap · 0.75 · ƒpk = 28.5 · 10−4 · 0.75 · 1770 = 3783.4 kN
Pm0 = Ap · 0.85 · ƒp0,1k = 28.5 · 10−4 · 0.85 · 1520 = 3682.2 kN
→ Pm0 = 3682.2 kN and σp,m0 = 1292 N/mm2
Further calculations for the distribution of prestress forces and stressesalong the beam are not in the scope of this Benchmark and will notbe described here. The complete diagram can be seen in Fig. 19.5,after the consideration of losses at anchorage and due to friction, ascalculated by SOFiSTiK. There the values of σp,m = 1368 N/mm2
and Pm0 = 3682.2 kN can be visualised.
Load Actions:
Self weight per length: γ = 25 kN/m
→ g1 = γ · A = 25 · 1 = 25 kNm
Safety factors at ultimate limit stateDIN EN 1990/NA [10]: (NDP) A.1.3.1(4): Tab. NA.A.1.2 (B): Partial factorsfor actions(NDP) 2.4.2.2 (1): Partial factors for pre-stress
Actions (unfavourable) Safety factor at final state
• permanent γG = 1.35
• prestress γP = 1.00
Combination coefficients at serviceability limit state
g1 = 25 kNm: for rare, frequent and quasi-permanent combination(for stresses)
At = 10.0 m middle of the span:
Mg = g1 · L2 / 8 = 1250 kNm
Np = Pm0( = 10.0 m) = −3653.0 kN (from SOFiSTiK)
Calculation of stresses σc,b at = 10.0 m middle of the span:The concrete stresses may be deter-mined for each construction stage un-der the total quasi-permanent combina-tion σc {G + Pm0 + ψ2 ·Q}In this Benchmark no variable load Q isexamined
Position of the tendon: z = 0,3901 m
• Case : Prestress at construction stage section 0 (P cs0)
Mp
zp
Np
Pm0,=10
−σc
+σc
Np = −3653.0 kN
120 VERiFiCATiON MANUAL - Design Code Benchmarks | SOFiSTiK 2018

DCE-EN17: Stress Calculation at a Rectangular Prestressed Concrete CS
Mp1 = NP · z = −3653.0 · 0.3901 = −1425.04 kNmzs the new position of the center of thecross-section for cs0zp = z + zs
Mp2 = NP · zs = −3653.0 · 0.002978 = −10.879 kNm
Mp = −1425.04 − 10.879 = −1435.91 kNm = My Mp bending moment caused by pre-stressing
σc,b =Np
Ac,netto+
My
W1,cs0W1,cs0 cross-section moduli for con-truction stage 0 at the bottom left andright point
σc,b stress at the concrete at the bottomof the cross sectionσc,b =
−3653.0
0.9926+−1435.91
0.1633= −12.47 MP
• Case : Prestress and self-weight at con. stage sect. 0 (P+G cs0)
Mg + Mp
zp
Np
Pm0,=10
−σc
+σc
Np = −3653.0 kN and Mg = 1250 kNm
As computed above: Mp = −1435.91 kNm
My = 1250 − 1435.91 = −185.91 kNm
σc,b =−3653.0
0.9926+−185.91
0.1633= −4.82 MP
• Case : Prestress at con. stage sect. 1 (P cs1)
Np = −3653.0 kN and Mp1 = −1425.04 kNm (as above)
Mp2 = NP · zs = −3653.0 · (−0.00518) = 18.92 kNm
Mp = −1425.04 + 18.92 = −1406.11 kNm = My
σc,b =Np
Ade+
My
W1,cs1W1,cs1 cross-section moduli for con-truction stage 1
σc,b =−3653.0
1.013+−1406.11
0.172= −11.76 MP
• Case V: Prestress and self-weight at con. stage sect. 1 (P+G cs1)
Np = −3653.0 kN and Mg = 1250 kNm
As computed above: Mp = −1406.11 kNm
My = 1250 − 1406.11 = −156.11 kNm
σc,b =−3653.0
1.013+−156.11
0.172= −4.51 MP
SOFiSTiK 2018 | VERiFiCATiON MANUAL - Design Code Benchmarks 121

DCE-EN17: Stress Calculation at a Rectangular Prestressed Concrete CS
19.5 Conclusion
This example shows the calculation of the stresses, developed in the concrete cross-section due toprestress and bending. It has been shown that the results are reproduced with excellent accuracy.
19.6 Literature
[1] DIN EN 1992-1-1/NA: Eurocode 2: Design of concrete structures, Part 1-1/NA: General rules andrules for buildings - German version EN 1992-1-1:2005 (D), Nationaler Anhang Deutschland -Stand Februar 2010. CEN. 2010.
[2] F. Fingerloos, J. Hegger, and K. Zilch. DIN EN 1992-1-1 Bemessung und Konstruktion vonStahlbeton- und Spannbetontragwerken - Teil 1-1: Allgemeine Bemessungsregeln und Regelnfur den Hochbau. BVPI, DBV, ISB, VBI. Ernst & Sohn, Beuth, 2012.
[4] Beispiele zur Bemessung nach Eurocode 2 - Band 1: Hochbau. Ernst & Sohn. Deutschen Beton-und Bautechnik-Verein E.V. 2011.
[10] DIN EN 1990/NA: Eurocode: Basis of structural design, Nationaler Anhang Deutschland DIN EN1990/NA:2010-12. CEN. 2010.
122 VERiFiCATiON MANUAL - Design Code Benchmarks | SOFiSTiK 2018

DCE-EN18: Creep and Shrinkage Calculation of a Rectangular PrestressedConcrete CS
20 DCE-EN18: Creep and Shrinkage Calculation of aRectangular Prestressed Concrete CS
Overview
Design Code Family(s): DIN
Design Code(s): DIN EN 1992-1-1
Module(s): AQB, CSM
Input file(s): creep shrinkage.dat
20.1 Problem Description
The problem consists of a simply supported beam with a rectangular cross-section of prestressed con-crete, as shown in Fig. 20.1. The time dependent losses are calculated, considering the reduction ofstress caused by the deformation of concrete due to creep and shrinkage, under the permanent loads.
My
Np
Ap
h
zp
Figure 20.1: Problem Description
20.2 Reference Solution
This example is concerned with the calculation of creep and shrinkage on a prestressed concrete cs,subject to bending and prestress force. The content of this problem is covered by the following parts ofDIN EN 1992-1-1:2004 [1]:
• Creep and Shrinkage (Section 3.1.4)
• Annex B: Creep and Shrinkage (Section B.1, B.2)
• Time dependent losses of prestress for pre- and post-tensioning (Section 5.10.6)
The time dependant losses may be calculated by considering the following two reductions of stress [1]:
• due to the reduction of strain, caused by the deformation of concrete due to creep and shrinkage,under the permanent loads
• the reduction of stress in the steel due to the relaxation under tension.
In this Benchmark the stress loss due to creep and shrinkage will be examined.
SOFiSTiK 2018 | VERiFiCATiON MANUAL - Design Code Benchmarks 123
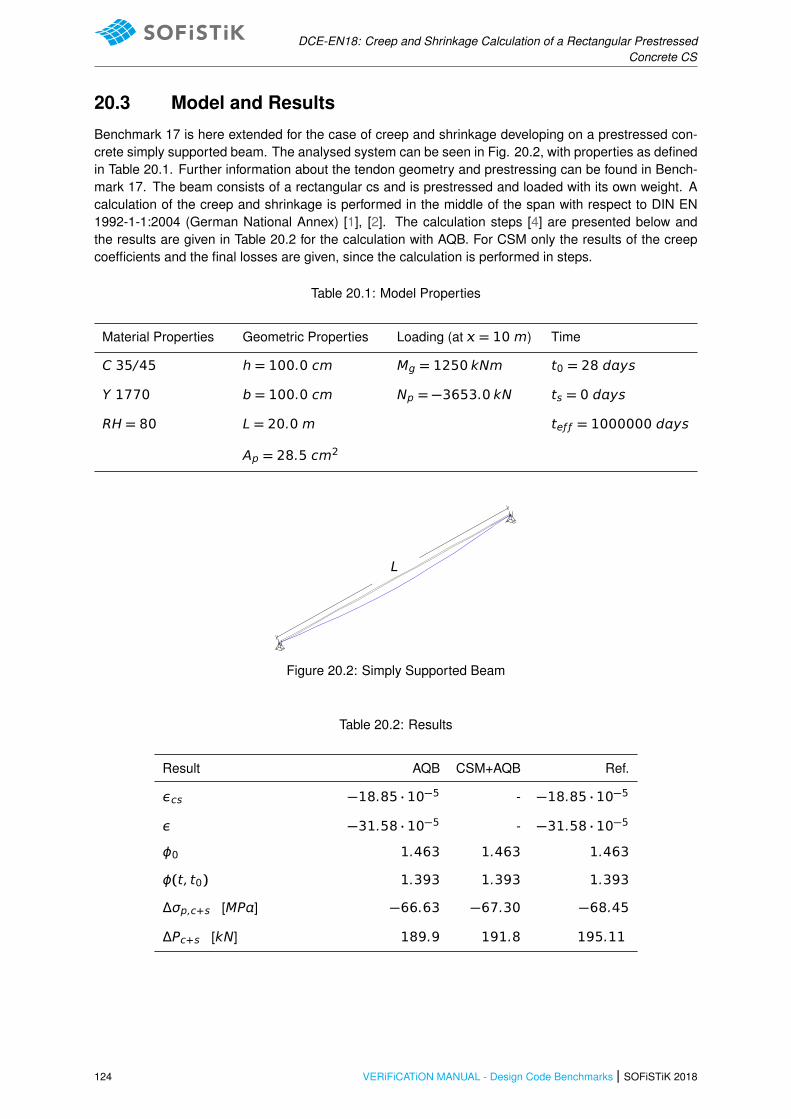
DCE-EN18: Creep and Shrinkage Calculation of a Rectangular PrestressedConcrete CS
20.3 Model and Results
Benchmark 17 is here extended for the case of creep and shrinkage developing on a prestressed con-crete simply supported beam. The analysed system can be seen in Fig. 20.2, with properties as definedin Table 20.1. Further information about the tendon geometry and prestressing can be found in Bench-mark 17. The beam consists of a rectangular cs and is prestressed and loaded with its own weight. Acalculation of the creep and shrinkage is performed in the middle of the span with respect to DIN EN1992-1-1:2004 (German National Annex) [1], [2]. The calculation steps [4] are presented below andthe results are given in Table 20.2 for the calculation with AQB. For CSM only the results of the creepcoefficients and the final losses are given, since the calculation is performed in steps.
Table 20.1: Model Properties
Material Properties Geometric Properties Loading (at = 10 m) Time
C 35/45 h = 100.0 cm Mg = 1250 kNm t0 = 28 dys
Y 1770 b = 100.0 cm Np = −3653.0 kN ts = 0 dys
RH = 80 L = 20.0 m teƒ ƒ = 1000000 dys
Ap = 28.5 cm2
L
Figure 20.2: Simply Supported Beam
Table 20.2: Results
Result AQB CSM+AQB Ref.
εcs −18.85 · 10−5 - −18.85 · 10−5
ε −31.58 · 10−5 - −31.58 · 10−5
ϕ0 1.463 1.463 1.463
ϕ(t, t0) 1.393 1.393 1.393
Δσp,c+s [MP] −66.63 −67.30 −68.45
ΔPc+s [kN] 189.9 191.8 195.11
124 VERiFiCATiON MANUAL - Design Code Benchmarks | SOFiSTiK 2018

DCE-EN18: Creep and Shrinkage Calculation of a Rectangular PrestressedConcrete CS
20.4 Design Process1
Design with respect to DIN EN 1992-1-1:2004 (NA) [1] [2]:2
Material:
Concrete: C 35/45 3.1: Concrete
Ecm = 34077 N/mm2 3.1.2: Tab. 3.1: Ecm, ƒck and ƒcm forC 35/45
ƒck = 35 N/mm2
ƒcm = 43 N/mm2
Prestressing Steel: Y 1770 3.3: Prestressing Steel
Ep = 195000 N/mm2 3.3.6 (3): Ep for wires
ƒpk = 1770 N/mm2 3.3.2, 3.3.3: ƒpk Characteristic tensilestrength of prestressing steel
Prestressing system: BBV L19 150 mm2
19 wires with area of 150mm2 each, giving a total of Ap = 28.5 cm2
Cross-section:
Ac = 1.0 · 1.0 = 1 m2
Diameter of duct ϕdct = 97 mm
Ratio αE,p = Ep / Ecm = 195000 / 34077 = 5.7223
Ac,netto = Ac − π · (ϕdct/2)2 = 0.9926 m2
Ade = Ac + Ap · αE,p = 1.013 m2
Load Actions:
Self weight per length: γ = 25 kN/m
At = 10.0 m middle of the span:
Mg = g1 · L2 / 8 = 1250 kNm
Np = Pm0( = 10.0 m) = −3653.0 kN (from SOFiSTiK)
Calculation of stresses at = 10.0 m midspan:
Position of the tendon: zcp = 0,3901 m
Prestress and self-weight at con. stage sect. 0 (P+G cs0)
Np = −3653.0 kN and Mg = 1250 kNm1The tools used in the design process are based on steel stress-strain diagrams, as
defined in [1] 3.3.6: Fig. 3.102The sections mentioned in the margins refer to DIN EN 1992-1-1:2004 (German Na-
tional Annex) [1], [2], unless otherwise specified.
SOFiSTiK 2018 | VERiFiCATiON MANUAL - Design Code Benchmarks 125
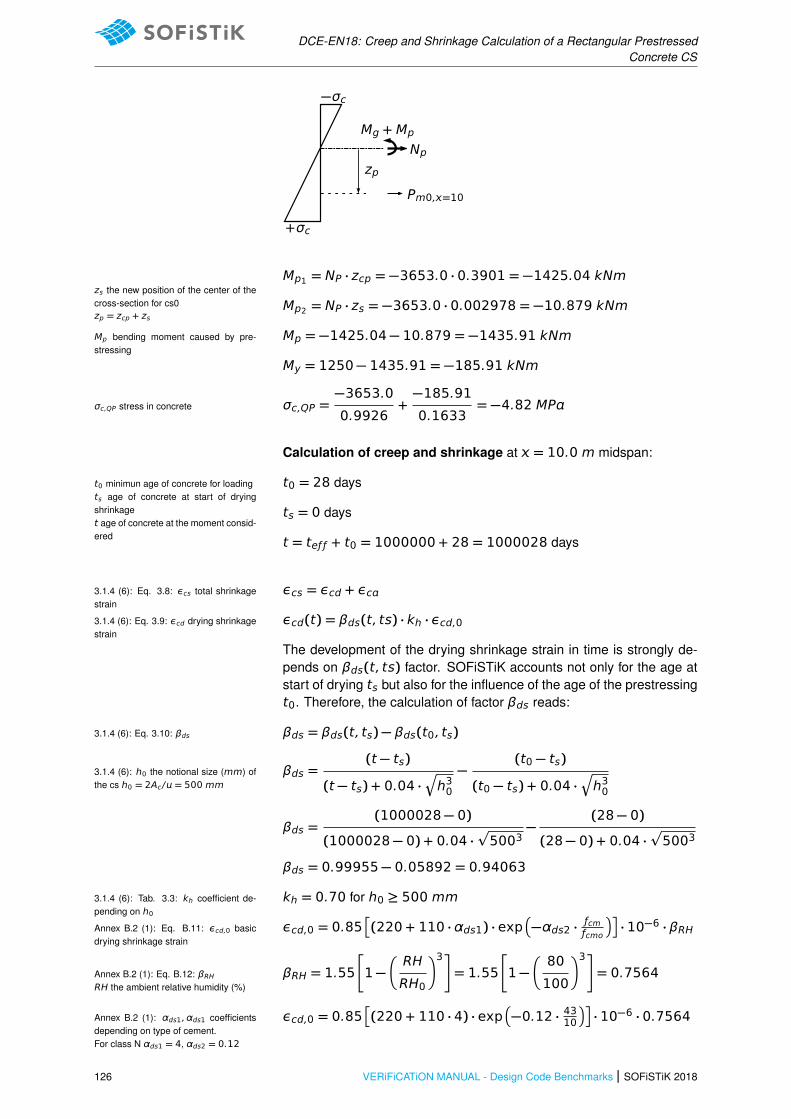
DCE-EN18: Creep and Shrinkage Calculation of a Rectangular PrestressedConcrete CS
Mg + Mp
zp
Np
Pm0,=10
−σc
+σc
Mp1 = NP · zcp = −3653.0 · 0.3901 = −1425.04 kNmzs the new position of the center of thecross-section for cs0zp = zcp + zs
Mp2 = NP · zs = −3653.0 · 0.002978 = −10.879 kNm
Mp = −1425.04 − 10.879 = −1435.91 kNmMp bending moment caused by pre-stressing
My = 1250 − 1435.91 = −185.91 kNm
σc,QP =−3653.0
0.9926+−185.91
0.1633= −4.82 MPσc,QP stress in concrete
Calculation of creep and shrinkage at = 10.0 m midspan:
t0 = 28 dayst0 minimun age of concrete for loadingts age of concrete at start of dryingshrinkaget age of concrete at the moment consid-ered
ts = 0 days
t = teƒ ƒ + t0 = 1000000 + 28 = 1000028 days
εcs = εcd + εc3.1.4 (6): Eq. 3.8: εcs total shrinkagestrain
εcd(t) = βds(t, ts) · kh · εcd,03.1.4 (6): Eq. 3.9: εcd drying shrinkagestrain
The development of the drying shrinkage strain in time is strongly de-pends on βds(t, ts) factor. SOFiSTiK accounts not only for the age atstart of drying ts but also for the influence of the age of the prestressingt0. Therefore, the calculation of factor βds reads:
βds = βds(t, ts) − βds(t0, ts)3.1.4 (6): Eq. 3.10: βds
βds =(t − ts)
(t − ts) + 0.04 ·Ç
h30
−(t0 − ts)
(t0 − ts) + 0.04 ·Ç
h30
3.1.4 (6): h0 the notional size (mm) ofthe cs h0 = 2Ac/ = 500 mm
βds =(1000028 − 0)
(1000028 − 0) + 0.04 ·p
5003−
(28 − 0)
(28 − 0) + 0.04 ·p
5003
βds = 0.99955 − 0.05892 = 0.94063
kh = 0.70 for h0 ≥ 500 mm3.1.4 (6): Tab. 3.3: kh coefficient de-pending on h0
εcd,0 = 0.85�
(220 + 110 · αds1) · exp�
−αds2 ·ƒcmƒcmo
��
· 10−6 · βRHAnnex B.2 (1): Eq. B.11: εcd,0 basicdrying shrinkage strain
βRH = 1.55
�
1 −�
RH
RH0
�3�
= 1.55
�
1 −�
80
100
�3�
= 0.7564Annex B.2 (1): Eq. B.12: βRHRH the ambient relative humidity (%)
εcd,0 = 0.85�
(220 + 110 · 4) · exp�
−0.12 · 4310��
· 10−6 · 0.7564Annex B.2 (1): αds1, αds1 coefficientsdepending on type of cement.For class N αds1 = 4, αds2 = 0.12
126 VERiFiCATiON MANUAL - Design Code Benchmarks | SOFiSTiK 2018

DCE-EN18: Creep and Shrinkage Calculation of a Rectangular PrestressedConcrete CS
εcd,0 = 2.533 · 10−4
εcd = 0.94063 · 0.70 · 2.533 · 10−4 = 0.0001668
εcd = 1.668 · 10−4 = 0.1668 ◦/◦◦
εc(t) = βs(t) · εc(∞) 3.1.4 (6): Eq. 3.11: εc autogenousshrinkage strain
εc(∞) = 2.5 (ƒck − 10) · 10−6 = 2.5 (35 − 10) · 10−6 3.1.4 (6): Eq. 3.12: εc(∞)
εc(∞) = 6.25 · 10−5 = 0.0625 ◦/◦◦
Proportionally to βds(t, ts), SOFiSTiK calculates factor βs as follows:
βs = βs(t) − βs(t0) 3.1.4 (6): Eq. 3.13: βs
βs = 1 − e−0.2·pt −
�
1 − e−0.2·pt0�
= e−0.2·pt0 − e−0.2·
pt
βs = 0.347
ε = εcd,0 + εc(∞) = 2.533 · 10−4 + 6.25 · 10−5
ε = −31.58 · 10−5 ε absolute shrinkage strainnegative sign to declare losses
εc = 0.347 · 6.25 · 10−5 = 2.169 · 10−5 = 0.02169 ◦/◦◦
εcs = 1.668 · 10−4 + 2.169 · 10−5 = −18.85 · 10−5 negative sign to declare losses
ϕ(t, t0) = ϕ0 · βc(t, t0) Annex B.1 (1): Eq. B.1: ϕ(t, t0) creepcoefficient
ϕ0 = ϕRH · β(ƒcm) · β(t0) Annex B.1 (1): Eq. B.2: ϕ0 notionalcreep coefficient
ϕRH =�
1 +1 − RH/100
0.1 · 3p
h0· α1
�
· α2 Annex B.1 (1): Eq. B.3: ϕRH factor foreffect of relative humidity on creep
β(ƒcm) =16.8p
ƒcm= 16.8/
p43 = 2.562 Annex B.1 (1): Eq. B.4: β(ƒcm) factor
for effect of concrete strength on creep
α1 =�
35
ƒcm
�0.7
≤ 1 = 0.8658 Annex B.1 (1): Eq. B.8c: α1, α2, α3coefficients to consider influence of con-crete strength
α2 =�
35
ƒcm
�0.2
≤ 1 = 0.9597
α3 =�
35
ƒcm
�0.5
≤ 1 = 0.9022
ϕRH =�
1 +1 − 80/100
0.1 · 3p500
· 0.8658�
· 0.9597 = 1.1691
β(t0) =1
�
0.1 + t0.200
� Annex B.1 (1): Eq. B.5: β(t0) factorfor effect of concrete age at loading oncreep
t0 = t0,T ·
9
2 + t1.20,T+ 1
!α
≥ 0.5 Annex B.1 (2): Eq. B.9: t0,T tempera-ture adjusted age of concrete at loadingadjusted according to expression B.10
SOFiSTiK 2018 | VERiFiCATiON MANUAL - Design Code Benchmarks 127
DCE-EN18: Creep and Shrinkage Calculation of a Rectangular PrestressedConcrete CS
tT =∑n=1 e
−(4000/[273+T(Δt)]−13.65) · ΔtAnnex B.1 (3): Eq. B.10: tT temper-ature adjusted concrete age which re-places t in the corresponding equations t0,T = 28 · e−(4000/[273+20]−13.65) = 28 · 1.0 = 28.0
⇒ t0 = 28.0 ·�
9
2 + 28.01.2+ 1
�0
= 28.0Annex B.1 (2): Eq. B.9: α a powerwhich depends on type of cementFor class N α = 0
β(t0) =1
�
0.1 + 28.00.20� = 0.48844
βc(t, t0) =�
(t − t0)
(βH + t − t0)
�0.3
Annex B.1 (1): Eq. B.7: βc(t, t0) co-efficient to describe the development ofcreep with time after loading
βH = 1.5 ·�
1 + (0.012 · RH)18�
· h0 + 250 · α3 ≤ 1500 · α3Annex B.1 (1): Eq. B.8: βH coefficientdepending on relative humidity and no-tional member size βH = 1.5 ·
�
1 + (0.012 · 80)18�
· 500 + 250 · 0.9022
βH = 1335.25 ≤ 1500 · 0.9022 = 1353.30
⇒ βc(t, t0) = 0.9996
ϕ0 = 1.1691 · 2.562 · 0.48844 = 1.463
ϕ(t, t0) = 1.463 · 0.9996/1.05 = 1.393Annex B.1 (3): The values of ϕ(t, t0)given above should be associated withthe tangent modulus Ec3.1.4 (2): The values of the creep coef-ficient, ϕ(t, t0) is related to Ec, the tan-gent modulus, which may be taken as1.05 · Ecm
According to EN, the creep value is related to the tangent Young’smodulus Ec, where Ec being defined as 1.05 · Ecm. To account forthis, SOFiSTiK adopts this scaling for the computed creep coefficient(in SOFiSTiK, all computations are consistently based on Ecm).
ΔPc+s+r = Ap·Δσp,c+s+r = Apεcs · Ep + 0.8Δσpr +
Ep
Ecmϕ(t, t0) · σc,QP
1 +Ep
Ecm
Ap
Ac
�
1 +Ac
cz2cp
�
[1 + 0.8ϕ(t, t0)]5.10.6 (2): Eq. 5.46: ΔPc+s+r time de-pendent losses of prestress
In this example only the losses due to creep and shrinkage are takeninto account, the reduction of stress due to relaxation (Δσpr) is ignored.
Δσp,c+s =−0.1885 · 10−3 · 195000 + 5.7223 · 1.393 · (−4.82)
1 + 5.722328.5 · 10−4
0.9926
�
1 +0.9926
0.082140.39012
�
[1 + 0.8 · 1.393]Δσp,c+s variation of stress in tendonsdue to creep and shrinkage at location, at time t Δσp,c+s = −68.46 MP
ΔPc+s = Ap · Δσp,c+s = 28.5 · 10−4 · 68.46 · 103 = 195.11 kN
128 VERiFiCATiON MANUAL - Design Code Benchmarks | SOFiSTiK 2018

DCE-EN18: Creep and Shrinkage Calculation of a Rectangular PrestressedConcrete CS
20.5 Conclusion
This example shows the calculation of the time dependent losses due to creep and shrinkage. It hasbeen shown that the results are in very good agreement with the reference solution.
20.6 Literature
[1] DIN EN 1992-1-1/NA: Eurocode 2: Design of concrete structures, Part 1-1/NA: General rules andrules for buildings - German version EN 1992-1-1:2005 (D), Nationaler Anhang Deutschland -Stand Februar 2010. CEN. 2010.
[2] F. Fingerloos, J. Hegger, and K. Zilch. DIN EN 1992-1-1 Bemessung und Konstruktion vonStahlbeton- und Spannbetontragwerken - Teil 1-1: Allgemeine Bemessungsregeln und Regelnfur den Hochbau. BVPI, DBV, ISB, VBI. Ernst & Sohn, Beuth, 2012.
[4] Beispiele zur Bemessung nach Eurocode 2 - Band 1: Hochbau. Ernst & Sohn. Deutschen Beton-und Bautechnik-Verein E.V. 2011.
SOFiSTiK 2018 | VERiFiCATiON MANUAL - Design Code Benchmarks 129

DCE-EN18: Creep and Shrinkage Calculation of a Rectangular PrestressedConcrete CS
130 VERiFiCATiON MANUAL - Design Code Benchmarks | SOFiSTiK 2018
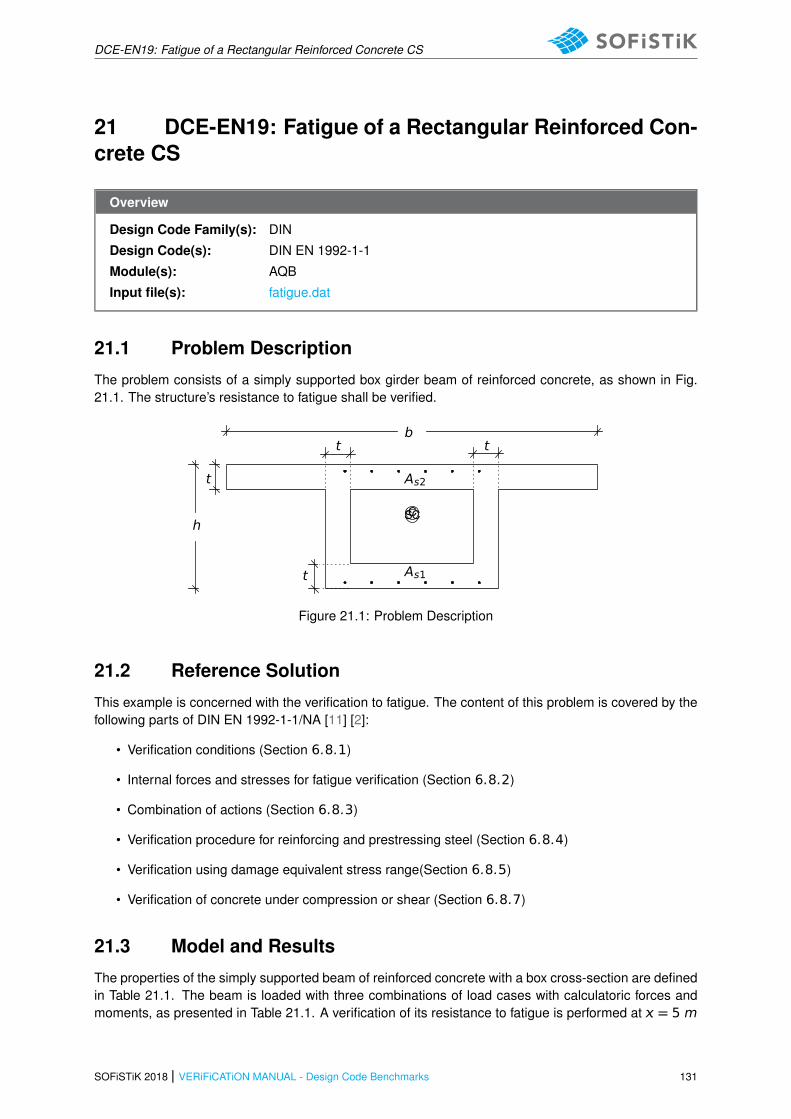
DCE-EN19: Fatigue of a Rectangular Reinforced Concrete CS
21 DCE-EN19: Fatigue of a Rectangular Reinforced Con-crete CS
Overview
Design Code Family(s): DIN
Design Code(s): DIN EN 1992-1-1
Module(s): AQB
Input file(s): fatigue.dat
21.1 Problem Description
The problem consists of a simply supported box girder beam of reinforced concrete, as shown in Fig.21.1. The structure’s resistance to fatigue shall be verified.
CSC
As1
As2
b
h
t
t
t t
Figure 21.1: Problem Description
21.2 Reference Solution
This example is concerned with the verification to fatigue. The content of this problem is covered by thefollowing parts of DIN EN 1992-1-1/NA [11] [2]:
• Verification conditions (Section 6.8.1)
• Internal forces and stresses for fatigue verification (Section 6.8.2)
• Combination of actions (Section 6.8.3)
• Verification procedure for reinforcing and prestressing steel (Section 6.8.4)
• Verification using damage equivalent stress range(Section 6.8.5)
• Verification of concrete under compression or shear (Section 6.8.7)
21.3 Model and Results
The properties of the simply supported beam of reinforced concrete with a box cross-section are definedin Table 21.1. The beam is loaded with three combinations of load cases with calculatoric forces andmoments, as presented in Table 21.1. A verification of its resistance to fatigue is performed at = 5 m
SOFiSTiK 2018 | VERiFiCATiON MANUAL - Design Code Benchmarks 131

DCE-EN19: Fatigue of a Rectangular Reinforced Concrete CS
with respect to DIN EN 1992-1-1/NA [11] [2]. The results are given in Table 21.2.
Table 21.1: Model Properties
Material Geometry Loading (at = 5 m)
C 35/45 h = 200.0 cm LC 911:
S 500 b = 600.0 cm Vz = 610 kN, My = 4575 kNm, Mt = −0.19 kNm
t = 400.0 cm LC 912:
L = 20.0 m Vz = 660 kN, My = 4950 kNm, Mt = −50.20 kNm
As1 = 60 cm2 LC 913:
As2 = 60 cm2 Vz = 710 kN, My = 5325 kNm, Mt = 99.78 kNm
Table 21.2: Results
Result SOF (FEM). Ref.
Δσs,eq(N∗) [MP] 71.74 76.98
ƒcd,ƒt [MP] 17.06 17.0567
σcd,m,eq′TOP′ [MP] ≤ 14.33 ≤ 14.33
σcd,m,eqsher ct [MP] ≤ 10.42 ≤ 10.34
ΔσRsk (N∗)
γs,ƒt[MP] 152.17 152.2
132 VERiFiCATiON MANUAL - Design Code Benchmarks | SOFiSTiK 2018

DCE-EN19: Fatigue of a Rectangular Reinforced Concrete CS
21.4 Design Process1
Design with respect to DIN EN 1992-1-1/NA [11] [2]:2
STEP 1: Material
Concrete: C 35/45 3.1: Concrete
ƒck = 35 N/mm2 Tab. 3.1: Strength for concrete
γc = 1.50 (NDP) 2.4.2.4: (1), Tab. 2.1DE: Partialfactors for materials
ƒcd = cc · ƒck/γc = 0.85 · 35/1.5 = 19.83 MP 3.1.6: (1)P, Eq. (3.15): cc = 0.85 con-sidering long term effects
STEP 2: Cross-section
1/WVz = 0.8177 1/m2 1/WV : Shear force resistance, calcu-lated by using BEM
1/WVy = 0.371 1/m2 1/WT : Torsional resistance, calculatedby using BEM
1/WT = 0.3448 1/m3
Minimun reinforcements:
As1 = As2 = 6 · 10 = 60 cm2 As: Longitudinal
As: Shear links
As = 8.22 cm2/m
STEP 3: Load Actions:
Permanent: Loadcase 1
Variable: Loadcase 2, 3
For the determination of the combination calculatoric forces and mo-ments the following superposition types are chosen: 6.8.3: (2)P: Fatigue
The basic combination of the non-cyclicload is similar to the definition of the fre-quent combination for serviceability:∑
j≥1 Gk,j′′+′′ P ′′+′′ ψ1,1Qk,1
′′+′′′′ +′′
∑
>1 ψ2,Qk,
• Quasi permanent combination for serviceability - MAXP
• Frequent combination for serviceability - MAXF
The following combination of actions scenario is investigated for ser-viceability:
• LC 911 GMAXP + MY : 1.00 * G
• LC 912 G+2MAXF + MY : 1.00 * G + ψ1 * LC 2
• LC 913 G+3MAXF + MY : 1.00 * G + ψ1 * LC 3
1The tools used in the design process are based on steel stress-strain diagrams, asdefined in [2] 3.3.6: Fig. 3.10
2The sections mentioned in the margins refer to DIN EN 1992-1-1/NA [11], [2], unlessotherwise specified.
SOFiSTiK 2018 | VERiFiCATiON MANUAL - Design Code Benchmarks 133
DCE-EN19: Fatigue of a Rectangular Reinforced Concrete CS
Combination calculatoric forces and moments at = 5.0 m:
LC Vy [kN] Vz [kN] My [kNm] Mt [kNm]
911 0 610 4575 −0.189
912 0 660 4950 −50.20
913 0 710 5325 99.78
STEP 4: Calculation of stresses at = 5.0 m :
The resistance of structures to fatigue shall be verified in special cases.6.8.1 (1)P: Verification conditions
This verification shall be performed separately from concrete and steel.
The following calculation corresponds to LC 911.
τQ = 1/WVy ·Qy + 1/WVz ·QzτQ: shear stresses resulting from shearforce
where Qy and Qz are calculated through a proportionate factor ƒV , de-pending on the lever arm of internal forces and the elastic part of Vyand Vz.
Qy = ƒV · Vy = 0.8576 · 0.0 = 0.0 kN
Qz = ƒV · Vz = 0.8576 · 610 = 523.149 kN
τQ = 0.371 · 0.0 + 0.8177 · 523.149 = 427.770 · 10−3 MP
τT = −1/WT ·Mt = −0.34484 · 0.189 = 0.065 · 10−3 MPτT : shear stresses resulting from tor-sion
τ = τQ+τT = 427.770·10−3+0.065·10−3 = 427.835·10−3 MP
τ =�
τQ + τT�
·�
1.0 + cot2 θ�
τ , σ : principal stresses
σ =τ
cotθ + cotαθ: angle of compression strutsα: angle of shear reinforcementα = 90o ⇒ sinα = 1.0, cotα = 0.0
6.8.2(3): In the design of shear rein-forcement the inclination of the com-pressive struts θƒt may be calculatedby Eq. 6.65
A rather nasty problem is the evaluation of the shear. The DIN designcode allows a simple solution based on a corrected value for the incli-nation of the compressive struts:
tnθƒt =ptnθ
6.8.2(3): Eq. 6.65: tnθƒt
Unfortunately it is nearly impossible to keep this value from the sheardesign for all individual shear cuts or transform it to different load com-binations and reinforcement distributions for the fatigue stress check.AQB uses instead a fixed value of 4/7 for the tangents. The user mayoverwrite this value however with any desired value.
tnθ = 4/7⇒ cotθ = 7/4 = 1.75
tnθƒt =p
4/7 = 0.756
cotθƒt =p
7/4 = 1.3229
134 VERiFiCATiON MANUAL - Design Code Benchmarks | SOFiSTiK 2018

DCE-EN19: Fatigue of a Rectangular Reinforced Concrete CS
τ = (427.770 · 10−3 + 0.065 · 10−3) · (1.0 + 1.752)
τ = 1740.048 · 10−3 MP
σ =1740.048 · 10−3
1.75 + 0.0= 994.313 · 10−3 MP
σs =ƒQ · τQ
(cotθƒt + cotα) · sinα+
ƒT · τTcotθƒt
σs: steel stresses
ƒT =B0 · ƒrAs/ct
, and ƒQ =Bb · ƒrAs/ct
As/ct = As / 2 = 4.11 cm2/m
where ƒT and ƒQ are factors expressing the shear links reinforcementratios. They are depending on ƒr , a factor for total reinforcement, B0,the width of the cut and Bb, the total width of the cut. Since in this caseit is a box cross-section and taking into account the position of the cut,we get that B0 = Bb = 0.4 m.
B0
Figure 21.2: Cross-section Overview
ƒT =0.4 · 1.0
4.11 · 10−4= 973.532 and ƒQ =
0.4 · 1.0
4.11 · 10−4= 973.532
σs =973.532 · 427.770 · 10−3
(1.3229 + 0.0) · 1.0+973.532 · 0.065 · 10−3
1.3229
σs = 314.882 MP
Accordingly, we calculate the stresses for the rest of the loadcases. Foreach loadcase the stresses are calculated for two cases, for τT and for−τT , in order to determine the most unfavorable case. The results arepresented in Table 21.4
Table 21.4: Calculation of Stresses by using BEM
LC Qz τQ τT · 10-3 τ τ σ σs
[kN] [MP] [MP] [MP] [MP] [MP] [MP]
911 523.14 0.428 0.065 0.427 1.740 0.993 314.88
-0.065 0.427 1.739 0.993 314.78
912 566.03 0.463 17.31 0.480 1.952 1.115 353.38
-17.31 0.4455 1.8120 1.0346 327.90
SOFiSTiK 2018 | VERiFiCATiON MANUAL - Design Code Benchmarks 135

DCE-EN19: Fatigue of a Rectangular Reinforced Concrete CS
Table 21.4: (continued)
LC Qz τQ τT · 10-3 τ τ σ σs
[kN] [MP] [MP] [MP] [MP] [MP] [MP]
913 608.911 0.498 -34.41 0.4635 1.8851 1.0764 341.12
34.41 0.5323 2.1649 1.2362 391.7
From the table, the minimum and maximum value of the steel stress isdetermined:
• Max. σs = 391.77 MP
• Min. σs = 314.79 MP
As the exact fatigue stress check is not available, the simplified methodsaccording to DIN EN 1992-1-1/NA (Sect. 6.8, Fatigue) are selected viathe coefficients λs, λt, λ, λc.λ: Coeff. equiv. stress range shear
links, here input as 1.0
The admissible sways of the damage equivalent stress range for theshear links are obtained, as follows:6.8.2 (2): Eq. 6.64: η factor for effect of
different bond behaviour
η =As + Ap
As + ApÆ
ξ · ϕs/ϕp, since Ap = 0
(no prestress) ⇒ η = 1.0, thus no in-crease of calculated stress range in thereinforcing steel
Δσs,eq(N∗) = λ · (σs,m − σs,mn) = 1.0 · (391.77 − 314.79)
Δσs,eq(N∗) = 76.98 MP
For reinforcing steel adequate fatigue resistance should be assumed, ifthe following is satisfied:6.8.5 (3): Eq. 6.71: Verification using
damage equivalent stress range(NDP) 6.8.4 (6): Table 6.3DE: Param-eters for fatigue strength curves for re-inforcing steel ΔσRsk (N
∗) = 175 forstraight/bent bars and N∗ = 106 cycles
γF,ƒt · Δσs,eq(N∗) ≤ΔσRsk (N
∗)
γs,ƒt
(NDP) 2.4.2.3 (1): Partial factor for fa-tigue loads γF,ƒt = 1.0
(NDP) 2.4.2.4 (1): Partial factors for ma-terials γs,ƒt = 1.15
1.0 · 76.98 ≤175
1.15
Δσs,eq(N∗) = 76.98 ≤ 152.2 MP
If a coefficient λ = 2.0 is input for the shear links, resulting in a stressrange of Δσs,eq(N
∗) = 2 · 76.98 = 153.97 MP, a star (∗) will beprinted in the output next to the shear link stress range, denoting thatthe limit value of 152.2 MP has been exceeded.
The design fatigue strength of concrete is determined by:(NDP) 6.8.7 (1): Eq. 6.76: ƒcd,ƒtk1 = 1.03.1.2 (6): Eq. 3.2: βcc(t0)
βcc(t0) = es·(1−p28/ t = 1.0 ƒcd,ƒt = k1 · βcc(t0) · ƒcd ·
�
1 −ƒck
250
�
ƒcd,ƒt = 1.0 · 1.0 · 19.83 ·�
1 −35
250
�
= 17.0567 MP
In the case of the compression struts of members subjected to shear,the concrete strength ƒcd,ƒt should be reduced by the strength reduc-tion factor ν1 according to 6.2.3(3).(NDP) 6.8.7 (3): Verification of concrete
under compression or shear
ν2 = 1 for ≤ C50/60(NDP) 6.2.3 (3): ν1, ν2
136 VERiFiCATiON MANUAL - Design Code Benchmarks | SOFiSTiK 2018

DCE-EN19: Fatigue of a Rectangular Reinforced Concrete CS
ν1 = 0.75 · ν2 = 0.75
⇒ ƒcd,ƒt,red = 0.75 · 17.0567 = 12.7925 MP
A satisfactory fatigue resistance may be assumed, if the following con-dition is fulfilled:
Ecd,m,eq + 0.43 ·Æ
1 − Req ≤ 1 6.8.7 (1): Eq. 6.72 - 6.75
σcd,m,eq
ƒcd,ƒt,red+ 0.43 ·
√
√
√1 −σcd,mn,eq
σcd,m,eq≤ 1
σcd,m,eq ≤ ƒcd,ƒt,red ·
1.0 − 0.43 ·
√
√
√1 −σcd,mn,eq
σcd,m,eq
!
σcd,m,eq ≤ 12.7925 ·�
1.0 − 0.43 ·
√
√
1 −0.9933
1.2362
�
σcd,m,eq = 1.2362 ≤ 10.35 MP
Accordingly the above verification is done for the minimum and maxi-mum nonlinear stresses of concrete, as calculated from AQB Fig. 21.3,at the defined ′TOP′ point of the cross-section.
σcd,m,eq ≤ ƒcd,ƒt ·
1.0 − 0.43 ·
√
√
√1 −σcd,mn,eq
σcd,m,eq
!
σcd,m,eq ≤ 17.0567 ·�
1.0 − 0.43 ·
√
√
1 −5.69
6.60
�
σcd,m,eq = 6.60 ≤ 14.33 MP
Stress limitation
σm,t = k3 · ƒyk 7.2 (5)
σm,t = 0.80 · 500 MP
σm,t = 400 MP
SOFiSTiK 2018 | VERiFiCATiON MANUAL - Design Code Benchmarks 137
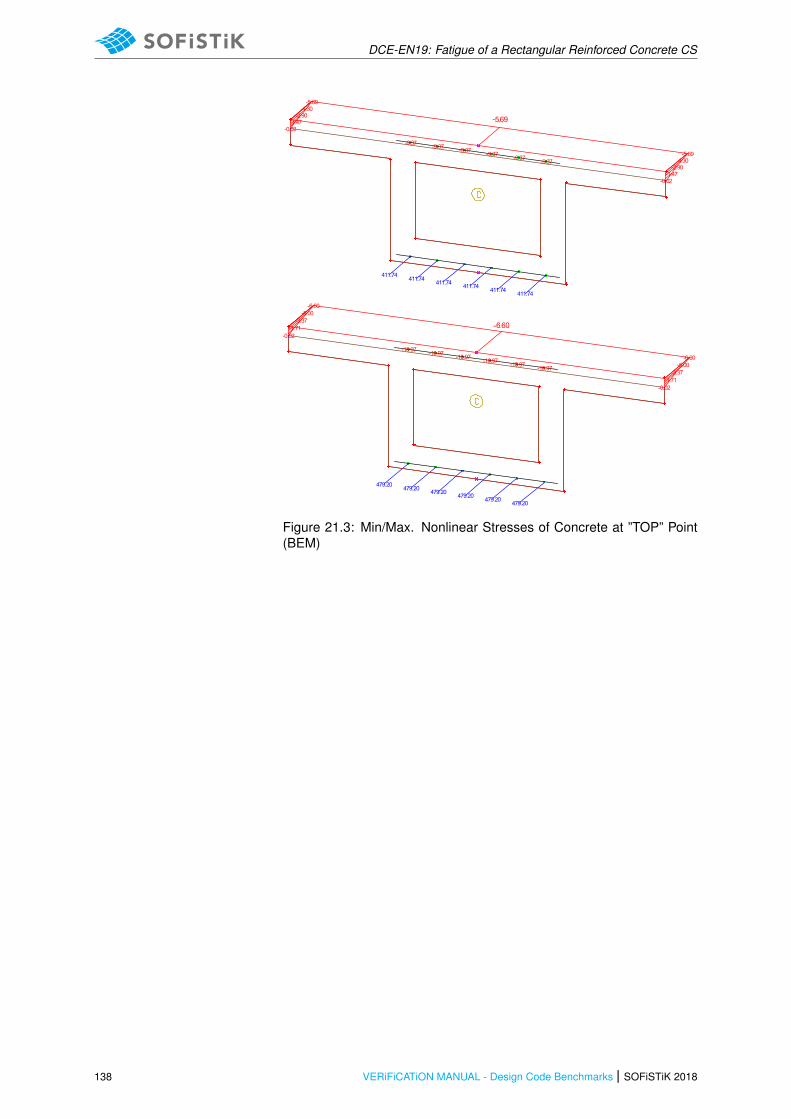
DCE-EN19: Fatigue of a Rectangular Reinforced Concrete CS
20.0-74.1-09.2-03.4-
47.114
73.9-96.5-
47.114
73.9-
47.114
73.9-
47.114
73.9-
47.114
73.9-
47.114
73.9-
96.5-20.0-74.1-09.2-03.4-96.5-
20.0-17.1-73.3-
02.97402.974
00.5-79.01-
02.974
06.6-79.01-
02.974
79.01-
02.974
79.01-
02.974
79.01-79.01-
. 066-20.0-17.1-73.3-00.5-06.6-
Figure 21.3: Min/Max. Nonlinear Stresses of Concrete at ”TOP” Point(BEM)
138 VERiFiCATiON MANUAL - Design Code Benchmarks | SOFiSTiK 2018

DCE-EN19: Fatigue of a Rectangular Reinforced Concrete CS
21.5 Conclusion
This example shows the verification of a reinforced concrete beam to fatigue. It has been shown thatAQB follows the fatigue verification procedure, as proposed in DIN EN 1992-1-1/NA [11] [2]. The in-significant deviation arises from the fact that the benchmark (reference) results have been calculated byusing the BEM analysis. By introducing the FEM analysis, AQUA calculates now the 1/WVz, 1/WVy
and 1/WT values more accurate.
21.6 Literature
[2] F. Fingerloos, J. Hegger, and K. Zilch. DIN EN 1992-1-1 Bemessung und Konstruktion vonStahlbeton- und Spannbetontragwerken - Teil 1-1: Allgemeine Bemessungsregeln und Regelnfur den Hochbau. BVPI, DBV, ISB, VBI. Ernst & Sohn, Beuth, 2012.
[11] DIN EN 1992-1-1/NA:2013-04: Eurocode 2: Design of concrete structures, Part 1-1/NA: Gen-eral rules and rules for buildings - Nationaler Anhang Deutschland, Ersatz fur DIN EN 1992-1-1/NA:2011-01 und DIN EN 1992-1-1/NA Berichtigung 1:2012-06. DIN. 2013.
SOFiSTiK 2018 | VERiFiCATiON MANUAL - Design Code Benchmarks 139

DCE-EN19: Fatigue of a Rectangular Reinforced Concrete CS
140 VERiFiCATiON MANUAL - Design Code Benchmarks | SOFiSTiK 2018
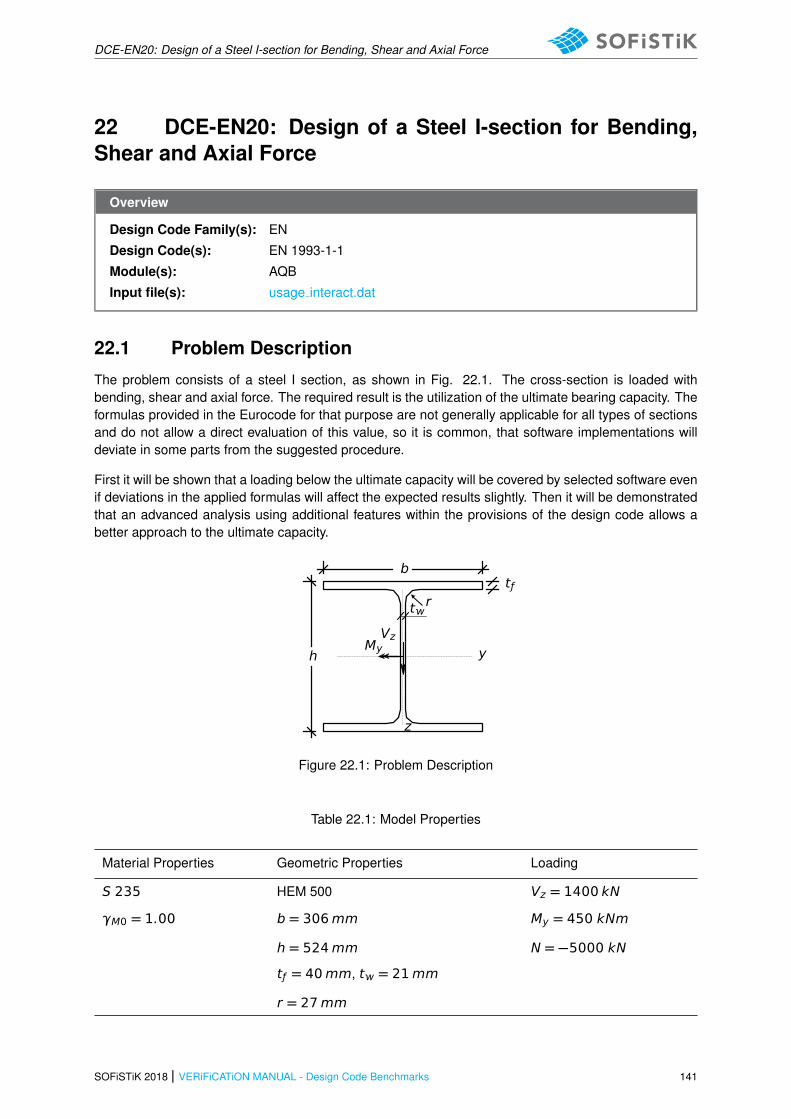
DCE-EN20: Design of a Steel I-section for Bending, Shear and Axial Force
22 DCE-EN20: Design of a Steel I-section for Bending,Shear and Axial Force
Overview
Design Code Family(s): EN
Design Code(s): EN 1993-1-1
Module(s): AQB
Input file(s): usage interact.dat
22.1 Problem Description
The problem consists of a steel I section, as shown in Fig. 22.1. The cross-section is loaded withbending, shear and axial force. The required result is the utilization of the ultimate bearing capacity. Theformulas provided in the Eurocode for that purpose are not generally applicable for all types of sectionsand do not allow a direct evaluation of this value, so it is common, that software implementations willdeviate in some parts from the suggested procedure.
First it will be shown that a loading below the ultimate capacity will be covered by selected software evenif deviations in the applied formulas will affect the expected results slightly. Then it will be demonstratedthat an advanced analysis using additional features within the provisions of the design code allows abetter approach to the ultimate capacity.
y
z
b
hMyVz
tr
tƒ
Figure 22.1: Problem Description
Table 22.1: Model Properties
Material Properties Geometric Properties Loading
S 235 HEM 500 Vz = 1400 kN
γM0 = 1.00 b = 306mm My = 450 kNm
h = 524mm N = −5000 kN
tƒ = 40mm, t = 21mm
r = 27mm
SOFiSTiK 2018 | VERiFiCATiON MANUAL - Design Code Benchmarks 141
DCE-EN20: Design of a Steel I-section for Bending, Shear and Axial Force
Table 22.1: (continued)
Material Properties Geometric Properties Loading
A = 344.298 cm2 Sectional Class 1
22.2 Reference Solution
As significant shear and axial forces are present allowance should be made for the effect of both shearforce and axial force on the resistance moment. The content of this problem is covered by the followingparts of EN 1993-1-1:2005 [7]:
• Structural steel (Section 3.2 )
• Resistance of cross-sections (Section 6.2)
22.3 Model and Results
The section, a HEM 500, with properties as defined in Table 22.1, is to be designed for an ultimatemoment My, a shear force Vz and an axial force N, with respect to EN 1993-1-1:2005 [7]. The utilisationlevel of allowable plastic forces are calculated and compared to software results. The results are givenin Table 22.2.
Table 22.2: Results
Result SOF. Ref.
Util. level N 0.618 0.618
Util. level NEd/NV,Rd 0.712 0.712
Util. level Vz 0.797 0.797
Util. level My 0.270 0.270
Total util. level My,red (EN 1993-1-1) 0.952 0.846
142 VERiFiCATiON MANUAL - Design Code Benchmarks | SOFiSTiK 2018
DCE-EN20: Design of a Steel I-section for Bending, Shear and Axial Force
22.4 Design Process1
The calculation steps of the reference solution are presented below.Neither the axial force (see EN 1993-1-1, 6.2.9.1 (4)) nor the shearforce (see EN 1993-1-1, 6.2.10) can be neglected.
Material:
Structural Steel S 235
ƒy = 235 N/mm2
Cross-sectional properties:
Wp,y = 7094.2 cm2 Plastic section modulus of HEM 500w.r.t. y-
AV,z = A − 2 · b · tƒ + (t + 2 · r) · tƒ but not less than η · h · t 6.2.6 (3)a: The shear area AV,z may betaken as follows for rolled I-sections withload parallel to the web
η may be conservatively taken equal to1.0
h = h − 2 · tƒ = 44.4 cm
AV,z = 129.498 cm2 > 1 · 44.4 · 2.1 = 93.24Partial factor γM0 = 1.0
V,z =AV,z
A=129.5
344.3= 0.376
A = A − 2 · b · tƒ = 99.498 cm2
=AV
A=99.5
344.3= 0.289 6.2.9.1 (5): =
A − 2 · b · tƒA
Vp,Rd,z =129.498 · 235/
p3
1.00= 1757 kN 6.2.6 (3)a: The shear area AVz may be
taken as follows for rolled I - sectionswith load parallel to the web
Mc,Rd =Wp,y · ƒyγM0
= 1667 kNm 6.2.5 (2), Eq. 6.13: The design resis-tance for bending, for Class 1 cross-section
Where the shear and axial force are present allowance should be madefor the effect of both shear force and axial force on resistance moment. 6.2.10 (1): Bending, shear and axial
force
Provided that the design value of the shear force VEd does not exceedthe 50% of the design plastic shear resistance Vp,Rd no reduction ofthe resistances for bending and axial force need to be made.
VEd ≤ 0.5 · Vp,Rd 6.2.10 (2)
VEd
Vp,Rd,z= 0.797 > 0.5
→ shear resistance limit exceeded 6.2.10 (3): Bending shear and axialforce
Provided that the design value of the shear force VEd exceeds the 50%of the design plastic shear resistance Vp,Rd,z, the design resistanceof the cross-section to combinations of moment and axial force shouldbe calculated using a reduced yield strength (1 − ρ) · ƒy for the sheararea. Therefore all following formulas will be modified for the shear forceallowance.
1The sections mentioned in the margins refer to EN 1993-1-1:2005 [7] unless other-wise specified.
SOFiSTiK 2018 | VERiFiCATiON MANUAL - Design Code Benchmarks 143

DCE-EN20: Design of a Steel I-section for Bending, Shear and Axial Force
ρ =�
2 · VEdVp,Rd,z
− 1�2
= 0.3526.2.10 (3) the design resistance shouldbe calculated using a reduced yieldstrength (1 − ρ) · ƒy for the shear area
My,V,Rd =
�
Wp,y −ρ · A2
4 · t
�
· ƒy
γM0= 1581 kNm6.2.8 (5): Eq. 6.30: The reduced de-
sign plastic resistance moment allowingfor shear force may alternatively be ob-tained for I-sections with equal flangesand bending about major axis
My
My,V,Rd= 0.277
My
Mc,Rd= 0.270 with no reduction
Np,Rd =A · ƒyγM0
= 8091 kN6.2.4 (2), Eq. 6.10: The design resis-tance for compression
NV,Rd = Np,Rd · (1 − V,z · ρ)
NV,Rd = 7018.6 kN
n =NEd
NV,Rd= 0.712
NEd
Np,Rd= 0.618 with no reduction
Where an axial force is present, allowance should be made for its effecton the plastic moment resistance.6.2.9.1 (1): Bending and axial force -
Class 1 and 2 cross-sections
NEd >mn
0.25 ·NV,Rd0.5 · h · t · ƒy · (1 − ρ)
γM0
6.2.9.1 (4): For doubly symmetricalI-sections, allowance need not to bemade for the effect of the axial force onthe plastic resistance moment about they-y axis when the criteria are satisfied.
NEd = 5000 >mn
(
1754.7 kN
709.5 kN
→ consideration of axial force in interaction
MN,y,Rd = MV,y,Rd ·1 − n
1 − 0.5 · α∗6.2.9.1 (5): Eq. 6.36-6.38: reduced de-sign plastic resistance moment allow-ing for I-sections with equal flanges andbending about major axis. and MN,y,Rd ≤ MV,y,Rd
n =NEd
NV,Rd= 0.712
∗ =mn
A − 2 · b · tƒA
=344.4 − 2 · 30.6 · 4
344.4= 0.289
0.5
∗ = 0.289
MN,y,Rd = 1581 ·1 − 0.712
1 − 0.5 · 0.289= 531 kNm
My,Ed
MNV,y,Rd=450
531= 0.846
144 VERiFiCATiON MANUAL - Design Code Benchmarks | SOFiSTiK 2018
DCE-EN20: Design of a Steel I-section for Bending, Shear and Axial Force
Alternative solution (see evaluation below):
My,V,Rd =
�
7094 −0.352 · 129.52
4 · 2.1
�
· ƒy Using A = A = AVz insead ofthree different values: 93.2 6= 99.5 6=129.5Hit: The reduction by the plastic bend-ing resistance of the web may be ob-tained with a better precision.
My,V,Rd = 1501.8 kNm
MN,y,Rd =1 − 0.712
1 − 0.5 · 0.376· 1501 = 532 kNm
MEd
MNV,y,Rd=450
532= 0.846
SOFiSTiK 2018 | VERiFiCATiON MANUAL - Design Code Benchmarks 145
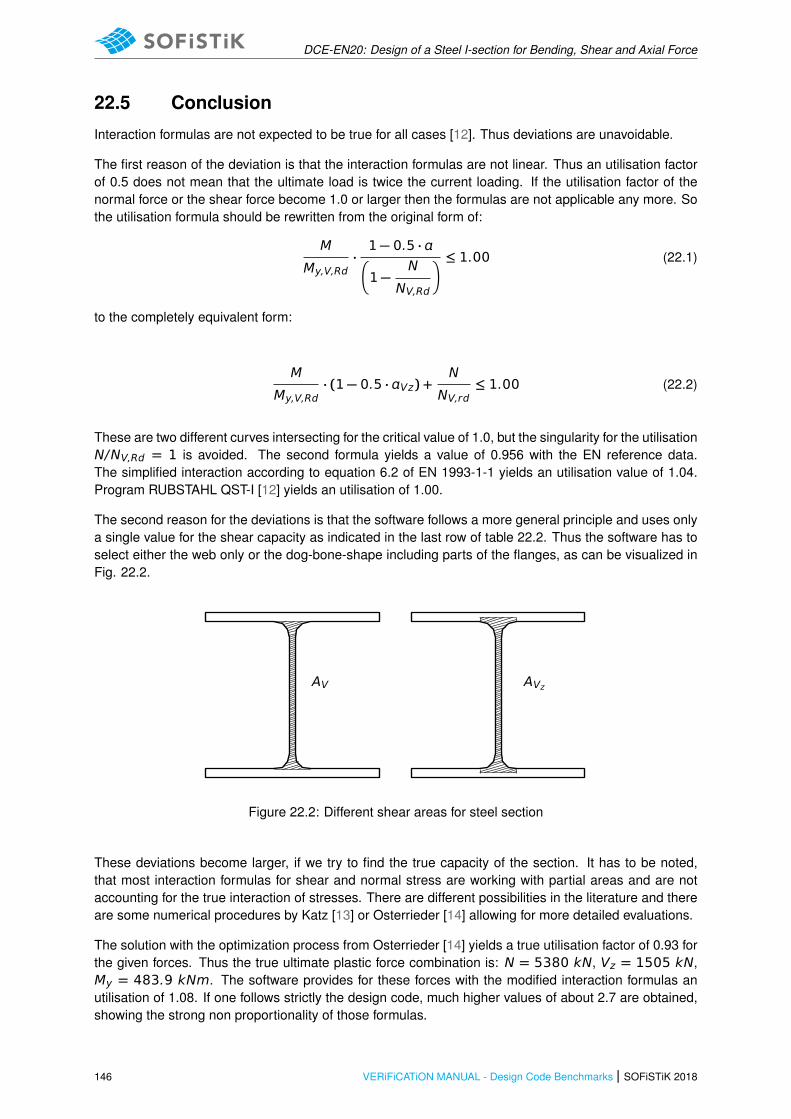
DCE-EN20: Design of a Steel I-section for Bending, Shear and Axial Force
22.5 Conclusion
Interaction formulas are not expected to be true for all cases [12]. Thus deviations are unavoidable.
The first reason of the deviation is that the interaction formulas are not linear. Thus an utilisation factorof 0.5 does not mean that the ultimate load is twice the current loading. If the utilisation factor of thenormal force or the shear force become 1.0 or larger then the formulas are not applicable any more. Sothe utilisation formula should be rewritten from the original form of:
M
My,V,Rd·1 − 0.5 · �
1 −N
NV,Rd
� ≤ 1.00 (22.1)
to the completely equivalent form:
M
My,V,Rd· (1 − 0.5 · Vz) +
N
NV,rd≤ 1.00 (22.2)
These are two different curves intersecting for the critical value of 1.0, but the singularity for the utilisationN/NV,Rd = 1 is avoided. The second formula yields a value of 0.956 with the EN reference data.The simplified interaction according to equation 6.2 of EN 1993-1-1 yields an utilisation value of 1.04.Program RUBSTAHL QST-I [12] yields an utilisation of 1.00.
The second reason for the deviations is that the software follows a more general principle and uses onlya single value for the shear capacity as indicated in the last row of table 22.2. Thus the software has toselect either the web only or the dog-bone-shape including parts of the flanges, as can be visualized inFig. 22.2.
AVzAV
Figure 22.2: Different shear areas for steel section
These deviations become larger, if we try to find the true capacity of the section. It has to be noted,that most interaction formulas for shear and normal stress are working with partial areas and are notaccounting for the true interaction of stresses. There are different possibilities in the literature and thereare some numerical procedures by Katz [13] or Osterrieder [14] allowing for more detailed evaluations.
The solution with the optimization process from Osterrieder [14] yields a true utilisation factor of 0.93 forthe given forces. Thus the true ultimate plastic force combination is: N = 5380 kN, Vz = 1505 kN,My = 483.9 kNm. The software provides for these forces with the modified interaction formulas anutilisation of 1.08. If one follows strictly the design code, much higher values of about 2.7 are obtained,showing the strong non proportionality of those formulas.
146 VERiFiCATiON MANUAL - Design Code Benchmarks | SOFiSTiK 2018

DCE-EN20: Design of a Steel I-section for Bending, Shear and Axial Force
The solution according to Katz [13] uses a non-linear analysis, thus we have finite strains and the hard-ening effect of the steel strain law is used, as indicated in EN 1993-1-5:2006 Appendix C.6 [15]. Then itis no problem to obtain even higher ultimate forces: N = 5800 kN, Vz = 1624 kN, My = 522 kNm,giving a utilisation factor of 0.86 for the given loading. The normal and shear stress distribution in Figure22.3 is obtained with a maximum compressive strain of −1.61%◦.
-225.70
-191.31
-94.01
-53.53
Non linear Shear Stress, f = 1.080
94.24
52.89
61.98
120.21
133.88
141.53
146.41
132.45
Non linear von Mises stress, f = 1.080
226.67
197.35
233.96
168.56
170.36
214.98
235.54
247.30
254.66
Non linear Axial Stress, f = 1.080
AV
Figure 22.3: Non-linear normal and shear stress distribution
22.6 Literature
[7] EN 1993-1-1: Eurocode 3: Design of concrete structures, Part 1-1: General rules and rules forbuildings. CEN. 2005.
[12] R. Kindmann and U. Kruger. Stahlbau, Teil 1: Grundlagen. Ernst & Sohn, 2015.[13] C. Katz. “Fließzonentheorie mit Interaktion aller Stabschnittgroßen bei Stahltragwerken”. In:
Stahlbau (1997).[14] P. Osterrieder. “Plastic Bending and Torsion of Open Thin-Walled Steel Members”. In: Proceedings
of EUROSTEEL 2005, 4th European Conference on Steel and Composite Structures (Maastricht,2005).
[15] DIN EN 1993-1-5: Eurocode 3: Design of steel structures, Part 1-5: Plated structural elements -German version EN 1993-1-1:2006 + AC:2009. CEN. 2010.
SOFiSTiK 2018 | VERiFiCATiON MANUAL - Design Code Benchmarks 147

DCE-EN20: Design of a Steel I-section for Bending, Shear and Axial Force
148 VERiFiCATiON MANUAL - Design Code Benchmarks | SOFiSTiK 2018

DCE-EN21: Real Creep and Shrinkage Calculation of a T-Beam Prestressed CS
23 DCE-EN21: Real Creep and Shrinkage Calculation ofa T-Beam Prestressed CS
Overview
Design Code Family(s): EN
Design Code(s): EN 1992-1-1
Module(s): CSM
Input file(s): real creep shrinkage.dat
23.1 Problem Description
The problem consists of a simply supported beam with a T-Beam cross-section of prestressed concrete,as shown in Fig. 23.1. The nodal displacement is calculated considering the effects of real creep andshrinkage, also the usage of custom (experimental) creep and shrinkage parameters is verified, thecustom (experimental) parameter is taken from fib Model Code 2010 [16].
VEd
As1d1
As1
hƒ
beƒ ƒ
h d
Figure 23.1: Problem Description
23.2 Reference Solution
This example is concerned with the calculation of creep and shrinkage on a prestressed concrete cs,subject to horizontal prestressing force. The content of this problem is covered by the following parts ofEN 1992-1-1:2004 [6]:
• Creep and Shrinkage (Section 3.1.4)
• Annex B: Creep and Shrinkage (Section B.1, B.2)
The time dependant displacements are calculated by multiplying the length of the beam with the creep(εcc) and shrinkage (εcs) strain:
• the creep deformation of concrete is calculated according to (EN 1992-1-1, 3.1.4, Eq. 3.6)
• the total shrinkage strain is calculated according to (EN 1992-1-1, 3.1.4, Eq. 3.8)
23.3 Model and Results
The benchmark 21 is here to show the effects of real creep on a prestressed concrete simply supportedbeam. The analysed system can be seen in Fig. 23.4 with properties as defined in Table 23.1. The
SOFiSTiK 2018 | VERiFiCATiON MANUAL - Design Code Benchmarks 149

DCE-EN21: Real Creep and Shrinkage Calculation of a T-Beam Prestressed CS
tendon geometry is simplified as much as possible and modelled as a horizontal force, therefore tendonsare not subject of this benchmark. The beam consists of a T-Beam cs and is loaded with a horizontalprestressing force from time t1 = 100 days to time t2 = 300 days. The self-weight is neglected. Acalculation of the creep and shrinkage is performed in the middle of the span with respect to EN 1992-1-1:2004 [6]. The calculation steps are presented below and the results are given in Table 23.2 for thecalculation with CSM. For calculating the real creep and shrinkage (RCRE) an equivalent loading isused, see Fig. 23.2 and Fig. 23.3.
The time steps for the calculation are:t0 = 7 days, t1 = 100 days, t2 = 300 days, t∞ = 30 years
ts t0 t1 = 100 t2 = 300 t∞ = 30 yr.t [days]
[mm]Equivalent loading used by CSM
Real loading
shrinkage
loading
creep
Figure 23.2: Creep, shrinkage and loading displacements
ts t0 t1 = 100 t2 = 300 t∞ = 30 yr.t [days]
[mm]Equivalent loading used by CSM
Real loading
← +shrinkage
+loading→
+creep +shrinkage→ -loading→←+shrinkage -creep
Figure 23.3: Equivalent loading and displacement for real creep and shrinkage (RCRE)
150 VERiFiCATiON MANUAL - Design Code Benchmarks | SOFiSTiK 2018

DCE-EN21: Real Creep and Shrinkage Calculation of a T-Beam Prestressed CS
The benchmark contains next calculation steps:
1. Calculating the shrinkage displacements before loading.
2. Calculating the displacements when loading occurs at time t1 = 100 days.
3. Calculating the displacements (creep and shrinkage) at time before the loading is inactive (t2 ≈300 and t2 < 300 days).
4. Calculating the displacements at time when the loading is inactive (t2 ≈ 300 and t2 > 300 days).
5. Calculating the displacements at time t3 = 30 years.
Table 23.1: Model Properties
Material Properties Geometric Properties Loading (at = 10 m) Time
C 35/45 h = 120 cm Np = −900.0 kN t0 = 7 days
Y 1770 beƒ ƒ = 280.0 cm ts = 3 days
RH = 80 hƒ = 40 cm
b = 40 cm
L = 20.0 m
L
Figure 23.4: Simply Supported Beam
Table 23.2: Results
Result CSM [mm] Ref [mm].
Δ4015 -0.69 -0.688
Δ4020 -0.849 -0.8431
Δ4025 -1.455 -1.45314
Δ4030 -1.298 -1.29814
Δ4035 -2.166 -2.08
SOFiSTiK 2018 | VERiFiCATiON MANUAL - Design Code Benchmarks 151

DCE-EN21: Real Creep and Shrinkage Calculation of a T-Beam Prestressed CS
23.4 Design Process1
Design with respect to EN 1992-1-1:2004 [6]:2
Material:
Concrete: C 35/453.1: Concrete
Ecm = 34077 N/mm23.1.2: Tab. 3.1: Ecm, ƒck and ƒcm forC 35/45
ƒck = 35 N/mm2
ƒcm = 43 N/mm2
Prestressing Steel: Y 17703.3: Prestressing Steel
Load Actions:
Self weight per length is neglected: γ = 0 kN/m (to simplify the exam-ple as much as possible)
At = 10.0 m middle of the span:
NEd = −900 kNA = 280 · 40 + 60 · 80 = 16000 cm2
Calculation of stresses at = 10.0 m midspan:
σc =NEd
A=−900
16000= −0.05625 kN/cm2 = −0.5625 N/mm2σc stress in concrete
1) Calculating the shrinkage displacements before loading
• Calculating creep:
According to EN 1992-1-1 the creep deformation of concrete for a con-stant compressive stress σc applied at a concrete age t0 is given by:
εcc = ϕ(t, t0) · (σc/Ecs)
Because σc = 0 (before loading), creep deformation is neglected andεcc = 0.
• Calculating shrinkage:
t0 = 7 dayst0 minimum age of concrete for loadingts age of concrete at start of dryingshrinkaget age of concrete at the moment consid-ered
ts = 3 days
t = 100 days
teƒ ƒ = t − t0 = 100 − 7 = 93 days
εcs = εcd + εc3.1.4 (6): Eq. 3.8: εcs total shrinkagestrain
εcd(t) = βds(t, ts) · kh · εcd,03.1.4 (6): Eq. 3.9: εcd drying shrinkagestrain
1The tools used in the design process are based on steel stress-strain diagrams, asdefined in [6] 3.3.6: Fig. 3.10
2The sections mentioned in the margins refer to EN 1992-1-1:2004 [6], [2], unlessotherwise specified.
152 VERiFiCATiON MANUAL - Design Code Benchmarks | SOFiSTiK 2018
DCE-EN21: Real Creep and Shrinkage Calculation of a T-Beam Prestressed CS
The development of the drying shrinkage strain in time is strongly de-pends on βds(t, ts) factor. SOFiSTiK accounts not only for the age atstart of drying ts but also for the influence of the age of the prestressingt0. Therefore, the calculation of factor βds reads:
βds = βds(t, ts) − βds(t0, ts) 3.1.4 (6): Eq. 3.10: βds
βds =(t − ts)
(t − ts) + 0.04 ·Ç
h30
−(t0 − ts)
(t0 − ts) + 0.04 ·Ç
h30
3.1.4 (6): h0 the notional size (mm) ofthe cs h0 = 2Ac/ = 500 mm
βds =(100 − 3)
(100 − 3) + 0.04 ·p
4003−
(7 − 3)
(7 − 3) + 0.04 ·p
4003
βds = 0.232 − 0.01235 = 0.22026
kh = 0.725 for h0 = 400 mm 3.1.4 (6): Tab. 3.3: kh coefficient de-pending on h0
εcd,0 = 0.85�
(220 + 110 · αds1) · exp�
−αds2 ·ƒcm
ƒcmo
��
·10−6 ·βRHAnnex B.2 (1): Eq. B.11: εcd,0 basicdrying shrinkage strain
βRH = 1.55
�
1 −�
RH
RH0
�3�
= 1.55
�
1 −�
80
100
�3�
= 0.7564 Annex B.2 (1): Eq. B.12: βRHRH the ambient relative humidity (%)
εcd,0 = 0.85�
(220 + 110 · 4) · exp�
−0.12 ·43
10
��
·10−6 ·0.7564Annex B.2 (1): αds1, αds1 coefficientsdepending on type of cement.For class N αds1 = 4, αds2 = 0.12εcd,0 = 2.533 · 10−4
εcd = βds · kh · εcd,0
εcd = 0.22026 · 0.725 · 2.533 · 10−4 = −4.04 · 10−5
Drying shrinkage:
εcd = −4.04 · 10−5
εc(t) = βs(t) · εc(∞) 3.1.4 (6): Eq. 3.11: εc autogenousshrinkage strain
εc(∞) = 2.5 (ƒck − 10) · 10−6 = 2.5 · (35 − 10) · 10−6 3.1.4 (6): Eq. 3.12: εc(∞)
εc(∞) = 6.25 · 10−5 = 0.0625 ◦/◦◦
Proportionally to βds(t, ts), SOFiSTiK calculates factor βs as follows:
βs = βs(t) − βs(t0) 3.1.4 (6): Eq. 3.13: βs
βs = 1 − e−0.2·pt −
�
1 − e−0.2·pt0�
= e−0.2·pt0 − e−0.2·
pt
βs = 0.4537
εc(t) = βs(t) · εc(∞)
εc(t) = 0.45377 · 6.25 · 10−5
Autogenous shrinkage:
SOFiSTiK 2018 | VERiFiCATiON MANUAL - Design Code Benchmarks 153
DCE-EN21: Real Creep and Shrinkage Calculation of a T-Beam Prestressed CS
εc(t) = −2.84 · 10−5
Total shrinkage:
εcs = εc + εcd
εcs = −2.84 · 10−5 + (−4.04) · 10−5 = −6.881 · 10−5ε absolute shrinkage strainnegative sign to declare losses
Calculating displacement:
Δ1,cs = εcs · L/2
Δ1,cs = −6.881 · 10−5 · 10000 mm
Δ1,cs = −0.6881 mm
2) Calculate displacement when loading occurs at time t1 = 100days at = 10.0 m midspan
σc = Ecs · εEcs calculated ”ideal” cross sectionmodulus of elasticity for concrete andreinforcement steel
Ecs = Ecm +As
Ac· Es
Ecs = 3407.7 +178.568
16000 − 178.568· 20000
Ecs = 3407.7 + 225.729
Ecs = 3633.42 kN/cm2 = 36334.29 N/mm2
ε =σc
Ecs=−0.5625
36334.29= −1.55 · 10−5
ε =Δ2
→ Δ2 = ε · L/2
Δ2 = −1.55 · 10−5 · 10000 mm = −0.155 mm
3) Calculating the displacement (creep and shrinkage) at time be-fore the loading is inactive (t2 ≈ 300 and t2 < 300 days)
t0 = 100 dayst0 minimun age of concrete for loadingts age of concrete at start of dryingshrinkaget age of concrete at the moment consid-ered
ts = 3 days
t = 300 days
teƒ ƒ = t − t0 = 300 − 100 = 200 days
• Calculating shrinkage:
εcs = εcd + εc3.1.4 (6): Eq. 3.8: εcs total shrinkagestrain
εcd(t) = βds(t, ts) · kh · εcd,03.1.4 (6): Eq. 3.9: εcd drying shrinkagestrain
The development of the drying shrinkage strain in time is strongly de-pends on βds(t, ts) factor. SOFiSTiK accounts not only for the age atstart of drying ts but also for the influence of the age of the prestressing
154 VERiFiCATiON MANUAL - Design Code Benchmarks | SOFiSTiK 2018
DCE-EN21: Real Creep and Shrinkage Calculation of a T-Beam Prestressed CS
t0. Therefore, the calculation of factor βds reads:
βds = βds(t, ts) − βds(t0, ts) 3.1.4 (6): Eq. 3.10: βds
βds =(t − ts)
(t − ts) + 0.04 ·Ç
h30
−(t0 − ts)
(t0 − ts) + 0.04 ·Ç
h30
3.1.4 (6): h0 the notional size (mm) ofthe cs h0 = 2Ac/ = 500 mm
βds =(300 − 3)
(300 − 3) + 0.04 ·p
4003−
(100 − 3)
(100 − 3) + 0.04 ·p
4003
βds = 0.2487
kh = 0.725 for h0 = 400 mm 3.1.4 (6): Tab. 3.3: kh coefficient de-pending on h0
εcd,0 = 0.85�
(220 + 110 · αds1) · exp�
−αds2 ·ƒcm
ƒcmo
��
·10−6 ·βRHAnnex B.2 (1): Eq. B.11: εcd,0 basicdrying shrinkage strain
βRH = 1.55
�
1 −�
RH
RH0
�3�
= 1.55
�
1 −�
80
100
�3�
= 0.7564 Annex B.2 (1): Eq. B.12: βRHRH the ambient relative humidity (%)
εcd,0 = 0.85�
(220 + 110 · 4) · exp�
−0.12 ·43
10
��
·10−6 ·0.7564Annex B.2 (1): αds1, αds1 coefficientsdepending on type of cement.For class N αds1 = 4, αds2 = 0.12εcd,0 = 2.533 · 10−4
εcd = 0.24874 · 0.725 · 2.533 · 10−4 = −4.57 · 10−5
Drying shrinkage:
εcd = −4.57 · 10−5
εc(t) = βs(t) · εc(∞) 3.1.4 (6): Eq. 3.11: εc autogenousshrinkage strain
εc(∞) = 2.5 · (ƒck − 10) · 10−6 = 2.5 (35 − 10) · 10−6 3.1.4 (6): Eq. 3.12: εc(∞)
εc(∞) = 6.25 · 10−5 = 0.0625 ◦/◦◦
Proportionally to βds(t, ts), SOFiSTiK calculates factor βs as follows:
βs = βs(t) − βs(t0) 3.1.4 (6): Eq. 3.13: βs
βs = 1 − e−0.2·pt −
�
1 − e−0.2·pt0�
= e−0.2·pt0 − e−0.2·
pt
βs = 0.104
εc(t) = βs(t) · εc(∞)
εc(t) = 0.1040 · 6.25 · 10−5
Autogenous shrinkage:
εc(t) = −6.502136 · 10−6
Total shrinkage:
SOFiSTiK 2018 | VERiFiCATiON MANUAL - Design Code Benchmarks 155
DCE-EN21: Real Creep and Shrinkage Calculation of a T-Beam Prestressed CS
εcs = εc + εcd
εcs = −6.502136 · 10−6 + (−4.57) · 10−5
εcs = −5.218 · 10−5ε absolute shrinkage strainnegative sign to declare losses
Calculating displacement:
Δ3,cs = εcs · L/2
Δ3,cs = −5.218 · 10−5 · 10000 mm
Δ3,cs = −0.5218 mm
• Calculating creep:
ϕ(t, t0) = ϕ0 · βc(t, t0)Annex B.1 (1): Eq. B.1: ϕ(t, t0) creepcoefficient
ϕ0 = ϕRH · β(ƒcm) · β(t0)Annex B.1 (1): Eq. B.2: ϕ0 notionalcreep coefficient
ϕRH =�
1 +1 − RH/100
0.1 · 3p
h0· α1
�
· α2Annex B.1 (1): Eq. B.3: ϕRH factor foreffect of relative humidity on creep
β(ƒcm) =16.8p
ƒcm= 16.8/
p43 = 2.562Annex B.1 (1): Eq. B.4: β(ƒcm) factor
for effect of concrete strength on creep
α1 =�
35
ƒcm
�0.7
= 0.8658 ≤ 1Annex B.1 (1): Eq. B.8c: α1, α2, α3coefficients to consider influence of con-crete strength
α2 =�
35
ƒcm
�0.2
= 0.9597 ≤ 1
α3 =�
35
ƒcm
�0.5
= 0.9022 ≤ 1
ϕRH =�
1 +1 − 80/100
0.1 · 3p400
· 0.8658�
· 0.9597 = 1.1852
β(t0) =1
�
0.1 + t0.200
�Annex B.1 (1): Eq. B.5: β(t0) factorfor effect of concrete age at loading oncreep
t0 = t0,T ·
9
2 + t1.20,T+ 1
!α
≥ 0.5Annex B.1 (2): Eq. B.9: t0,T tempera-ture adjusted age of concrete at loadingadjusted according to expression B.10
tT =∑n=1 e
−(4000/[273+T(Δt)]−13.65) · ΔtAnnex B.1 (3): Eq. B.10: tT temper-ature adjusted concrete age which re-places t in the corresponding equations t0,T = 100 · e−(4000/[273+20]−13.65) = 100 · 1.0 = 100.0
⇒ t0 = 100 ·�
9
2 + 1001.2+ 1
�0
= 100Annex B.1 (2): Eq. B.9: α a powerwhich depends on type of cementFor class N α = 0
β(t0) =1
�
0.1 + 1000.20� = 0.383
The coefficient to describe the development of creep with time after
156 VERiFiCATiON MANUAL - Design Code Benchmarks | SOFiSTiK 2018

DCE-EN21: Real Creep and Shrinkage Calculation of a T-Beam Prestressed CS
loading can be calculated according to EN 1992-1-1, Eq. B.7.:
βc(t, t0) =�
(t − t0)
(βH + t − t0)
�0.3
Annex B.1 (1): Eq. B.7: βc(t, t0) co-efficient to describe the development ofcreep with time after loading
In SOFiSTiK it is possible to modify and use custom creep and shrink-age parameters, for more details see AQUA and AQB Manual. In ourcase we are using the equation from fib Model Code 2010[16] (to verifyand show the MEXT feature in SOFiSTiK):
βc(t, t0) =�
(t − t0)
(βH + t − t0)
�γ(t0)
fib Model Code 2010; Eq. 5.1-71a
where:
γ(t0) =1
2.3 +3.5p
t0
=1
2.3 +3.5p100
=1
2.65= 0.3773 fib Model Code 2010; Eq. 5.1-71b
With MEXT NO 1 EIGE VAL 0.3773 the exponent 0.3 can be modified to0.3773.
βc(t, t0) =�
(t − t0)
(βH + t − t0)
�0.3773
Annex B.1 (1): Eq. B.7: βc(t, t0) co-efficient to describe the development ofcreep with time after loading
βH = 1.5 ·�
1 + (0.012 · RH)18�
· h0 + 250 · α3 ≤ 1500 · α3 Annex B.1 (1): Eq. B.8: βH coefficientdepending on relative humidity and no-tional member sizeβH = 1.5 ·
�
1 + (0.012 · 80)18�
· 400 + 250 · 0.9022
βH = 1113.31 ≤ 1500 · 0.9022 = 1353.30
⇒ βc(t, t0) = 0.4916
ϕ0 = ϕRH · β(ƒcm) · β(t0)
ϕ0 = 1.1852 · 2.5619 · 0.383 = 1.1629
ϕ(t, t0) = ϕ0 · βc(t, t0)
ϕ(t, t0) = 1.1629 · 0.4916 = 0.57
ϕeƒ ƒ (t, t0) = 0.57/1.05 = 0.5445 Annex B.1 (3): The values of ϕ(t, t0)given above should be associated withthe tangent modulus Ec3.1.4 (2): The values of the creep coef-ficient, ϕ(t, t0) is related to Ec, the tan-gent modulus, which may be taken as1.05 · Ecm
According to EN, the creep value is related to the tangent Young’smodulus Ec, where Ec being defined as 1.05 · Ecm. To account forthis, SOFiSTiK adopts this scaling for the computed creep coefficient(in SOFiSTiK, all computations are consistently based on Ecm).
Calculating the displacement:
εcc(t, t0) = ϕ(t, t0) ·σc
Ecs
εcc(t, t0) = 0.57 ·−0.5625
36334.29= −8.82430 · 10−6
ε =Δ
→ Δ3,cc = εcc · L/2
SOFiSTiK 2018 | VERiFiCATiON MANUAL - Design Code Benchmarks 157

DCE-EN21: Real Creep and Shrinkage Calculation of a T-Beam Prestressed CS
Δ3,cc = −8.82430 · 10−6 · 10000 mm = −0.08824 mm
4) Calculating the displacement at time when the loading is inac-tive (t2 ≈ 300 and t2 > 300 days).
At this step the loading disappears therefore:
Δ4 = −Δ2 = 0.155 mm
5) Calculating the displacement at time t3 = 30 years.
t0 = 300 dayst0 minimun age of concrete for loadingts age of concrete at start of dryingshrinkaget age of concrete at the moment consid-ered
ts = 3 days
t = 11250 days
teƒ ƒ = t − t0 = 11250 − 300 = 11950 dys
→ 11950/365 = 30 yers
• Calculating shrinkage:
εcs = εcd + εc3.1.4 (6): Eq. 3.8: εcs total shrinkagestrain
εcd(t) = βds(t, ts) · kh · εcd,03.1.4 (6): Eq. 3.9: εcd drying shrinkagestrain
The development of the drying shrinkage strain in time is strongly de-pends on βds(t, ts) factor. SOFiSTiK accounts not only for the age atstart of drying ts but also for the influence of the age of the prestressingt0. Therefore, the calculation of factor βds reads:
βds = βds(t, ts) − βds(t0, ts)3.1.4 (6): Eq. 3.10: βds
βds =(t − ts)
(t − ts) + 0.04 ·Ç
h30
−(t0 − ts)
(t0 − ts) + 0.04 ·Ç
h30
3.1.4 (6): h0 the notional size (mm) ofthe cs h0 = 2Ac/ = 500 mm
βds =(11250 − 3)
(11250 − 3) + 0.04 ·p
4003−
(300 − 3)
(300 − 3) + 0.04 ·p
4003
βds = 0.49097
kh = 0.725 for h0 = 400 mm3.1.4 (6): Tab. 3.3: kh coefficient de-pending on h0
εcd,0 = 0.85�
(220 + 110 · αds1) · exp�
−αds2 ·ƒcm
ƒcmo
��
·10−6 ·βRHAnnex B.2 (1): Eq. B.11: εcd,0 basicdrying shrinkage strain
βRH = 1.55
�
1 −�
RH
RH0
�3�
= 1.55
�
1 −�
80
100
�3�
= 0.7564Annex B.2 (1): Eq. B.12: βRHRH the ambient relative humidity (%)
εcd,0 = 0.85�
(220 + 110 · 4) · exp�
−0.12 ·43
10
��
·10−6 ·0.7564Annex B.2 (1): αds1, αds1 coefficientsdepending on type of cement.For class N αds1 = 4, αds2 = 0.12 εcd,0 = 2.533 · 10−4
εcd = βds(t, ts) · kh · εcd,0
158 VERiFiCATiON MANUAL - Design Code Benchmarks | SOFiSTiK 2018

DCE-EN21: Real Creep and Shrinkage Calculation of a T-Beam Prestressed CS
εcd = 0.49097 · 0.725 · 2.533 · 10−4 = −9.02 · 10−5
Drying shrinkage:
εcd = −9.02 · 10−5
εc(t) = βs(t) · εc(∞) 3.1.4 (6): Eq. 3.11: εc autogenousshrinkage strain
εc(∞) = 2.5 · (ƒck − 10) · 10−6 = 2.5 (35 − 10) · 10−6 3.1.4 (6): Eq. 3.12: εc(∞)
εc(∞) = 6.25 · 10−5 = 0.0625 ◦/◦◦
Proportionally to βds(t, ts), SOFiSTiK calculates factor βs as follows:
βs = βs(t) − βs(t0) 3.1.4 (6): Eq. 3.13: βs
βs = 1 − e−0.2·pt −
�
1 − e−0.2·pt0�
= e−0.2·pt0 − e−0.2·
pt
βs = 0.03130
εc(t) = βs(t) · εc(∞)
εc(t) = 0.03130 · 6.25 · 10−5
Autogenous shrinkage:
εc(t) = −1.95632 · 10−6
Total shrinkage:
εcs = εc + εcd
εcs = −1.95632 · 10−6 + (−9.02) · 10−5
εcs = −9.212 · 10−5ε absolute shrinkage strainnegative sign to declare losses
Calculating displacement:
Δ5,cs = εcs · L/2
Δ5,cs = −9.212 · 10−5 · 10000 mm
Δ5,cs = −0.9212 mm
• Calculating creep:
ϕ(t, t0) = ϕ0 · βc(t, t0) Annex B.1 (1): Eq. B.1: ϕ(t, t0) creepcoefficient
ϕ0 = ϕRH · β(ƒcm) · β(t0) Annex B.1 (1): Eq. B.2: ϕ0 notionalcreep coefficient
ϕRH =�
1 +1 − RH/100
0.1 · 3p
h0· α1
�
· α2 Annex B.1 (1): Eq. B.3: ϕRH factor foreffect of relative humidity on creep
SOFiSTiK 2018 | VERiFiCATiON MANUAL - Design Code Benchmarks 159

DCE-EN21: Real Creep and Shrinkage Calculation of a T-Beam Prestressed CS
β(ƒcm) =16.8p
ƒcm= 16.8/
p43 = 2.562Annex B.1 (1): Eq. B.4: β(ƒcm) factor
for effect of concrete strength on creep
α1 =�
35
ƒcm
�0.7
= 0.8658 ≤ 1Annex B.1 (1): Eq. B.8c: α1, α2, α3coefficients to consider influence of con-crete strength
α2 =�
35
ƒcm
�0.2
= 0.9597 ≤ 1
α3 =�
35
ƒcm
�0.5
= 0.9022 ≤ 1
ϕRH =�
1 +1 − 80/100
0.1 · 3p400
· 0.8658�
· 0.9597 = 1.1852
β(t0) =1
�
0.1 + t0.200
�Annex B.1 (1): Eq. B.5: β(t0) factorfor effect of concrete age at loading oncreep
t0 = t0,T ·
9
2 + t1.20,T+ 1
!α
≥ 0.5Annex B.1 (2): Eq. B.9: t0,T tempera-ture adjusted age of concrete at loadingadjusted according to expression B.10
tT =∑n=1 e
−(4000/[273+T(Δt)]−13.65) · ΔtAnnex B.1 (3): Eq. B.10: tT temper-ature adjusted concrete age which re-places t in the corresponding equations t0,T = 300 · e−(4000/[273+20]−13.65) = 300 · 1.0 = 300.0
⇒ t0 = 300 ·�
9
2 + 3001.2+ 1
�0
= 300Annex B.1 (2): Eq. B.9: α a powerwhich depends on type of cementFor class N α = 0
β(t0) =1
�
0.1 + 3000.20� = 0.3097
The coefficient to describe the development of creep with time afterloading can be calculated according to EN 1992-1-1, Eq. B.7.:
βc(t, t0) =�
(t − t0)
(βH + t − t0)
�0.3
Annex B.1 (1): Eq. B.7: βc(t, t0) co-efficient to describe the development ofcreep with time after loading
In SOFiSTiK it is possible to modify and use custom creep and shrink-age parameters, for more details see AQUA and AQB Manual. In ourcase we are using the equation from fib Model Code 2010[16] (to verifyand show the MEXT feature in SOFiSTiK).
With MEXT NO 1 EIGE VAL 0.3773 the exponent 0.3 can be modified to0.3773.
βc(t, t0) =�
(t − t0)
(βH + t − t0)
�0.3773
Annex B.1 (1): Eq. B.7: βc(t, t0) co-efficient to describe the development ofcreep with time after loading
βH = 1.5 ·�
1 + (0.012 · RH)18�
· h0 + 250 · α3 ≤ 1500 · α3Annex B.1 (1): Eq. B.8: βH coefficientdepending on relative humidity and no-tional member size βH = 1.5 ·
�
1 + (0.012 · 80)18�
· 400 + 250 · 0.9022
βH = 1113.31 ≤ 1500 · 0.9022 = 1353.30
⇒ βc(t, t0) = 0.9641
160 VERiFiCATiON MANUAL - Design Code Benchmarks | SOFiSTiK 2018

DCE-EN21: Real Creep and Shrinkage Calculation of a T-Beam Prestressed CS
ϕ0 = ϕRH · β(ƒcm) · β(t0)
ϕ0 = 1.1852 · 2.5619 · 0.3097 = 0.94067
ϕ(t, t0) = ϕ0 · βc(t, t0)
ϕ(t, t0) = 0.94067 · 0.9641 = 0.91
ϕeƒ ƒ (t, t0) = 0.91/1.05 = 0.8637 Annex B.1 (3): The values of ϕ(t, t0)given above should be associated withthe tangent modulus Ec3.1.4 (2): The values of the creep coef-ficient, ϕ(t, t0) is related to Ec, the tan-gent modulus, which may be taken as1.05 · Ecm
According to EN, the creep value is related to the tangent Young’smodulus Ec, where Ec being defined as 1.05 · Ecm. To account forthis, SOFiSTiK adopts this scaling for the computed creep coefficient(in SOFiSTiK, all computations are consistently based on Ecm).
εcc(t, t0) = ϕ(t, t0) ·σc
Ecs
εcc(t, t0) = 0.91 ·−0.5625
36334.29= −1.4087 · 10−5
ε =Δ
→ Δ5,cc = εcc · L/2
Δ5,cc = −1.4087 · 10−5 · 10000 mm = −0.1408 mm
CALCULATING THE DISPLACEMENT:
- 4010 stripping concrete
Δ4010 = 0 mm
- 4015 K creep step
Δ4015 = Δ1,cs
Δ4015 = −0.688 mm
- 4020 Start loading A
Δ4020 = Δ1,cs + Δ2
Δ4020 = −0.6881 − 0.155
Δ4020 = −0.8431 mm
- 4025 K creep step
Δ4025 = Δ1,cs + Δ2 + Δ3,cs + Δ3,cc
Δ4025 = −0.6881 − 0.155 − 0.08824 − 0.5218
Δ4025 = −1.45314 mm
- 4030 Stop loading A
Δ4030 = Δ1,cs + Δ2 + Δ3,cs + Δ3,cc − Δ4
Δ4030 = −0.6881 − 0.155 − 0.08824 − 0.5218 + 0.155
SOFiSTiK 2018 | VERiFiCATiON MANUAL - Design Code Benchmarks 161

DCE-EN21: Real Creep and Shrinkage Calculation of a T-Beam Prestressed CS
Δ4030 = −1.29814 mm
- 4035 K creep step
Δ4035 = Δ4030 + Δ5,cs − Δ5,cc
Δ4035 = −1.29814 − 0.9212 + 0.140
Δ4035 ≈ −2.08 mm
162 VERiFiCATiON MANUAL - Design Code Benchmarks | SOFiSTiK 2018

DCE-EN21: Real Creep and Shrinkage Calculation of a T-Beam Prestressed CS
23.5 Conclusion
This example shows the calculation of the time dependent displacements due to creep and shrinkage.It has been shown that the results are in very good agreement with the reference solution.
23.6 Literature
[2] F. Fingerloos, J. Hegger, and K. Zilch. DIN EN 1992-1-1 Bemessung und Konstruktion vonStahlbeton- und Spannbetontragwerken - Teil 1-1: Allgemeine Bemessungsregeln und Regelnfur den Hochbau. BVPI, DBV, ISB, VBI. Ernst & Sohn, Beuth, 2012.
[6] EN 1992-1-1: Eurocode 2: Design of concrete structures, Part 1-1: General rules and rules forbuildings. CEN. 2004.
[16] fib Model Code 2010. fib Model Code for Concrete Structures 2010. International Federation forStructural Concrete (fib). 2010.
SOFiSTiK 2018 | VERiFiCATiON MANUAL - Design Code Benchmarks 163

DCE-EN21: Real Creep and Shrinkage Calculation of a T-Beam Prestressed CS
164 VERiFiCATiON MANUAL - Design Code Benchmarks | SOFiSTiK 2018

DCE-EN22: Stress Relaxation of Prestressing Steel - EN 1992-1-1
24 DCE-EN22: Stress Relaxation of Prestressing Steel -EN 1992-1-1
Overview
Design Code Family(s): EN
Design Code(s): EN 1992-1-1
Module(s): AQB, AQUA
Input file(s): relaxation en1992.dat
24.1 Problem Description
The problem consists of a simply supported beam with a rectangular cross-section of prestressed con-crete, as shown in Fig. 24.1. The time dependent losses are calculated, considering the reduction ofstress caused by the deformation of prestressing steel due to steel-relaxation, under the permanentloads.
My
Np
Ap
h
zp
Figure 24.1: Problem Description
24.2 Reference Solution
This example is concerned with the calculation of relaxation losses on a prestressed concrete cs, subjectto bending and prestress force. The content of this problem is covered by the following parts of EN 1992-1-1:2004 [6]:
• Properties (Section 3.3.2)
• Annex D: Detailed calculation method for prestressing steel relaxation losses (Section D.1)
• Strength (Section 3.3.3)
In this Benchmark the stress loss due to relaxation will be examined, creep and shrinkage losses areneglected and disabled.
24.3 Model and Results
Benchmark 17 is here extended for the case of steel relaxation losses developing on a prestressedconcrete simply supported beam. The analysed system can be seen in Fig. 24.2, with properties asdefined in Table 24.1. Further information about the tendon geometry and prestressing can be found
SOFiSTiK 2018 | VERiFiCATiON MANUAL - Design Code Benchmarks 165
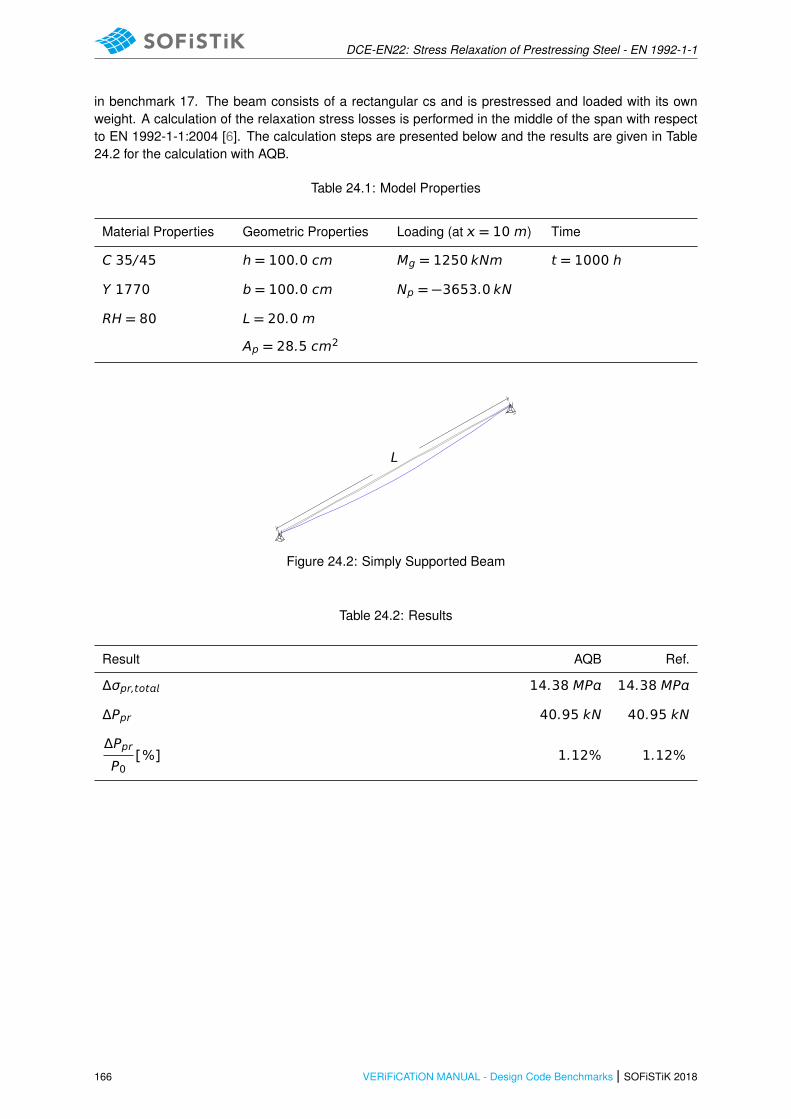
DCE-EN22: Stress Relaxation of Prestressing Steel - EN 1992-1-1
in benchmark 17. The beam consists of a rectangular cs and is prestressed and loaded with its ownweight. A calculation of the relaxation stress losses is performed in the middle of the span with respectto EN 1992-1-1:2004 [6]. The calculation steps are presented below and the results are given in Table24.2 for the calculation with AQB.
Table 24.1: Model Properties
Material Properties Geometric Properties Loading (at = 10 m) Time
C 35/45 h = 100.0 cm Mg = 1250 kNm t = 1000 h
Y 1770 b = 100.0 cm Np = −3653.0 kN
RH = 80 L = 20.0 m
Ap = 28.5 cm2
L
Figure 24.2: Simply Supported Beam
Table 24.2: Results
Result AQB Ref.
Δσpr,tot 14.38 MP 14.38 MP
ΔPpr 40.95 kN 40.95 kN
ΔPpr
P0[%] 1.12% 1.12%
166 VERiFiCATiON MANUAL - Design Code Benchmarks | SOFiSTiK 2018
DCE-EN22: Stress Relaxation of Prestressing Steel - EN 1992-1-1
24.4 Design Process1
Design with respect to EN 1992-1-1:2004 [6]
• Material:
Concrete: C 35/45 3.1: Concrete
Ecm = 34077 N/mm2 3.1.2: Tab. 3.1: Ecm, ƒck and ƒcm forC 35/45
ƒck = 35 N/mm2
ƒcm = 43 N/mm2
Prestressing Steel: Y 1770 3.3: Prestressing Steel
Ep = 195000 N/mm2 3.3.6 (3): Ep for wires
ƒpk = 1770 N/mm2 3.3.2, 3.3.3: ƒpk Characteristic tensilestrength of prestressing steel
ƒp0,1k = 1520 N/mm2 3.3.2, 3.3.3: ƒp0,1k 0.1% proof-stress ofprestressing steel, yield strength
Prestressing system: BBV L19 150 mm2
19 wires with area of 150mm2 each, giving a total of Ap = 28.5 cm2
• Cross-section:
Ac = 1.0 · 1.0 = 1 m2
Diameter of duct ϕdct = 97 mm
Ratio αE,p = Ep / Ecm = 195000 / 34077 = 5.7223
Ac,netto = Ac − π · (ϕdct/2)2 = 0.9926 m2
Ade = Ac + Ap · αE,p = 1.013 m2
• Prestressing forces and stresses
The force applied to a tendon, i.e. the force at the active end duringtensioning, should not exceed the following value
Pm = Ap · σp,m
where σp,m =mn(0.8 · ƒpk; 0.90 · ƒp0,1k)
Pm = Ap · 0.80 · ƒpk = 28.5 · 10−4 · 0.80 · 1770 = 4035.6 kN
Pm = Ap · 0.90 · ƒp0,1k = 28.5 · 10−4 · 0.90 · 1520 = 3898.8 kN
→ Pm = 3898.8 kN and σp,m = 1368 N/mm2
The value of the initial prestress force at time t = t0 applied to theconcrete immediately after tensioning and anchoring should not exceedthe following value 5.10.3 (2): Prestress force
1The tools used in the design process are based on steel stress-strain diagrams, asdefined in [6] 3.3.6: Fig. 3.10
SOFiSTiK 2018 | VERiFiCATiON MANUAL - Design Code Benchmarks 167
DCE-EN22: Stress Relaxation of Prestressing Steel - EN 1992-1-1
Pm0() = Ap · σp,m0()5.10.3 (2): Eq. 5.43: Pm0 initial pre-stress force at time t = t0
where σp,m0() =min�
0.75ƒpk; 0.85ƒp0,1k
(NDP) 5.10.3 (2): σp,m0() stress in thetendon immediately after tensioning ortransfer Pm0 = Ap · 0.75 · ƒpk = 28.5 · 10−4 · 0.75 · 1770 = 3783.4 kN
Pm0 = Ap · 0.85 · ƒp0,1k = 28.5 · 10−4 · 0.85 · 1520 = 3682.2 kN
→ Pm0 = 3682.2 kN and σp,m0 = 1292 N/mm2
Further calculations for the distribution of prestress forces and stressesalong the beam are not in the scope of this benchmark and will not bedescribed here. The complete diagram can be seen in benchmark 17,after the consideration of losses at anchorage and due to friction, ascalculated by SOFiSTiK. There the values of σp,m = 1368 N/mm2
and Pm0 = 3682.2 kN can be visualised.
In this benchmark the beam number 10010 is analysed therefore theprestressing force is obtained from TENDON:
P0 = 3653 kN
σp,0 = 1281.755 MP
Calculating the prestressing losses due relaxation
According to EN 1992-1-1, 3.3.2 (5), the value of ρ1000 is expressedas a percentage ratio of the initial stress and is obtained for an initialstress equal to 0.7 · ƒp, where ƒp is the actual tensile strength of theprestressing steel samples. For design calculations, the characteristictensile strength (ƒpk) is used.
μ =σp0
ƒpk=1281.755
1770= 0.724155 ≥ μmn = 0.55
The relaxation loss may be obtained from the manufactures test certifi-cates or defined as percentage ratio of the variation of the prestressingstress over the initial prestressing stress, should be determined by ap-plying next expression:EC2-1-1, 3.3.2 (7): Eq. 3.29
Δσpr
σp= 0.66 · ρ1000 · e9.1·μ ·
�
t
1000
�0.75·(1−μ)· 10−5
t = 1000 h→�
t
1000
�0.75·(1−μ)= 1.00
The values for ρ1000 can be either assumed equal to 8% for Class 1,2.5% for Class 2, and 4% for Class 3, or taken from the certificate.EC2-1-1, 3.3.2 (6)
For prestressing steel Y 1570/1770→ ρ1000 = 2.5 %
The relaxation is checked for μ = 0.7 and for μ = 0.72415
Δσpr
σp= 0.66 · ρ1000 · e9.1·0.70 · 10−5 · 100 = 0.963695 %
Δσpr
σp= 0.66 · ρ1000 · e9.1·0.724155 · 10−5 · 100 = 1.200616 %
168 VERiFiCATiON MANUAL - Design Code Benchmarks | SOFiSTiK 2018
DCE-EN22: Stress Relaxation of Prestressing Steel - EN 1992-1-1
Δσpr = σp · 1.200616 %
Δσpr = 1281.755 · 1.200616 % = 15.388 MP
AQB reduces the initial stress according to DIN 1045-1: DIN 1045-1 8.7.3 (6)
ΔPc+s+r = Ap
εcs · Ep + Δσpr +Ep
Ecm· ϕ(t, t0) · σc,QP
1 +Ep
Ecm·Ap
Ac
�
1 +Ac
c· z2
cp
�
[1 + 0.8 · ϕ(t, t0)]DIN 1045-1 8.7.3 (6): ΔPc+s+r time de-pendent losses of prestress
Creep and shrinkage is not taken into account therefore we have:
εcs · Ep = 0
Ep
Ecm· ϕ(t, t0) · σc,QP = 0
1 + 0.8 · ϕ(t, t0) = 1
Δσp,c+s+r =15.388
1 +195000
34077·28.5 · 10−4
0.9926·�
1 +0.9926
0.08214· 0.39012
�
Δσp,c+s+r =15.388
1.046644= 14.70 MP
Now we have:
σp0 = σpg0 − 0.3 · Δσp,c+s+r
σp0 = 1281.755 − 0.3 · 14.70 = 1277.345 MP DIN 1045-1 8.7.3 (6)
Now with the reduced stress the μ value is calculated again (iteration):
μ =σp0
ƒpk=1277.345
1770= 0.72166 ≥ μmn = 0.55
Δσpr
σp= 0.66 · ρ1000 · e9.1·0.72166 · 10−5 · 100 = 1.1736 %
Δσpr = 1281.755 · 1.1736% = 15.043 MP
The total loss:
Δσpr,tot = Δσpr,t + Δσpr,c
Δσpr,t = Δσpr = 15.043 MP
Δσpr,c = (εk0 + εky · zcp − εkz · ycp) · Ep εk0, εky and εkz - tendon strain
Δσpr,c = (1.212 · 10−6 + 5.673 · 10−6 · 0.39) · 1.95 · 108/1000
Δσpr,c = 0.667968 MP
Δσpr,tot = 15.043 − 0.667968 = 14.37 MP
ΔPpr = Δσpr,tot · Ap = 14.37 · 28.5 · 10−4 = 40.9545 kN
Prestress force loss in [%]:
SOFiSTiK 2018 | VERiFiCATiON MANUAL - Design Code Benchmarks 169

DCE-EN22: Stress Relaxation of Prestressing Steel - EN 1992-1-1
ΔPpr[%] =ΔPpr
P0
ΔPpr[%] =40.9545
3653= 0.01120 · 100% = 1.12 %
170 VERiFiCATiON MANUAL - Design Code Benchmarks | SOFiSTiK 2018
DCE-EN22: Stress Relaxation of Prestressing Steel - EN 1992-1-1
24.5 Conclusion
This example shows the calculation of the time dependent losses due to relaxation. It has been shownthat the reference solution and the AQB solution are in very good agreement.
24.6 Literature
[6] EN 1992-1-1: Eurocode 2: Design of concrete structures, Part 1-1: General rules and rules forbuildings. CEN. 2004.
SOFiSTiK 2018 | VERiFiCATiON MANUAL - Design Code Benchmarks 171

DCE-EN22: Stress Relaxation of Prestressing Steel - EN 1992-1-1
172 VERiFiCATiON MANUAL - Design Code Benchmarks | SOFiSTiK 2018
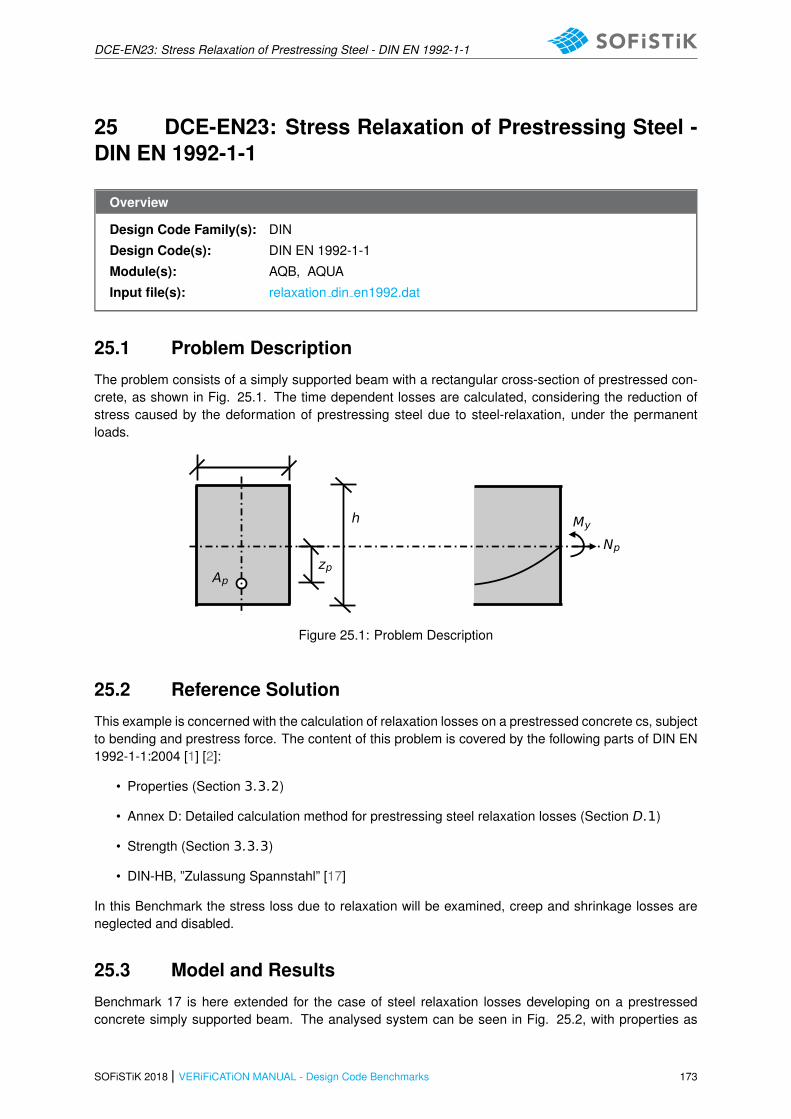
DCE-EN23: Stress Relaxation of Prestressing Steel - DIN EN 1992-1-1
25 DCE-EN23: Stress Relaxation of Prestressing Steel -DIN EN 1992-1-1
Overview
Design Code Family(s): DIN
Design Code(s): DIN EN 1992-1-1
Module(s): AQB, AQUA
Input file(s): relaxation din en1992.dat
25.1 Problem Description
The problem consists of a simply supported beam with a rectangular cross-section of prestressed con-crete, as shown in Fig. 25.1. The time dependent losses are calculated, considering the reduction ofstress caused by the deformation of prestressing steel due to steel-relaxation, under the permanentloads.
My
Np
Ap
h
zp
Figure 25.1: Problem Description
25.2 Reference Solution
This example is concerned with the calculation of relaxation losses on a prestressed concrete cs, subjectto bending and prestress force. The content of this problem is covered by the following parts of DIN EN1992-1-1:2004 [1] [2]:
• Properties (Section 3.3.2)
• Annex D: Detailed calculation method for prestressing steel relaxation losses (Section D.1)
• Strength (Section 3.3.3)
• DIN-HB, ”Zulassung Spannstahl” [17]
In this Benchmark the stress loss due to relaxation will be examined, creep and shrinkage losses areneglected and disabled.
25.3 Model and Results
Benchmark 17 is here extended for the case of steel relaxation losses developing on a prestressedconcrete simply supported beam. The analysed system can be seen in Fig. 25.2, with properties as
SOFiSTiK 2018 | VERiFiCATiON MANUAL - Design Code Benchmarks 173
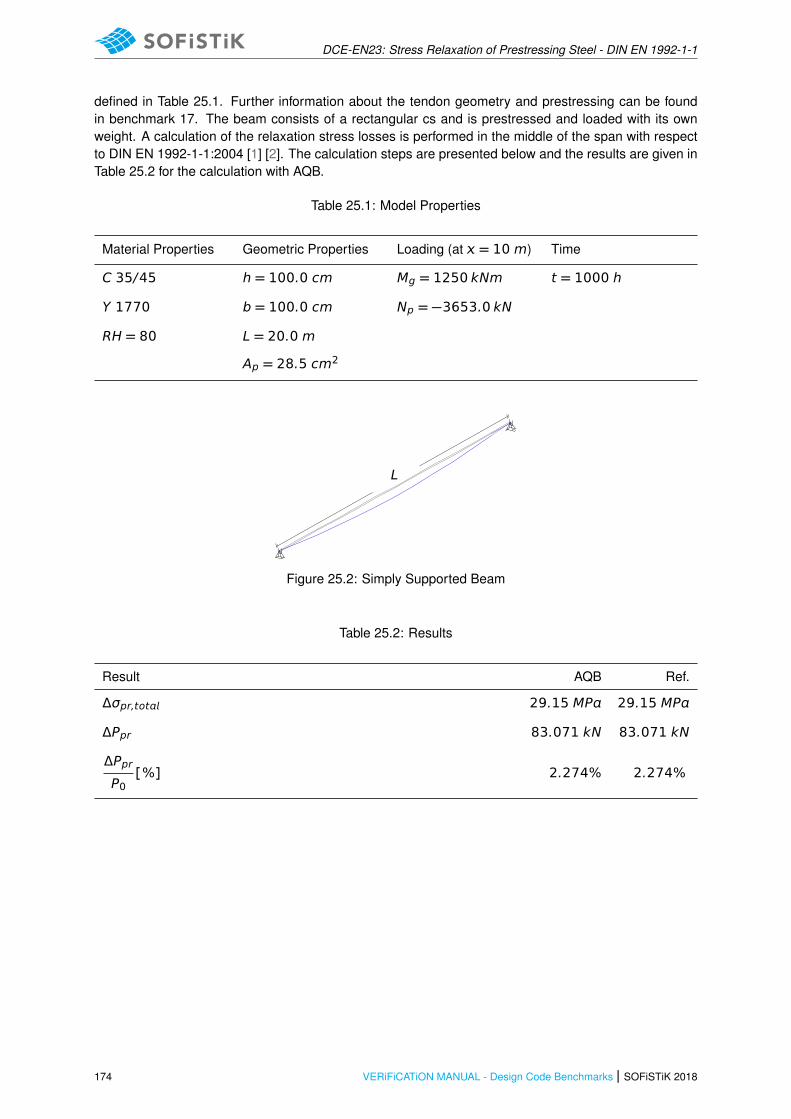
DCE-EN23: Stress Relaxation of Prestressing Steel - DIN EN 1992-1-1
defined in Table 25.1. Further information about the tendon geometry and prestressing can be foundin benchmark 17. The beam consists of a rectangular cs and is prestressed and loaded with its ownweight. A calculation of the relaxation stress losses is performed in the middle of the span with respectto DIN EN 1992-1-1:2004 [1] [2]. The calculation steps are presented below and the results are given inTable 25.2 for the calculation with AQB.
Table 25.1: Model Properties
Material Properties Geometric Properties Loading (at = 10 m) Time
C 35/45 h = 100.0 cm Mg = 1250 kNm t = 1000 h
Y 1770 b = 100.0 cm Np = −3653.0 kN
RH = 80 L = 20.0 m
Ap = 28.5 cm2
L
Figure 25.2: Simply Supported Beam
Table 25.2: Results
Result AQB Ref.
Δσpr,tot 29.15 MP 29.15 MP
ΔPpr 83.071 kN 83.071 kN
ΔPpr
P0[%] 2.274% 2.274%
174 VERiFiCATiON MANUAL - Design Code Benchmarks | SOFiSTiK 2018
DCE-EN23: Stress Relaxation of Prestressing Steel - DIN EN 1992-1-1
25.4 Design Process1
Design with respect to DIN EN 1992-1-1:2004 [1] [2]
• Material:
Concrete: C 35/45 3.1: Concrete
Ecm = 34077 N/mm2 3.1.2: Tab. 3.1: Ecm, ƒck and ƒcm forC 35/45
ƒck = 35 N/mm2
ƒcm = 43 N/mm2
Prestressing Steel: Y 1770 3.3: Prestressing Steel
Ep = 195000 N/mm2 3.3.6 (3): Ep for wires
ƒpk = 1770 N/mm2 3.3.2, 3.3.3: ƒpk Characteristic tensilestrength of prestressing steel
ƒp0,1k = 1520 N/mm2 3.3.2, 3.3.3: ƒp0,1k 0.1% proof-stress ofprestressing steel, yield strength
Prestressing system: BBV L19 150 mm2
19 wires with area of 150mm2 each, giving a total of Ap = 28.5 cm2
• Cross-section:
Ac = 1.0 · 1.0 = 1 m2
Diameter of duct ϕdct = 97 mm
Ratio αE,p = Ep / Ecm = 195000 / 34077 = 5.7223
Ac,netto = Ac − π · (ϕdct/2)2 = 0.9926 m2
Ade = Ac + Ap · αE,p = 1.013 m2
• Prestressing forces and stresses
The force applied to a tendon, i.e. the force at the active end duringtensioning, should not exceed the following value
Pm = Ap · σp,m
where σp,m =mn(0.8 · ƒpk; 0.90 · ƒp0,1k)
Pm = Ap · 0.80 · ƒpk = 28.5 · 10−4 · 0.80 · 1770 = 4035.6 kN
Pm = Ap · 0.90 · ƒp0,1k = 28.5 · 10−4 · 0.90 · 1520 = 3898.8 kN
→ Pm = 3898.8 kN and σp,m = 1368 N/mm2
The value of the initial prestress force at time t = t0 applied to theconcrete immediately after tensioning and anchoring should not exceedthe following value 5.10.3 (2): Prestress force
1The tools used in the design process are based on steel stress-strain diagrams, asdefined in [1] 3.3.6: Fig. 3.10
SOFiSTiK 2018 | VERiFiCATiON MANUAL - Design Code Benchmarks 175

DCE-EN23: Stress Relaxation of Prestressing Steel - DIN EN 1992-1-1
Pm0() = Ap · σp,m0()5.10.3 (2): Eq. 5.43: Pm0 initial pre-stress force at time t = t0
where σp,m0() =min�
0.75ƒpk; 0.85ƒp0,1k
(NDP) 5.10.3 (2): σp,m0() stress in thetendon immediately after tensioning ortransfer Pm0 = Ap · 0.75 · ƒpk = 28.5 · 10−4 · 0.75 · 1770 = 3783.4 kN
Pm0 = Ap · 0.85 · ƒp0,1k = 28.5 · 10−4 · 0.85 · 1520 = 3682.2 kN
→ Pm0 = 3682.2 kN and σp,m0 = 1292 N/mm2
Further calculations for the distribution of prestress forces and stressesalong the beam are not in the scope of this benchmark and will not bedescribed here. The complete diagram can be seen in benchmark 17,after the consideration of losses at anchorage and due to friction, ascalculated by SOFiSTiK. There the values of σp,m = 1368 N/mm2
and Pm0 = 3682.2 kN can be visualised.
In this benchmark the beam number 10010 is analysed therefore theprestressing force is obtained from TENDON:
P0 = 3653 kN
σp,0 = 1281.755 MP
Calculating the prestressing losses due relaxation
According to DIN EN 1992-1-1, 3.3.2 (5), the value of ρ1000 is ex-pressed as a percentage ratio of the initial stress and is obtained foran initial stress equal to 0.7 · ƒp, where ƒp is the actual tensile strengthof the prestressing steel samples. For design calculations, the charac-teristic tensile strength (ƒpk) is used.
μ =σp0
ƒpk=1281.755
1770= 0.724155 ≥ μmn = 0.55
The formulas in section DIN EN 1992-1-1, 3.3.2 (7) are not usedfor the calculation, according to DiBt [17] for DIN EN 1992-1-1 [6] therelaxation values are obtained from Table 25.3.
Please refer to Fig. 25.3 to see the differences between DIN EN 1992-1-1 and EN 1992-1-1 (for t=500000 h).
Table 25.3: Relaxation values per hour
μ = R/Rn 1 10 200 1000 5000 5 · 105 1 · 106
0.45 < 1 %
0.50 -
0.55 - 1.0 1.2
0.60 - 1.2 2.5 2.8
0.65 - 1.3 2.0 4.5 5.0
0.70 - 1.0 2.0 3.0 6.5 7.0
0.75 - 1.2 2.5 3.0 4.5 9.0 10.0
176 VERiFiCATiON MANUAL - Design Code Benchmarks | SOFiSTiK 2018
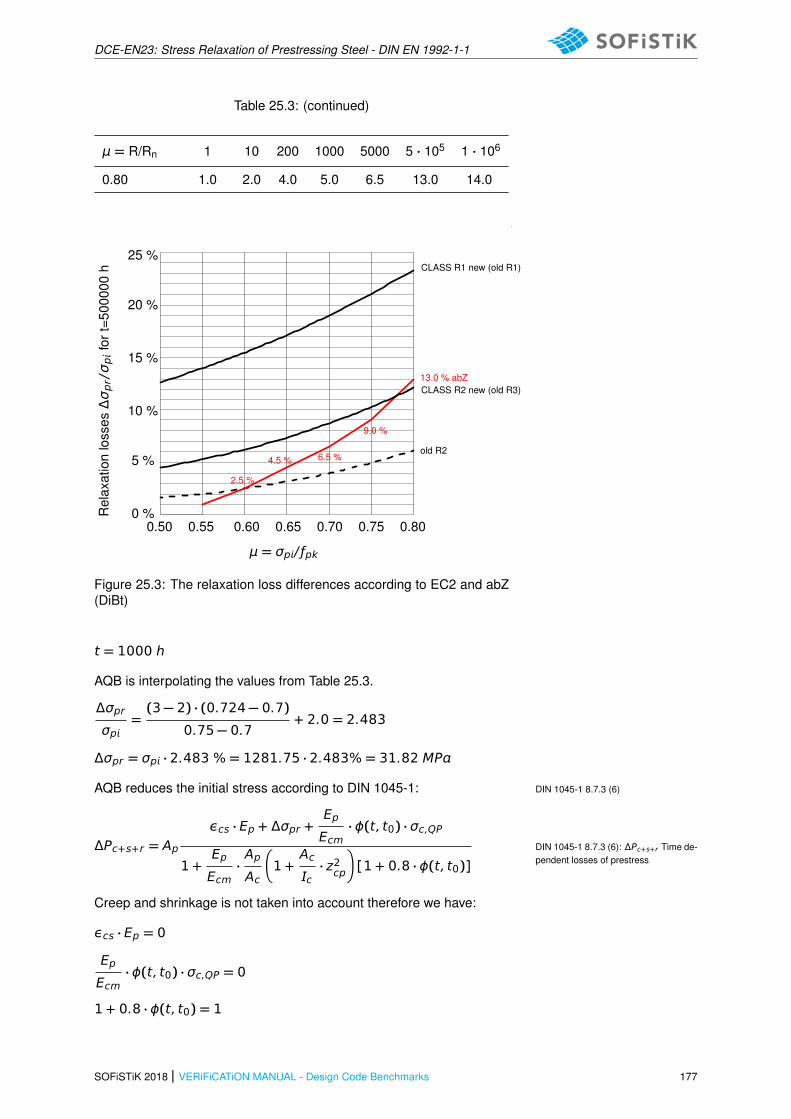
DCE-EN23: Stress Relaxation of Prestressing Steel - DIN EN 1992-1-1
Table 25.3: (continued)
μ = R/Rn 1 10 200 1000 5000 5 · 105 1 · 106
0.80 1.0 2.0 4.0 5.0 6.5 13.0 14.0
0.50 0.55 0.60 0.65 0.70 0.75 0.800 %
5 %
10 %
15 %
20 %
25 %
μ = σp/ ƒpk
Rel
axat
ion
loss
esΔσpr/σ
pfo
rt=5
0000
0h CLASS R1 new (old R1)
CLASS R2 new (old R3)
old R2
2.5 %
4.5 % 6.5 %
9.0 %
13.0 % abZ
Figure 25.3: The relaxation loss differences according to EC2 and abZ(DiBt)
t = 1000 h
AQB is interpolating the values from Table 25.3.
Δσpr
σp=(3 − 2) · (0.724 − 0.7)
0.75 − 0.7+ 2.0 = 2.483
Δσpr = σp · 2.483 % = 1281.75 · 2.483% = 31.82 MP
AQB reduces the initial stress according to DIN 1045-1: DIN 1045-1 8.7.3 (6)
ΔPc+s+r = Ap
εcs · Ep + Δσpr +Ep
Ecm· ϕ(t, t0) · σc,QP
1 +Ep
Ecm·Ap
Ac
�
1 +Ac
c· z2
cp
�
[1 + 0.8 · ϕ(t, t0)]DIN 1045-1 8.7.3 (6): ΔPc+s+r Time de-pendent losses of prestress
Creep and shrinkage is not taken into account therefore we have:
εcs · Ep = 0
Ep
Ecm· ϕ(t, t0) · σc,QP = 0
1 + 0.8 · ϕ(t, t0) = 1
SOFiSTiK 2018 | VERiFiCATiON MANUAL - Design Code Benchmarks 177
DCE-EN23: Stress Relaxation of Prestressing Steel - DIN EN 1992-1-1
Δσp,c+s+r =31.82
1 +195000
34077·28.5 · 10−4
0.9926·�
1 +0.9926
0.08214· 0.39012
�
Δσp,c+s+r =31.82
1.046644= 30.402 MP
Now we have:
σp0 = σpg0 − 0.3 · Δσp,c+s+r
σp0 = 1281.755 − 0.3 · 30.4020 = 1272.631 MPDIN 1045-1 8.7.3 (6)
Now with the reduced stress the μ value is calculated again (iteration):
μ =σp0
ƒpk=1272.631
1770= 0.719 ≥ μmn = 0.55
Interpolating the relaxation values from Table 25.3:
Δσpr
σp=(3 − 2) · (0.719 − 0.7)
0.75 − 0.7+ 2.0 = 2.38 %
Δσpr = 1281.755 · 2.38% = 30.50 MP
The total loss:
Δσpr,tot = Δσpr,t + Δσpr,c
Δσpr,t = Δσpr = 30.5093 MP
Δσpr,c = (εk0 + εky · zcp − εkz · ycp) · Epεk0, εky and εkz - tendon strain
Δσpr,c = (2.457 · 10−6 + 1.15 · 10−5 · 0.39) · 1.95 · 108/1000
Δσpr,c = 1.354 MP
Δσpr,tot = 30.5 − 1.354 = 29.15 MP
ΔPpr = Δσpr,tot · Ap = 29.15 · 28.5 · 10−4 · 1000 = 83.071 kN
Prestress-force loss in [%]:
ΔPpr[%] =ΔPpr
P0
ΔPpr[%] =83.08
3653= 0.02274 · 100% = 2.274 %
178 VERiFiCATiON MANUAL - Design Code Benchmarks | SOFiSTiK 2018

DCE-EN23: Stress Relaxation of Prestressing Steel - DIN EN 1992-1-1
25.5 Conclusion
This example shows the calculation of the time dependent losses due to relaxation. It has been shownthat the reference solution and the AQB solution are in very good agreement.
25.6 Literature
[1] DIN EN 1992-1-1/NA: Eurocode 2: Design of concrete structures, Part 1-1/NA: General rules andrules for buildings - German version EN 1992-1-1:2005 (D), Nationaler Anhang Deutschland -Stand Februar 2010. CEN. 2010.
[2] F. Fingerloos, J. Hegger, and K. Zilch. DIN EN 1992-1-1 Bemessung und Konstruktion vonStahlbeton- und Spannbetontragwerken - Teil 1-1: Allgemeine Bemessungsregeln und Regelnfur den Hochbau. BVPI, DBV, ISB, VBI. Ernst & Sohn, Beuth, 2012.
[6] EN 1992-1-1: Eurocode 2: Design of concrete structures, Part 1-1: General rules and rules forbuildings. CEN. 2004.
[17] DiBt. Allgemeine bauaufsichtliche Zulassung. Deutsches Institut fur Bautechnik. 2015.
SOFiSTiK 2018 | VERiFiCATiON MANUAL - Design Code Benchmarks 179

DCE-EN23: Stress Relaxation of Prestressing Steel - DIN EN 1992-1-1
180 VERiFiCATiON MANUAL - Design Code Benchmarks | SOFiSTiK 2018

DCE-EN24: Lateral Torsional Buckling
26 DCE-EN24: Lateral Torsional Buckling
Overview
Design Code Family(s): EN
Design Code(s): EN 1993-1-1
Module(s): BDK
Input file(s): eccs 119 example 5.dat
26.1 Problem Description
The problem consists of a simply supported beam with a steel I-section, which is subjected to com-pression and biaxial bending, as shown in Fig. 26.1. The beam is checked against lateral torsionalbuckling.
My,Ed
Mz,Ed
qz
My,Ed
NEd
NEd
L
Figure 26.1: Problem Description
26.2 Reference Solution
This example is concerned with the buckling resistance of steel members. It deals with the spatialbehavior of the beam and the occurrence of lateral torsional buckling as a potential mode of failure. Thecontent of this problem is covered by the following parts of EN 1993-1-1:2005 [7]:
• Structural steel (Section 3.2 )
• Classification of cross-sections (Section 5.5)
SOFiSTiK 2018 | VERiFiCATiON MANUAL - Design Code Benchmarks 181
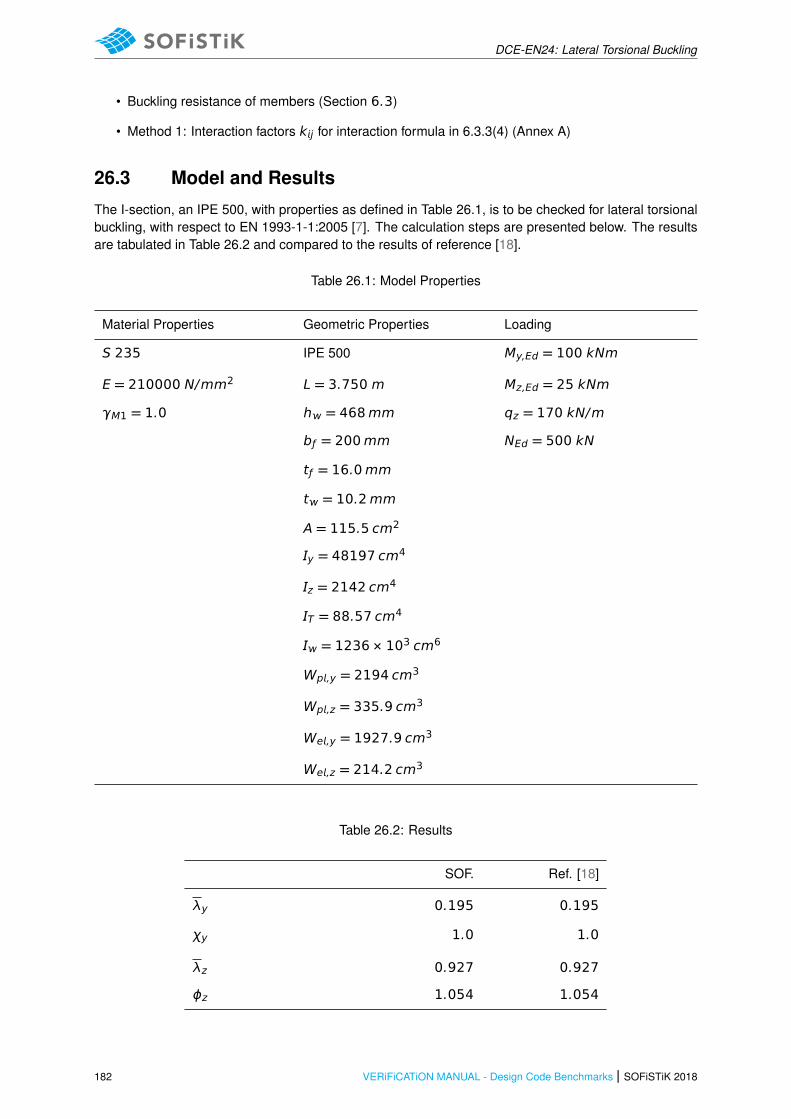
DCE-EN24: Lateral Torsional Buckling
• Buckling resistance of members (Section 6.3)
• Method 1: Interaction factors kj for interaction formula in 6.3.3(4) (Annex A)
26.3 Model and Results
The I-section, an IPE 500, with properties as defined in Table 26.1, is to be checked for lateral torsionalbuckling, with respect to EN 1993-1-1:2005 [7]. The calculation steps are presented below. The resultsare tabulated in Table 26.2 and compared to the results of reference [18].
Table 26.1: Model Properties
Material Properties Geometric Properties Loading
S 235 IPE 500 My,Ed = 100 kNm
E = 210000 N/mm2 L = 3.750 m Mz,Ed = 25 kNm
γM1 = 1.0 h = 468mm qz = 170 kN/m
bƒ = 200mm NEd = 500 kN
tƒ = 16.0mm
t = 10.2mm
A = 115.5 cm2
y = 48197 cm4
z = 2142 cm4
T = 88.57 cm4
= 1236 × 103 cm6
Wp,y = 2194 cm3
Wp,z = 335.9 cm3
We,y = 1927.9 cm3
We,z = 214.2 cm3
Table 26.2: Results
SOF. Ref. [18]
λy 0.195 0.195
χy 1.0 1.0
λz 0.927 0.927
ϕz 1.054 1.054
182 VERiFiCATiON MANUAL - Design Code Benchmarks | SOFiSTiK 2018

DCE-EN24: Lateral Torsional Buckling
Table 26.2: (continued)
SOF. Ref. [18]
χz 0.644 0.644
μy 1.000 1.000
μz 0.937 0.937
y 1.138 1.138
z 1.500 1.500
Cmy,0 1.001 0.999
Cmz,0 0.771 0.771
Cmy 1.001 1.000
Cmz 0.771 0.771
λ0 0.759 0.757
C1 1.194 1.2
CmLT 1.139 1.137
λLT 0.695 0.691
LT 0.825 0.822
χLT 0.787 0.789
χLT,mod 0.821 0.826
Cyy 0.981 0.981
Cyz 0.862 0.863
Czy 0.842 0.843
Czz 1.013 1.014
nm − y (Eq.6.61 [7]) 0.966 0.964
nm − z (Eq.6.62 [7]) 0.868 0.870
SOFiSTiK 2018 | VERiFiCATiON MANUAL - Design Code Benchmarks 183

DCE-EN24: Lateral Torsional Buckling
26.4 Design Process1
Design Load:
MzEd = 25 kNm
MyEd = −100 kNm at the start and end of the beam
MyEd = 199 kNm at the middle of the beam
NEd = 25 kNm
The cross-section is classified as Class 1, as demonstrated in [18].Tab. 5.5: Classification of cross-section
Ncr,y =π2 Ey
L2= 71035 kN6.3.1.2 (1): Ncr is the elastic critical
force for the relevant buckling mode
λy =
√
√
√
A ƒy
Ncr,y= 0.1956.3.1.2 (1): λ non dimensional slender-
ness for class 1 cross-sections
λy < 0.2 thus χy = 1.06.3.1.2 (4): λ ≤ 0.2 buckling effectsmay be ignored
Ncr,z =π2 Ez
L2= 3157 kN
λz =
√
√
√
A ƒy
Ncr,z= 0.927
z = 0.5h
1 + αz�
λz − 0.2�
+ λ2z
i
for rolled I-sections with h / b > 1.2 and buckling about z-z axis →buckling curve b
for buckling curve b→ αz = 0.346.3.1.2 (2): Table 6.1: Imperfection fac-tors for buckling curves
z = 1.054
χz =1
z +r
2z− λ
2z
= 0.644 ≤ 1.06.3.1.2 (1): Eq. 6.49: χz reduction fac-tor for buckling
The stability verification will be done according to Method 1-Annex Aof EN 1993-1-1:2005 [7]. Therefore we need to identify the interactionfactors according to tables A.1-A.2 of Annex A, EN 1993-1-1:2005 [7].
Auxiliary terms:
μy =
1 −NEd
Ncr,y
1 − χyNEd
Ncr,y
= 1.0Annex A: Tab. A.1: Interaction factorskj (6.3.3(4)), Auxiliary terms
1The sections mentioned in the margins refer to EN 1993-1-1:2005 [7] unless other-wise specified.
184 VERiFiCATiON MANUAL - Design Code Benchmarks | SOFiSTiK 2018
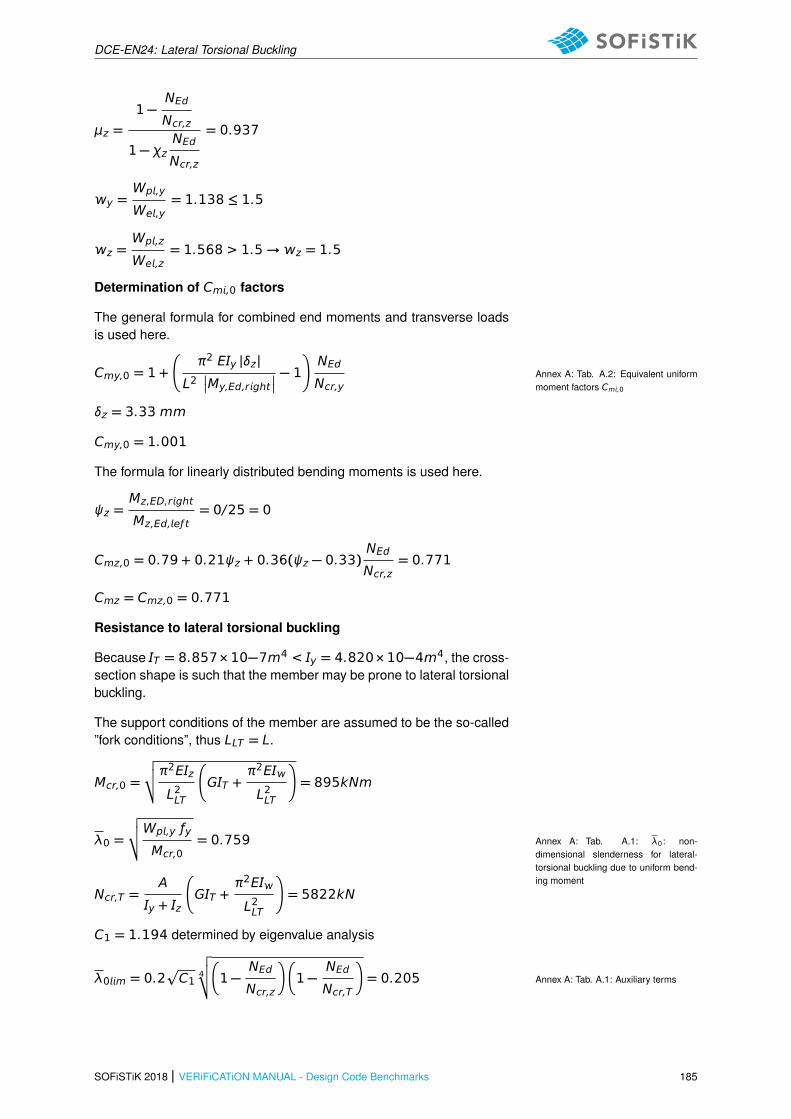
DCE-EN24: Lateral Torsional Buckling
μz =1 −
NEd
Ncr,z
1 − χzNEd
Ncr,z
= 0.937
y =Wp,y
We,y= 1.138 ≤ 1.5
z =Wp,z
We,z= 1.568 > 1.5→z = 1.5
Determination of Cm,0 factors
The general formula for combined end moments and transverse loadsis used here.
Cmy,0 = 1 +
�
π2 Ey |δz |
L2�
�My,Ed,rght
�
�
− 1�
NEd
Ncr,yAnnex A: Tab. A.2: Equivalent uniformmoment factors Cm,0
δz = 3.33 mm
Cmy,0 = 1.001
The formula for linearly distributed bending moments is used here.
ψz =Mz,ED,rght
Mz,Ed,eƒ t= 0/25 = 0
Cmz,0 = 0.79 + 0.21ψz + 0.36(ψz − 0.33)NEd
Ncr,z= 0.771
Cmz = Cmz,0 = 0.771
Resistance to lateral torsional buckling
Because T = 8.857×10⁻⁷m4 < y = 4.820×10⁻⁴m4, the cross-section shape is such that the member may be prone to lateral torsionalbuckling.
The support conditions of the member are assumed to be the so-called”fork conditions”, thus LLT = L.
Mcr,0 =
√
√
√
π2Ez
L2LT
�
GT +π2E
L2LT
�
= 895kNm
λ0 =
√
√
√
Wp,y ƒy
Mcr,0= 0.759 Annex A: Tab. A.1: λ0: non-
dimensional slenderness for lateral-torsional buckling due to uniform bend-ing moment
Ncr,T =A
y + z
�
GT +π2E
L2LT
�
= 5822kN
C1 = 1.194 determined by eigenvalue analysis
λ0m = 0.2p
C14
√
√
√
�
1 −NEd
Ncr,z
��
1 −NEd
Ncr,T
�
= 0.205 Annex A: Tab. A.1: Auxiliary terms
SOFiSTiK 2018 | VERiFiCATiON MANUAL - Design Code Benchmarks 185
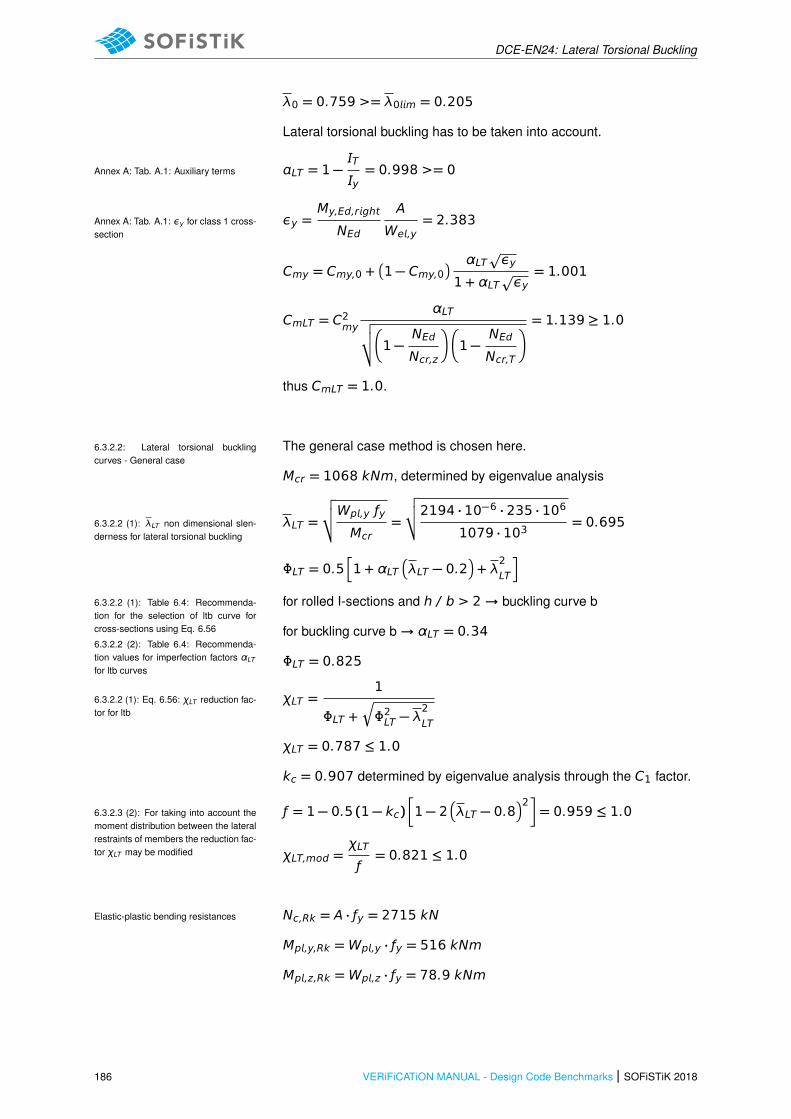
DCE-EN24: Lateral Torsional Buckling
λ0 = 0.759 >= λ0m = 0.205
Lateral torsional buckling has to be taken into account.
LT = 1 −T
y= 0.998 >= 0Annex A: Tab. A.1: Auxiliary terms
εy =My,Ed,rght
NEd
A
We,y= 2.383Annex A: Tab. A.1: εy for class 1 cross-
section
Cmy = Cmy,0 +�
1 − Cmy,0� αLT
p
εy
1 + αLTp
εy= 1.001
CmLT = C2my
αLT√
√
√
�
1 −NEd
Ncr,z
��
1 −NEd
Ncr,T
�
= 1.139 ≥ 1.0
thus CmLT = 1.0.
The general case method is chosen here.6.3.2.2: Lateral torsional bucklingcurves - General case
Mcr = 1068 kNm, determined by eigenvalue analysis
λLT =
√
√
√
Wp,y ƒy
Mcr=
√
√
√2194 · 10−6 · 235 · 106
1079 · 103= 0.6956.3.2.2 (1): λLT non dimensional slen-
derness for lateral torsional buckling
LT = 0.5h
1 + αLT�
λLT − 0.2�
+ λ2LT
i
for rolled I-sections and h / b > 2→ buckling curve b6.3.2.2 (1): Table 6.4: Recommenda-tion for the selection of ltb curve forcross-sections using Eq. 6.56
6.3.2.2 (2): Table 6.4: Recommenda-tion values for imperfection factors αLTfor ltb curves
for buckling curve b→ αLT = 0.34
LT = 0.825
χLT =1
LT +r
2LT − λ2LT
6.3.2.2 (1): Eq. 6.56: χLT reduction fac-tor for ltb
χLT = 0.787 ≤ 1.0
kc = 0.907 determined by eigenvalue analysis through the C1 factor.
ƒ = 1 − 0.5 (1 − kc)�
1 − 2�
λLT − 0.8�2�
= 0.959 ≤ 1.06.3.2.3 (2): For taking into account themoment distribution between the lateralrestraints of members the reduction fac-tor χLT may be modified χLT,mod =
χLT
ƒ= 0.821 ≤ 1.0
Nc,Rk = A · ƒy = 2715 kNElastic-plastic bending resistances
Mp,y,Rk =Wp,y · ƒy = 516 kNm
Mp,z,Rk =Wp,z · ƒy = 78.9 kNm
186 VERiFiCATiON MANUAL - Design Code Benchmarks | SOFiSTiK 2018
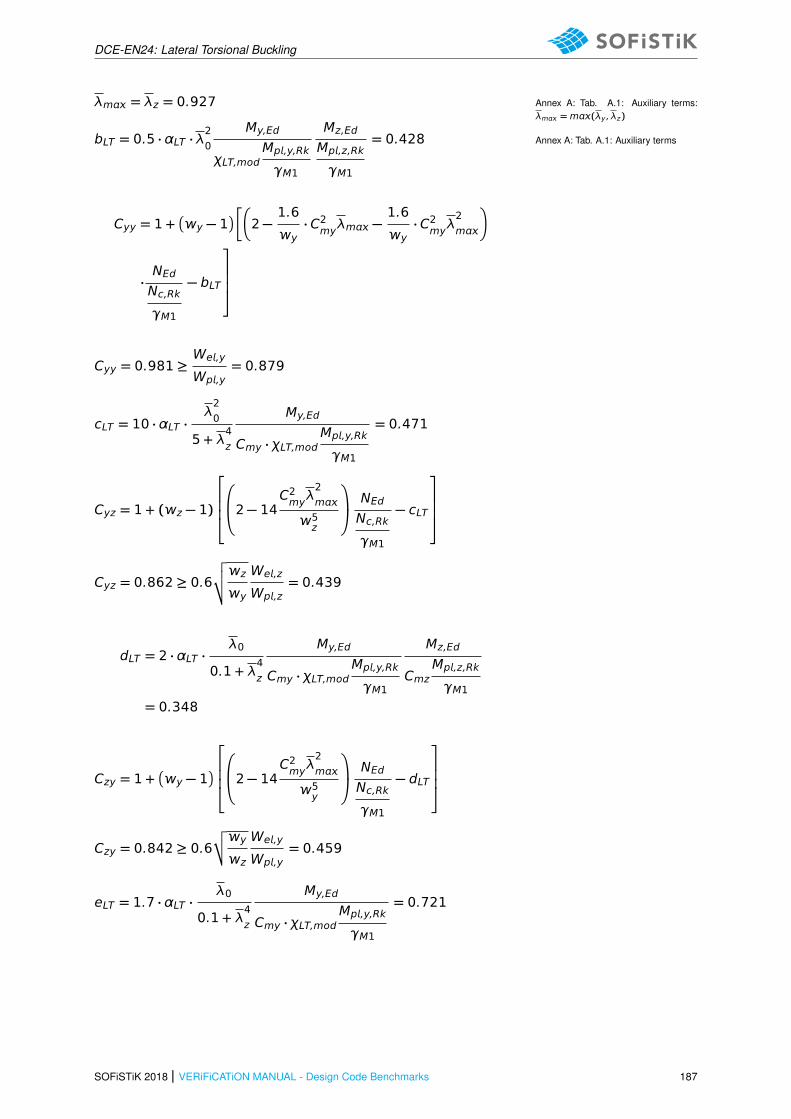
DCE-EN24: Lateral Torsional Buckling
λm = λz = 0.927 Annex A: Tab. A.1: Auxiliary terms:λm =m(λy , λz)
bLT = 0.5 · αLT · λ20
My,Ed
χLT,modMp,y,Rk
γM1
Mz,Ed
Mp,z,Rk
γM1
= 0.428 Annex A: Tab. A.1: Auxiliary terms
Cyy = 1 +�
y − 1�
��
2 −1.6
y· C2
myλm −
1.6
y· C2
myλ2m
�
·NEdNc,Rk
γM1
− bLT
Cyy = 0.981 ≥We,y
Wp,y= 0.879
cLT = 10 · αLT ·λ20
5 + λ4z
My,Ed
Cmy · χLT,modMp,y,Rk
γM1
= 0.471
Cyz = 1 + (z − 1)
2 − 14C2myλ2m
5z
NEdNc,Rk
γM1
− cLT
Cyz = 0.862 ≥ 0.6
√
√
√
z
y
We,z
Wp,z= 0.439
dLT = 2 · αLT ·λ0
0.1 + λ4z
My,Ed
Cmy · χLT,modMp,y,Rk
γM1
Mz,Ed
CmzMp,z,Rk
γM1= 0.348
Czy = 1 +�
y − 1�
2 − 14C2myλ2m
5y
NEdNc,Rk
γM1
− dLT
Czy = 0.842 ≥ 0.6√
√y
z
We,y
Wp,y= 0.459
eLT = 1.7 · αLT ·λ0
0.1 + λ4z
My,Ed
Cmy · χLT,modMp,y,Rk
γM1
= 0.721
SOFiSTiK 2018 | VERiFiCATiON MANUAL - Design Code Benchmarks 187
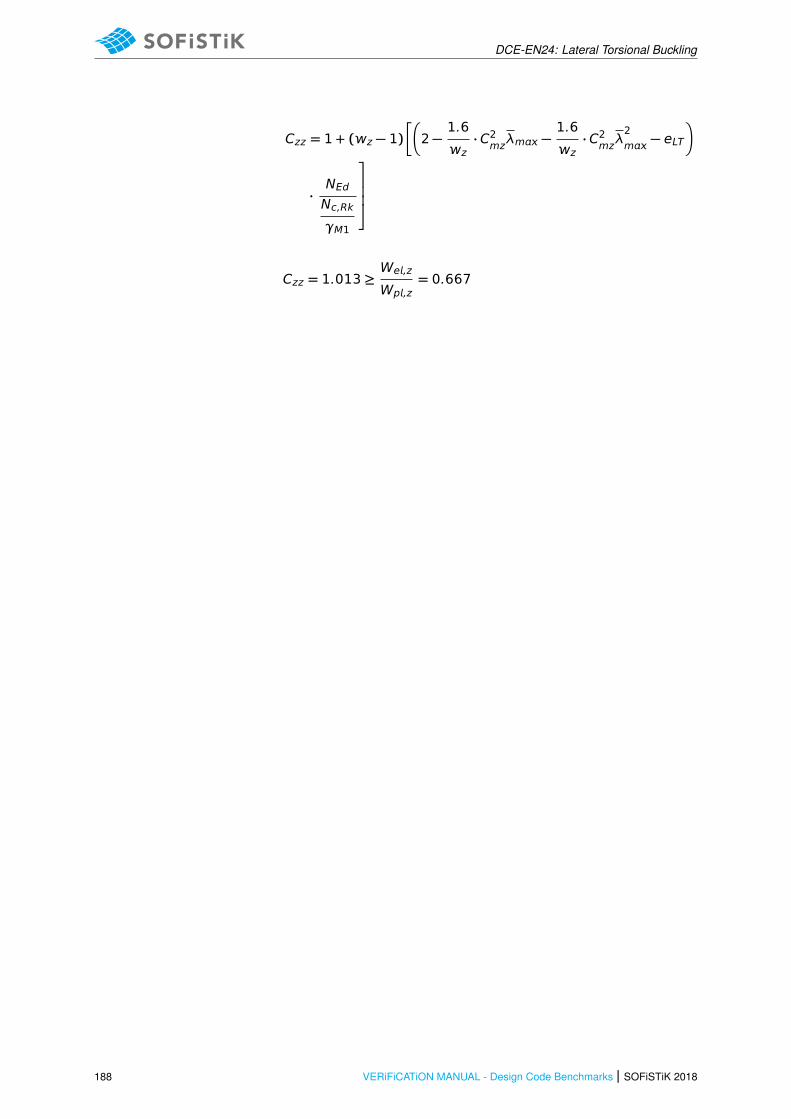
DCE-EN24: Lateral Torsional Buckling
Czz = 1 + (z − 1)��
2 −1.6
z· C2
mzλm −
1.6
z· C2
mzλ2m− eLT
�
·NEdNc,Rk
γM1
Czz = 1.013 ≥We,z
Wp,z= 0.667
188 VERiFiCATiON MANUAL - Design Code Benchmarks | SOFiSTiK 2018

DCE-EN24: Lateral Torsional Buckling
Verification 6.3.3 Uniform members in bending andaxial compression
According to 1993-1-1:2005, 6.3.3 (4), members which are subjected tocombined bending and axial compression should satisfy:
NEd
χyNc,Rk
γM1
+ μy
CmLT
χLT,mod
Cmy ·My,Ed�
1 −NEd
Ncr,y
�
Cyy ·Mp,y,Rk
γM1
+0.6
√
√
√
z
y
Cmz Mz,Ed�
1 −NEd
Ncr,z
�
CyzMp,z,Rk
γM1
6.3.3 (4): Eq. 6.61: Members which aresubjected to combined bending and ax-ial compression should satisfy:
500
1.02715
1.0
+ 1.0
1.139
0.821
1.001 · 198.9�
1 −500
71035
�
0.981516
1.0
+0.6
√
√
√1.500
1.138
0.771 · 25�
1 −500
3157
�
0.86278.9
1.0
= 0.966 ≤ 1.00
→ Satisfactory
NEd
χzNc,Rk
γM1
+ μz
0.6
√
√
√
y
z
CmLT
χLT,mod
Cmy ·My,Ed�
1 −NEd
Ncr,y
�
CzyMp,y,Rk
γM1
+Cmz Mz,Ed
�
1 −NEd
Ncr,z
�
CzzMp,z,Rk
γM1
6.3.3 (4): Eq. 6.62: Members which aresubjected to combined bending and ax-ial compression should satisfy:
500
0.6442715
1.0
+ 0.937
+0.6
√
√
√1.138
1.500
1.139
0.821
·1.001 · 198.9
�
1 −500
71035
�
0.842516
1.0
+0.771 · 25
�
1 −500
3157
�
1.01378.9
1.0
SOFiSTiK 2018 | VERiFiCATiON MANUAL - Design Code Benchmarks 189

DCE-EN24: Lateral Torsional Buckling
= 0.868 ≤ 1
→Satisfactory
190 VERiFiCATiON MANUAL - Design Code Benchmarks | SOFiSTiK 2018
DCE-EN24: Lateral Torsional Buckling
26.5 Conclusion
This example shows the ckeck for lateral torsional buckling of steel members. The small deviationsthat occur in some results come from the fact that there are some small differences in the sectionalvalues between SOFiSTiK and the reference solution. Therefore, these deviations are of no interest forthe specific verification process. In conclusion, it has been shown that the results are reproduced withexcellent accuracy.
26.6 Literature
[7] EN 1993-1-1: Eurocode 3: Design of concrete structures, Part 1-1: General rules and rules forbuildings. CEN. 2005.
[18] ECCS Technical Committee 8 Stability. Rules for Member Stability in EN 1993-1-1, Backgrounddocumentation and design guidelines. Tech. rep. No 119. European Convention for ConstructionalSteelwork (ECCS), 2006.
SOFiSTiK 2018 | VERiFiCATiON MANUAL - Design Code Benchmarks 191

DCE-EN24: Lateral Torsional Buckling
192 VERiFiCATiON MANUAL - Design Code Benchmarks | SOFiSTiK 2018
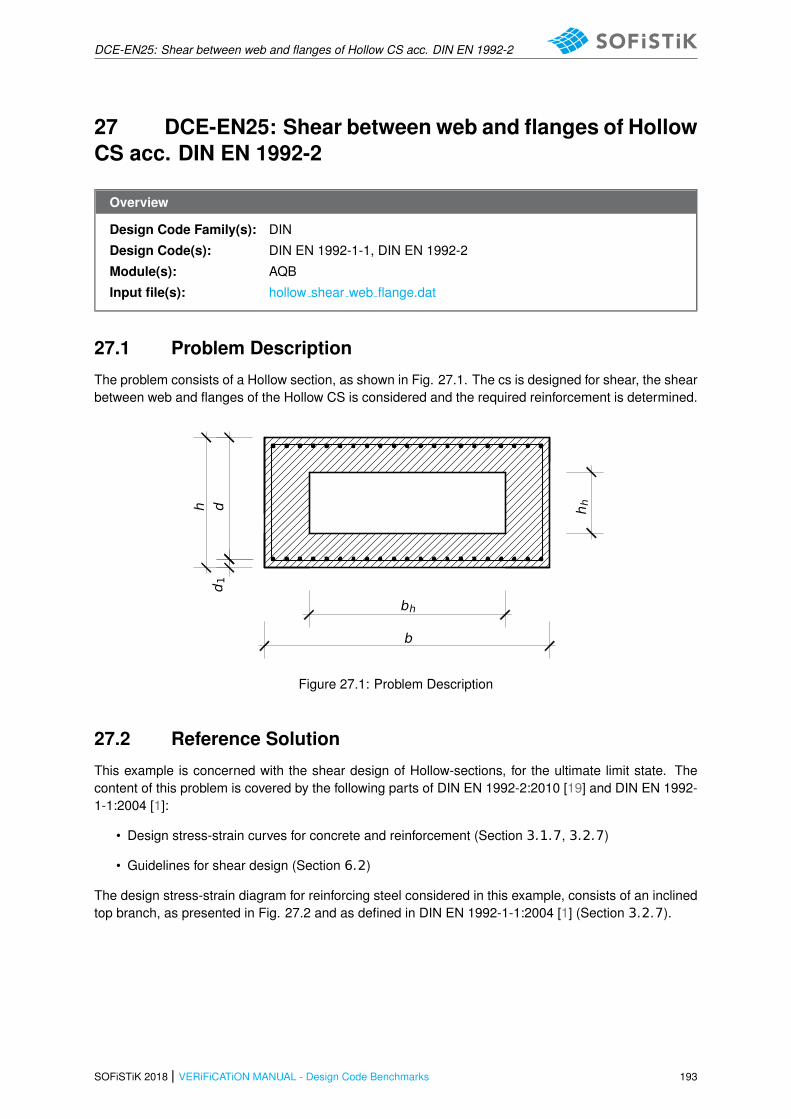
DCE-EN25: Shear between web and flanges of Hollow CS acc. DIN EN 1992-2
27 DCE-EN25: Shear between web and flanges of HollowCS acc. DIN EN 1992-2
Overview
Design Code Family(s): DIN
Design Code(s): DIN EN 1992-1-1, DIN EN 1992-2
Module(s): AQB
Input file(s): hollow shear web flange.dat
27.1 Problem Description
The problem consists of a Hollow section, as shown in Fig. 27.1. The cs is designed for shear, the shearbetween web and flanges of the Hollow CS is considered and the required reinforcement is determined.
b
bh
dd1
h hh
Figure 27.1: Problem Description
27.2 Reference Solution
This example is concerned with the shear design of Hollow-sections, for the ultimate limit state. Thecontent of this problem is covered by the following parts of DIN EN 1992-2:2010 [19] and DIN EN 1992-1-1:2004 [1]:
• Design stress-strain curves for concrete and reinforcement (Section 3.1.7, 3.2.7)
• Guidelines for shear design (Section 6.2)
The design stress-strain diagram for reinforcing steel considered in this example, consists of an inclinedtop branch, as presented in Fig. 27.2 and as defined in DIN EN 1992-1-1:2004 [1] (Section 3.2.7).
SOFiSTiK 2018 | VERiFiCATiON MANUAL - Design Code Benchmarks 193
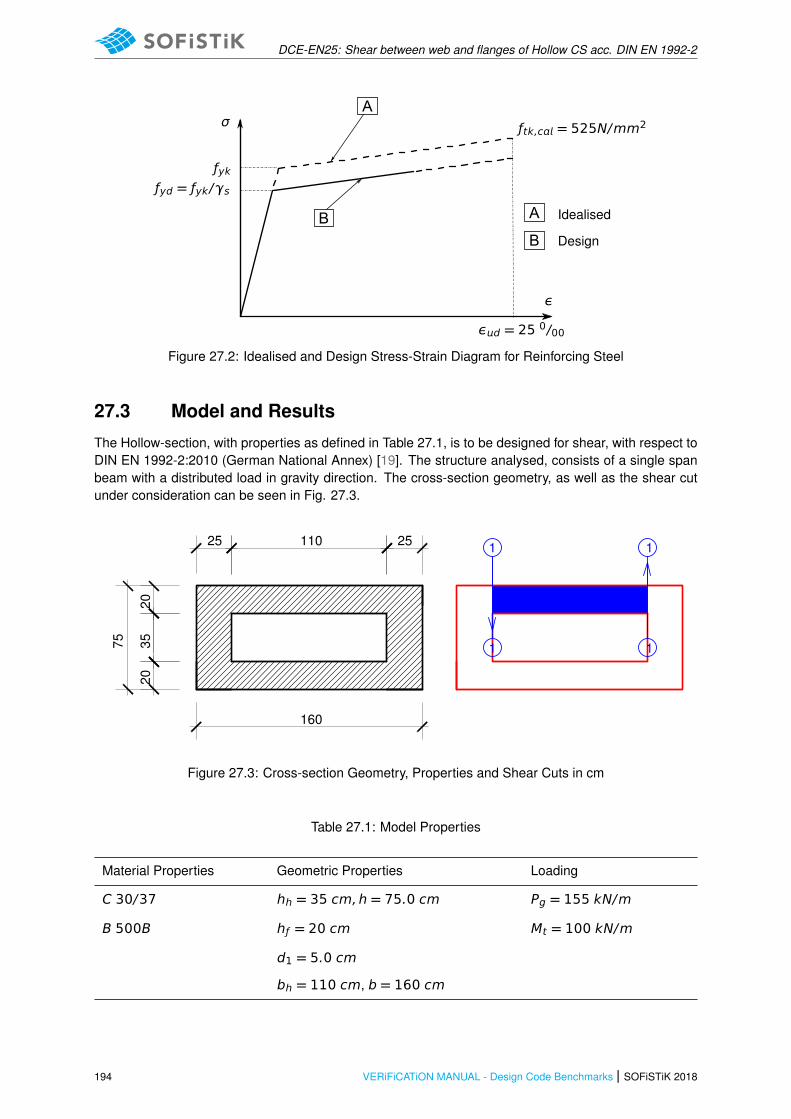
DCE-EN25: Shear between web and flanges of Hollow CS acc. DIN EN 1992-2
A
B A
B
Idealised
Design
ƒyk
ƒtk,c = 525N/mm2
ε
εd = 25 0/00
ƒyd = ƒyk/γs
σ
Figure 27.2: Idealised and Design Stress-Strain Diagram for Reinforcing Steel
27.3 Model and Results
The Hollow-section, with properties as defined in Table 27.1, is to be designed for shear, with respect toDIN EN 1992-2:2010 (German National Annex) [19]. The structure analysed, consists of a single spanbeam with a distributed load in gravity direction. The cross-section geometry, as well as the shear cutunder consideration can be seen in Fig. 27.3.
160
2020
3575
25 110 25
1
1
1
1
Figure 27.3: Cross-section Geometry, Properties and Shear Cuts in cm
Table 27.1: Model Properties
Material Properties Geometric Properties Loading
C 30/37 hh = 35 cm,h = 75.0 cm Pg = 155 kN/m
B 500B hƒ = 20 cm Mt = 100 kN/m
d1 = 5.0 cm
bh = 110 cm, b = 160 cm
194 VERiFiCATiON MANUAL - Design Code Benchmarks | SOFiSTiK 2018

DCE-EN25: Shear between web and flanges of Hollow CS acc. DIN EN 1992-2
The system with its loading as well as the moment and shear force are shown in Fig. 27.4-27.7. Thereference calculation steps are presented in the next section and the results are given in Table 27.2.
SOFiSTiK AG * Bruckmannring 38 * 85764 OberschleißheimSOFiSTiK 2016-3 WINGRAF - GRAPHICS FOR FINITE ELEMENTS (V 18.03)
Page 12016-01-15
Single span beam
SOFi
STiK
AG
- w
ww.
sofis
tik.d
e
M 1 : 41XY
Z
1010100910081007100610051004100310021001
Beam Elements , Number of element (Max=1010)
m0.00 2.00 4.00 6.00 8.00 10.00
0.00
1938
1860
1860
1628
1628
1240
1240
697.5
697.5
Beam Elements , Bending moment My, Loadcase 1 sum_PZ=1550.0 kN . , 1 cm 3D = 1000. kNm (Max=1938.)
M 1 : 41XY
Z
155.0155.0155.0155.0155.0155.0155.0155.0155.0155.0
All loads (in components), Loadcase 1 sum_PZ=1550.0 kN . , (1 cm 3D = unit) Beam line load (force) in global Z (Unit=160.2kN/m ) (Max=155.0)
m0.00 2.00 4.00 6.00 8.00 10.00
0.00
Figure 27.4: Loaded Structure (Pg)
SOFiSTiK AG * Bruckmannring 38 * 85764 OberschleißheimSOFiSTiK 2016-3 WINGRAF - GRAPHICS FOR FINITE ELEMENTS (V 18.03)
Page 12016-01-15
Single span beam
SOFi
STiK
AG
- w
ww.
sofis
tik.d
e
M 1 : 41XY
Z
1010100910081007100610051004100310021001
Beam Elements , Number of element (Max=1010)
m0.00 2.00 4.00 6.00 8.00 10.00
2.00
0.00
1938
1860
1860
1628
1628
1240
1240
697.5
697.5
Beam Elements , Bending moment My, Loadcase 1 sum_PZ=1550.0 kN . , 1 cm 3D = 1000. kNm (Max=1938.)
M 1 : 41XY
Z
155.0155.0155.0155.0155.0155.0155.0155.0155.0155.0
All loads (in components), Loadcase 1 sum_PZ=1550.0 kN . , (1 cm 3D = unit) Beam line load (force) in global Z (Unit=160.2kN/m ) (Max=155.0)
m0.00 2.00 4.00 6.00 8.00 10.00
0.00
Figure 27.5: Resulting Bending Moment My
SOFiSTiK AG * Bruckmannring 38 * 85764 OberschleißheimSOFiSTiK 2016-3 WINGRAF - GRAPHICS FOR FINITE ELEMENTS (V 18.03)
Page 12016-02-17
SINGLE SPAN BEAM
SOFi
STiK
AG
- w
ww.
sofis
tik.d
e
M 1 : 41XY
Z
500.0
-500.0
-400.0
400.0
-300.0
300.0
-200.0
200.0
-100.0
100.0
Beam Elements , Torsional moment Mt, Loadcase 1 sum_PZ=1550.0 kN . , 1 cm 3D = 500.0 kNm (Min=-500.0) (Max=500.0)
m0.00 2.00 4.00 6.00 8.00 10.002.
000.
00-2
.00
1010100910081007100610051004100310021001
Number of element, Beam Elements(Max=1010), Nodal sequences
Figure 27.6: Resulting Torsional Moment Mt
SOFiSTiK AG * Bruckmannring 38 * 85764 OberschleißheimSOFiSTiK 2016-3 WINGRAF - GRAPHICS FOR FINITE ELEMENTS (V 18.03)
Page 12016-02-17
SINGLE SPAN BEAM
SOFi
STiK
AG
- w
ww.
sofis
tik.d
e
M 1 : 41XY
Z
775.0
-775.0
-620.0
620.0
-465.0
465.0
-310.0
310.0
-155.0
155.0
Beam Elements , Shear force Vz, Loadcase 1 sum_PZ=1550.0 kN . , 1 cm 3D = 500.0 kN (Min=-775.0) (Max=775.0)
m0.00 2.00 4.00 6.00 8.00 10.00
2.00
0.00
-2.0
0
1010100910081007100610051004100310021001
Number of element, Beam Elements(Max=1010), Nodal sequences
Figure 27.7: Resulting Shear Force Vz
Table 27.2: Results
At beam 1001 SOF. Ref.
As1 [cm2] at = 1.0 m 22.49 22.52
VRd,c [kN] 91.91 91.91
SOFiSTiK 2018 | VERiFiCATiON MANUAL - Design Code Benchmarks 195

DCE-EN25: Shear between web and flanges of Hollow CS acc. DIN EN 1992-2
Table 27.2: (continued)
At beam 1001 SOF. Ref.
VRd,m [kN] 1098.43 1098.461
cotθ 1.75 1.75
z [cm] at = 1.0 m 63.00 67.00
VEd = ΔFd [kN] 350.13 352.35
sƒ , [cm2] 8.23 8.42
sƒ ,r [cm2] 0.81 0.83
196 VERiFiCATiON MANUAL - Design Code Benchmarks | SOFiSTiK 2018

DCE-EN25: Shear between web and flanges of Hollow CS acc. DIN EN 1992-2
27.4 Design Process1
Design with respect to DIN EN 1992-2:2010 (NA) [19] :2
Material:
Concrete: γc = 1.50 (NDP) 2.4.2.4: (1), Tab. 2.1DE: Partialfactors for materials
Steel: γs = 1.15
ƒck = 30 MP Tab. 3.1: Strength for concrete
ƒcd = cc · ƒck/γc = 0.85 · 30/1.5 = 17 MP 3.1.6: (1)P, Eq. (3.15): cc = 0.85 con-sidering long term effects
ƒyk = 500 MP 3.2.2: (3)P: yield strength ƒyk = 500MPƒyd = ƒyk/γs = 500/1.15 = 434.78 MP3.2.7: (2), Fig. 3.8
σsd = 456.52 MP
Design loads
• Design Load for beam 1001, x=0.0 m:
MEd,=0.0 m = 0.0 kNm
• Design Load for beam 1001, x=1.0 m:
MEd,=1.0 m = 697.5 kNm
Calculating the longitudinal reinforcement:
• For beam 1001, x=0.0 m
μEds =MEds
beƒ ƒ · d2 · ƒcd=
0.0 · 10−3
1.60 · 0.702 · 17.00= 0.00 μ = 0→ As1 = 0
• For beam 1001, x=1.0 m
μEds =MEds
beƒ ƒ · d2 · ƒcd=
697.5 · 10−3
1.60 · 0.702 · 17.00= 0.0523
ω ≈ 0.053973, ζ ≈ 0.9658, ξ = 0.07833 (interpolated) Tab. 9.2 [3]: ω−Table for up to C50/60without compression reinforcement
As1 =1
σsd· (ω · b · d · ƒcd + NEd) NEd = 0
As1 =1
456.52· (0.053973 · 1.6 · 0.7 · 17.0) · 1002 = 22.52 cm2
z = ζ · d = 0.9658 · 0.70 m ≈ 67.00 cm
Calculating the shear between flange and web
The shear force, is determined by the change of the longitudinal force, atthe junction between one side of a flange and the web, in the separatedflange: 6.2.4 (3): Eq. 6.20
1The tools used in the design process are based on steel stress-strain diagrams, asdefined in [1] 3.2.7:(2), Fig. 3.8, which can be seen in Fig. 27.2.
2The sections mentioned in the margins refer to DIN EN 1992-1-1:2004 (German Na-tional Annex) [19], unless otherwise specified.
SOFiSTiK 2018 | VERiFiCATiON MANUAL - Design Code Benchmarks 197
DCE-EN25: Shear between web and flanges of Hollow CS acc. DIN EN 1992-2
= 0.0738 · d = 0.07833 · 70 = 5.48 cm < hƒ = 20 cm
ΔFd =�
MEd,=1.0
z−MEd,=0.0
z
�
·hƒ · b
hƒ · bh
For beam 1001 (x=0.00 m)→ MEd = 0.00 therefore:
ΔFd =�
697.5
0.68047− 0
�
·1.1
1.6= 352.35 · 2 = 704.70 kNIn AQB output ΔFd = T[kN/m]
The longitudinal shear stress Ed,V at the junction between one sideof a flange and the web is determined by the change of the normal(longitudinal) force in the part of the flange considered, according to:
Ed,V =
ΔFd
2hƒ · Δ
DIN EN 1992, 6.2.4 (3),Eq. 6.20: hƒis the thickness of flange at the junc-tions, Δ is the length under consider-ation, ΔFd is the change of the normalforce in the flange over the length Δ
In our case Δ = 1.0 because the beam length is = 1.00 m.
Please note that AQB is outputting the results per length.
Ed,V =352.35
20 · 100= 0.176 kN/m2 = 1.76 MPIn AQB output Ed,V = τ − V
Checking the maximum Rd,m value to prevent crushing of thestruts in the flange
To prevent crushing of the compression struts in the flange, the followingcondition should be satisfied:
Ed,V ≤ Rd,m = ν · ƒcd · snθƒ · cosθƒDIN EN 1992, 6.2.4 (4),Eq. 6.22
Rd,m = ν · ƒcd · snθƒ · cosθƒ
According to DIN EN 1992-2, NDP 6.2.4:
ν = ν1
ν1 = 0.75 · ν2DIN EN 1992, NDP 6.2.3 (3),Eq. 6.22
ν2 = 1.1 −ƒck
500≤ 1.0
ν2 = 1.1 −30
500= 1.1 − 0.06 = 1.04 ≥ 1.0→ ν2 = 1.0
ν1 = 0.75 · 1.0 = 0.75→ ν = 0.75
The θ value is calculated:
VRd,cc = c · 0.48 · ƒ1/3ck ·�
1 − 1.2 ·σcd
ƒcd
�
· b · zDIN EN 1992-2, NDP 6.2.3 (2),Eq.NA.6.bDE: σcd = NEd/AC, c=0.5
b → hƒ , z→ Δ, c = 0.5
VRd,cc = c · 0.48 · ƒ1/3ck ·�
1 − 1.2 ·σcd
ƒcd
�
· hƒ · Δ
VRd,cc = 0.5 · 0.48 · 301/3 ·�
1 − 1.2 ·0
17.00
�
· 0.20 · 1.0
198 VERiFiCATiON MANUAL - Design Code Benchmarks | SOFiSTiK 2018
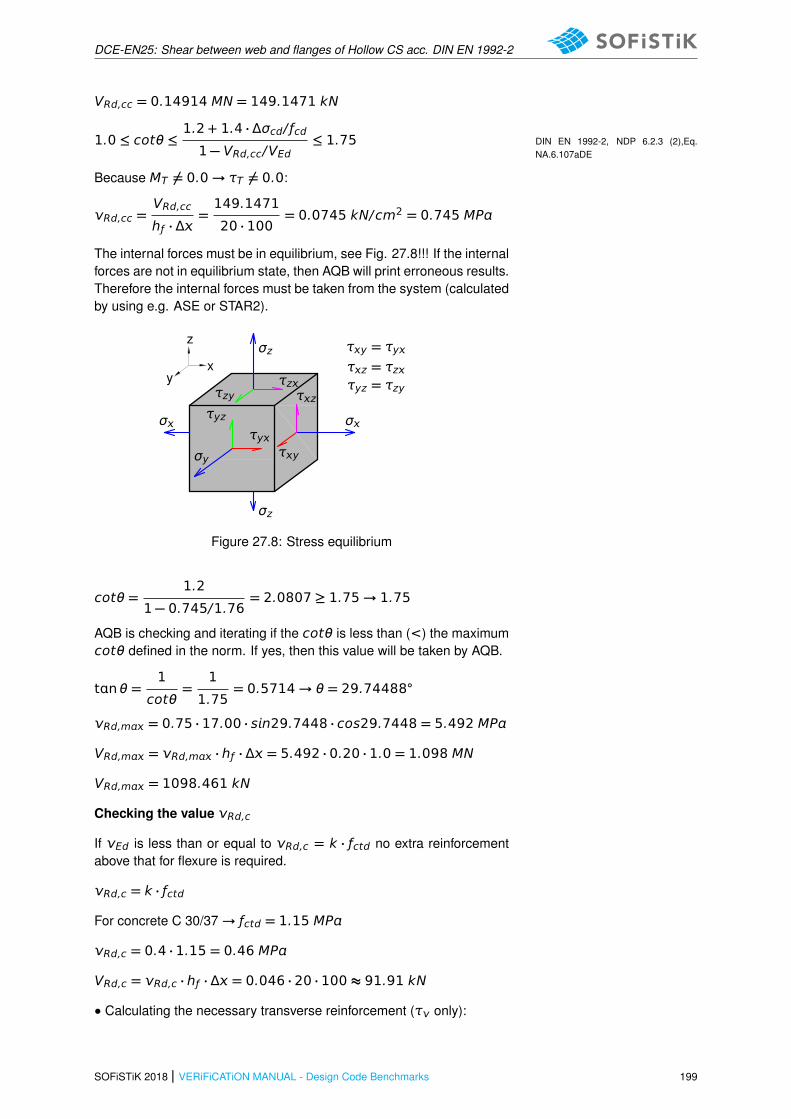
DCE-EN25: Shear between web and flanges of Hollow CS acc. DIN EN 1992-2
VRd,cc = 0.14914 MN = 149.1471 kN
1.0 ≤ cotθ ≤1.2 + 1.4 · Δσcd/ ƒcd1 − VRd,cc/VEd
≤ 1.75 DIN EN 1992-2, NDP 6.2.3 (2),Eq.NA.6.107aDE
Because MT 6= 0.0→ τT 6= 0.0:
Rd,cc =VRd,cc
hƒ · Δ=149.1471
20 · 100= 0.0745 kN/cm2 = 0.745 MP
The internal forces must be in equilibrium, see Fig. 27.8!!! If the internalforces are not in equilibrium state, then AQB will print erroneous results.Therefore the internal forces must be taken from the system (calculatedby using e.g. ASE or STAR2).
σz
σz
σ σ
σy
τy
τyz
τzyτz
τz
τy
xy
zτy = τyτz = τzτyz = τzy
Figure 27.8: Stress equilibrium
cotθ =1.2
1 − 0.745/1.76= 2.0807 ≥ 1.75→ 1.75
AQB is checking and iterating if the cotθ is less than (<) the maximumcotθ defined in the norm. If yes, then this value will be taken by AQB.
tnθ =1
cotθ=
1
1.75= 0.5714→ θ = 29.74488◦
Rd,m = 0.75 · 17.00 · sn29.7448 · cos29.7448 = 5.492 MP
VRd,m = Rd,m · hƒ · Δ = 5.492 · 0.20 · 1.0 = 1.098 MN
VRd,m = 1098.461 kN
Checking the value Rd,c
If Ed is less than or equal to Rd,c = k · ƒctd no extra reinforcementabove that for flexure is required.
Rd,c = k · ƒctd
For concrete C 30/37→ ƒctd = 1.15 MP
Rd,c = 0.4 · 1.15 = 0.46 MP
VRd,c = Rd,c · hƒ · Δ = 0.046 · 20 · 100 ≈ 91.91 kN
• Calculating the necessary transverse reinforcement (τ only):
SOFiSTiK 2018 | VERiFiCATiON MANUAL - Design Code Benchmarks 199
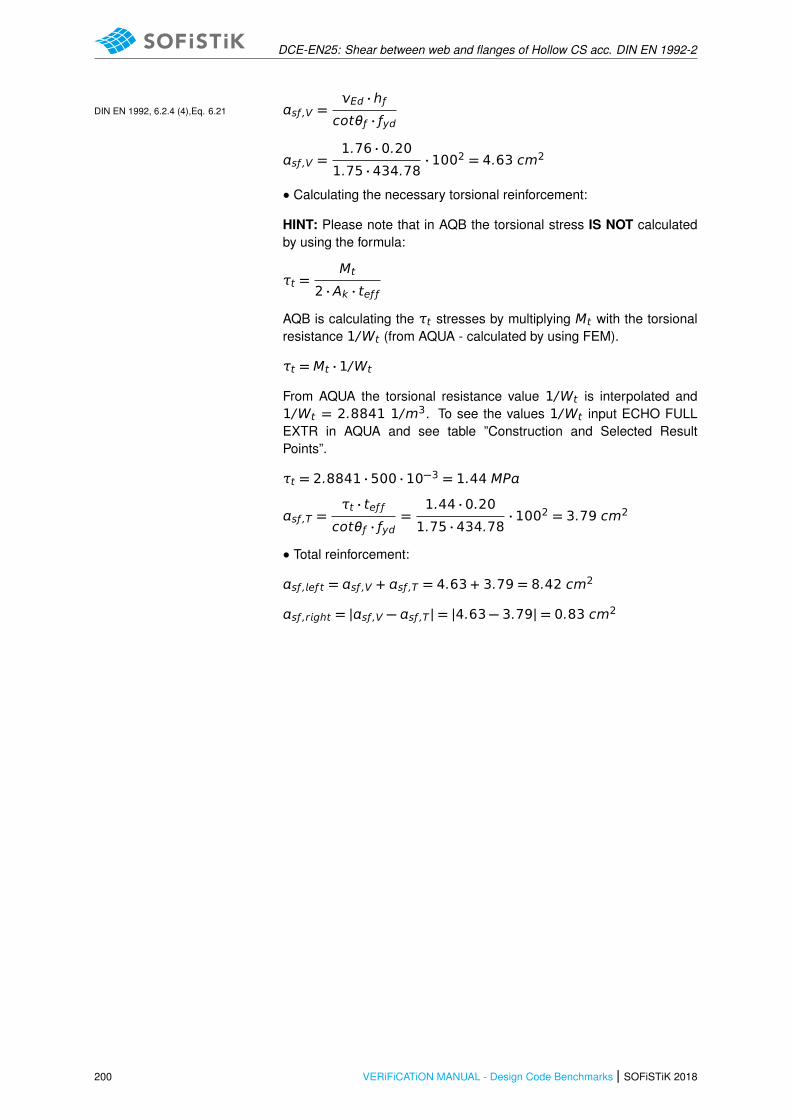
DCE-EN25: Shear between web and flanges of Hollow CS acc. DIN EN 1992-2
sƒ ,V =Ed · hƒ
cotθƒ · ƒydDIN EN 1992, 6.2.4 (4),Eq. 6.21
sƒ ,V =1.76 · 0.20
1.75 · 434.78· 1002 = 4.63 cm2
• Calculating the necessary torsional reinforcement:
HINT: Please note that in AQB the torsional stress IS NOT calculatedby using the formula:
τt =Mt
2 · Ak · teƒ ƒ
AQB is calculating the τt stresses by multiplying Mt with the torsionalresistance 1/Wt (from AQUA - calculated by using FEM).
τt = Mt · 1/Wt
From AQUA the torsional resistance value 1/Wt is interpolated and1/Wt = 2.8841 1/m3. To see the values 1/Wt input ECHO FULLEXTR in AQUA and see table ”Construction and Selected ResultPoints”.
τt = 2.8841 · 500 · 10−3 = 1.44 MP
sƒ ,T =τt · teƒ ƒ
cotθƒ · ƒyd=
1.44 · 0.20
1.75 · 434.78· 1002 = 3.79 cm2
• Total reinforcement:
sƒ ,eƒ t = sƒ ,V + sƒ ,T = 4.63 + 3.79 = 8.42 cm2
sƒ ,rght = |sƒ ,V − sƒ ,T | = |4.63 − 3.79| = 0.83 cm2
200 VERiFiCATiON MANUAL - Design Code Benchmarks | SOFiSTiK 2018
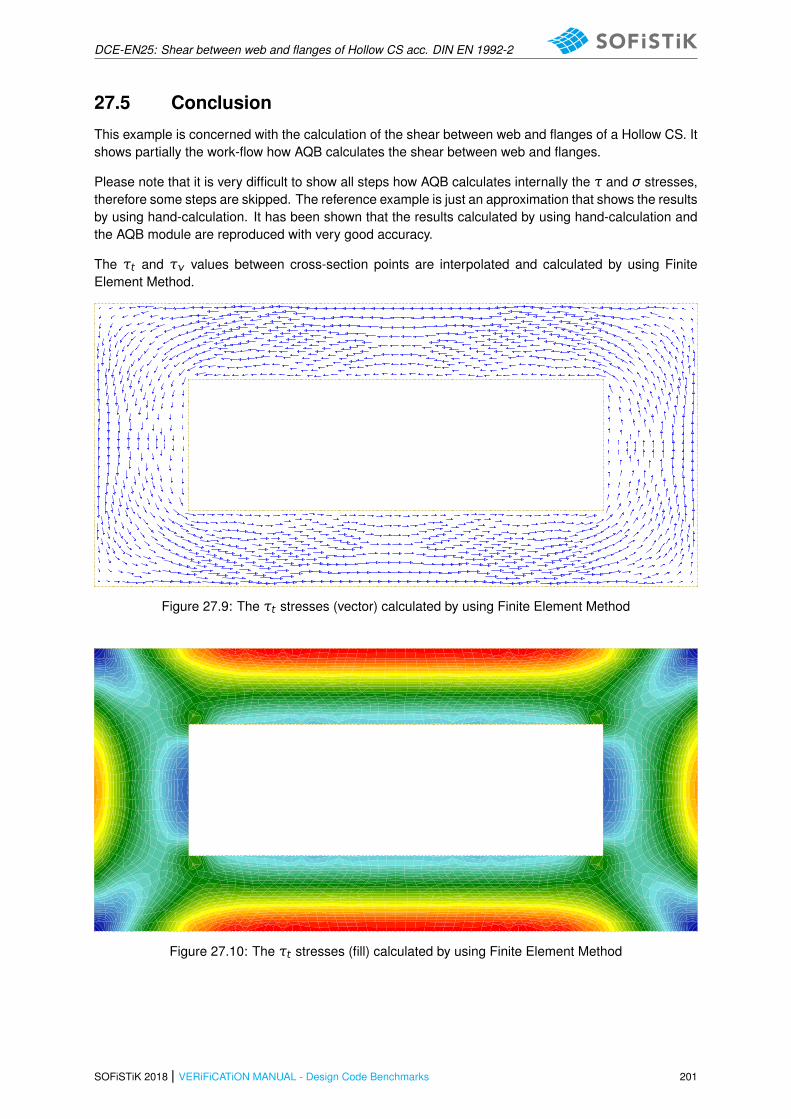
DCE-EN25: Shear between web and flanges of Hollow CS acc. DIN EN 1992-2
27.5 Conclusion
This example is concerned with the calculation of the shear between web and flanges of a Hollow CS. Itshows partially the work-flow how AQB calculates the shear between web and flanges.
Please note that it is very difficult to show all steps how AQB calculates internally the τ and σ stresses,therefore some steps are skipped. The reference example is just an approximation that shows the resultsby using hand-calculation. It has been shown that the results calculated by using hand-calculation andthe AQB module are reproduced with very good accuracy.
The τt and τ values between cross-section points are interpolated and calculated by using FiniteElement Method.
Figure 27.9: The τt stresses (vector) calculated by using Finite Element Method
Figure 27.10: The τt stresses (fill) calculated by using Finite Element Method
SOFiSTiK 2018 | VERiFiCATiON MANUAL - Design Code Benchmarks 201

DCE-EN25: Shear between web and flanges of Hollow CS acc. DIN EN 1992-2
27.6 Literature
[1] DIN EN 1992-1-1/NA: Eurocode 2: Design of concrete structures, Part 1-1/NA: General rules andrules for buildings - German version EN 1992-1-1:2005 (D), Nationaler Anhang Deutschland -Stand Februar 2010. CEN. 2010.
[3] K. Holschemacher, T. Muller, and F. Lobisch. Bemessungshilfsmittel fur Betonbauteile nach Eu-rocode 2 Bauingenieure. 3rd. Ernst & Sohn, 2012.
[19] DIN EN 1992-2: Eurocode 2: Design of concrete structures - Part 2, Part 2: Concrete Bridges -Design of Detailing Rules - German version EN 1992-2:2005 (D), Nationaler Anhang Deutschland- 2012. CEN. 2012.
202 VERiFiCATiON MANUAL - Design Code Benchmarks | SOFiSTiK 2018
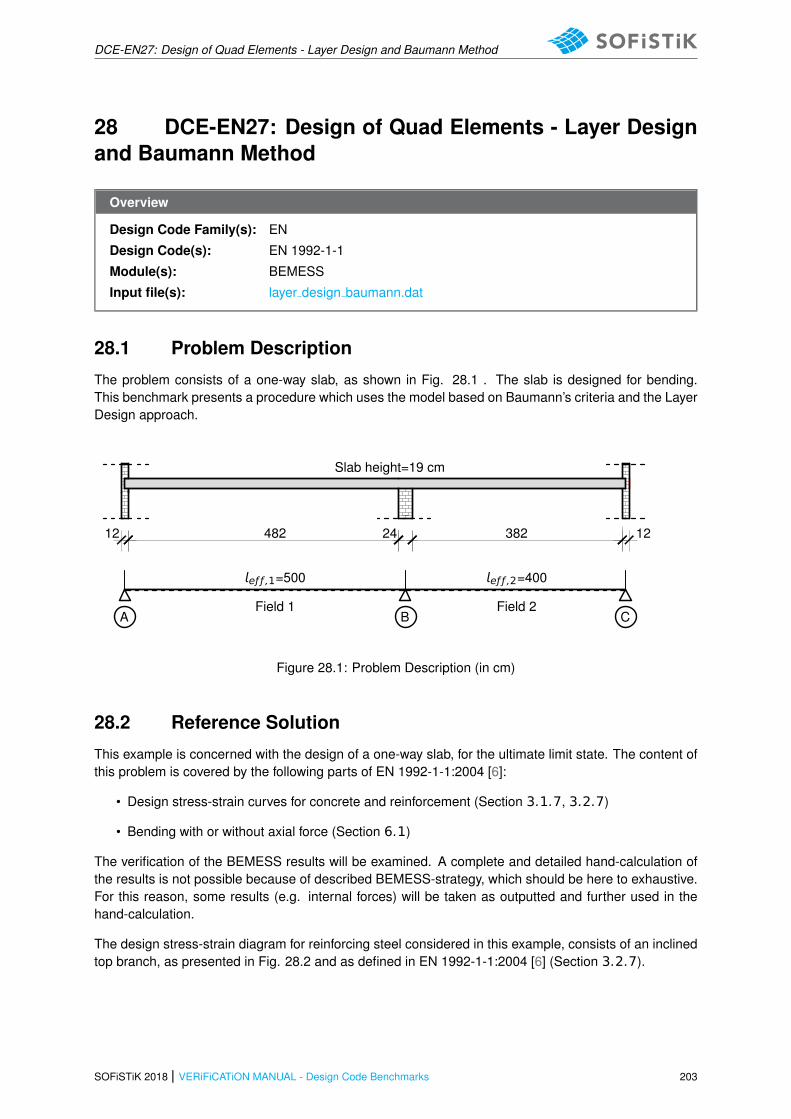
DCE-EN27: Design of Quad Elements - Layer Design and Baumann Method
28 DCE-EN27: Design of Quad Elements - Layer Designand Baumann Method
Overview
Design Code Family(s): EN
Design Code(s): EN 1992-1-1
Module(s): BEMESS
Input file(s): layer design baumann.dat
28.1 Problem Description
The problem consists of a one-way slab, as shown in Fig. 28.1 . The slab is designed for bending.This benchmark presents a procedure which uses the model based on Baumann’s criteria and the LayerDesign approach.
A B CField 1 Field 2
12 24 12482 382
eƒ ƒ ,1=500 eƒ ƒ ,2=400
Slab height=19 cm
Figure 28.1: Problem Description (in cm)
28.2 Reference Solution
This example is concerned with the design of a one-way slab, for the ultimate limit state. The content ofthis problem is covered by the following parts of EN 1992-1-1:2004 [6]:
• Design stress-strain curves for concrete and reinforcement (Section 3.1.7, 3.2.7)
• Bending with or without axial force (Section 6.1)
The verification of the BEMESS results will be examined. A complete and detailed hand-calculation ofthe results is not possible because of described BEMESS-strategy, which should be here to exhaustive.For this reason, some results (e.g. internal forces) will be taken as outputted and further used in thehand-calculation.
The design stress-strain diagram for reinforcing steel considered in this example, consists of an inclinedtop branch, as presented in Fig. 28.2 and as defined in EN 1992-1-1:2004 [6] (Section 3.2.7).
SOFiSTiK 2018 | VERiFiCATiON MANUAL - Design Code Benchmarks 203

DCE-EN27: Design of Quad Elements - Layer Design and Baumann Method
A
B A
B
Idealised
Design
ƒyk
ƒtk,c = 525N/mm2
ε
εd = 25 0/00
ƒyd = ƒyk/γs
σ
Figure 28.2: Idealised and Design Stress-Strain Diagram for Reinforcing Steel
28.3 Model and Results
The slab, with properties as defined in Table 28.3, is to be designed for bending moment, with respect toEN 1992-1-1:2004 [6]. The structure analysed, consists of one-way slab with a distributed load in gravitydirection. The loading is presented bellow:
Table 28.1: Loading and actions
Title Action Safety Factor ULS Value
Dead Load G dead load γG = 1.35 gk = 6.35 kN/m2
Field 1 Q variable load γQ = 1.5 qk = 5.0 kN/m2
Field 2 Q variable load γQ = 1.5 qk = 5.0 kN/m2
gd = γG · gk = 1.35 · 6.35 = 8.57 kN/m2
qd,ƒ1 = γQ · qk = 1.50 · 5.00 = 7.50 kN/m2
qd,ƒ2 = γQ · qk = 1.50 · 5.00 = 7.50 kN/m2
LC 1001→ gd + qd in Field 1+2
LC 1002→ gd + qd,ƒ1 in Field 1
LC 1003→ gd + qd,ƒ2 in Field 2
Table 28.2: Internal forces
Loadcase mEd,B mEd,F1 mEd,F2 Ed,A Ed,B, Ed,B,r Ed,C
LC 1001 -37.16 31.00 14.40 30.00 -46.80 41.00 -20.00
LC 1002 -35.20 33.60 4.03 31.30 -45.40 25.10 -7.49
LC 1003 -28.90 14.10 19.09 14.70 -26.30 37.70 -23.20
204 VERiFiCATiON MANUAL - Design Code Benchmarks | SOFiSTiK 2018

DCE-EN27: Design of Quad Elements - Layer Design and Baumann Method
33.619.0
-37.2
C
B
A
Figure 28.3: mEd envelope in kNm/m2
Table 28.3: Model Properties
Material Properties Geometric Properties Loading
C 20/25 h = 19 cm gd = 8.57 kN/m2
B 500B, B 500A cnom = 20 mm qd,ƒ1 = 7.50 kN/m2
d1 = 3.0 cm qd,ƒ2 = 7.50 kN/m2
Exposition class XC1
The system with its loading are shown in Fig. 28.4-28.10. The reference calculation steps are presentedin the next section and the results are given in Table 28.4.
16.1
16.1
16.1
16.1Field 1
Field 2
Figure 28.4: Loadcase 1001
16.1
16.1
16.1
16.18.57
8.57
8.57
Field 1 Field 2
Figure 28.5: Loadcase 1002
QUAD 10026 over Support B:
SOFiSTiK 2018 | VERiFiCATiON MANUAL - Design Code Benchmarks 205

DCE-EN27: Design of Quad Elements - Layer Design and Baumann Method
Required Reinforcements acc. to EN 1992-1-1:2004Grp Element LC t asu asu2 asu3 asl asl2 asl3 supp shear ass
[m] [cm2/m] [cm2/m] [cm2/m] [cm2/m] [cm2/m] [cm2/m] [-] [-] [cm2/m2]1 10026 1001 0.190 5.58 1.13 1
Grp primary group number asu2 Cross reinforcements (2nd layer) TopElement element number asu3 Third reinforcements TopLC load case asl Principal reinforcements (1st layer) Bottomt plate thickness asl2 Cross reinforcements (2nd layer) Bottomasu Principal reinforcements (1st layer) Top asl3 Third reinforcements Bottomsupp reduction factor for the shear force near supports, punc=point in punching zone -> punching shear designshear shear zone: 1=Ok, 1s=asu/l increased for shear, 1d=for punching, 2=required ass, 2m=minimum shear reinforcementass Shear reinforcement
Figure 28.6: Layer Design - Quad 10026, Loadcase 1001, st = 5.59 cm2/m
QUAD 10726 in Field 1:
Required Reinforcements acc. to EN 1992-1-1:2004Grp Element LC t asu asu2 asu3 asl asl2 asl3 supp shear ass
[m] [cm2/m] [cm2/m] [cm2/m] [cm2/m] [cm2/m] [cm2/m] [-] [-] [cm2/m2]1 10726 1002 0.190 4.99 1.01 1
Grp primary group number asu2 Cross reinforcements (2nd layer) TopElement element number asu3 Third reinforcements TopLC load case asl Principal reinforcements (1st layer) Bottomt plate thickness asl2 Cross reinforcements (2nd layer) Bottomasu Principal reinforcements (1st layer) Top asl3 Third reinforcements Bottomsupp reduction factor for the shear force near supports, punc=point in punching zone -> punching shear designshear shear zone: 1=Ok, 1s=asu/l increased for shear, 1d=for punching, 2=required ass, 2m=minimum shear reinforcementass Shear reinforcement
Figure 28.7: Layer Design - Quad 10726, Loadcase 1002, st = 5.02 cm2/m
QUAD 80376 in Field 2:
Required Reinforcements acc. to EN 1992-1-1:2004Grp Element LC t asu asu2 asu3 asl asl2 asl3 supp shear ass
[m] [cm2/m] [cm2/m] [cm2/m] [cm2/m] [cm2/m] [cm2/m] [-] [-] [cm2/m2]8 80376 1003 0.190 2.73 0.58 1
Grp primary group number asu2 Cross reinforcements (2nd layer) TopElement element number asu3 Third reinforcements TopLC load case asl Principal reinforcements (1st layer) Bottomt plate thickness asl2 Cross reinforcements (2nd layer) Bottomasu Principal reinforcements (1st layer) Top asl3 Third reinforcements Bottomsupp reduction factor for the shear force near supports, punc=point in punching zone -> punching shear designshear shear zone: 1=Ok, 1s=asu/l increased for shear, 1d=for punching, 2=required ass, 2m=minimum shear reinforcementass Shear reinforcement
Figure 28.8: Layer Design - Quad 80376, Loadcase 1003, st = 2.73 cm2/m
Summary of results:
Maximum reinforcement: reinforcement distribution number 1
Grp Element asu asu2 asu3 asl asl2 asl3 ass
[cm2/m] [cm2/m] [cm2/m] [cm2/m] [cm2/m] [cm2/m] [cm2/m2]
1 10026 5.58 1.13
10726 4.95 1.07
8 80376 2.65 0.57Grp primary group number
Element element number
asu Principal reinforcements (1st layer) Top
asu2 Cross reinforcements (2nd layer) Top
asu3 Third reinforcements Top
asl Principal reinforcements (1st layer) Bottom
asl2 Cross reinforcements (2nd layer) Bottom
asl3 Third reinforcements Bottom
ass Shear reinforcement
Figure 28.9: Maximum reinforcement distribution for Quad Elements
206 VERiFiCATiON MANUAL - Design Code Benchmarks | SOFiSTiK 2018
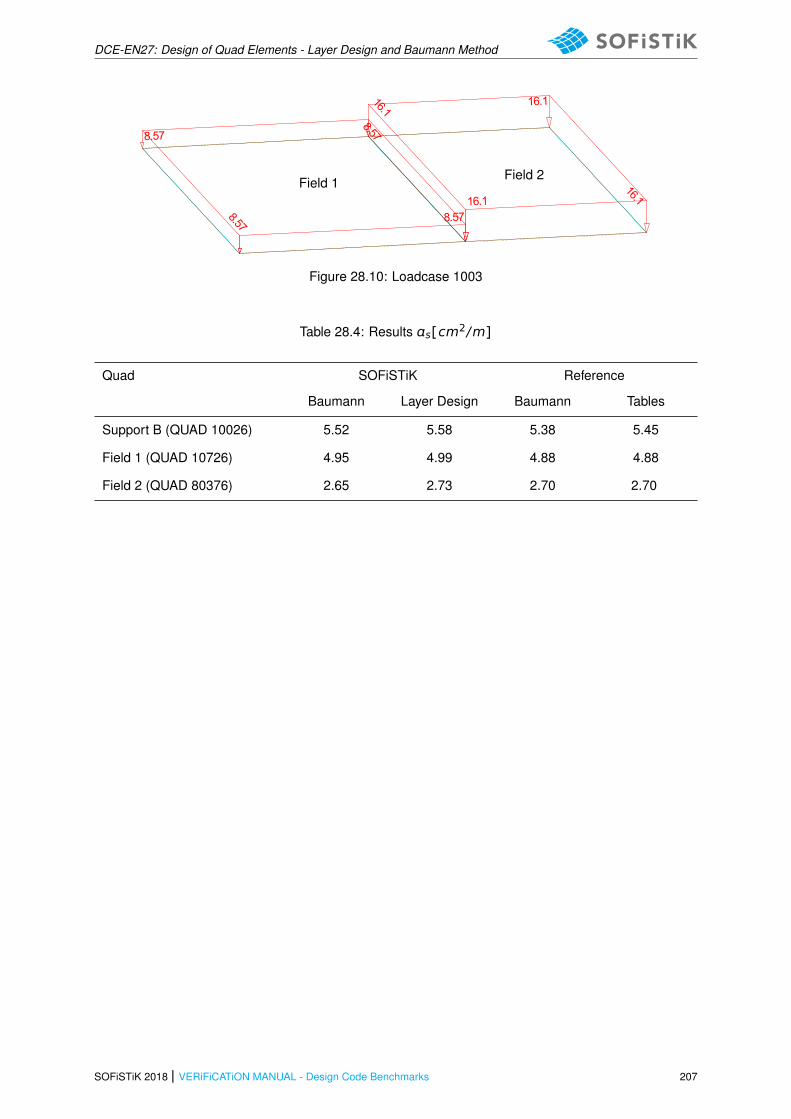
DCE-EN27: Design of Quad Elements - Layer Design and Baumann Method
16.1
16.1
16.116.1
8.57
8.57
8.57
8.57
Field 1Field 2
Figure 28.10: Loadcase 1003
Table 28.4: Results s[cm2/m]
Quad SOFiSTiK Reference
Baumann Layer Design Baumann Tables
Support B (QUAD 10026) 5.52 5.58 5.38 5.45
Field 1 (QUAD 10726) 4.95 4.99 4.88 4.88
Field 2 (QUAD 80376) 2.65 2.73 2.70 2.70
SOFiSTiK 2018 | VERiFiCATiON MANUAL - Design Code Benchmarks 207
DCE-EN27: Design of Quad Elements - Layer Design and Baumann Method
28.4 Design Process1
Design with respect to EN 1992-1-1:2004 [6] :2
Material:
Concrete: γc = 1.502.4.2.4: (1), Tab. 2.1N: Partial factorsfor materials for ultimate limit states
Steel: γs = 1.15
ƒck = 20 MPTab. 3.1: Strength and deformationcharacteristics for concrete ƒcd = cc · ƒck/γc = 1.00 · 20/1.50 = 13.33MP3.1.6: Eq. (3.15): cc = 1.00 consider-ing long term effects
ƒyk = 500 MP3.2.2: (3)P: yield strength ƒyk = 500MP ƒyd = ƒyk/γs = 500/1.15 = 434.78 MP3.2.7: (2), Fig. 3.8
σsd = 456.52 MP
1. DESIGN BY USING TABLES
To make the example more simple, the slab will be designed only forthe maximum and minimum moment mEd (Field 1, Field 2 and over themiddle support). The reduction of the moment over the middle supportwill be neglected in this example.
• Design mEd over the middle support (QUAD 10026):
mEd,B = (mEd,B,1001,mEd,B,1002,mEd,B,1003)
mEd,B = max(−37.16, − 35.20, − 28.90) = −37.16 kNm/m
Calculating the μ value:
μEds =|mEd,B,Red|
b · d2 · ƒcd
μEds =37.16 · 10−3
1.0 · 0.162 · 13.33
μEds = 0.1089
From tables:
μ ω ξ ζ σsd [MPa]
0.108867 0.11575 0.14298 0.940522 452.69
s,req = ω · b · d · ƒcd ·1
σsd
s,req = 0.11576 · 1.00 · 0.16 · 13.33 ·1
452.70
s,req = 5.45 cm2/m
• Design mEd over in Field 1 (QUAD 10726):1The tools used in the design process are based on steel stress-strain diagrams, as
defined in [1] 3.2.7:(2), Fig. 3.8, which can be seen in Fig. 28.2.2The sections mentioned in the margins refer to EN 1992-1-1:2004 [6], unless other-
wise specified.
208 VERiFiCATiON MANUAL - Design Code Benchmarks | SOFiSTiK 2018

DCE-EN27: Design of Quad Elements - Layer Design and Baumann Method
mEd,f1 = (mEd,ƒ1,1001,mEd,ƒ1,1002,mEd,ƒ1,1003)
mEd,f1 = max(31.00, 33.69, 14.10) = 33.69 kNm/m
Calculating the μ value:
μEds =|mEd,B,Red|
b · d2 · ƒcd
μEds =33.69 · 10−3
1.0 · 0.162 · 13.33
μEds = 0.0987
From tables:
μ ω ξ ζ σsd [MPa]
0.0987 0.10429 0.12882 0.9464 455.25
s,req = ω · b · d · ƒcd ·1
σsd
s,req = 0.10429 · 1.00 · 0.16 · 13.33 ·1
455.25
s,req = 4.88 cm2/m
• Design mEd over in Field 2 (QUAD 80376):
mEd,f2 = (mEd,ƒ2,1001,mEd,ƒ2,1002,mEd,ƒ2,1003)
mEd,f2 = max(14.40, 4.03, 19.09) = 19.09 kNm/m
Calculating the μ value:
μEds =|mEd,B,Red|
b · d2 · ƒcd
μEds =19.09 · 10−3
1.0 · 0.162 · 13.33
μEds = 0.05593
From tables:
μ ω ξ ζ σsd [MPa]
0.05593 0.05774 0.08222 0.968533 456.52
s,req = ω · b · d · ƒcd ·1
σsd
s,req = 0.05774 · 1.00 · 0.16 · 13.33 ·1
456.52
s,req = 2.698 cm2/m
2. DESIGN BY USING THE MULTI LAYER APPROACH
The design approach in BEMESS 2018 was completely changed from
SOFiSTiK 2018 | VERiFiCATiON MANUAL - Design Code Benchmarks 209

DCE-EN27: Design of Quad Elements - Layer Design and Baumann Method
Baumann Method to an exact iteration of the strain state. This itera-tion of the stain state is called ”Layer Design” or ”Layer Approach” inSOFiSTIK. In the layer design the 6 strain parameters (3 strains ϵ, ϵy,ϵy) and 3 curvatures k, ky, ky) are calculated iteratively to achieveequilibrium between the 6 inner forces and the 6 internal forces n, ny,ny, m, my and my. Thereby non-linear work-laws are taken intoaccount for concrete and steel.
The iterative approach is not documented in this example, because ittakes lot of effort to document all iterational steps. Therefore only theoutput is shown, see the output tables in Fig. 28.9, 28.7 and 28.8.
3. DESIGN BY USING BAUMANN METHOD
For each reinforcement layer: With the use of internal forces in localelement direction, the internal forces in main direction and the accom-payning angle is calculted with the following equation
m/ =m +myy
2± 0.5 ·
r
(myy −m)2 + 4 ·m2y
tn2φ0 = 2 ·my
m −myy
Accompanying to the main bending moments the normal forces andaccompanying to the main normal forces the bending moments are cal-culated by transformation.
The internal lever arm is calculated separately for the internal forces inmain moment direction and for the internal forces in main normal forcesdirection. This is done with the theory explained in the paper from Prof.Dr. Ing. Ulrich P. Schmitz [20]. The program choose the unfavorablelever arm from both results for the next analysis step lever arm z (Thisis why for each layer of reinforcement two lever arms are calculatedwithin the program).
This lever arm z is used to calculate the virtual panel forces N, Ny,Ny (in direction of the local element coordinate system) on each sideof the finite element:
QUAD 10026 over Support B:
Calculating N:
N =n
2+m
z
N =0.00
2+37.16
0.1514
N = 245.442 kN/m
Calculating Ny:
Ny =nyy
2+myy
z
Ny =0.00
2+
7.43
0.1514
210 VERiFiCATiON MANUAL - Design Code Benchmarks | SOFiSTiK 2018
DCE-EN27: Design of Quad Elements - Layer Design and Baumann Method
Ny = 49.075 kN/m
Calculating Ny:
Ny =ny
2+ny
z
Ny =0.00
2+
0.00
0.1514
Ny = 0.00 kN/m
The next step is the transformation of the panel forces N, Ny, Ny intothe main forces N and N :
N =N + Ny
2+ 0.5 ·
r
(Ny − N)2 + 4 ·N2y
N =245.44 + 49.07
2+ 0.5 ·
Æ
(49.07 − 245.4)2 + 4 · 0.002
N = 147.256 + 98.165 = 245.421
N =N + Ny
2− 0.5 ·
r
(Ny − N)2 + 4 ·N2y
N =245.44 + 49.07
2− 0.5 ·
Æ
(49.07 − 245.4)2 + 4 · 0.002
N = 147.256 − 98.165 = 49.091
tn2φ0 = 2 ·Ny
N − Ny
tn2φ0 = 2 ·0.00
245.442 − 49.07
tn2φ0 = 0.00→ φ = 0
Required reinforcement:
k =N2
N1
k =49.091
245.41= 0.20
k ≥ tn(α + π/4) · tnα = 0
Z = N +N − N2
· sin2α · (1 − tnα)
Z = 245.421 +245.421 − 49.091
2· sin0 · (1 − tn0)
Z = 245.421
s =Z
σsd
s =245.421
456.52= 5.375 cm2/m
SOFiSTiK 2018 | VERiFiCATiON MANUAL - Design Code Benchmarks 211

DCE-EN27: Design of Quad Elements - Layer Design and Baumann Method
Field 1 (QUAD 10726):
Calculating N:
N =n
z+m
z
N =0.00
0.1514+33.70
0.1514
N = 222.589 kN/m
Calculating Ny:
Ny =nyy
z+myy
z
Ny =0.00
0.1514+
6.74
0.1514
Ny = 44.51 kN/m
Calculating Ny:
Ny =ny
z+ny
z
Ny =0.00
0.1514+
0.00
0.1514
Ny = 0.00 kN/m
The next step is the transformation of the panel forces N, Ny, Ny intothe main forces N and N :
N =N + Ny
2+ 0.5 ·
r
(Ny − N)2 + 4 ·N2y
N =222.589 + 44.51
2+ 0.5 ·
Æ
(44.51 − 222.589)2 + 4 · 0.002
N = 133.5495 + 89.0395 = 222.589
N =N + Ny
2− 0.5 ·
r
(Ny − N)2 + 4 ·N2y
N =222.589 + 44.51
2− 0.5 ·
Æ
(44.51 − 222.589)2 + 4 · 0.002
N = 133.5495 − 89.0395 = 44.51
tn2φ0 = 2 ·Ny
N − Ny
tn2φ0 = 2 ·0.00
222.589 − 44.51
tn2φ0 = 0.00→ φ = 0
Required reinforcement:
212 VERiFiCATiON MANUAL - Design Code Benchmarks | SOFiSTiK 2018

DCE-EN27: Design of Quad Elements - Layer Design and Baumann Method
k =N2
N1
k =44.51
222.589= 0.199
k ≥ tn(α + π/4) · tnα = 0
Z = N +N − N2
· sin2α · (1 − tnα)
Z = 222.589 +222.589 − 44.51
2· sin0 · (1 − tn0)
Z = 222.589
s =Z
σsd
s =222.589
456.52= 4.875 cm2/m
Field 2 (QUAD 80376):
Calculating N:
N =n
z+m
z
N =0.00
0.1514+19.09
0.1549
N = 123.24 kN/m
Calculating Ny:
Ny =nyy
z+myy
z
Ny =0.00
0.1549+
3.86
0.1549
Ny = 24.91 kN/m
Calculating Ny:
Ny =ny
z+ny
z
Ny =0.00
0.1549+
0.00
0.1549
Ny = 0.00 kN/m
The next step is the transformation of the panel forces N, Ny, Ny intothe main forces N and N :
N =N + Ny
2+ 0.5 ·
r
(Ny − N)2 + 4 ·N2y
N =123.24 + 24.91
2+ 0.5 ·
Æ
(24.91 − 123.24)2 + 4 · 0.002
SOFiSTiK 2018 | VERiFiCATiON MANUAL - Design Code Benchmarks 213
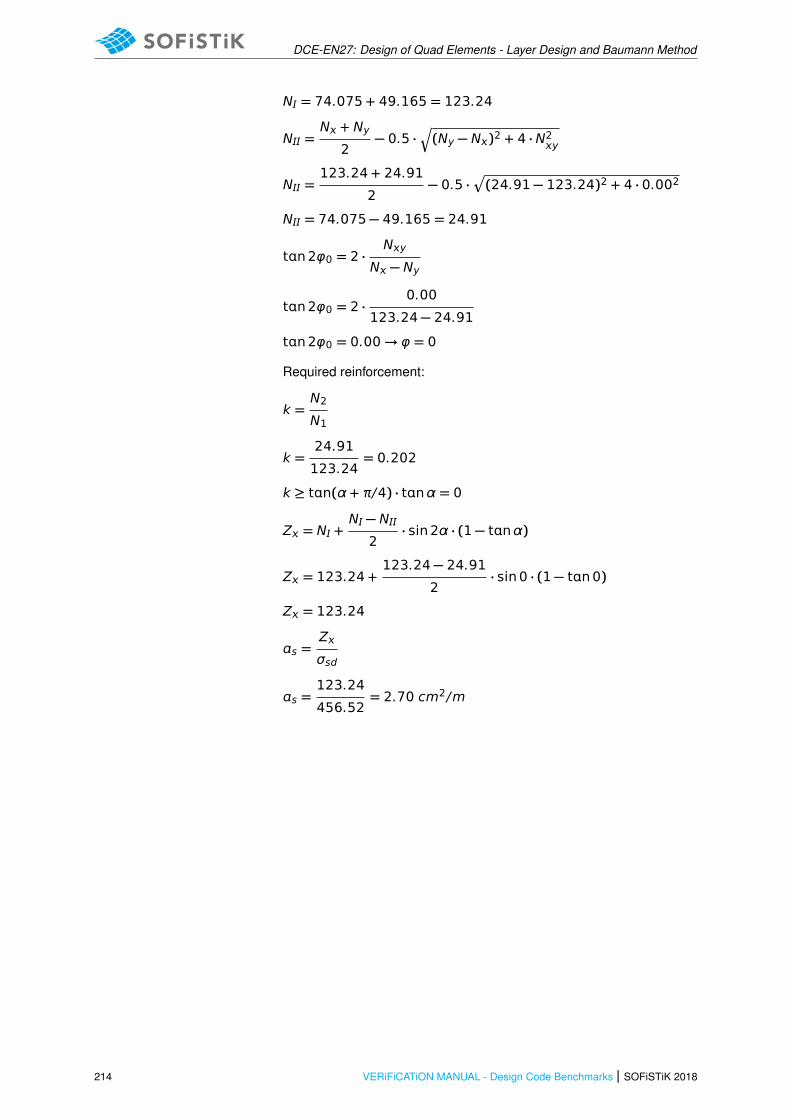
DCE-EN27: Design of Quad Elements - Layer Design and Baumann Method
N = 74.075 + 49.165 = 123.24
N =N + Ny
2− 0.5 ·
r
(Ny − N)2 + 4 ·N2y
N =123.24 + 24.91
2− 0.5 ·
Æ
(24.91 − 123.24)2 + 4 · 0.002
N = 74.075 − 49.165 = 24.91
tn2φ0 = 2 ·Ny
N − Ny
tn2φ0 = 2 ·0.00
123.24 − 24.91
tn2φ0 = 0.00→ φ = 0
Required reinforcement:
k =N2
N1
k =24.91
123.24= 0.202
k ≥ tn(α + π/4) · tnα = 0
Z = N +N − N2
· sin2α · (1 − tnα)
Z = 123.24 +123.24 − 24.91
2· sin0 · (1 − tn0)
Z = 123.24
s =Z
σsd
s =123.24
456.52= 2.70 cm2/m
214 VERiFiCATiON MANUAL - Design Code Benchmarks | SOFiSTiK 2018
DCE-EN27: Design of Quad Elements - Layer Design and Baumann Method
28.5 Conclusion
This example shows the calculation of the required reinforcement for a one-way slab under bending. Ithas been shown that the results are reproduced with very good accuracy.
28.6 Literature
[1] DIN EN 1992-1-1/NA: Eurocode 2: Design of concrete structures, Part 1-1/NA: General rules andrules for buildings - German version EN 1992-1-1:2005 (D), Nationaler Anhang Deutschland -Stand Februar 2010. CEN. 2010.
[4] Beispiele zur Bemessung nach Eurocode 2 - Band 1: Hochbau. Ernst & Sohn. Deutschen Beton-und Bautechnik-Verein E.V. 2011.
[6] EN 1992-1-1: Eurocode 2: Design of concrete structures, Part 1-1: General rules and rules forbuildings. CEN. 2004.
[20] Ulrich P. Schmitz. “Biegebemessung nach der neuen E-DIN 1045-1”. In: Bauinformatik JOURNAL(1999), pp. 49–51.
SOFiSTiK 2018 | VERiFiCATiON MANUAL - Design Code Benchmarks 215

DCE-EN27: Design of Quad Elements - Layer Design and Baumann Method
216 VERiFiCATiON MANUAL - Design Code Benchmarks | SOFiSTiK 2018
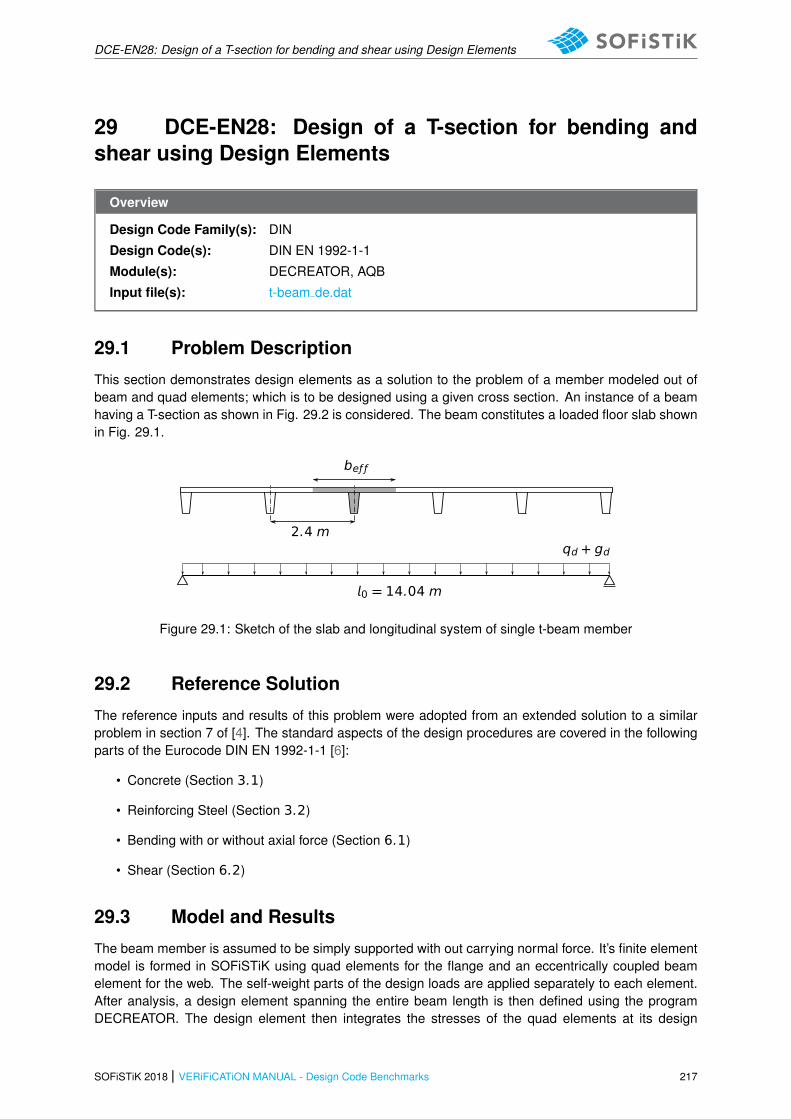
DCE-EN28: Design of a T-section for bending and shear using Design Elements
29 DCE-EN28: Design of a T-section for bending andshear using Design Elements
Overview
Design Code Family(s): DIN
Design Code(s): DIN EN 1992-1-1
Module(s): DECREATOR, AQB
Input file(s): t-beam de.dat
29.1 Problem Description
This section demonstrates design elements as a solution to the problem of a member modeled out ofbeam and quad elements; which is to be designed using a given cross section. An instance of a beamhaving a T-section as shown in Fig. 29.2 is considered. The beam constitutes a loaded floor slab shownin Fig. 29.1.
beƒ ƒ
2.4 mqd + gd
0 = 14.04 m
Figure 29.1: Sketch of the slab and longitudinal system of single t-beam member
29.2 Reference Solution
The reference inputs and results of this problem were adopted from an extended solution to a similarproblem in section 7 of [4]. The standard aspects of the design procedures are covered in the followingparts of the Eurocode DIN EN 1992-1-1 [6]:
• Concrete (Section 3.1)
• Reinforcing Steel (Section 3.2)
• Bending with or without axial force (Section 6.1)
• Shear (Section 6.2)
29.3 Model and Results
The beam member is assumed to be simply supported with out carrying normal force. It’s finite elementmodel is formed in SOFiSTiK using quad elements for the flange and an eccentrically coupled beamelement for the web. The self-weight parts of the design loads are applied separately to each element.After analysis, a design element spanning the entire beam length is then defined using the programDECREATOR. The design element then integrates the stresses of the quad elements at its design
SOFiSTiK 2018 | VERiFiCATiON MANUAL - Design Code Benchmarks 217
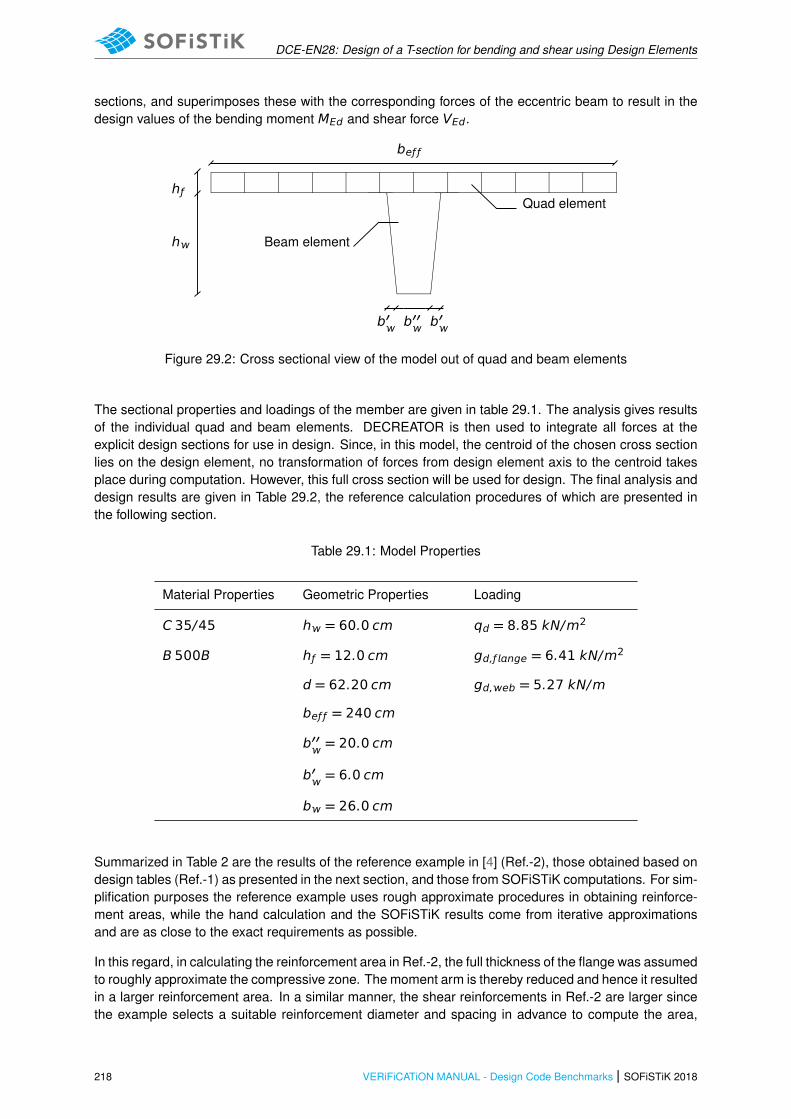
DCE-EN28: Design of a T-section for bending and shear using Design Elements
sections, and superimposes these with the corresponding forces of the eccentric beam to result in thedesign values of the bending moment MEd and shear force VEd.
beƒ ƒ
hƒ
h
b′′
b′
b′
Beam element
Quad element
Figure 29.2: Cross sectional view of the model out of quad and beam elements
The sectional properties and loadings of the member are given in table 29.1. The analysis gives resultsof the individual quad and beam elements. DECREATOR is then used to integrate all forces at theexplicit design sections for use in design. Since, in this model, the centroid of the chosen cross sectionlies on the design element, no transformation of forces from design element axis to the centroid takesplace during computation. However, this full cross section will be used for design. The final analysis anddesign results are given in Table 29.2, the reference calculation procedures of which are presented inthe following section.
Table 29.1: Model Properties
Material Properties Geometric Properties Loading
C 35/45 h = 60.0 cm qd = 8.85 kN/m2
B 500B hƒ = 12.0 cm gd,ƒ nge = 6.41 kN/m2
d = 62.20 cm gd,eb = 5.27 kN/m
beƒ ƒ = 240 cm
b′′= 20.0 cm
b′= 6.0 cm
b = 26.0 cm
Summarized in Table 2 are the results of the reference example in [4] (Ref.-2), those obtained based ondesign tables (Ref.-1) as presented in the next section, and those from SOFiSTiK computations. For sim-plification purposes the reference example uses rough approximate procedures in obtaining reinforce-ment areas, while the hand calculation and the SOFiSTiK results come from iterative approximationsand are as close to the exact requirements as possible.
In this regard, in calculating the reinforcement area in Ref.-2, the full thickness of the flange was assumedto roughly approximate the compressive zone. The moment arm is thereby reduced and hence it resultedin a larger reinforcement area. In a similar manner, the shear reinforcements in Ref.-2 are larger sincethe example selects a suitable reinforcement diameter and spacing in advance to compute the area,
218 VERiFiCATiON MANUAL - Design Code Benchmarks | SOFiSTiK 2018

DCE-EN28: Design of a T-section for bending and shear using Design Elements
which is more than the required amount.
Table 29.2: Results
SOF. Ref.-1 Ref.-2
MEd [kNm] 1085.86 1086.0 1086.0
As,req / s[cm2/m]
39.39 41.34 44.60
VEd [kN] 270.17 272.0 272.0
As,req / s[cm2/m]
9.11 9.3 15.71
SOFiSTiK 2018 | VERiFiCATiON MANUAL - Design Code Benchmarks 219
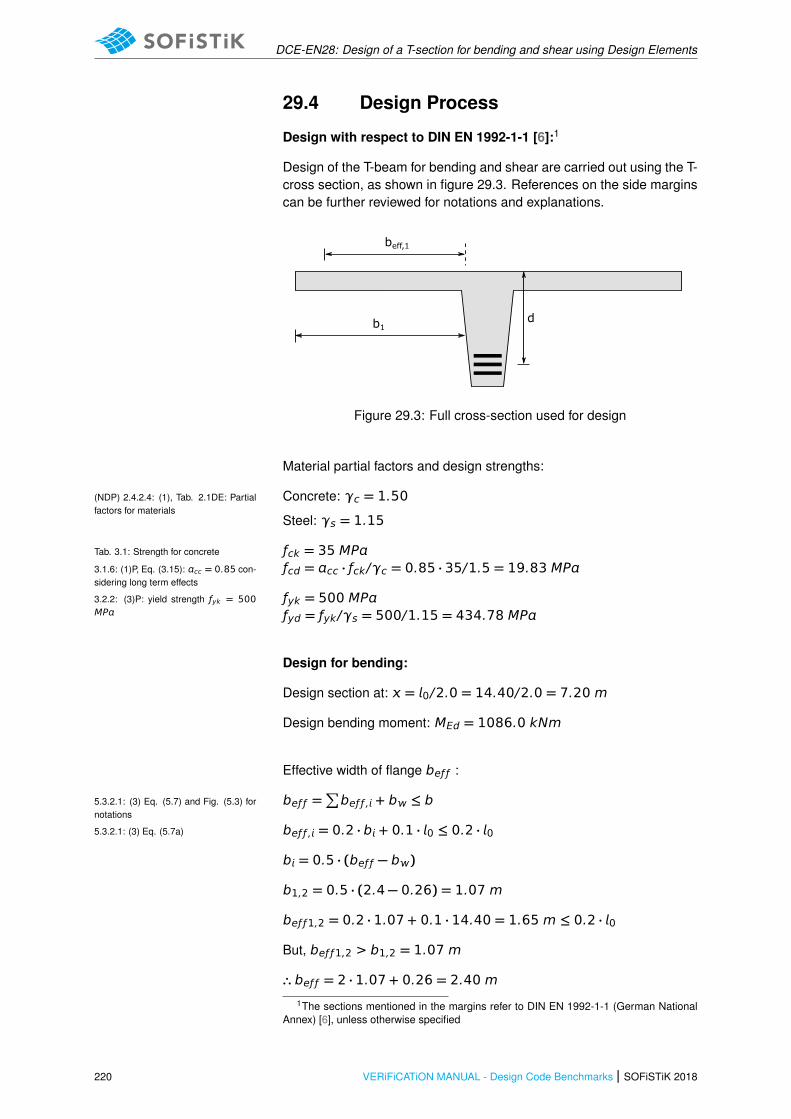
DCE-EN28: Design of a T-section for bending and shear using Design Elements
29.4 Design Process
Design with respect to DIN EN 1992-1-1 [6]:1
Design of the T-beam for bending and shear are carried out using the T-cross section, as shown in figure 29.3. References on the side marginscan be further reviewed for notations and explanations.
beff,1
b1d
Figure 29.3: Full cross-section used for design
Material partial factors and design strengths:
Concrete: γc = 1.50(NDP) 2.4.2.4: (1), Tab. 2.1DE: Partialfactors for materials
Steel: γs = 1.15
ƒck = 35 MPTab. 3.1: Strength for concrete
ƒcd = cc · ƒck/γc = 0.85 · 35/1.5 = 19.83 MP3.1.6: (1)P, Eq. (3.15): cc = 0.85 con-sidering long term effects
ƒyk = 500 MP3.2.2: (3)P: yield strength ƒyk = 500MP ƒyd = ƒyk/γs = 500/1.15 = 434.78 MP
Design for bending:
Design section at: = 0/2.0 = 14.40/2.0 = 7.20 m
Design bending moment: MEd = 1086.0 kNm
Effective width of flange beƒ ƒ :
beƒ ƒ =∑
beƒ ƒ , + b ≤ b5.3.2.1: (3) Eq. (5.7) and Fig. (5.3) fornotations
beƒ ƒ , = 0.2 · b + 0.1 · 0 ≤ 0.2 · 05.3.2.1: (3) Eq. (5.7a)
b = 0.5 · (beƒ ƒ − b)
b1,2 = 0.5 · (2.4 − 0.26) = 1.07 m
beƒ ƒ1,2 = 0.2 · 1.07 + 0.1 · 14.40 = 1.65 m ≤ 0.2 · 0
But, beƒ ƒ1,2 > b1,2 = 1.07 m
∴ beƒ ƒ = 2 · 1.07 + 0.26 = 2.40 m1The sections mentioned in the margins refer to DIN EN 1992-1-1 (German National
Annex) [6], unless otherwise specified
220 VERiFiCATiON MANUAL - Design Code Benchmarks | SOFiSTiK 2018

DCE-EN28: Design of a T-section for bending and shear using Design Elements
Reinforcement depth d, for three layers of re-bars with ϕ25:
cnom = cmn + Δcde = 25 + 10 = 35 mm 4.4.1.1:(2) Eq. (4.1) Nominal concretecover
d = h − cnom − 2.5 · ϕ
d = 720 − 35 − 2.5 · 25 = 620 mmAssumptions: Stirrups ϕSt ≤ 10 mmLongitudinal reinforcement: ϕ25 in 3-layersReinforcement and spacing: (3 +2)/2 = 2.5
Design cross-section:
beƒ ƒ /hƒ /b/h/d = 2.40/0.12/0.26/0.72/0.62 m
Using design table for T-beams: μs - Table for T-beams (Tab. 9.4) [3]
μEds =MEds
beƒ ƒ · d2 · ƒcd=
1086.0
2.4 · 0.622 · 19.83= 0.0594
For μEds = 0.0594 and beƒ ƒ /b = 9.23,
table 9.4 of [3] results in ω1 = 0.0609
Required bottom-reinforcement for bending at the design section:
As1 =1
ƒyd(ω1 · beƒ ƒ · d · ƒcd) = 41.34 cm2 Equation from table 9.4 in [3]
Design for Shear:
Design section at: = 0.5 · 0.2 + 0.62 = 0.72 m Distance from center of elastomer sup-port with thickness b=200 mm [4]
Design shear force: VRd,s = 272.0 kN
Vertical reinforcement from shear resistance:
VRd,s = (ASW/S) · z · ƒyd · cotθ 6.2.3:(3) Eq. (6.8)
(ASW/S) =VRd,s
z · ƒyd · cotθ
cotθ = 1.2 6.2.3:(2), simplified for pure bending [4]
z = 0.9d = 0.9 · 0.62 = 0.558 m
Required total shear reinforcement at the design section:
(ASW/S) =272.0
0.558 · 434.78 · 1.2= 9.33 cm2/m
SOFiSTiK 2018 | VERiFiCATiON MANUAL - Design Code Benchmarks 221

DCE-EN28: Design of a T-section for bending and shear using Design Elements
29.5 Conclusion
It has been demonstrated in this example that, using Design Elements in SOFiSTiK, a structural membermodeled out of different finite element types can be designed with a unifying full cross section. Thecritical internal forces were well approximated and reasonable design results were obtained.
29.6 Literature
[3] K. Holschemacher, T. Muller, and F. Lobisch. Bemessungshilfsmittel fur Betonbauteile nach Eu-rocode 2 Bauingenieure. 3rd. Ernst & Sohn, 2012.
[4] Beispiele zur Bemessung nach Eurocode 2 - Band 1: Hochbau. Ernst & Sohn. Deutschen Beton-und Bautechnik-Verein E.V. 2011.
[6] EN 1992-1-1: Eurocode 2: Design of concrete structures, Part 1-1: General rules and rules forbuildings. CEN. 2004.
222 VERiFiCATiON MANUAL - Design Code Benchmarks | SOFiSTiK 2018

DCE-EN29: Design of restrained steel column
30 DCE-EN29: Design of restrained steel column
Overview
Design Code Family(s): DIN
Design Code(s): DIN EN 1993-1-1
Module(s): BDK
Input file(s): design schneider example 8-41.dat
30.1 Problem Description
The problem consists of a simply supported beam with a steel HEA 200 section which is restrained inthe middle of the length. The column is subjecteded to compression and bending as shown in Fig. 30.1.
XYZ
N = 300 kN
q=4kN/m
Figure 30.1: Problem Description
SOFiSTiK 2018 | VERiFiCATiON MANUAL - Design Code Benchmarks 223

DCE-EN29: Design of restrained steel column
30.2 Reference Solution
This example is concerned with the buckling resistance of steel members. It deals with the spatialbehavior of the beam and the occurrence of lateral torsional buckling as a potential mode of failure. Thecontent of this problem is covered by the following parts of DIN EN 1993-1-1:2005 [21]:
• Structural steel (Section 3.2 )
• Classification of cross-sections (Section 5.5)
• Buckling resistance of members (Section 6.3)
• Method 2: Interaction factors kj for interaction formula in 6.3.3(4) (Annex B)
30.3 Model and Results
Table 30.1: Model Properties
Material Properties Cross-Section Properties GeometricProperties
Loading
S 235 h = 190 mm H = 8.0 m q = 4.00 kN/m
E = 210000 N/mm2 b = 200 mm
ƒy = 235 N/mm2 c = 32 mm
ν = 0.3 r = 18 mm
G = 81000 N/mm2 tƒ = 10 mm
γM0 = 1.0 t = 6.5 mm
γM1 = 1.1 A = 5308 mm2
y = 82.8 mm
z = 49.8 mm
y = 3690 cm4
z = 1340 cm4
t = 21 cm4
Table 30.2: Results
SOF. Ref. [8]
Lcr,y [m] 8.00 8.00
Lcr,z [m] 4.00 4.00
Np,Rd [kN] 1265.0 1264.3
Mp,y,Rd [kNm] 100.92 100.90
224 VERiFiCATiON MANUAL - Design Code Benchmarks | SOFiSTiK 2018
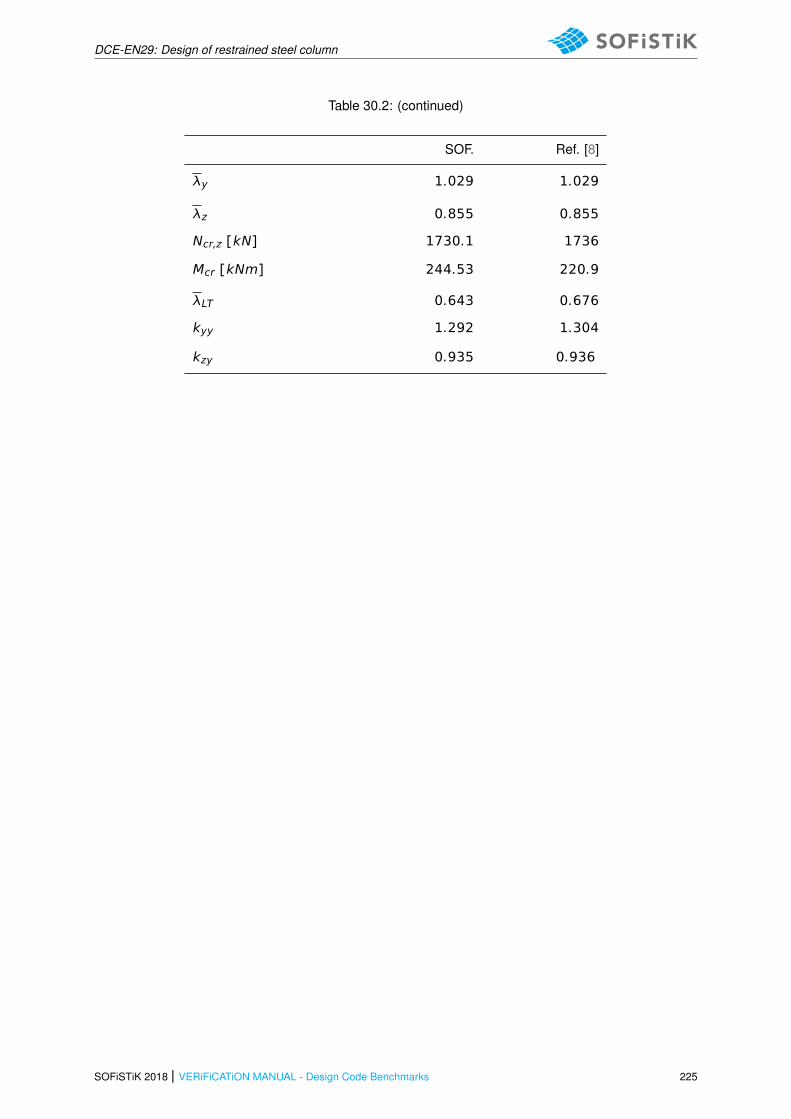
DCE-EN29: Design of restrained steel column
Table 30.2: (continued)
SOF. Ref. [8]
λy 1.029 1.029
λz 0.855 0.855
Ncr,z [kN] 1730.1 1736
Mcr [kNm] 244.53 220.9
λLT 0.643 0.676
kyy 1.292 1.304
kzy 0.935 0.936
SOFiSTiK 2018 | VERiFiCATiON MANUAL - Design Code Benchmarks 225

DCE-EN29: Design of restrained steel column
30.4 Design Process1
Design Loads:
Nd = 300 kN
q = 4.0 kN/m
My,d = q · L2/8 = 4.0 · 82/8 = 32.0 kNm
Mz,d = 0
Buckling lengths:
Lcr,y = 8.00 m
Lcr,z = 4.00 m
ξ = 1.35
Characteristic values:
NRk = Np,Rd = 1264.3 kN
My,Rk = Mp,y,Rd = 100.9 kNm
z = 1340 cm4z - second moment of area
= 108000 cm6 - warping resistance
t = 21.0 cm4t - torsional moment of inertia
y = 8.28 cm
z = 4.98 cm
zp = −9.5 cm
Buckling around the y-y axis:
λy = 800/(8.28 · 93.9) = 1.029→ χ = 0.58 (Curve b)
λz = 400/(4.98 · 93.9) = 0.855→ χ = 0.63 (Curve c)
Critical loading:
Ncr,z = π2 · 21000 · 1340/4002 = 1736 kNNcr - elastic critical force for the relevantbuckling mode based on the gross crosssectional properties c2 = (108000 + 0.039 · 4002 · 21.0)/1340 = 178.4 cm2
Mcr = 1.35 · 1736 ·�p
178.4 + 0.25 · 9.52 + 0.5 · (−9.5)�
· 102Mcr - elastic critical moment for lateral-torsional buckling
Mcr = 220.9 kNm1The sections mentioned in the margins refer to DIN EN 1993-1-1:2005 [21] unless
otherwise specified.
226 VERiFiCATiON MANUAL - Design Code Benchmarks | SOFiSTiK 2018

DCE-EN29: Design of restrained steel column
0.00
1.00
2.00
3.00
4.00
5.00
6.00
7.00
-300.0
-300.0
32.0
0.00
1.00
2.00
3.00
4.00
5.00
6.00
7.00
Figure 30.2: Internal forces My and N
λLT =p
100.9/220.9 = 0.676 λLT - non dimensional slenderness forlateral torsional buckling
h/b = 190/200 = 0.95 < 2.0→ Class b
χLT =1
LT +r
2LT − β · λ2LT
LT = 0.5 ·h
1 + αLT · (λLT − λLT,0) + β · λ2LT
i
χLT = 0.88 < 2.188 = 1/0.6762 χLT - reduction factor
Mb,Rd = Mp,y,Rd ·χLT
ƒ·1
γM1
ƒ = 1 − 0.5 · (1 − kc) ·�
1 − 2.0 · (λLT − 0.82)�
ƒ - the value f may be defined in NationalAnnex, see EC 3, §6.3.2.3(2)
ƒ = 1 − 0.5 · (1 − 0.94) ·�
1 − 2.0 · (0.676 − 0.82)�
ƒ = 0.972
Mb,Rd = 100.9 ·0.88
0.972·1
1.1
Mb,Rd = 83.045 kNm mb,Rd - design buckling resistance mo-ment - EC 3, §6.3.2.1, Eq. 6.55
Equivalent uniform moment factors:
SOFiSTiK 2018 | VERiFiCATiON MANUAL - Design Code Benchmarks 227
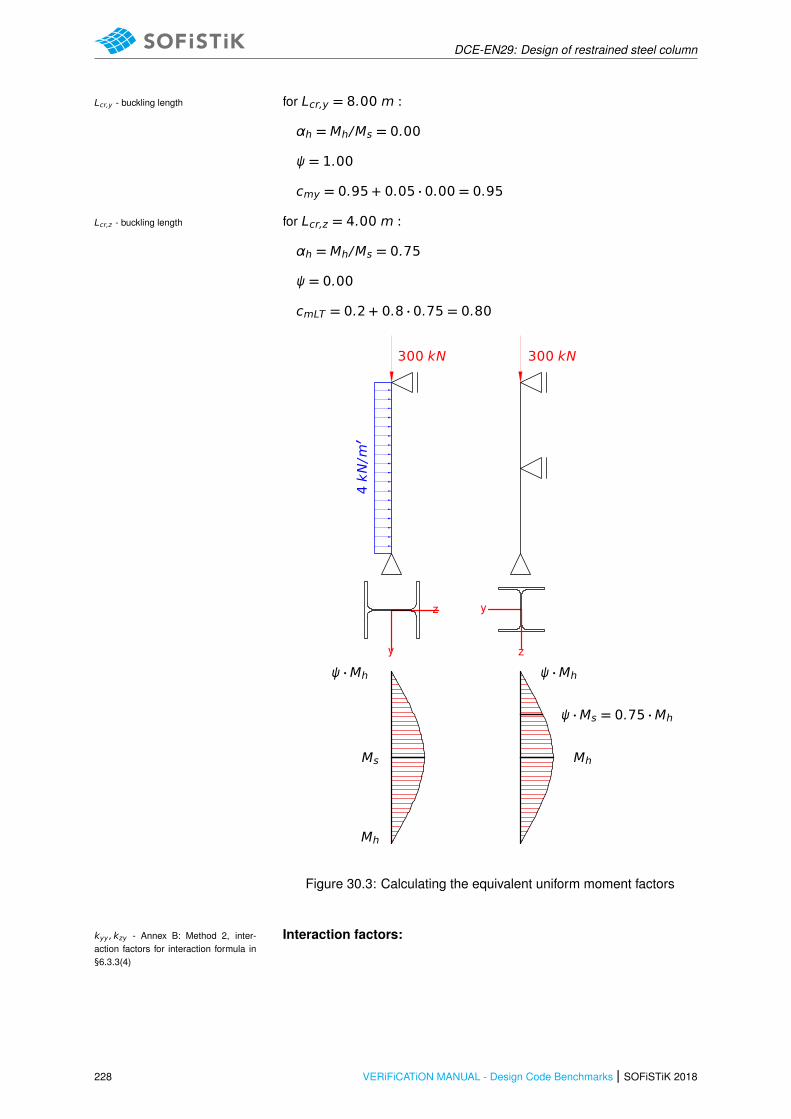
DCE-EN29: Design of restrained steel column
for Lcr,y = 8.00 m :Lcr,y - buckling length
αh = Mh/Ms = 0.00
ψ = 1.00
cmy = 0.95 + 0.05 · 0.00 = 0.95
for Lcr,z = 4.00 m :Lcr,z - buckling length
αh = Mh/Ms = 0.75
ψ = 0.00
cmLT = 0.2 + 0.8 · 0.75 = 0.80
300 kN 300 kN4kN/m′
ψ ·Mh
Ms
Mh
ψ ·Mh
ψ ·Ms = 0.75 ·Mh
Mh
y
z
z
y
Figure 30.3: Calculating the equivalent uniform moment factors
Interaction factors:kyy , kzy - Annex B: Method 2, inter-action factors for interaction formula in§6.3.3(4)
228 VERiFiCATiON MANUAL - Design Code Benchmarks | SOFiSTiK 2018
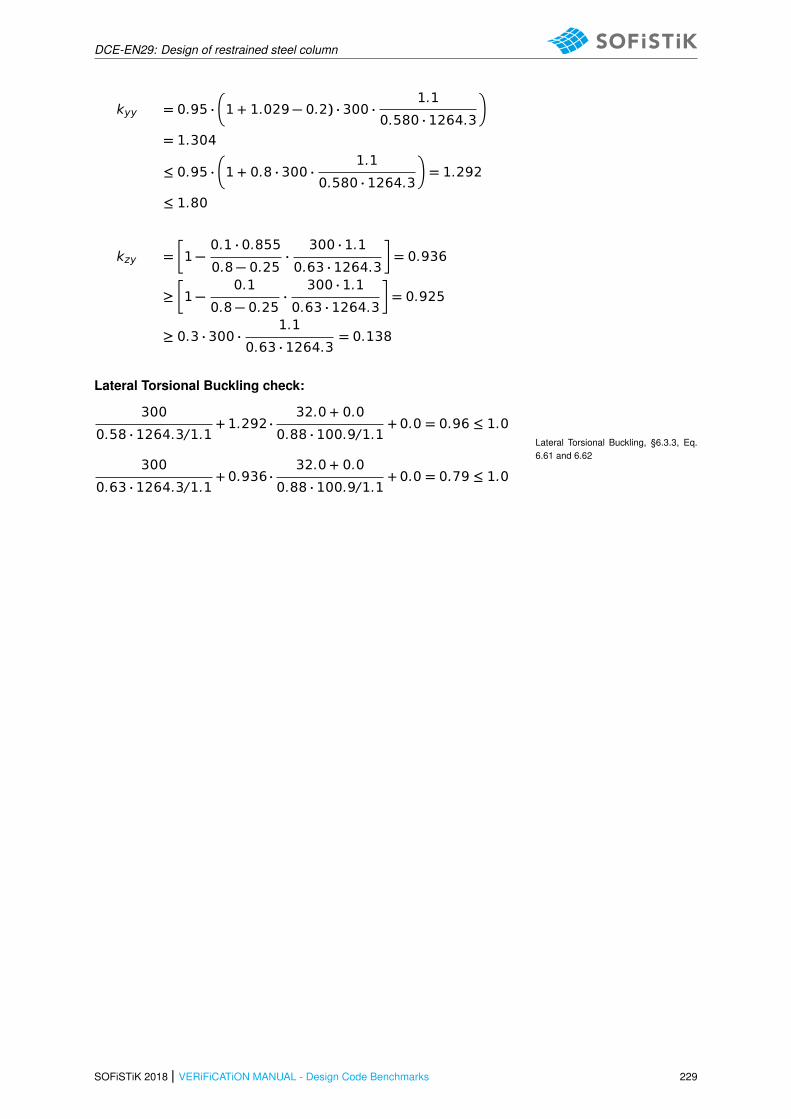
DCE-EN29: Design of restrained steel column
kyy = 0.95 ·�
1 + 1.029 − 0.2) · 300 ·1.1
0.580 · 1264.3
�
= 1.304
≤ 0.95 ·�
1 + 0.8 · 300 ·1.1
0.580 · 1264.3
�
= 1.292
≤ 1.80
kzy =�
1 −0.1 · 0.855
0.8 − 0.25·
300 · 1.1
0.63 · 1264.3
�
= 0.936
≥�
1 −0.1
0.8 − 0.25·
300 · 1.1
0.63 · 1264.3
�
= 0.925
≥ 0.3 · 300 ·1.1
0.63 · 1264.3= 0.138
Lateral Torsional Buckling check:
300
0.58 · 1264.3/1.1+ 1.292 ·
32.0 + 0.0
0.88 · 100.9/1.1+ 0.0 = 0.96 ≤ 1.0
Lateral Torsional Buckling, §6.3.3, Eq.6.61 and 6.62
300
0.63 · 1264.3/1.1+ 0.936 ·
32.0 + 0.0
0.88 · 100.9/1.1+ 0.0 = 0.79 ≤ 1.0
SOFiSTiK 2018 | VERiFiCATiON MANUAL - Design Code Benchmarks 229
DCE-EN29: Design of restrained steel column
30.5 Conclusion
This example shows the check for lateral torsional buckling of steel members. The small deviations thatoccur in some results come from the fact that there are some small differences in the sectional valuesand elastic critical loadings (Mcr , Ncr). Therefore, these deviations are of no interest for the specificverification process. In conclusion, it has been shown that the results are reproduced with excellentaccuracy.
30.6 Literature
[8] Schneider. Bautabellen fur Ingenieure. 21th. Bundesanzeiger Verlag, 2014.[21] DIN EN 1993-1-1:2005 Eurocode 3: Design of steel structures, Part 1-1: General rules and rules
for buildings - Deutsche Fassung EN 1993-1-1:2005 + AC:2009. CEN. 2010.
230 VERiFiCATiON MANUAL - Design Code Benchmarks | SOFiSTiK 2018
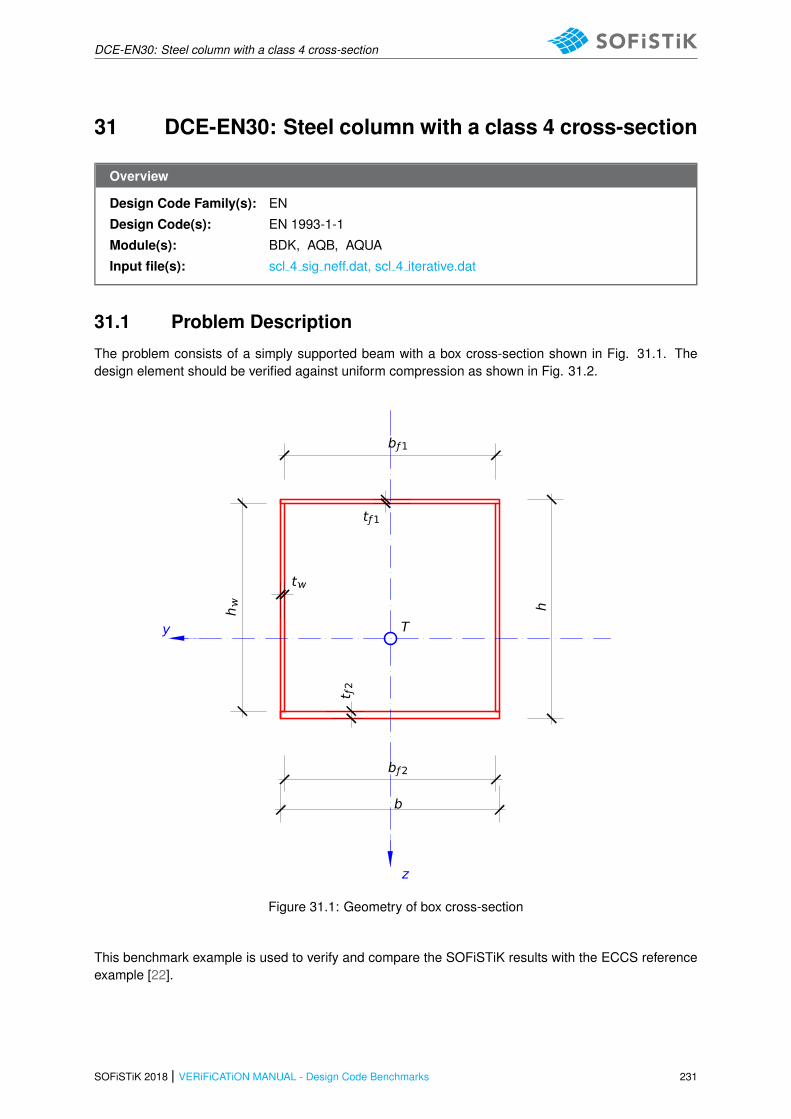
DCE-EN30: Steel column with a class 4 cross-section
31 DCE-EN30: Steel column with a class 4 cross-section
Overview
Design Code Family(s): EN
Design Code(s): EN 1993-1-1
Module(s): BDK, AQB, AQUA
Input file(s): scl 4 sig neff.dat, scl 4 iterative.dat
31.1 Problem Description
The problem consists of a simply supported beam with a box cross-section shown in Fig. 31.1. Thedesign element should be verified against uniform compression as shown in Fig. 31.2.
b
bƒ2
bƒ1
h h
tƒ1
t ƒ2
t
T
z
y
Figure 31.1: Geometry of box cross-section
This benchmark example is used to verify and compare the SOFiSTiK results with the ECCS referenceexample [22].
SOFiSTiK 2018 | VERiFiCATiON MANUAL - Design Code Benchmarks 231
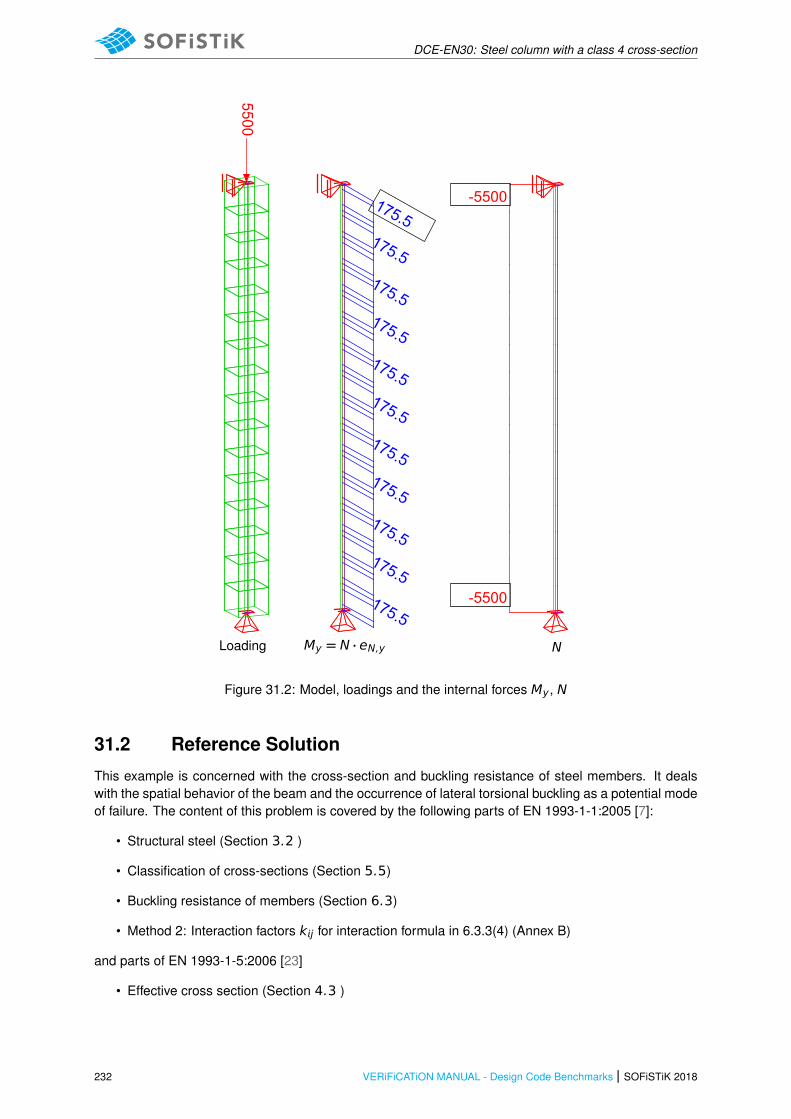
DCE-EN30: Steel column with a class 4 cross-section
0.00 2.00 4.00 6.00
5500
2 00 0 00 2 00 4 00
175.5175.5
175.5
175.5
175.5
175.5
175.5
175.5
175.5
175.5
175.5
00 -4.00 -2.00 0.00
-5500
-5500
Loading My = N · eN,y N
Figure 31.2: Model, loadings and the internal forces My, N
31.2 Reference Solution
This example is concerned with the cross-section and buckling resistance of steel members. It dealswith the spatial behavior of the beam and the occurrence of lateral torsional buckling as a potential modeof failure. The content of this problem is covered by the following parts of EN 1993-1-1:2005 [7]:
• Structural steel (Section 3.2 )
• Classification of cross-sections (Section 5.5)
• Buckling resistance of members (Section 6.3)
• Method 2: Interaction factors kj for interaction formula in 6.3.3(4) (Annex B)
and parts of EN 1993-1-5:2006 [23]
• Effective cross section (Section 4.3 )
232 VERiFiCATiON MANUAL - Design Code Benchmarks | SOFiSTiK 2018

DCE-EN30: Steel column with a class 4 cross-section
31.3 Model and Results
Table 31.1: Model Properties
Material Properties Cross-Section Properties GeometricProperties
Loading
S 275 h = 600 mm H = 4.0 m N = 5500 kN
E = 210000 N/mm2 b = 600 mm
ƒy = 275 N/mm2 tƒ1 = 10 mm
ν = 0.3 tƒ2 = 20 mm
G = 81000 N/mm2 t = 10 mm
γM0 = 1.0 A = 29400 mm2
γM1 = 1.0 y = 174800.0 cm4
z = 153200.0 cm4
Table 31.2: Results
SOF.(Iterative)
SOF.(SIG NEFF)
Ref. [8]
Aeƒ ƒ [ cm2] 257.6 244.6 247.78
y,eƒ ƒ [cm4] 155600.0 149700.0 154000.0
eN,y [mm] 25.78 31.90 30.1
bƒ1,1 [mm] 218.4 211.2 210.2
bƒ1,eƒ ƒ [mm] 143.2 167.6 159.5
bƒ1,2 [mm] 218.4 211.2 210.2
b2,1 [mm] 229.7 210.8 209.3
b2,eƒ ƒ [mm] 110.6 163.4 151.3
b2,2 [mm] 229.7 210.8 209.3
b4,1 [mm] 229.7 210.8 209.3
b4,eƒ ƒ [mm] 110.6 163.4 151.3
b4,2 [mm] 229.7 210.8 209.3
Tottston - 0.98 0.95
λLT 1.0 1.0 1.0
λy 0.189 0.172 0.173
SOFiSTiK 2018 | VERiFiCATiON MANUAL - Design Code Benchmarks 233
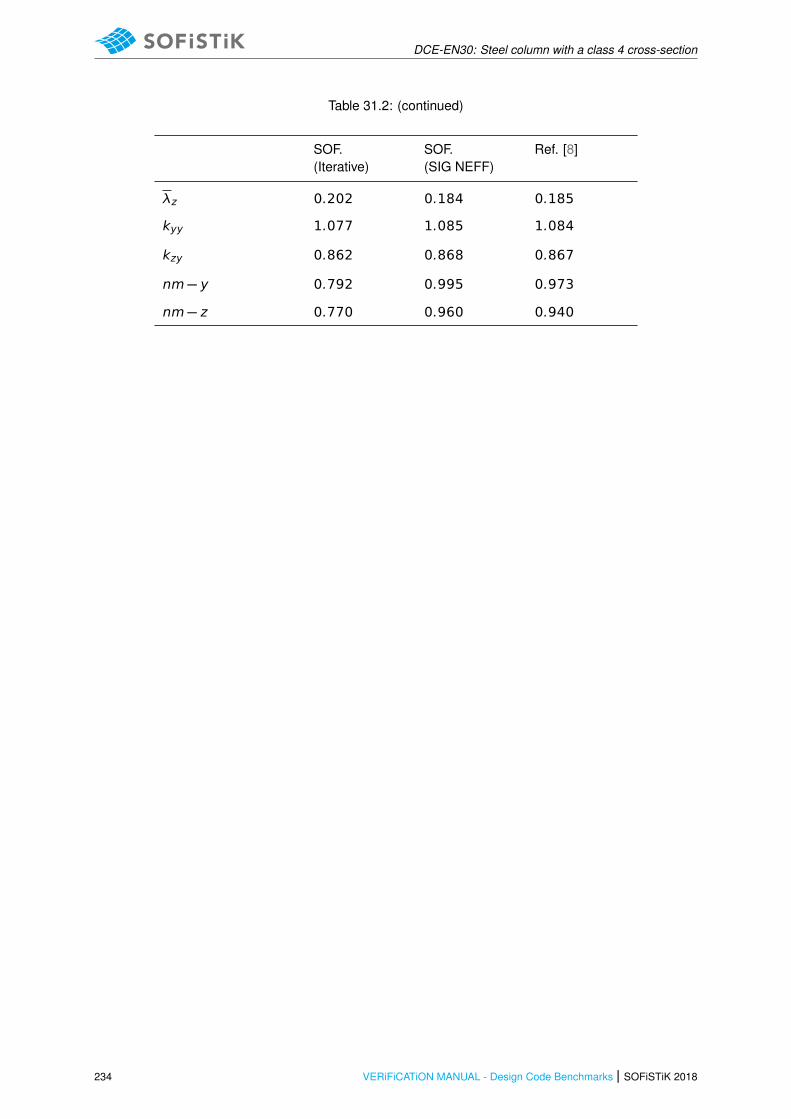
DCE-EN30: Steel column with a class 4 cross-section
Table 31.2: (continued)
SOF.(Iterative)
SOF.(SIG NEFF)
Ref. [8]
λz 0.202 0.184 0.185
kyy 1.077 1.085 1.084
kzy 0.862 0.868 0.867
nm − y 0.792 0.995 0.973
nm − z 0.770 0.960 0.940
234 VERiFiCATiON MANUAL - Design Code Benchmarks | SOFiSTiK 2018
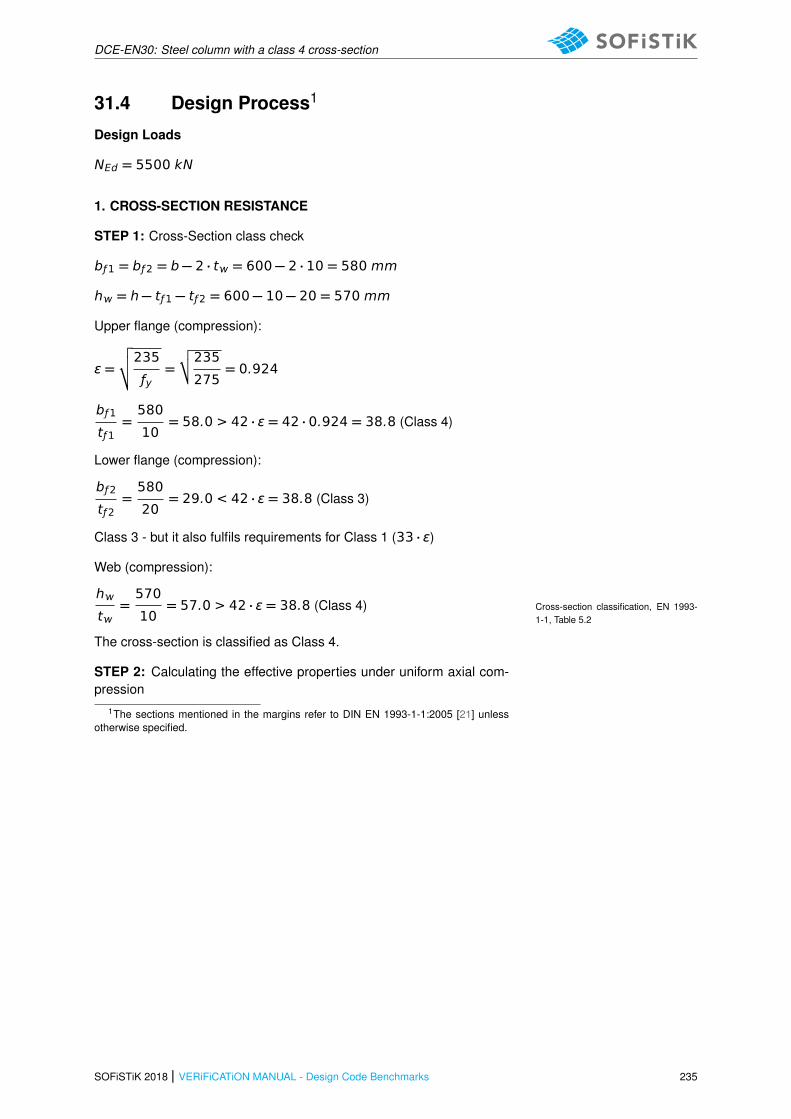
DCE-EN30: Steel column with a class 4 cross-section
31.4 Design Process1
Design Loads
NEd = 5500 kN
1. CROSS-SECTION RESISTANCE
STEP 1: Cross-Section class check
bƒ1 = bƒ2 = b − 2 · t = 600 − 2 · 10 = 580 mm
h = h − tƒ1 − tƒ2 = 600 − 10 − 20 = 570 mm
Upper flange (compression):
ϵ =
√
√
√
235
ƒy=
√
√235
275= 0.924
bƒ1
tƒ1=580
10= 58.0 > 42 · ϵ = 42 · 0.924 = 38.8 (Class 4)
Lower flange (compression):
bƒ2
tƒ2=580
20= 29.0 < 42 · ϵ = 38.8 (Class 3)
Class 3 - but it also fulfils requirements for Class 1 (33 · ϵ)
Web (compression):
h
t=570
10= 57.0 > 42 · ϵ = 38.8 (Class 4) Cross-section classification, EN 1993-
1-1, Table 5.2
The cross-section is classified as Class 4.
STEP 2: Calculating the effective properties under uniform axial com-pression
1The sections mentioned in the margins refer to DIN EN 1993-1-1:2005 [21] unlessotherwise specified.
SOFiSTiK 2018 | VERiFiCATiON MANUAL - Design Code Benchmarks 235

DCE-EN30: Steel column with a class 4 cross-section
1112
2
2
34
4
4
Figure 31.3: Effective area for uniform compression
Determination of the characteristics of the gross cross section
Sy = b · tƒ1 ·�
h −tƒ1 + tƒ1
2
�
+ 2 · h · t ·�
h + tƒ22
�
Sy =1
29400
�
600 · 10 ·�
600 −10 + 20
2
�
+ 2
· 570 · 10 ·�
600 −570 + 20
2
��
Sy = 6.873 · 106 mm3
rt =Sy
A=6.873 · 106
29400.0= 233.8 mm
where:
Sy is the first moment of area of the gross cross section with respect tothe centroid of the lower flange (y-y axis),
rt is the distance from the centroid of the lower flange to the centroidof the gross cross-section
Calculation of effectivep width of the upper flange
ψ = 1.0→ kσ = 4.0
λp =bƒ1
tƒ1 · 28.4 · ϵ ·p
kσ=
580
10 · 28.4 · 0.924 ·p4.0
= 1.105Plate elements without longitudinal stiff-eners, EN 1993-1-5, 4.4
λp = 1.105 > 0.5 +p0.085 − 0.055 · Ψ
= 0.5 +p0.085 − 0.055 · 1 = 0.673
236 VERiFiCATiON MANUAL - Design Code Benchmarks | SOFiSTiK 2018
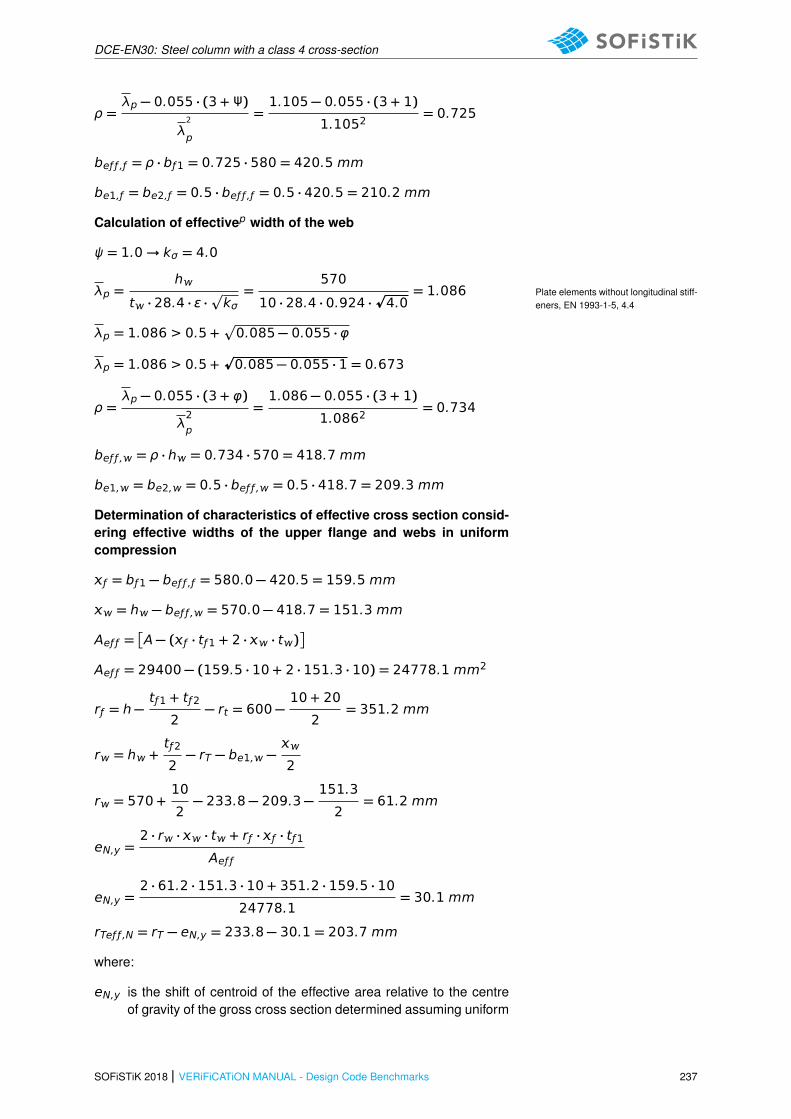
DCE-EN30: Steel column with a class 4 cross-section
ρ =λp − 0.055 · (3 + Ψ)
λ2
p
=1.105 − 0.055 · (3 + 1)
1.1052= 0.725
beƒ ƒ ,ƒ = ρ · bƒ1 = 0.725 · 580 = 420.5 mm
be1,ƒ = be2,ƒ = 0.5 · beƒ ƒ ,ƒ = 0.5 · 420.5 = 210.2 mm
Calculation of effectivep width of the web
ψ = 1.0→ kσ = 4.0
λp =h
t · 28.4 · ϵ ·p
kσ=
570
10 · 28.4 · 0.924 ·p4.0
= 1.086 Plate elements without longitudinal stiff-eners, EN 1993-1-5, 4.4
λp = 1.086 > 0.5 +p
0.085 − 0.055 · φ
λp = 1.086 > 0.5 +p0.085 − 0.055 · 1 = 0.673
ρ =λp − 0.055 · (3 + φ)
λ2p
=1.086 − 0.055 · (3 + 1)
1.0862= 0.734
beƒ ƒ , = ρ · h = 0.734 · 570 = 418.7 mm
be1, = be2, = 0.5 · beƒ ƒ , = 0.5 · 418.7 = 209.3 mm
Determination of characteristics of effective cross section consid-ering effective widths of the upper flange and webs in uniformcompression
ƒ = bƒ1 − beƒ ƒ ,ƒ = 580.0 − 420.5 = 159.5 mm
= h − beƒ ƒ , = 570.0 − 418.7 = 151.3 mm
Aeƒ ƒ =�
A − (ƒ · tƒ1 + 2 · · t)�
Aeƒ ƒ = 29400 − (159.5 · 10 + 2 · 151.3 · 10) = 24778.1 mm2
rƒ = h −tƒ1 + tƒ2
2− rt = 600 −
10 + 20
2= 351.2 mm
r = h +tƒ2
2− rT − be1, −
2
r = 570 +10
2− 233.8 − 209.3 −
151.3
2= 61.2 mm
eN,y =2 · r · · t + rƒ · ƒ · tƒ1
Aeƒ ƒ
eN,y =2 · 61.2 · 151.3 · 10 + 351.2 · 159.5 · 10
24778.1= 30.1 mm
rTeƒ ƒ ,N = rT − eN,y = 233.8 − 30.1 = 203.7 mm
where:
eN,y is the shift of centroid of the effective area relative to the centreof gravity of the gross cross section determined assuming uniform
SOFiSTiK 2018 | VERiFiCATiON MANUAL - Design Code Benchmarks 237

DCE-EN30: Steel column with a class 4 cross-section
axial compression.
rTeƒ ƒ ,N is the distance from the centroid of the bottom flange to thecentroid of the effective cross-section under uniform compression.
STEP 3: Calculating the effective properties assuming the cross-section is subject only to bending stresses
The effective section modulus Weƒ ƒ ,y is determined on the cross-section subject only to bending moment.
Cross section class check
Upper flange (compression the same as in 1): Class 4
111
2
3
4
Figure 31.4: Effective area for bending
Determination of characteristics of effective cross section consider-ing effective widths of the upper flange (calculation of effective width ofthe upper flange is already done in section 1) and gross cross sectionof the web:
Aeƒ ƒ = A − ƒ · tƒ1
Aeƒ ƒ = 29400 − 159.5 · 10 = 27804.9 mm
ΔrT,m =rƒ · ƒ · tƒ1
Aeƒ ƒ=351.2 · 159.5 · 10
24778.1= 20.1 mm
rTeƒ ƒ ,M = rT − ΔrT,M = 233.8 − 20.1 = 213.6 mm
eƒ ƒ ,y
= y + Aeƒ ƒ · Δr2T,M −
ƒ · t3ƒ12
+ ƒ · tƒ · (rƒ + ΔrT,M)2!
eƒ ƒ ,y
= 1.748 · 109 + 27804.9 · 20.12 −�
159.5 · 103
12+
238 VERiFiCATiON MANUAL - Design Code Benchmarks | SOFiSTiK 2018
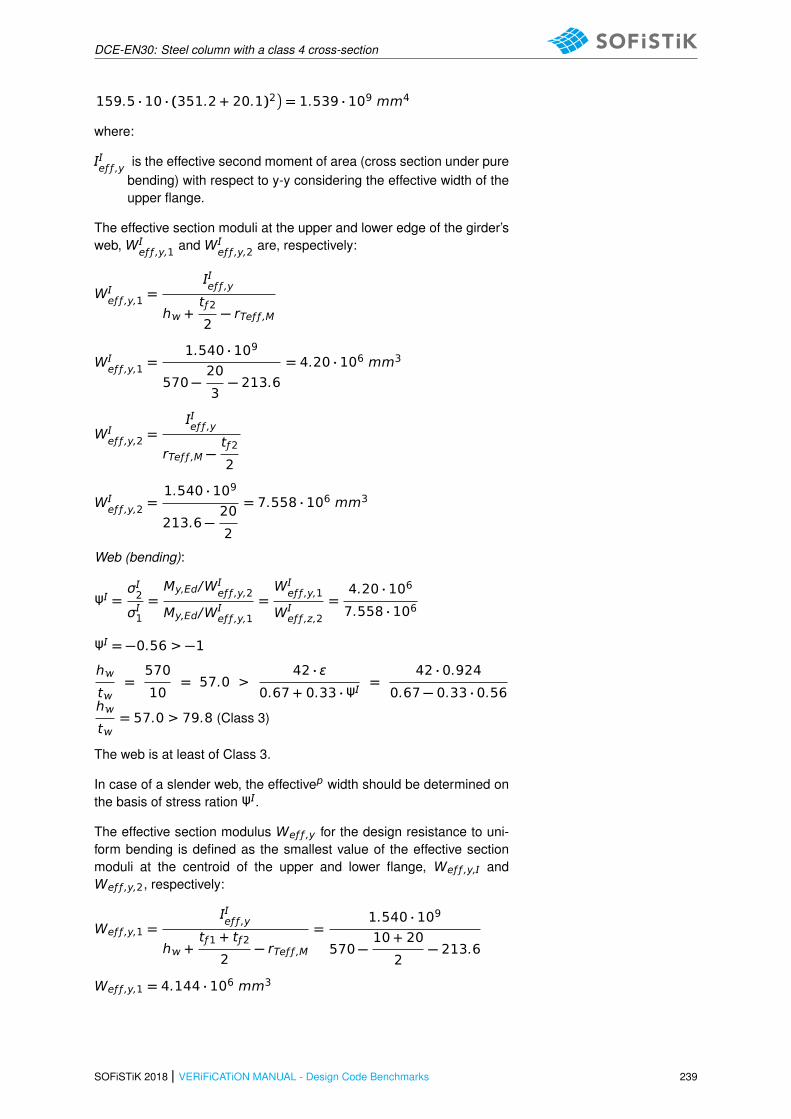
DCE-EN30: Steel column with a class 4 cross-section
159.5 · 10 · (351.2 + 20.1)2�
= 1.539 · 109 mm4
where:
eƒ ƒ ,y
is the effective second moment of area (cross section under purebending) with respect to y-y considering the effective width of theupper flange.
The effective section moduli at the upper and lower edge of the girder’sweb, W
eƒ ƒ ,y,1 and Weƒ ƒ ,y,2 are, respectively:
Weƒ ƒ ,y,1 =
eƒ ƒ ,y
h +tƒ2
2− rTeƒ ƒ ,M
Weƒ ƒ ,y,1 =
1.540 · 109
570 −20
3− 213.6
= 4.20 · 106 mm3
Weƒ ƒ ,y,2 =
eƒ ƒ ,y
rTeƒ ƒ ,M −tƒ2
2
Weƒ ƒ ,y,2 =
1.540 · 109
213.6 −20
2
= 7.558 · 106 mm3
Web (bending):
Ψ =σ2
σ1=My,Ed/W
eƒ ƒ ,y,2
My,Ed/Weƒ ƒ ,y,1
=W
eƒ ƒ ,y,1
Weƒ ƒ ,z,2
=4.20 · 106
7.558 · 106
Ψ = −0.56 > −1
h
t=570
10= 57.0 >
42 · ϵ
0.67 + 0.33 · Ψ=
42 · 0.924
0.67 − 0.33 · 0.56h
t= 57.0 > 79.8 (Class 3)
The web is at least of Class 3.
In case of a slender web, the effectivep width should be determined onthe basis of stress ration Ψ .
The effective section modulus Weƒ ƒ ,y for the design resistance to uni-form bending is defined as the smallest value of the effective sectionmoduli at the centroid of the upper and lower flange, Weƒ ƒ ,y, andWeƒ ƒ ,y,2, respectively:
Weƒ ƒ ,y,1 = eƒ ƒ ,y
h +tƒ1 + tƒ2
2− rTeƒ ƒ ,M
=1.540 · 109
570 −10 + 20
2− 213.6
Weƒ ƒ ,y,1 = 4.144 · 106 mm3
SOFiSTiK 2018 | VERiFiCATiON MANUAL - Design Code Benchmarks 239

DCE-EN30: Steel column with a class 4 cross-section
Weƒ ƒ ,y,2 = eƒ ƒ ,y
zTeƒ ƒ=1.540 · 109
213.6= 7.205 · 106 mm3
Here, Weƒ ƒ ,y,1 governs.
STEP 4: Cross section resistance check
Additional bending moment NEd ·eN,y causes compression at the upperflange (+compression).
NEd
Aeƒ ƒ · ƒy/γM0+
NEd · eN,yWeƒ ƒ ,y,1 · ƒy/γM0
Class 4-sections, EN 1993-1-1, 6.2.9.3,Eq. 6.44
=5.5 · 106
24778.1 · 275/1.0+
5.5 · 106 · 30.1
4.144 · 106 · 275/1.0
= 0.807 + 0.145
= 0.95 < 1.0 Satisfactory
2. STABILITY CHECK
In this example Method 2 is applied. Since the member has a rectangu-lar hollow cross-section, the member is not susceptible to torsional de-formation, so flexural buckling constitutes the relevant instability modeand χLT = 1.00
STEP 1: Characteristic resistance of the section
NRk = A · ƒy = 24778.1 · 275 = 6813977.5 N = 6813.97 kNNRk is calculated assuming that thecross-section is subject only to stressesdue to uniform axial compression, EN1993-1-5, 4.3(4).
My,Rk =Wp,y · ƒy = 4.144 · 106 · 275 = 1139.6 · 10−6 Nm
My,Rk is calculated assuming the crosssection is subject only to bendingstresses, EN 1993-1-5, 4.3(4)
My,Rk = 1139.6 kNm
STEP 2: Reduction coefficients due to flexural buckling, χy and χz
Plane xz (buckling about y)
Lcr,y = β · L = 4.00 m
λy =Lcr,y
y·
√
√Aeƒ ƒ
Aλ1
EN 1993-1-1, Eq. 6.51
y =
√
√ y
A=
√
√174700.00
294.00= 24.38 cm
λ1 = 93.9 · ϵ
ϵ =
√
√
√
235
ƒy=
√
√235
275= 0.9244
λy =400
24.38·
√
√247.78
294.0093.9 · 0.9244
EN 1993-1-1, Eq. 6.51
λy = 0.173
240 VERiFiCATiON MANUAL - Design Code Benchmarks | SOFiSTiK 2018
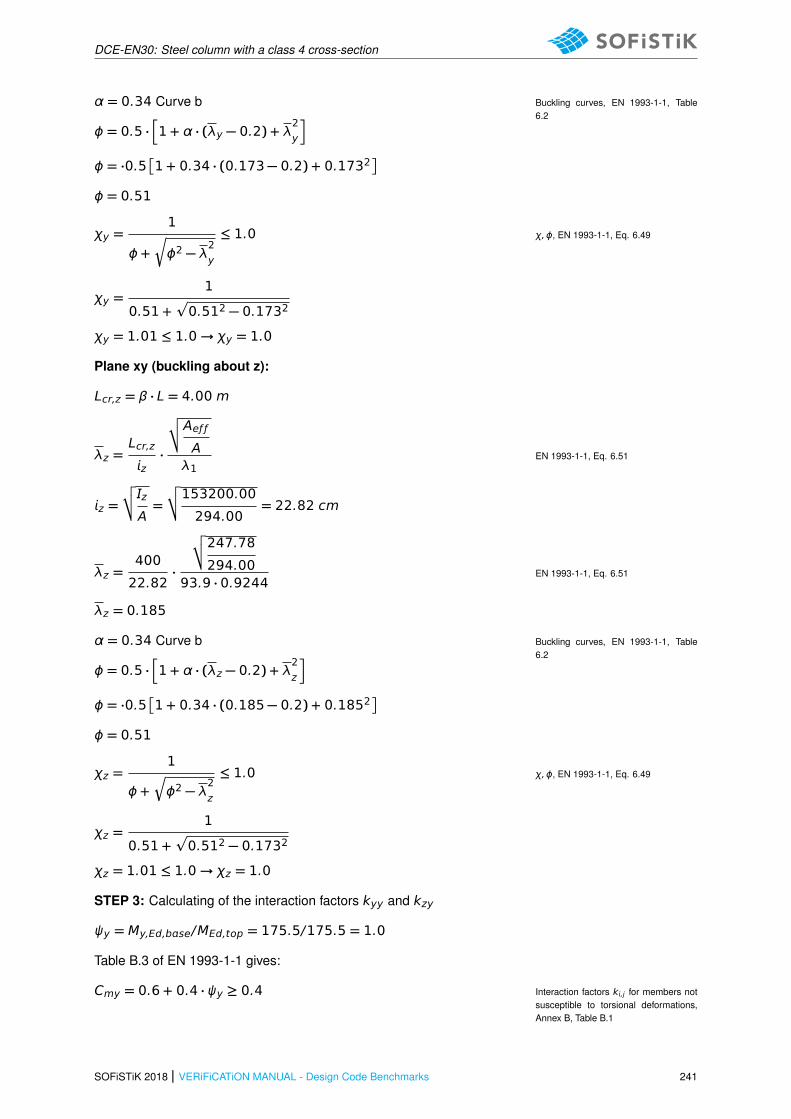
DCE-EN30: Steel column with a class 4 cross-section
α = 0.34 Curve b Buckling curves, EN 1993-1-1, Table6.2
ϕ = 0.5 ·h
1 + α · (λy − 0.2) + λ2y
i
ϕ = ·0.5�
1 + 0.34 · (0.173 − 0.2) + 0.1732�
ϕ = 0.51
χy =1
ϕ +s
ϕ2 − λ2y
≤ 1.0 χ,ϕ, EN 1993-1-1, Eq. 6.49
χy =1
0.51 +p
0.512 − 0.1732
χy = 1.01 ≤ 1.0→ χy = 1.0
Plane xy (buckling about z):
Lcr,z = β · L = 4.00 m
λz =Lcr,z
z·
√
√Aeƒ ƒ
Aλ1
EN 1993-1-1, Eq. 6.51
z =
√
√ z
A=
√
√153200.00
294.00= 22.82 cm
λz =400
22.82·
√
√247.78
294.0093.9 · 0.9244
EN 1993-1-1, Eq. 6.51
λz = 0.185
α = 0.34 Curve b Buckling curves, EN 1993-1-1, Table6.2
ϕ = 0.5 ·h
1 + α · (λz − 0.2) + λ2z
i
ϕ = ·0.5�
1 + 0.34 · (0.185 − 0.2) + 0.1852�
ϕ = 0.51
χz =1
ϕ +r
ϕ2 − λ2z
≤ 1.0 χ,ϕ, EN 1993-1-1, Eq. 6.49
χz =1
0.51 +p
0.512 − 0.1732
χz = 1.01 ≤ 1.0→ χz = 1.0
STEP 3: Calculating of the interaction factors kyy and kzy
ψy = My,Ed,bse/MEd,top = 175.5/175.5 = 1.0
Table B.3 of EN 1993-1-1 gives:
Cmy = 0.6 + 0.4 · ψy ≥ 0.4 Interaction factors k,j for members notsusceptible to torsional deformations,Annex B, Table B.1
SOFiSTiK 2018 | VERiFiCATiON MANUAL - Design Code Benchmarks 241

DCE-EN30: Steel column with a class 4 cross-section
Cmy = 0.6 + 0.4 · 1.0 = 1.0
kyy = Cmy ·�
1 + 0.6 · λy ·NEd
χy ·NRk
�
≤ Cmy ·�
1 + 0.6 ·NEd
χy ·NRk
�
kyy = 1.0 ·�
1 + 0.6 · 0.173 ·5500
1.0 · 6813.97
�
≤ 1.0 ·�
1 + 0.6 ·5500
0.173 · 6813.97
�
kyy = 1.0837 ≤ 1.484
kzy = 0.8 · kyy = 1.084 · 0.8 = 0.867
Final expression
Check for y-y
NEd
χy ·NRk
γM1
+ kyy ·My,Ed
χLT ·My,Rk
γM1
≤ 1.0Uniform members in bending and axialcompression, EN 1993-1-1, 6.3.3, Eq.6.61
5500
1.0 ·6813.9
1.0
+ 1.084 ·175
1.0 ·1139.6
1.0
≤ 1.0
0.807 + 0.166 = 0.973 ≤ 1.0→ Satisfied
Check for z-z
NEd
χz ·NRk
γM1
+ kzy ·My,Ed
χLT ·My,Rk
γM1
≤ 1.0Uniform members in bending and axialcompression, EN 1993-1-1, 6.3.3, Eq.6.62
5500
1.0 ·6813.9
1.0
+ 0.867 ·175
1.0 ·1139.6
1.0
≤ 1.0
0.807 + 0.133 = 0.94 ≤ 1.0→ Satisfied
242 VERiFiCATiON MANUAL - Design Code Benchmarks | SOFiSTiK 2018
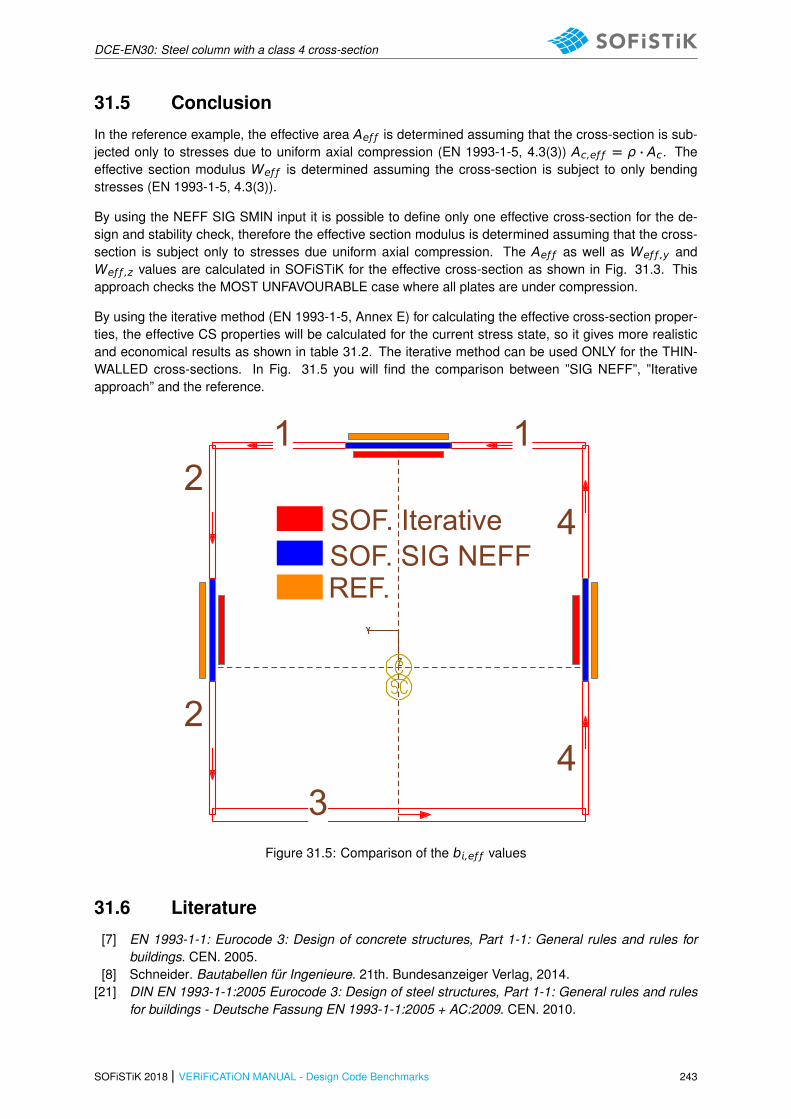
DCE-EN30: Steel column with a class 4 cross-section
31.5 Conclusion
In the reference example, the effective area Aeƒ ƒ is determined assuming that the cross-section is sub-jected only to stresses due to uniform axial compression (EN 1993-1-5, 4.3(3)) Ac,eƒ ƒ = ρ · Ac. Theeffective section modulus Weƒ ƒ is determined assuming the cross-section is subject to only bendingstresses (EN 1993-1-5, 4.3(3)).
By using the NEFF SIG SMIN input it is possible to define only one effective cross-section for the de-sign and stability check, therefore the effective section modulus is determined assuming that the cross-section is subject only to stresses due uniform axial compression. The Aeƒ ƒ as well as Weƒ ƒ ,y andWeƒ ƒ ,z values are calculated in SOFiSTiK for the effective cross-section as shown in Fig. 31.3. Thisapproach checks the MOST UNFAVOURABLE case where all plates are under compression.
By using the iterative method (EN 1993-1-5, Annex E) for calculating the effective cross-section proper-ties, the effective CS properties will be calculated for the current stress state, so it gives more realisticand economical results as shown in table 31.2. The iterative method can be used ONLY for the THIN-WALLED cross-sections. In Fig. 31.5 you will find the comparison between ”SIG NEFF”, ”Iterativeapproach” and the reference.
112
2
34
4SOF. IterativeSOF. SIG NEFFREF.
Figure 31.5: Comparison of the b,eƒ ƒ values
31.6 Literature
[7] EN 1993-1-1: Eurocode 3: Design of concrete structures, Part 1-1: General rules and rules forbuildings. CEN. 2005.
[8] Schneider. Bautabellen fur Ingenieure. 21th. Bundesanzeiger Verlag, 2014.[21] DIN EN 1993-1-1:2005 Eurocode 3: Design of steel structures, Part 1-1: General rules and rules
for buildings - Deutsche Fassung EN 1993-1-1:2005 + AC:2009. CEN. 2010.
SOFiSTiK 2018 | VERiFiCATiON MANUAL - Design Code Benchmarks 243

DCE-EN30: Steel column with a class 4 cross-section
[22] D. Beg et al. Design of plated structures. Ernst & Sohn and ECCS, 2010.[23] EN 1993-1-5: Eurocode 3: Design of steel structures, Part 1-5: Plated structural elements. CEN.
2006.
244 VERiFiCATiON MANUAL - Design Code Benchmarks | SOFiSTiK 2018

DCE-EN31: Punching of flat slab acc. DIN EN 1992-1-1
32 DCE-EN31: Punching of flat slab acc. DIN EN 1992-1-1
Overview
Design Code Family(s): DIN EN
Design Code(s): DIN EN 1992-1-1
Module(s): BEMESS
Input file(s): punching din en 1992.dat
32.1 Problem Description
The problem consist of a flat slab of a multi-story building as shown in Fig. 32.1. The design of slabagainst punching at the columns is discussed in the following.
For the concrete, strength class C35/45 (ƒck = 35 MP, γc = 1.5) is assumed, for the reinforcing steel,grade B500B (ƒyk = 500 MP, Es = 205 GP, γs = 1.15, ductility class B). The factored design loadaccounting for self-weight, dead load and imposed load is ed = 14.67 kN/m2.
CB
A
2
3
1
Column450/450 mm
Slabh=240 mm
eƒ ƒ , = 6.75 m
eƒƒ,y=6.75m
Figure 32.1: Model
SOFiSTiK 2018 | VERiFiCATiON MANUAL - Design Code Benchmarks 245

DCE-EN31: Punching of flat slab acc. DIN EN 1992-1-1
32.2 Reference Solution
This example is concerned with the punching of flat slabs. The content of this problem is covered by thefollowing parts of DIN EN 1992-1-1:2004 + AC:2010 [1]:
• Construction materials (Section 3)
• Punching (Section 6.4)
11
19
ototVEd
As, = ks, · As,crt
Figure 32.2: Punching
32.3 Model and Results
The goal of the preliminary design is to check if the dimensions of the structure are reasonable withrespect to the punching shear strength and if punching shear reinforcement is required.
In the reference example the reaction forces are estimated by using contributive areas, therefore theexample has been splitted into three models to show the punching for
• the inner column B2,
• the edge column A2/B1,
• wall at position B2.
The SOFiSTiK and reference results are given in Table 32.3.
Table 32.1: Results
Result SOF. Ref.
Inner column B2 (Node 1)
VEd [kN] 808.0 809.0
VEd,red [kN] 803.0 −
Ed [N/mm2] 1.11 1.12
246 VERiFiCATiON MANUAL - Design Code Benchmarks | SOFiSTiK 2018

DCE-EN31: Punching of flat slab acc. DIN EN 1992-1-1
Table 32.1: (continued)
Result SOF. Ref.
Rd,c [N/mm2] 0.93 0.93
Rd,m [N/mm2] 1.30 1.30
ot [m] 6.01 6.05
1 [m] 4.188 4.19
β 1.10 1.10
d [m] 0.19 0.19
Edge column B1/A2 (Node 2)
VEd [kN] 317.7 319
VEd,red [kN] 312.7 −
Ed [N/mm2] 0.91 0.925
Rd,c [N/mm2] 0.86 0.86
Rd,m [N/mm2] 1.21 1.204
ot [m] 3.21 3.28
1 [m] 2.539 2.54
β 1.40 1.40
d [m] 0.19 0.19
Wall B2 (Node 1014)
VEd [kN] 347.1 381.0
VEd,red [kN] − −
Ed [N/mm2] 1.10 1.208
Rd,c [N/mm2] 0.88 0.878
Rd,m [N/mm2] 1.23 1.229
ot [m] 3.37 3.28
1 [m] 2.244 2.24
β 1.35 1.35
d [m] 0.19 0.19
SOFiSTiK 2018 | VERiFiCATiON MANUAL - Design Code Benchmarks 247
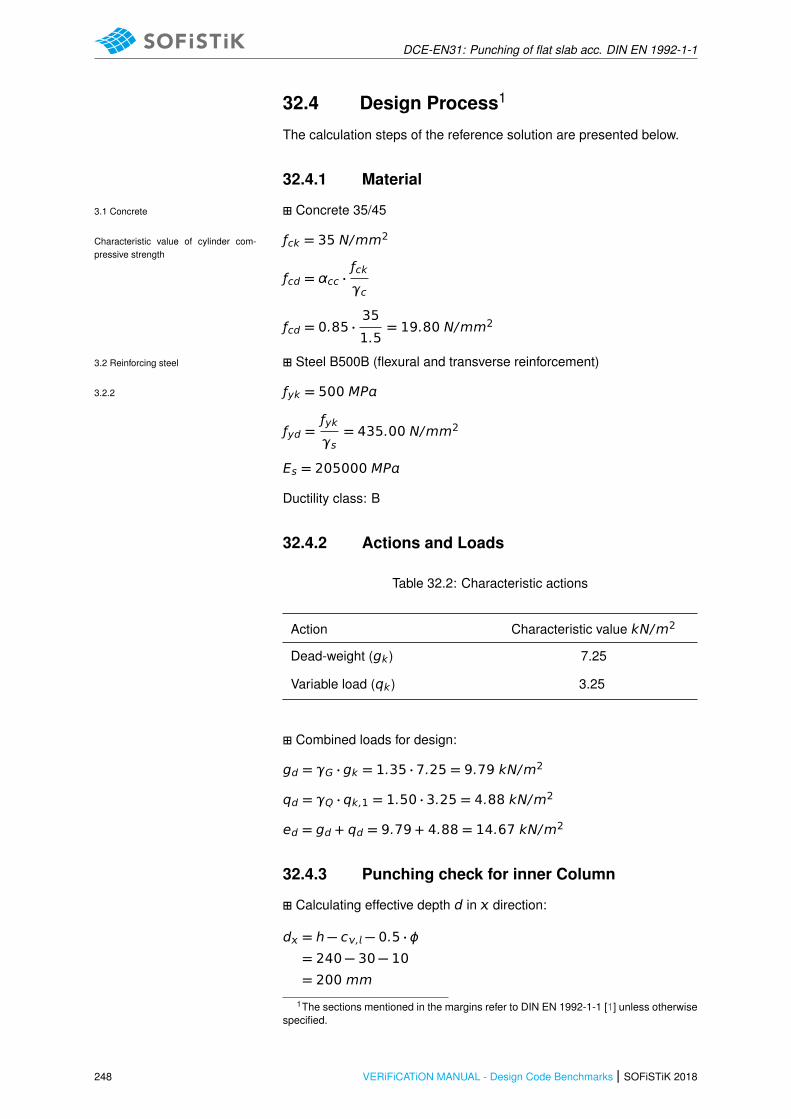
DCE-EN31: Punching of flat slab acc. DIN EN 1992-1-1
32.4 Design Process1
The calculation steps of the reference solution are presented below.
32.4.1 Material
� Concrete 35/453.1 Concrete
ƒck = 35 N/mm2Characteristic value of cylinder com-pressive strength
ƒcd = αcc ·ƒck
γc
ƒcd = 0.85 ·35
1.5= 19.80 N/mm2
� Steel B500B (flexural and transverse reinforcement)3.2 Reinforcing steel
ƒyk = 500 MP3.2.2
ƒyd =ƒyk
γs= 435.00 N/mm2
Es = 205000 MP
Ductility class: B
32.4.2 Actions and Loads
Table 32.2: Characteristic actions
Action Characteristic value kN/m2
Dead-weight (gk) 7.25
Variable load (qk) 3.25
� Combined loads for design:
gd = γG · gk = 1.35 · 7.25 = 9.79 kN/m2
qd = γQ · qk,1 = 1.50 · 3.25 = 4.88 kN/m2
ed = gd + qd = 9.79 + 4.88 = 14.67 kN/m2
32.4.3 Punching check for inner Column
� Calculating effective depth d in direction:
d = h − c, − 0.5 · ϕ= 240 − 30 − 10= 200 mm
1The sections mentioned in the margins refer to DIN EN 1992-1-1 [1] unless otherwisespecified.
248 VERiFiCATiON MANUAL - Design Code Benchmarks | SOFiSTiK 2018
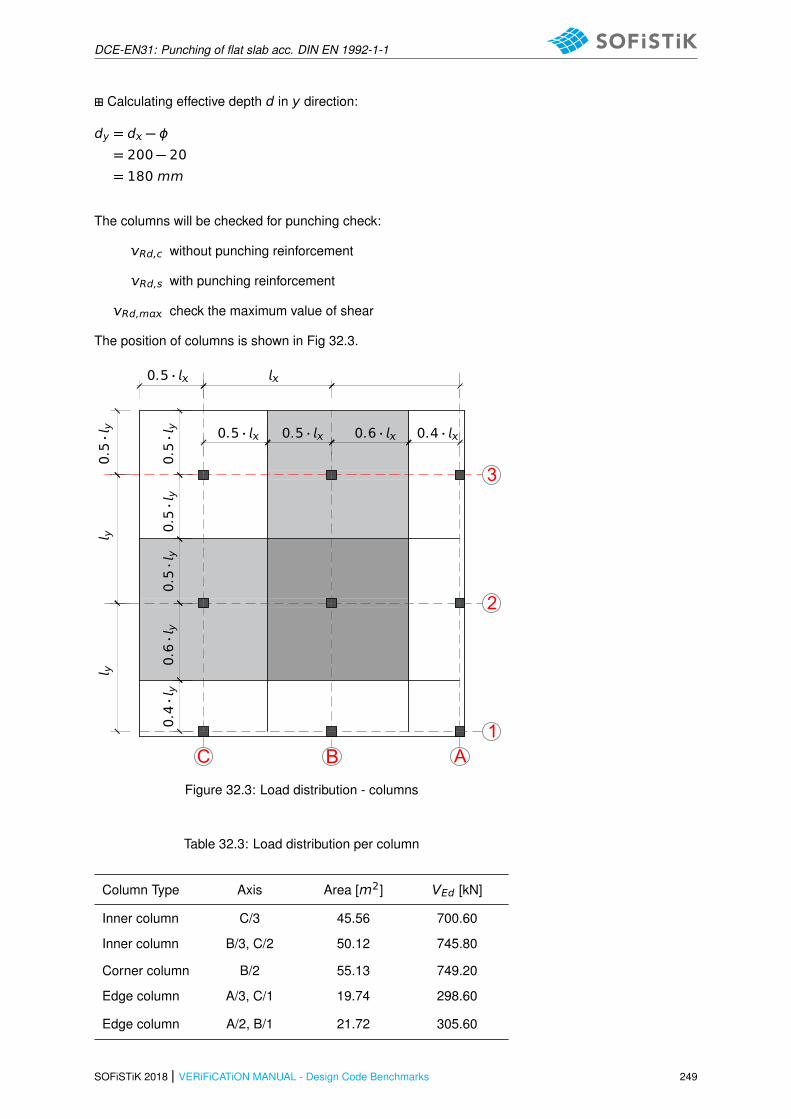
DCE-EN31: Punching of flat slab acc. DIN EN 1992-1-1
� Calculating effective depth d in y direction:
dy = d − ϕ= 200 − 20= 180 mm
The columns will be checked for punching check:
Rd,c without punching reinforcement
Rd,s with punching reinforcement
Rd,m check the maximum value of shear
The position of columns is shown in Fig 32.3.
C BA
2
3
1
0.5 ·
0.5 · 0.5 · 0.6 · 0.4 ·
y y
0.5·y
0.5·y
0.5·y
0.5·y
0.6·y
0.4·y
Figure 32.3: Load distribution - columns
Table 32.3: Load distribution per column
Column Type Axis Area [m2] VEd [kN]
Inner column C/3 45.56 700.60
Inner column B/3, C/2 50.12 745.80
Corner column B/2 55.13 749.20
Edge column A/3, C/1 19.74 298.60
Edge column A/2, B/1 21.72 305.60
SOFiSTiK 2018 | VERiFiCATiON MANUAL - Design Code Benchmarks 249
DCE-EN31: Punching of flat slab acc. DIN EN 1992-1-1
Table 32.3: (continued)
Column Type Axis Area [m2] VEd [kN]
Corner column A/1 8.56 139.90
� Effective depth d
d =d + dy2
d =0.2 + 0.18
2
d = 0.19 m
19 24
45
2d
Figure 32.4: Punching - inner column
� Perimeter 0 and 1
0 = 4 · 0.45 = 1.80 m
1 = 2 · (2 · 0.45 + π · 2.0 · 0.19)
1 = 4.19 m
� Max. shear force (column B/2):
Ed =β · VEd · d
6.4.3, Eq. 6.38
VEd = 809 kN
BEMESS is reducing the VEd value by dead load of the slab.
250 VERiFiCATiON MANUAL - Design Code Benchmarks | SOFiSTiK 2018

DCE-EN31: Punching of flat slab acc. DIN EN 1992-1-1
VEd,red = VEd − Vred
Vred = 1.35 · γc · r2co,eƒ ƒ · π · hsb
Where:
rco,eƒ ƒ is the effective radius of the column
γc is the nominal weight of the concrete in kN/m3
r2co,eƒ ƒ
· π is the effective area
hsb height of the slab
Aco = · b or Aco = 2 (if a=b)
rco,eƒ ƒ =
√
√Aco
π
β = 1.10 NDP, 6.4.3(6), β = 1.1 for innercolumns
In BEMESS the β value is limited to βm = 1.8.Min. value is taken as βmn = 1.1
1.1 ≤ β ≤ 1.8
β = 1 + k ·MEd
VEd ·1
W1
The W value is calculated acc. W =∫ 0 |e|d
6.4.3, Eq. 6.39 and Eq. 6.40
Ed =0.809 · 1.10
4.19 · 0.19= 1.118 MN/m2
Shear resistance without punching reinforcement
for0
d=1.80
0.19= 9.5 > 4
Rd,c =0.18
γc· k · (100 · ρ · ƒck)1/3 + 0.1 · σcp ≥ mn + 0.10 · σcp NDP, 6.4.4(1), Eq. 6.47, slabs without
punching reinforcement
with:
k = 1 + (200/d)1/2 ≤ 2.0
k = 1 + (200/190)1/2 = 2.0 k > 2.0, because d = 190 mm <
200 mm
mn = (0.0525/γc) · k3/2 · ƒ1/2ck NCI, 6.2.2, Eq. 6.3DE for d ≤ 600
mn = (0.05252/1.5) · 2.03/2 · 351/2 = 0.586 MN/m2
Reinforcement ratio for longitudinal reinforcement
over column B/2 - width of the strip
b = 0.4 · 6.75 m = 2.70 m> bp = 0.45 + 2 · 3.0 · 0.19 = 1.59 m
� Reinforcement ratio
SOFiSTiK 2018 | VERiFiCATiON MANUAL - Design Code Benchmarks 251

DCE-EN31: Punching of flat slab acc. DIN EN 1992-1-1
ρ, =31.42
100 · 20= 0.0157
ρ,y =31.42
100 · 18= 0.0175
ρ = (ρ, · ρ,y)1/2
= (0.0157 · 0.0175)1/2
= 0.0166
≤ 0.02
≤ 0.50 ·ƒcd
ƒyd= 0.5 ·
19.8
435= 0.023
Rd,c =0.18
1.5· 2.0 · (100 · 0.0166 · 35)1/3
Rd,c = 0.928 MN/m2 > mn
< Ed = 1.118 MN/m2
⇒ Punching reinforcement is required!
Slab with punching reinforcement
Rd,m = 1.4 · Rd,c= 1.4 · 0.928 = 1.299 MN/m2
> Ed = 1.118 MN/m2
⇒ Ed the punching reinforcement can be usedRd,m
(NDP) 6.4.5(3) Eq.(NA.6.53.1)
Punching reinforcement α = 90◦
ot = β ·VEd
Rd,c · d(NCI) for 6.4.5 (4): For ot → Rd,cis used according to 6.2.2 (1), CRd,c =0.15/γc and not 0.18/γc
ot = 1.10 ·0.809
0.928 ·0.15
0.18· 0.19
ot = 6.05 m
Loaded area perimeter Aod
ot =ot − 02 · π
=6.05 − 1.80
2 · π= 0.67 m⇒≈ 3.52 · d
The punching reinforcement is required until (3.52−1.5) ·d = 2.02 ·d
VRd,cs = 0.75 · rd,c + 1.5 · (d/sr) ·As · ƒyed,eƒ · snα
1 · d
252 VERiFiCATiON MANUAL - Design Code Benchmarks | SOFiSTiK 2018
DCE-EN31: Punching of flat slab acc. DIN EN 1992-1-1
with:
ƒyd,eƒ = 250 + 0.25 · d ≤ ƒyd
ƒyd,eƒ = 250 + 0.25 · 190 = 297 MN/m2 < 435 MN/m2
sr = 0.75 · d
As =(Ed − 0.75 · Rd,c) · 1 · d
1.5 ·d
sr· ƒyd,eƒ
As =(1.118 − 0.75 · 0.928) · 4.19 · 0.19
1.5 ·1
0.75· 297
· 104
As = 5.66 cm2
Reinforcement in perimeter 1 - As,1
reqAs,1 = ks · As
reqAs,1 = 2.5 · 5.66 = 14.10 cm2
Reinforcement in perimeter 2 - As,2
reqAs,2 = ks · As
reqAs,2 = 1.4 · 5.66 = 7.92 cm2
Detailing of reinforcement
The spacing of link legs around a perimeter should not exceed 1.5 · dwithin the first control perimeter (2 ·d from loaded area), and should notexceed 2 ·d for perimeters outside the first control perimeter where thatpart of the perimeter is assumed to contribute to the shear capacity.
s1 = 2.40 m⇒ min n =2.40
1.5 · 0.19= 9
s2 = 3.29 m⇒ min n =3.29
1.5 · 0.19= 12
Min. punching reinforcement:
As,mn =0.08
1.5·
p
ƒck
ƒyk· sr · st (NCI), 9.4.3: Eq. (9.11DE)
As,mn = 0.05333 ·
p35
500· 0.75 · 1.5 · 1.92
As,mn = 0.26 cm2
32.4.4 Punching check for edge column
The punching check for columns (A2/B1) is verified:
Slab: C35/45, d = 0.19 m
SOFiSTiK 2018 | VERiFiCATiON MANUAL - Design Code Benchmarks 253

DCE-EN31: Punching of flat slab acc. DIN EN 1992-1-1
19 24
45
2d
2d
Edge
Figure 32.5: Punching - edge column B1/A2
� Critical perimeter
1 = 3 · 0.45 + π · 2.0 · 0.19
1 = 2.54 m
For edge and corner columns the effective perimeter is reduced basedby using the Sector Method (See Fig. 32.6). The Sector Method de-livers the effective perimeter of the punching round cut. The ratio/0 is output in % in the result list.
6 · d
s 2d
Control perimeter
OPENING
BOUNDARY OF SLAB
Figure 32.6: Calculating the control perimeter near opening by using”Sector Method”
� Maximal shear force:
254 VERiFiCATiON MANUAL - Design Code Benchmarks | SOFiSTiK 2018
DCE-EN31: Punching of flat slab acc. DIN EN 1992-1-1
VEd = 319 kN
Ed =β · VEd · d
Ed , 6.4.3, Eq. 6.38
β = 1.4 NDP, 6.4.3(6),β = 1.4 for edge columns
Ed =1.40 · 0.319
2.54 · 0.19
Ed = 0.925 MN/m2
Shear resistance without punching reinforcement
Rd,c =0.18
γc· k · (100 · ρ · ƒck)1/3 ≥ mn NDP, 6.4.4(1), Eq. 6.47, slabs without
punching reinforcement
with
k = 2.0
mn = 0.586 MN/m2mn, NCI, 6.2.2,Eq. 6.3DE for d ≤ 600
� Reinforcement ration ρ:
(Parallel over the edge of column B/1)
ρ =20.11
100 · 20= 0.01
ρy =31.42
100 · 18= 0.0175
ρ = (0.01 · 0.0175)1/2 = 0.0132≤ 0.02
≤ 0.50 ·ƒcd
ƒyd= 0.023
Rd,c =0.18
1.5· 2.0 · (100 · 0.0132 · 35)1/3
Rd,c = 0.860 MN/m2 > mn
< 0.925 MN/m2
⇒ punching reinforcement is required!
Slab with punching reinforcement
� Maximum shear force
Rd,m = 1.4 · Rd,c = 1.4 · 0.860
= 1.204 MN/m2 > VEd = 0.925 MN/m2
Rd,m
(NDP) 6.4.5(3) Eq.(NA.6.53.1)⇒ the punching reinforcement can bear the shear force Ed!
Punching reinforcement α = 90◦
SOFiSTiK 2018 | VERiFiCATiON MANUAL - Design Code Benchmarks 255
DCE-EN31: Punching of flat slab acc. DIN EN 1992-1-1
ot = β ·VEd
Rd,c · d(NCI) for 6.4.5 (4): For ot → Rd,cis used according to 6.2.2 (1), CRd,c =0.15/γc and not 0.18/γc
ot = 1.4 ·0.319
0.860 ·0.15
0.18· 0.19
ot = 3.28 m
� Loaded area perimeter Aod
ot =ot − o
π
=3.28 − 3 · 0.45
π= 0.61 m→≈ 3.21 · d
Punching reinforcement is required until (3.21 − 1.5) · d = 1.71 · d
Rd,s = 0.75 + Rd,c + 1.5 ·d
sr·As · ƒyd,eƒ · snα
1 · d
with
ƒyd,eƒ = 297 MN/m2
sr = 0.5 · d
As = (Ed − 0.75 · R,dc) ·1 · d
1.5 ·d
sr· ƒyd,eƒ
As = (0.925 − 0.75 · 0.860) ·2.54 · 0.19 · 104
1.5 ·1
0.5· 297
As = 1.51 cm2
Reinforcement in perimeter 1 - As,1
reqAs,1 = ks · As
reqAs,1 = 2.5 · 1.51 = 3.79 cm2
Reinforcement in perimeter 2 - As,2
reqAs,2 = ks · As
reqAs,2 = 1.4 · 1.51 = 2.12 cm2
As,mn = 0.26 cm2(NCI), 9.4.3: Eq. (9.11DE)
32.4.5 Punching check for wall
The punching check is verified at position B2.
256 VERiFiCATiON MANUAL - Design Code Benchmarks | SOFiSTiK 2018

DCE-EN31: Punching of flat slab acc. DIN EN 1992-1-1
CB
A
2
3
1
0.5 ·
0.5 · 0.5 · 0.6 · 0.4 ·
y y
0.5·y
0.5·y
0.5·y
0.5·y
0.6·y
0.4·y
Figure 32.7: Load distribution - wall
d = 190 mm
b1 = b = 350 mm< 3 · d
1
2= b = 350 mm
< 3 · d − 0.5 · b1 = 3 · 190 − 175 = 395 mm
2
B
350
350
225
ed = 14.67 kN/m2
Load distribution:
SOFiSTiK 2018 | VERiFiCATiON MANUAL - Design Code Benchmarks 257

DCE-EN31: Punching of flat slab acc. DIN EN 1992-1-1
ALE = (0.5 + 0.6) · 6.75 m · (0.5 · 6.75 m + 0.125 m) = 26.0 m2
VEd = ALE · ed
VEd = 26.0 · 14.67 = 381 kN
For walls there are two methods to analyse the punching force at wallends and corners. Default is the integration of the slab shear forcealong the critical perimeter. As the result varies depending on thedistance to the wall, BEMESS analyses four distances and takes themaximum punching force.
Critical perimeter:
1 = 3 · 0.35 + ϕ · 2.0 · 0.19 = 2.24 m
Max. shear force:
Ed =β · VEd · d
β = 1.35β = 1.35 for wall ending,(NDP) 6.4.3 (6)
Ed =1.35 · 0.381
2.24 · 0.19= 1.208 MN/m2
Shear resistance without punching reinforcement
Rd,c =0.18
γc· k · (100 · ρ · ƒck)1/3 ≥ mnNDP, 6.4.4(1), Eq. 6.47,
slabs without punching reinforcement
with:
k = 2.0
mn = 0.586 MN/m2mn; (NCI) 6.2.2;Eq. 6.3DE for d ≤ 600 mm
� Reinforcement ration ρ:
(Parallel over the edge of wall B/2)
For this example we will take ρ = 1.4 %
ρ = 0.014
≤ 0.02
≤ 0.50 ·ƒcd
ƒyd= 0.023
Rd,c =0.18
1.5· 2.0 · (100 · 0.0140 · 35)1/3
Rd,c = 0.878 MN/m2 > mn
< 1.208 MN/m2
⇒ punching reinforcement is required!
Slab with punching reinforcement
258 VERiFiCATiON MANUAL - Design Code Benchmarks | SOFiSTiK 2018
DCE-EN31: Punching of flat slab acc. DIN EN 1992-1-1
� Maximum shear force
VRd,m = 1.4 · Rd,c = 1.4 · 0.878
= 1.229 MN/m2 < VEd = 1.208 MN/m2
Rd,m
(NDP) 6.4.5(3) Eq.(NA.6.53.1)⇒ VEd < VRd,m !
Punching reinforcement α = 90◦
ot = β ·VEd
Rd,c · d(NCI) for 6.4.5 (4): Rd,c is used accord-
ing 6.2.2 (1), CRd,c =0.15
γc
ot = 1.35 ·0.381
0.878 ·0.15
0.18· 0.19
ot = 3.69 m
� Loaded area perimeter Aod
ot =ot − o
π
=3.69 − 3 · 0.35
π= 0.84 m→≈ 4.42 · d
Punching reinforcement is required until (4.42 − 1.5) · d = 2.92 · d
Rd,s = 0.75 + Rd,c + 1.5 ·d
sr·As · ƒyd,eƒ · snα
1 · d
with
ƒyd,eƒ = 297 MN/m2
sr = 0.5 · d
As = (Ed − 0.75 · R,dc) ·1 · d
1.5 ·d
sr· ƒyd,eƒ
As = (1.208 − 0.75 · 0.878) ·2.24 · 0.19 · 104
1.5 ·1
0.5· 297
As = 2.62 cm2
Reinforcement in perimeter 1 - As,1
reqAs,1 = ks · As
reqAs,1 = 2.5 · 2.62 = 6.55 cm2
Reinforcement in perimeter 2 - As,2
reqAs,2 = ks · As
reqAs,2 = 1.4 · 2.62 = 3.66 cm2
SOFiSTiK 2018 | VERiFiCATiON MANUAL - Design Code Benchmarks 259

DCE-EN31: Punching of flat slab acc. DIN EN 1992-1-1
As,mn = 0.26 cm2(NCI), 9.4.3: Eq. (9.11DE)
260 VERiFiCATiON MANUAL - Design Code Benchmarks | SOFiSTiK 2018

DCE-EN31: Punching of flat slab acc. DIN EN 1992-1-1
32.5 Conclusion
The program searches for the single support nodes (single columns, wall ends as well as wall corners),and performs a punching check for these points. Nodes with less than 5 kN support reaction are notconsidered! Because the focus of the verification example is punching, the value ρ is overtaken fromthe verification example.
It has been shown that the results are reproduced with excellent accuracy.
32.6 Literature
[1] DIN EN 1992-1-1/NA: Eurocode 2: Design of concrete structures, Part 1-1/NA: General rules andrules for buildings - German version EN 1992-1-1:2005 (D), Nationaler Anhang Deutschland -Stand Februar 2010. CEN. 2010.
[4] Beispiele zur Bemessung nach Eurocode 2 - Band 1: Hochbau. Ernst & Sohn. Deutschen Beton-und Bautechnik-Verein E.V. 2011.
SOFiSTiK 2018 | VERiFiCATiON MANUAL - Design Code Benchmarks 261

DCE-EN31: Punching of flat slab acc. DIN EN 1992-1-1
262 VERiFiCATiON MANUAL - Design Code Benchmarks | SOFiSTiK 2018

DCE-EN32: Crack width calculation of reinforced slab acc. DIN EN 1992-1-1
33 DCE-EN32: Crack width calculation of reinforced slabacc. DIN EN 1992-1-1
Overview
Design Code Family(s): DIN EN
Design Code(s): DIN EN 1992-1-1
Module(s): BEMESS
Input file(s): crack width slab din-en-1992-1-1.dat
33.1 Problem Description
The problem consists of a flat slab, reinforced, as shown in Fig. 33.1. Loading always consisting of abending moment MEd, the normal force is N = 0. The crack width is determined.
bh d z
My
NA′s
As
Figure 33.1: Geometry of slab, b = 1 m’
33.2 Reference Solution
This example is concerned with the control of crack widths. The content of this problem is covered bythe following parts of DIN EN 1992-1-1:2004 [1]:
• Design stress-strain curves for concrete and reinforcement (Section 3.1.7, 3.2.7)
• Basic assumptions for calculation of crack widths (Section 7.3.2,7.3.3,7.3.4)
SOFiSTiK 2018 | VERiFiCATiON MANUAL - Design Code Benchmarks 263
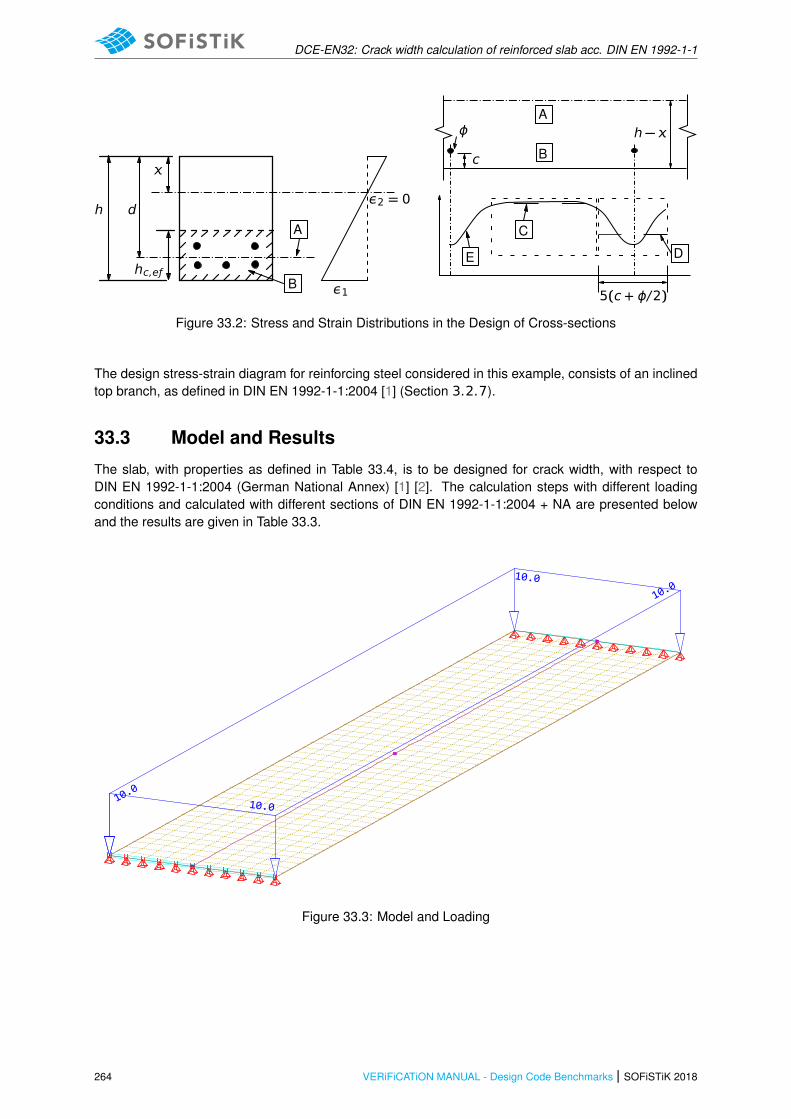
DCE-EN32: Crack width calculation of reinforced slab acc. DIN EN 1992-1-1
A
B
5(c + ϕ/2)
h −
DE
C
ϕ
c
hc,eƒ
dh
A
ε1
ε2 = 0
B
Figure 33.2: Stress and Strain Distributions in the Design of Cross-sections
The design stress-strain diagram for reinforcing steel considered in this example, consists of an inclinedtop branch, as defined in DIN EN 1992-1-1:2004 [1] (Section 3.2.7).
33.3 Model and Results
The slab, with properties as defined in Table 33.4, is to be designed for crack width, with respect toDIN EN 1992-1-1:2004 (German National Annex) [1] [2]. The calculation steps with different loadingconditions and calculated with different sections of DIN EN 1992-1-1:2004 + NA are presented belowand the results are given in Table 33.3.
10.0
10.0
10.0
10.0
Figure 33.3: Model and Loading
264 VERiFiCATiON MANUAL - Design Code Benchmarks | SOFiSTiK 2018

DCE-EN32: Crack width calculation of reinforced slab acc. DIN EN 1992-1-1
42.19
40.50
40.50
35.44
35.44
27.00 15.19
Figure 33.4: Model and internal forces - design element - γG = 1.35
Table 33.1: Model Properties
Material Properties Geometric Properties Loading
C 25/30 h = 24.0 cm MEd = 42.11 kNm
B 500A d = 21 cm
b = 1000.0 cm
ϕs = 10.0 mm, s = 5.50 cm2/m′
ϕs′ = 10.0 mm
k,req = 0.3 mm
Table 33.2: Results - Crack width calculation without direct method (quad element 10226)
Case SOF. REF.
σs,tb [MP] 303.87 303.87
ϕs [mm] 10 10
ϕ∗s[mm] 11.337 11.337
σs [MP] 303.87 303.87
s [cm2/m] 7.04 7.34
SOFiSTiK 2018 | VERiFiCATiON MANUAL - Design Code Benchmarks 265
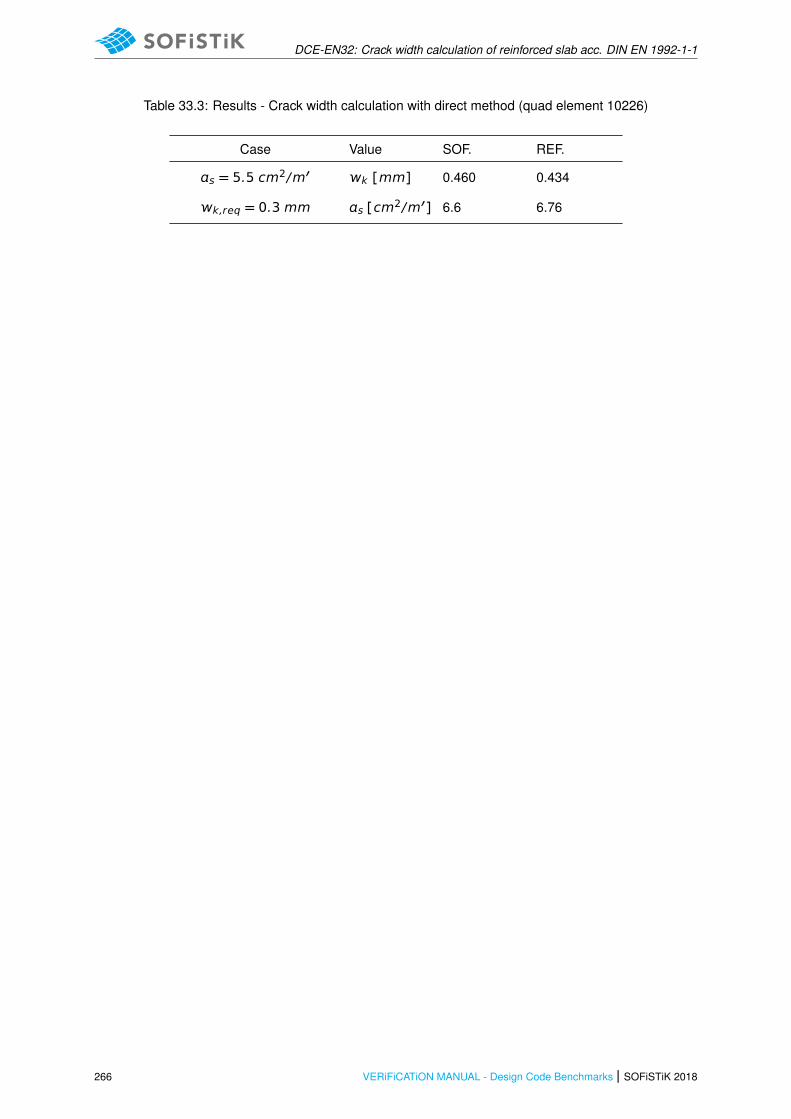
DCE-EN32: Crack width calculation of reinforced slab acc. DIN EN 1992-1-1
Table 33.3: Results - Crack width calculation with direct method (quad element 10226)
Case Value SOF. REF.
s = 5.5 cm2/m′ k [mm] 0.460 0.434
k,req = 0.3 mm s [cm2/m′] 6.6 6.76
266 VERiFiCATiON MANUAL - Design Code Benchmarks | SOFiSTiK 2018

DCE-EN32: Crack width calculation of reinforced slab acc. DIN EN 1992-1-1
33.4 Design Process 1
Design with respect to DIN EN 1992-1-1:2004 (NA) [1] [2]:2
33.4.1 Material
Concrete: γc = 1.50 (NDP) 2.4.2.4: (1), Tab. 2.1DE: Partialfactors for materials
Steel: γs = 1.15
ƒck = 25 MP Tab. 3.1: Strength for concrete
ƒcd = cc · ƒck/γc = 0.85 · 25/1.5 = 14.17 MP 3.1.6: (1)P, Eq. (3.15): cc = 0.85 con-sidering long term effects
ƒyk = 500 MP 3.2.2: (3)P: yield strength ƒyk =500 MP
ƒyd = ƒyk/γs = 500/1.15 = 434.78 MP 3.2.7: (2), Fig. 3.8
Design Load:
MEd = 42.11 kNm
NEd = 0.0
33.4.2 Without direct calculation7.3.3: Control of cracking without directcalculationExamples calculated in this section arew.r.t. Table 7.2DE, here Table 7.3N isnot relevant
ƒct,eƒ ƒ = ƒctm
(NDP) 7.3.2 (2): ƒct,eƒ ƒ mean value ofconcrete tensile strength
ƒct,eƒ ƒ = 2.56 MP
Tab. 3.1: ƒctm = 2.6 MP for C 25
(NDP) 7.3.3: Eq. 7.7.1DE: The maxi-mum bar diameters should be modifiedfor load action
σs =mEd
s · z
σs =42.11 · 10−3
5.5 · 10−4 · 0.9 · 0.21= 405.09 MP
ϕs = ϕ∗s ·σs · As
4(h − d) · b · 2.9≥ ϕ∗
s·ƒct,eƒ ƒ
2.9As = 5.5 cm2 prescribed reinforce-ment
ϕs = 10 mm = ϕ∗s·
405.09 · 5.5
4(24 − 21) · 100 · 2.9= ϕ∗
s· 0.475
ϕs = 10 = ϕ∗s · 0.640 ≥ ϕ∗s· 0.882
→ ϕ∗s=
ϕs
0.882=
10
0.882= 11.337 mm
σs,tb =Ç
k · 3.48 · 106 / ϕ∗s (NDP) 7.3.3 Tab. 7.2DE (a)where k = 0.3 mm the prescribedmaximum crack width
σs,tb =p
0.3 · 3.48 · 106/11.337 = 303.448 MP
σs,tb = 303.448 < σs = 405.09 MP
→ crack width control is NOT passed with given reinforcement.1The tools used in the design process are based on steel stress-strain diagrams, as
defined in [1] 3.2.7:(2), Fig. 3.8.2The sections mentioned in the margins refer to DIN EN 1992-1-1:2004 (German Na-
tional Annex) [1], [2], unless otherwise specified.
SOFiSTiK 2018 | VERiFiCATiON MANUAL - Design Code Benchmarks 267
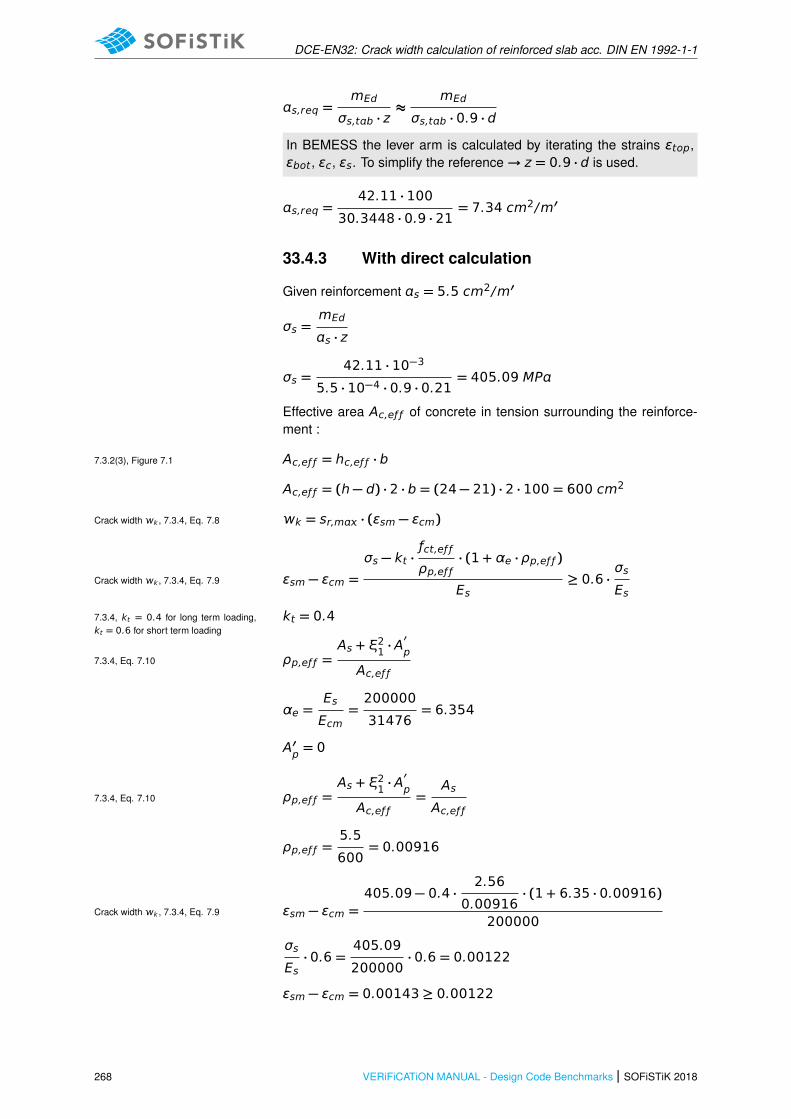
DCE-EN32: Crack width calculation of reinforced slab acc. DIN EN 1992-1-1
s,req =mEd
σs,tb · z≈
mEd
σs,tb · 0.9 · d
In BEMESS the lever arm is calculated by iterating the strains ϵtop,ϵbot, ϵc, ϵs. To simplify the reference→ z = 0.9 · d is used.
s,req =42.11 · 100
30.3448 · 0.9 · 21= 7.34 cm2/m′
33.4.3 With direct calculation
Given reinforcement s = 5.5 cm2/m′
σs =mEd
s · z
σs =42.11 · 10−3
5.5 · 10−4 · 0.9 · 0.21= 405.09 MP
Effective area Ac,eƒ ƒ of concrete in tension surrounding the reinforce-ment :
Ac,eƒ ƒ = hc,eƒ ƒ · b7.3.2(3), Figure 7.1
Ac,eƒ ƒ = (h − d) · 2 · b = (24 − 21) · 2 · 100 = 600 cm2
k = sr,m · (ϵsm − ϵcm)Crack width k , 7.3.4, Eq. 7.8
ϵsm − ϵcm =σs − kt ·
ƒct,eƒ ƒ
ρp,eƒ ƒ· (1 + αe · ρp,eƒ ƒ )
Es≥ 0.6 ·
σs
EsCrack width k , 7.3.4, Eq. 7.9
kt = 0.47.3.4, kt = 0.4 for long term loading,kt = 0.6 for short term loading
ρp,eƒ ƒ =As + ξ21 · A
′
p
Ac,eƒ ƒ7.3.4, Eq. 7.10
αe =Es
Ecm=200000
31476= 6.354
A′p= 0
ρp,eƒ ƒ =As + ξ21 · A
′
p
Ac,eƒ ƒ=
As
Ac,eƒ ƒ7.3.4, Eq. 7.10
ρp,eƒ ƒ =5.5
600= 0.00916
ϵsm − ϵcm =405.09 − 0.4 ·
2.56
0.00916· (1 + 6.35 · 0.00916)
200000Crack width k , 7.3.4, Eq. 7.9
σs
Es· 0.6 =
405.09
200000· 0.6 = 0.00122
ϵsm − ϵcm = 0.00143 ≥ 0.00122
268 VERiFiCATiON MANUAL - Design Code Benchmarks | SOFiSTiK 2018
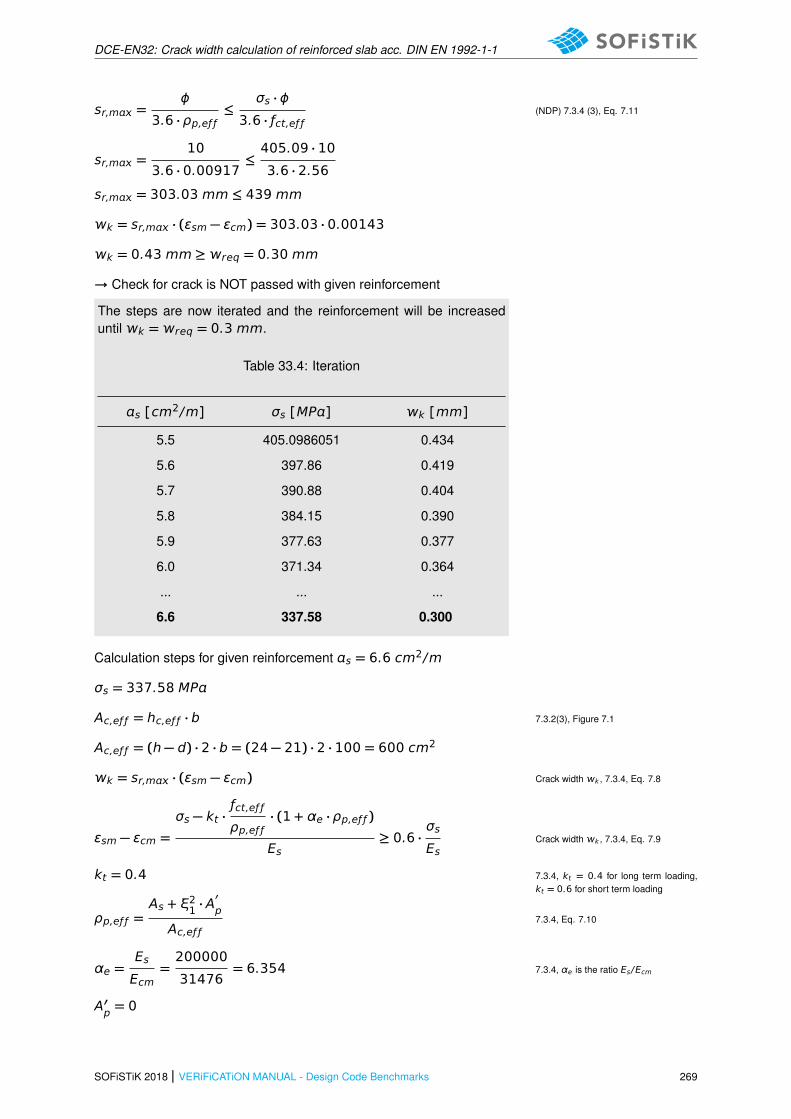
DCE-EN32: Crack width calculation of reinforced slab acc. DIN EN 1992-1-1
sr,m =ϕ
3.6 · ρp,eƒ ƒ≤
σs · ϕ
3.6 · ƒct,eƒ ƒ(NDP) 7.3.4 (3), Eq. 7.11
sr,m =10
3.6 · 0.00917≤405.09 · 10
3.6 · 2.56
sr,m = 303.03 mm ≤ 439 mm
k = sr,m · (ϵsm − ϵcm) = 303.03 · 0.00143
k = 0.43 mm ≥req = 0.30 mm
→ Check for crack is NOT passed with given reinforcement
The steps are now iterated and the reinforcement will be increaseduntil k =req = 0.3 mm.
Table 33.4: Iteration
s [cm2/m] σs [MP] k [mm]
5.5 405.0986051 0.434
5.6 397.86 0.419
5.7 390.88 0.404
5.8 384.15 0.390
5.9 377.63 0.377
6.0 371.34 0.364
... ... ...
6.6 337.58 0.300
Calculation steps for given reinforcement s = 6.6 cm2/m
σs = 337.58 MP
Ac,eƒ ƒ = hc,eƒ ƒ · b 7.3.2(3), Figure 7.1
Ac,eƒ ƒ = (h − d) · 2 · b = (24 − 21) · 2 · 100 = 600 cm2
k = sr,m · (ϵsm − ϵcm) Crack width k , 7.3.4, Eq. 7.8
ϵsm − ϵcm =σs − kt ·
ƒct,eƒ ƒ
ρp,eƒ ƒ· (1 + αe · ρp,eƒ ƒ )
Es≥ 0.6 ·
σs
EsCrack width k , 7.3.4, Eq. 7.9
kt = 0.4 7.3.4, kt = 0.4 for long term loading,kt = 0.6 for short term loading
ρp,eƒ ƒ =As + ξ21 · A
′
p
Ac,eƒ ƒ7.3.4, Eq. 7.10
αe =Es
Ecm=200000
31476= 6.354 7.3.4, αe is the ratio Es/Ecm
A′p= 0
SOFiSTiK 2018 | VERiFiCATiON MANUAL - Design Code Benchmarks 269

DCE-EN32: Crack width calculation of reinforced slab acc. DIN EN 1992-1-1
ρp,eƒ ƒ =As + ξ21 · A
′
p
Ac,eƒ ƒ=
As
Ac,eƒ ƒ
ρp,eƒ ƒ =6.6
600= 0.0110
ϵsm − ϵcm =337.58 − 0.4 ·
2.56
0.0110· (1 + 6.35 · 0.0110)
2000007.3.4, Eq. 7.9
σs
Es· 0.6 =
337.58
200000· 0.6 = 0.00101
ϵsm − ϵcm = 0.0011899 ≥ 0.00101
sr,m =ϕ
3.6 · ρp,eƒ ƒ≤
σs · ϕ
3.6 · ƒct,eƒ ƒ(NDP) 7.3.4 (3), Eq. 7.11
sr,m =10
3.6 · 0.0110≤337.58 · 10
3.6 · 2.56
sr,m = 252.52 mm ≤ 366.30 mm
k = sr,m · (ϵsm − ϵcm) = 252.52 · 0.0011899
k = 0.30 mm ≤req = 0.30 mm
→ Check for crack is passed with given reinforcement
270 VERiFiCATiON MANUAL - Design Code Benchmarks | SOFiSTiK 2018

DCE-EN32: Crack width calculation of reinforced slab acc. DIN EN 1992-1-1
33.5 Conclusion
This example shows the calculation of crack widths. Various ways of reference calculations are demon-strated, in order to compare the SOFiSTiK results to. It has been shown that the results are reproducedwith excellent accuracy.
33.6 Literature
[1] DIN EN 1992-1-1/NA: Eurocode 2: Design of concrete structures, Part 1-1/NA: General rules andrules for buildings - German version EN 1992-1-1:2005 (D), Nationaler Anhang Deutschland -Stand Februar 2010. CEN. 2010.
[2] F. Fingerloos, J. Hegger, and K. Zilch. DIN EN 1992-1-1 Bemessung und Konstruktion vonStahlbeton- und Spannbetontragwerken - Teil 1-1: Allgemeine Bemessungsregeln und Regelnfur den Hochbau. BVPI, DBV, ISB, VBI. Ernst & Sohn, Beuth, 2012.
SOFiSTiK 2018 | VERiFiCATiON MANUAL - Design Code Benchmarks 271

DCE-EN32: Crack width calculation of reinforced slab acc. DIN EN 1992-1-1
272 VERiFiCATiON MANUAL - Design Code Benchmarks | SOFiSTiK 2018
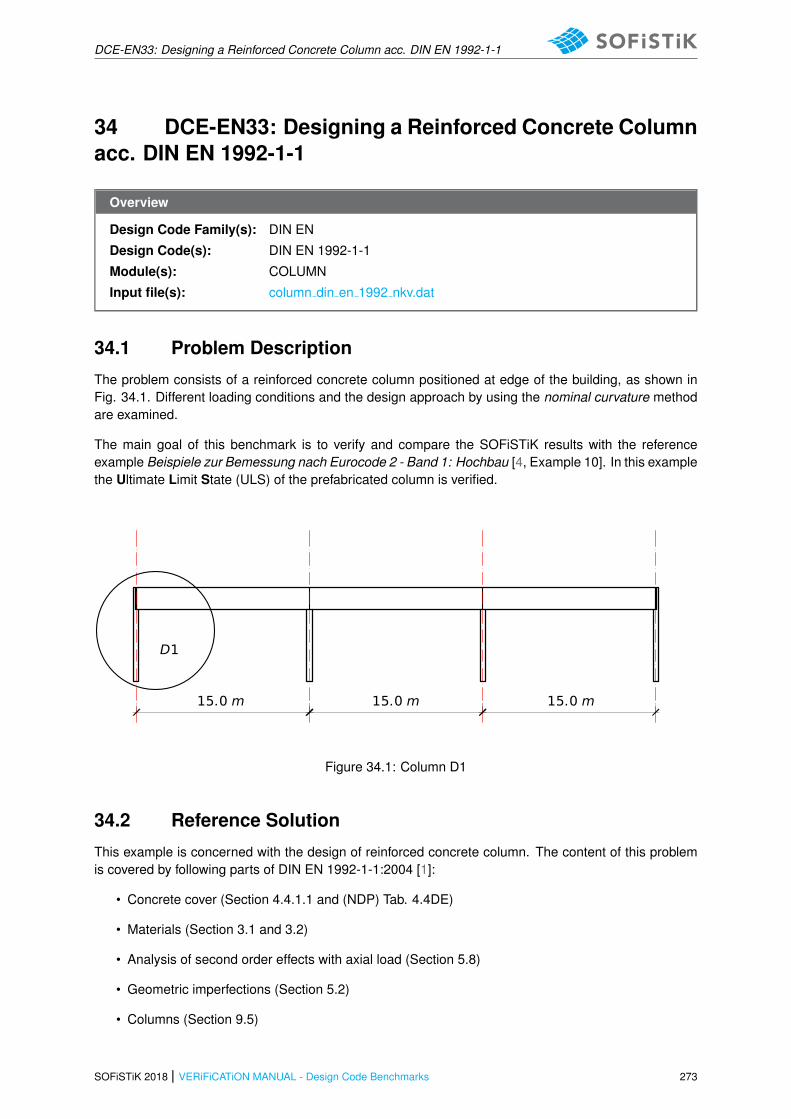
DCE-EN33: Designing a Reinforced Concrete Column acc. DIN EN 1992-1-1
34 DCE-EN33: Designing a Reinforced Concrete Columnacc. DIN EN 1992-1-1
Overview
Design Code Family(s): DIN EN
Design Code(s): DIN EN 1992-1-1
Module(s): COLUMN
Input file(s): column din en 1992 nkv.dat
34.1 Problem Description
The problem consists of a reinforced concrete column positioned at edge of the building, as shown inFig. 34.1. Different loading conditions and the design approach by using the nominal curvature methodare examined.
The main goal of this benchmark is to verify and compare the SOFiSTiK results with the referenceexample Beispiele zur Bemessung nach Eurocode 2 - Band 1: Hochbau [4, Example 10]. In this examplethe Ultimate Limit State (ULS) of the prefabricated column is verified.
15.0 m 15.0 m 15.0 m
D1
Figure 34.1: Column D1
34.2 Reference Solution
This example is concerned with the design of reinforced concrete column. The content of this problemis covered by following parts of DIN EN 1992-1-1:2004 [1]:
• Concrete cover (Section 4.4.1.1 and (NDP) Tab. 4.4DE)
• Materials (Section 3.1 and 3.2)
• Analysis of second order effects with axial load (Section 5.8)
• Geometric imperfections (Section 5.2)
• Columns (Section 9.5)
SOFiSTiK 2018 | VERiFiCATiON MANUAL - Design Code Benchmarks 273

DCE-EN33: Designing a Reinforced Concrete Column acc. DIN EN 1992-1-1
• Shear (Section 6.2.2)
6.2m
1.9m
225 225
170 155 125
450
Detail A
A
β = 2.1
β = 2.1
Figure 34.2: Column properties
The design stress-strain diagram for reinforcing steel considered in this example, consists of an inclinedtop branch, as defined in DIN EN 1992-1-1:2004 [1] (Section 3.2.7).
34.3 Model and Results
The column, with properties as defined in Table 34.1, is to be designed for ultimate limit state, withrespect to DIN EN 1992-1-1:2004 (German National Annex) [1] [2]. The calculation steps with loadingconditions are presented below and the results are given in Table 34.3.
Table 34.1: Model Properties
Material Properties Geometric Properties Loading
C 30/37 b1/h1 = 45/40 cm Gk = 431.0 kN
B 500B b2/h2 = 17/40 cm Qk,s = 68.0 kN
dy = 41 cm qk,1 = +4.32 kN/m
h = 6.20 + 1.9 = 8.1 m qk,2 = −1.85 kN/m
274 VERiFiCATiON MANUAL - Design Code Benchmarks | SOFiSTiK 2018
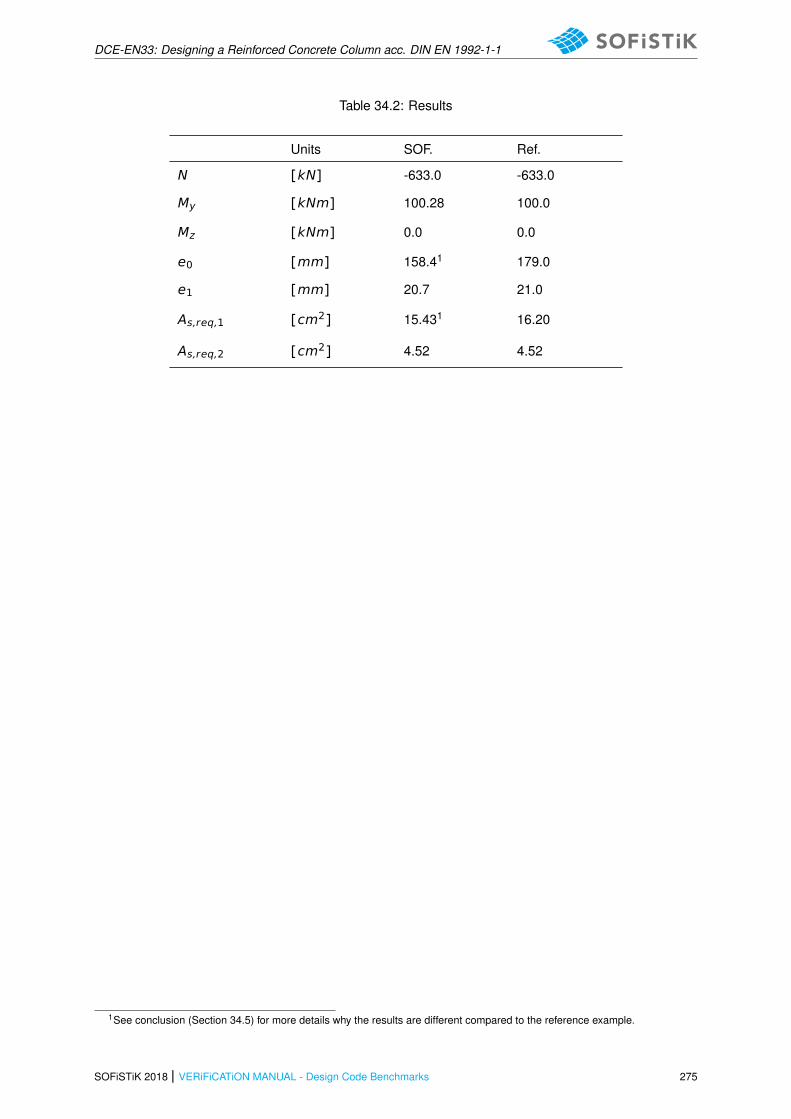
DCE-EN33: Designing a Reinforced Concrete Column acc. DIN EN 1992-1-1
Table 34.2: Results
Units SOF. Ref.
N [kN] -633.0 -633.0
My [kNm] 100.28 100.0
Mz [kNm] 0.0 0.0
e0 [mm] 158.41 179.0
e1 [mm] 20.7 21.0
As,req,1 [cm2] 15.431 16.20
As,req,2 [cm2] 4.52 4.52
1See conclusion (Section 34.5) for more details why the results are different compared to the reference example.
SOFiSTiK 2018 | VERiFiCATiON MANUAL - Design Code Benchmarks 275
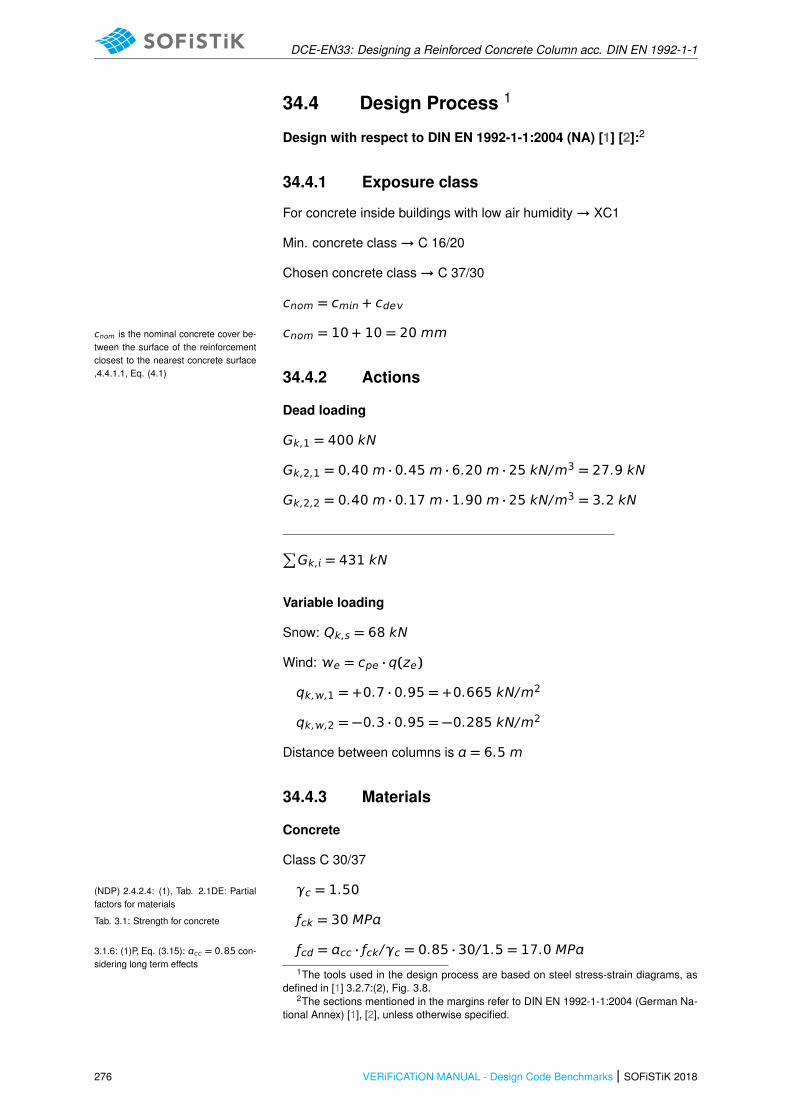
DCE-EN33: Designing a Reinforced Concrete Column acc. DIN EN 1992-1-1
34.4 Design Process 1
Design with respect to DIN EN 1992-1-1:2004 (NA) [1] [2]:2
34.4.1 Exposure class
For concrete inside buildings with low air humidity→ XC1
Min. concrete class→ C 16/20
Chosen concrete class→ C 37/30
cnom = cmn + cde
cnom = 10 + 10 = 20 mmcnom is the nominal concrete cover be-tween the surface of the reinforcementclosest to the nearest concrete surface,4.4.1.1, Eq. (4.1) 34.4.2 Actions
Dead loading
Gk,1 = 400 kN
Gk,2,1 = 0.40 m · 0.45 m · 6.20 m · 25 kN/m3 = 27.9 kN
Gk,2,2 = 0.40 m · 0.17 m · 1.90 m · 25 kN/m3 = 3.2 kN
∑
Gk, = 431 kN
Variable loading
Snow: Qk,s = 68 kN
Wind: e = cpe · q(ze)
qk,,1 = +0.7 · 0.95 = +0.665 kN/m2
qk,,2 = −0.3 · 0.95 = −0.285 kN/m2
Distance between columns is = 6.5 m
34.4.3 Materials
Concrete
Class C 30/37
γc = 1.50(NDP) 2.4.2.4: (1), Tab. 2.1DE: Partialfactors for materials
ƒck = 30 MPTab. 3.1: Strength for concrete
ƒcd = cc · ƒck/γc = 0.85 · 30/1.5 = 17.0 MP3.1.6: (1)P, Eq. (3.15): cc = 0.85 con-sidering long term effects
1The tools used in the design process are based on steel stress-strain diagrams, asdefined in [1] 3.2.7:(2), Fig. 3.8.
2The sections mentioned in the margins refer to DIN EN 1992-1-1:2004 (German Na-tional Annex) [1], [2], unless otherwise specified.
276 VERiFiCATiON MANUAL - Design Code Benchmarks | SOFiSTiK 2018
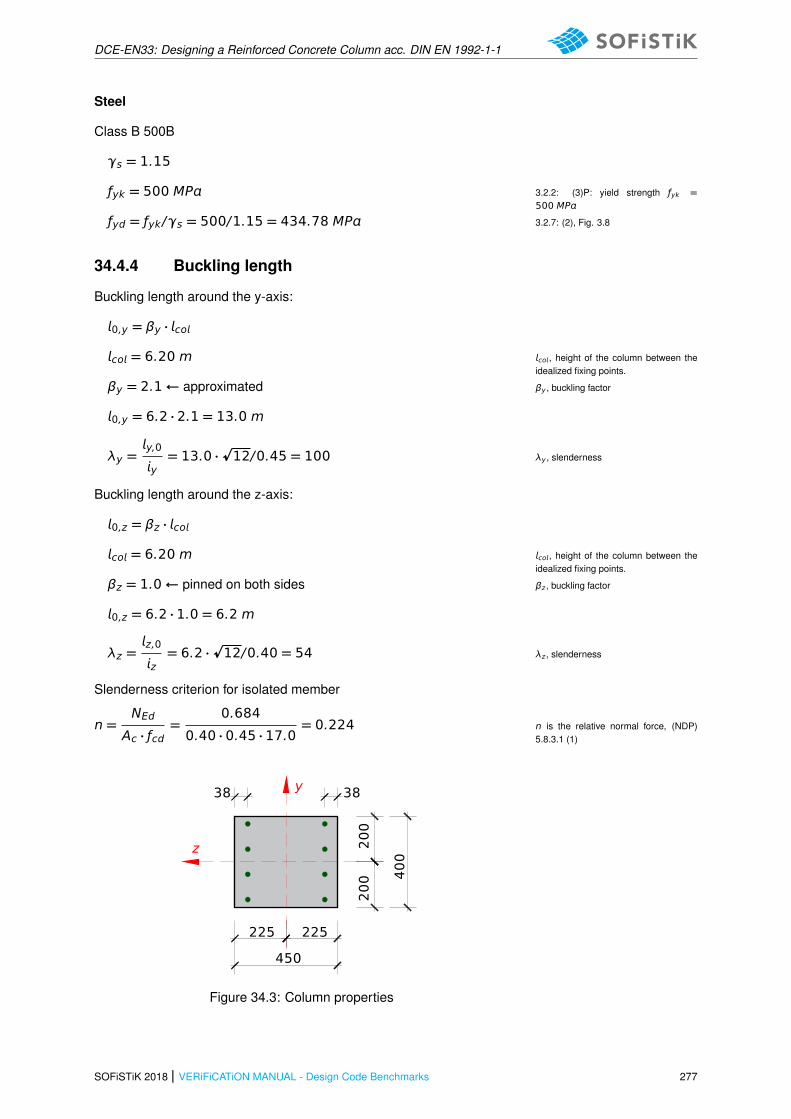
DCE-EN33: Designing a Reinforced Concrete Column acc. DIN EN 1992-1-1
Steel
Class B 500B
γs = 1.15
ƒyk = 500 MP 3.2.2: (3)P: yield strength ƒyk =500 MP
ƒyd = ƒyk/γs = 500/1.15 = 434.78 MP 3.2.7: (2), Fig. 3.8
34.4.4 Buckling length
Buckling length around the y-axis:
0,y = βy · co
co = 6.20 m co, height of the column between theidealized fixing points.
βy = 2.1← approximated βy , buckling factor
0,y = 6.2 · 2.1 = 13.0 m
λy =y,0
y= 13.0 ·
p12/0.45 = 100 λy , slenderness
Buckling length around the z-axis:
0,z = βz · co
co = 6.20 m co, height of the column between theidealized fixing points.
βz = 1.0← pinned on both sides βz , buckling factor
0,z = 6.2 · 1.0 = 6.2 m
λz =z,0
z= 6.2 ·
p12/0.40 = 54 λz , slenderness
Slenderness criterion for isolated member
n =NEd
Ac · ƒcd=
0.684
0.40 · 0.45 · 17.0= 0.224 n is the relative normal force, (NDP)
5.8.3.1 (1)
450
400
225 225
200
200
38 38
z
y
Figure 34.3: Column properties
SOFiSTiK 2018 | VERiFiCATiON MANUAL - Design Code Benchmarks 277
DCE-EN33: Designing a Reinforced Concrete Column acc. DIN EN 1992-1-1
λm =16pn=
16
0.224= 34 for n = 0.224 < 0.41
Because λy = 100 and λz are > λm = 34 second order effectsshould be taken into account in both directions (y and z).5.8.3.1(2)
34.4.5 Imperfections
For isolated members, the effect of imperfection may be taken into ac-count:
e = θ ·0
2e is the eccentricity acc. 5.2(7), a) Eq.(5.2)
θ = θ0 · αh · αmθ is the inclination value acc. Eq. (5.1)
θ0 =1
200θ0 is the basic inclination value, Eq.(5.1)
αh =2p=
2p6.2
= 0.803 < 1.0αh is the reduction factor for length ofthe height
αm =p
0.5 · (1 + 1/m) =p
0.5 · (1 + 1/4) = 0.79
Bending about the y-axis:
0,y = 13.00 m
θ = 0.803 · 0.79 ·1
200= 0.00317 = 1/315
e,z =13000
2 · 315= 21 mm
Bending about the z-axis:
0,z = 6.20 m
θ = 0.803 · 1.0 ·1
200= 0.00402 ≈ 1/250
e,y =6200
2 · 250= 13 mm
34.4.6 Min. and max. required reinforcement
As,m = 0.09 · 40 · 45 = 162 cm2(NDP) 9.5.2, maximum value of 0.09Acshould not be exceeded.
As,mn = 0.15 ·|NEd|
ƒyd= 104 · 0.15 · 0.684/435 = 2.35 cm2
Constructive: 6 ϕ 12: As,mn = 6.79 cm2
278 VERiFiCATiON MANUAL - Design Code Benchmarks | SOFiSTiK 2018

DCE-EN33: Designing a Reinforced Concrete Column acc. DIN EN 1992-1-1
34.4.7 Design of longitudinal reinforcement
Nominal curvature method for y-y direction
The design is approached by using the nominal curvature method. Thismethod is primarily suitable for isolated members with constant normalforce and a defined effective length 0. The method gives a nominalsecond order moment based on a deflection, which in turn is based onthe effective length and an estimated maximum.
Design moment MEd:
MEd = M0Ed + M2 = NEd · (e0 + e + e2)
K1 = 1 for λ > 35
n = 1 + ω = 1 +ƒcd · Acƒyd · As
In the reference example As = 25.1 cm2 value is roughly estimated.The formula for ω value is NOT correct.
In SOFiSTiK we use ω =ƒyd · Asƒcd · Ac
n = 1 +17.0 · 0.40 · 0.45
435 · 25.1 · 10−4
n = 1 +3.06
1.09= 3.81
nb = 0.4 nb is the value of n at maximum mo-ment resistance, the value 0.4 may beused, 5.8.8.3
ϵyd =ƒyd
Es=
435
200000= 2.175 · 103
statical height:
d = h − c,s − ϕ,s −ϕ
2
d = 450 − 20 − 10 −16
2≈ 410 mm
Cross-section: b/h/d = 400/450/410 mm
d1
h=(450 − 410)
450= 0.09 ≈ 0.10
Table 34.3: Results
Value Units Comb 1 Comb 2 Comb 3
My [kN] 74.40 90.40 100.00
N [kN] -684.00 -431.00 -633.00
e0 [mm] 109 210 158
e1 [mm] 21 21 21
SOFiSTiK 2018 | VERiFiCATiON MANUAL - Design Code Benchmarks 279
DCE-EN33: Designing a Reinforced Concrete Column acc. DIN EN 1992-1-1
Table 34.3: (continued)
Value Units Comb 1 Comb 2 Comb 3
e0 + e [mm] [mm] 130 231 179
n 0.224 0.141 0.207
Kr 1 1 1
e2 = K1 ·1
r·2010
[mm] 199 199 199
etot = e0 + e + e2 [mm] 329 430 378
MEd = NEd · etot [kNm] 225 185 239
μEd = MEd/(b · d2 · ƒcd) 0.16 0.13 0.174
ωtot 0.19 0.13 0.174
As,tot = ωtot · b · h ·ƒcd
ƒyd[cm2] 13.40 12.70 16.20
Creep and shrinkage
ϕeƒ = ϕ(∞, t0) ·M0Eqp
M0Edϕ(∞, t0), 3.1.4, Fig. 3.1 a)
Kƒφ = 1 + β · φeƒ ≥ 1.0
β = 0.35 +ƒck
200−
λ
150≥ 0
β = 0.35 +300
200−100
150= −0.17 < 0
Kφ = 1→ Creep and shrinkage is neglected!
Nominal curvature method for z-z direction
The column will be designed as a non-reinforcement column for z-zdirection:
Buckling length:
0,z = 6.20 m
Slenderness:
λz = 54 < λm = 86
Limits for the second order theory:
co
h=6.20
0.40= 15.50 > 2.5
The column should be investigated for the second order effects.
280 VERiFiCATiON MANUAL - Design Code Benchmarks | SOFiSTiK 2018

DCE-EN33: Designing a Reinforced Concrete Column acc. DIN EN 1992-1-1
Design resistance normal force NRd:
NRd = b · h · ƒcd,p · is the factor taking into account ec-centricity, including 2nd order effectsand normal effects of creep, 12.6.5.2
= 1.14 · (1 − 2 ·etot
h) − 0.02 ·
0
h≤ 1 −
2 · etoth
h is the overall depth of the cross-section, 12.6.5.2
b is the overall width of the cross-section, 12.6.5.2
etot = e0 + e = 0 + 13 = 13 mm
= 1.14 · (1 − 2 ·13
400) − 0.02 ·
6200
400≤ 1 −
2 · 13
400
= 0.756 ≤ 0.94
ƒcd,p =0.70 · 30
1.5= 14.0 N/mm2
NRd = 0.45 · 0.40 · 14.0 · 0.756 = 1.9 sMN > |NEd| = 0.684 MN
34.4.8 Design of shear reinforcement
Shear design on bottom of column:
VEd = −32.0 kN General verification procedure, 6.2.1
NEd = 431 kN
d = 0.41 m
VEd,reƒ = 32.0 − 0.41 · 6.48 = 29.3 kN
The design value of the shear resistance VRd,c
VRd,c =�
0.15
γc· k · (100 · ρ · ƒck)1/3 + 0.12 · σcp
�
· b · d >
VRd,c,mn Shear design, 6.2.2, Eq. (6.2)
k = 1 +
√
√200
d≤ 2.0
k = 1 +
√
√200
410= 1.70
ρ =As
b · d=
8.04
40 · 41= 0.0049 < 0.02
ƒck = 30 N/mm2
σcp =NEd
Ac=
0.431
0.40 · 0.45= 2.39 MN/m2 C30/37→ 0.2 · ƒcd = 3.4 MP
VRd,c =�
0.15
1.5· 1.70 · (100 · 0.49 · 30)1/3 + 0.12 · 2.39
�
· 0.40 ·
0.41 >= 0.115 MN
VEd,red = 29.3 kN < VRd,c = 115 kN
→ no shear reinforcement required!
SOFiSTiK 2018 | VERiFiCATiON MANUAL - Design Code Benchmarks 281
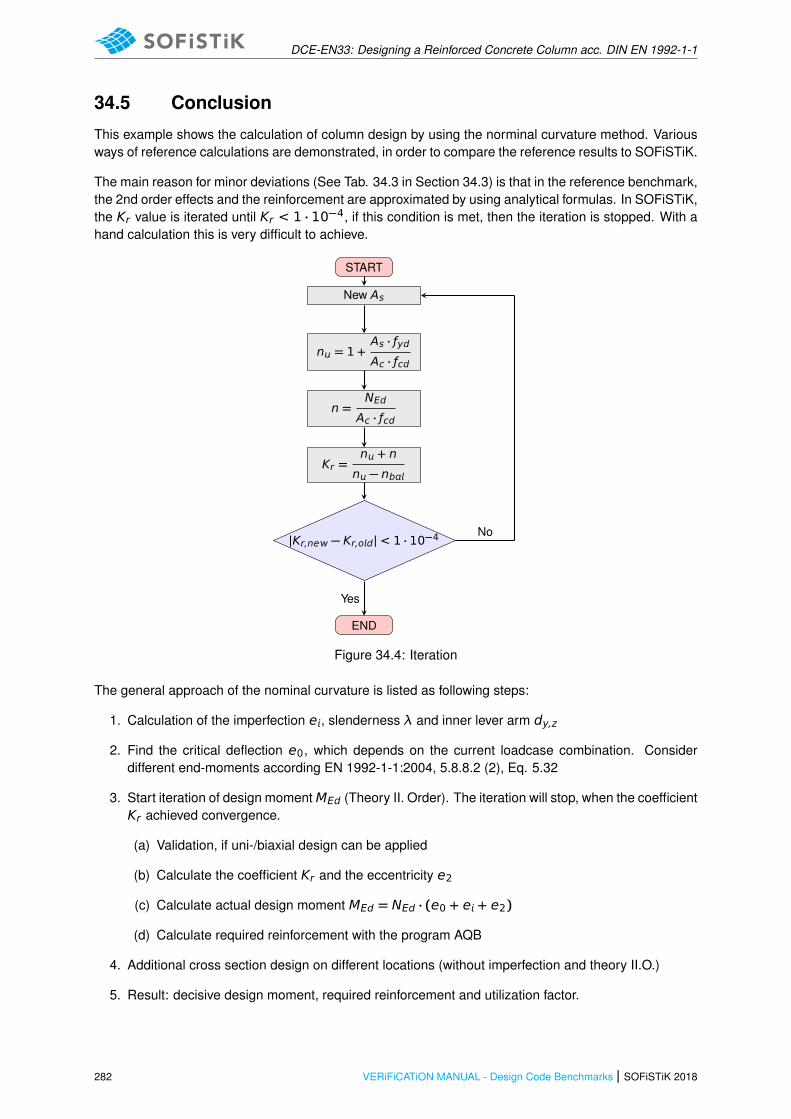
DCE-EN33: Designing a Reinforced Concrete Column acc. DIN EN 1992-1-1
34.5 Conclusion
This example shows the calculation of column design by using the norminal curvature method. Variousways of reference calculations are demonstrated, in order to compare the reference results to SOFiSTiK.
The main reason for minor deviations (See Tab. 34.3 in Section 34.3) is that in the reference benchmark,the 2nd order effects and the reinforcement are approximated by using analytical formulas. In SOFiSTiK,the Kr value is iterated until Kr < 1 · 10−4, if this condition is met, then the iteration is stopped. With ahand calculation this is very difficult to achieve.
START
New As
n = 1 +As · ƒydAc · ƒcd
n =NEd
Ac · ƒcd
Kr =n + n
n − nb
|Kr,ne − Kr,od| < 1 · 10−4
END
Yes
No
Figure 34.4: Iteration
The general approach of the nominal curvature is listed as following steps:
1. Calculation of the imperfection e, slenderness λ and inner lever arm dy,z
2. Find the critical deflection e0, which depends on the current loadcase combination. Considerdifferent end-moments according EN 1992-1-1:2004, 5.8.8.2 (2), Eq. 5.32
3. Start iteration of design moment MEd (Theory II. Order). The iteration will stop, when the coefficientKr achieved convergence.
(a) Validation, if uni-/biaxial design can be applied
(b) Calculate the coefficient Kr and the eccentricity e2
(c) Calculate actual design moment MEd = NEd · (e0 + e + e2)
(d) Calculate required reinforcement with the program AQB
4. Additional cross section design on different locations (without imperfection and theory II.O.)
5. Result: decisive design moment, required reinforcement and utilization factor.
282 VERiFiCATiON MANUAL - Design Code Benchmarks | SOFiSTiK 2018
DCE-EN33: Designing a Reinforced Concrete Column acc. DIN EN 1992-1-1
34.6 Literature
[1] DIN EN 1992-1-1/NA: Eurocode 2: Design of concrete structures, Part 1-1/NA: General rules andrules for buildings - German version EN 1992-1-1:2005 (D), Nationaler Anhang Deutschland -Stand Februar 2010. CEN. 2010.
[2] F. Fingerloos, J. Hegger, and K. Zilch. DIN EN 1992-1-1 Bemessung und Konstruktion vonStahlbeton- und Spannbetontragwerken - Teil 1-1: Allgemeine Bemessungsregeln und Regelnfur den Hochbau. BVPI, DBV, ISB, VBI. Ernst & Sohn, Beuth, 2012.
[4] Beispiele zur Bemessung nach Eurocode 2 - Band 1: Hochbau. Ernst & Sohn. Deutschen Beton-und Bautechnik-Verein E.V. 2011.
SOFiSTiK 2018 | VERiFiCATiON MANUAL - Design Code Benchmarks 283

DCE-EN33: Designing a Reinforced Concrete Column acc. DIN EN 1992-1-1
284 VERiFiCATiON MANUAL - Design Code Benchmarks | SOFiSTiK 2018

DCE-EN34: Elastic Critical Plate Buckling Stress
35 DCE-EN34: Elastic Critical Plate Buckling Stress
Overview
Design Code Family(s): EN
Design Code(s): EN 1993-1-1
Module(s): ASE
Input file(s): eccs plate buckling.dat
35.1 Problem Description
The problem consists of a stiffened steel plate. Its dimensions and boundary conditions are given inFigure 35.2.
The main goal of this benchmark is to verify and compare the SOFiSTiK results with the ECCS referenceexample Beg et al. [22, Example 2.4-3].
In SOFiSTiK a FEM model will be used to compare the results with:
• Kloppel diagrams (Kloppel and Scheer, 1960)
• EBPlate (2007)
• FEM software (ABAQUS)
• EN 1993-1-5 rules
Figure 35.2: SOFiSTiK FEM Model - Steel plate with 2 horizontal stiffeners
SOFiSTiK 2018 | VERiFiCATiON MANUAL - Design Code Benchmarks 285

DCE-EN34: Elastic Critical Plate Buckling Stress
b
a
σc
hs
ts
b1
b2 = b1
b3 = b1
a = 1800 mm, b = 1800 mm, b1 = 600 mm, hs = 100 mm, ts = 10 mm.S 355, ƒy = 355 N/mm2, ϵ = 0.81
Figure 35.1: The layout of stiffened plate
35.2 Reference Solution
This example is concerned with calculation of the elastic critical plate buckling stress. The content ofthis problem is covered by following parts of EN 1993-1-1 [7] and EN 1993-1-5 [23]:
• Materials (EN 1993-1-1 [7], Section 3)
• Calculating the critical plate buckling stress (EN 1993-1-5 [23], Annex A.2)
35.3 Model and Results
The calculation steps with loading conditions are presented below and the results are given in Table 35.2.
To calculate the critical plate buckling stress the loading, σc = 1.0 N/mm2 is used. The critical elasticstress will be calculated by multiplying the minimum eigenvalue with the unity stress σc = 1.0.
σcr,p = αcr · σc
Table 35.1: Model Properties
Material Properties Geometric Properties Loading
S 355 = 1800 mm σc = −1 N/mm2
ƒy = 355 N/mm2 b = 1800 mm
286 VERiFiCATiON MANUAL - Design Code Benchmarks | SOFiSTiK 2018
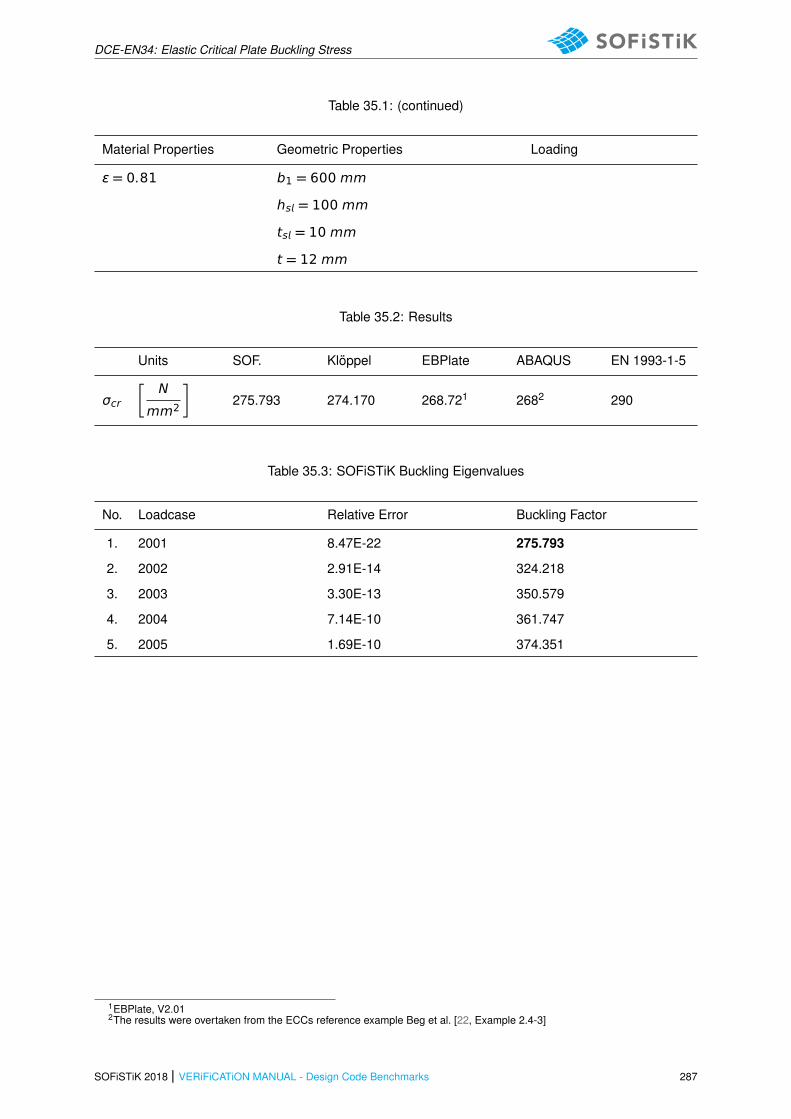
DCE-EN34: Elastic Critical Plate Buckling Stress
Table 35.1: (continued)
Material Properties Geometric Properties Loading
ϵ = 0.81 b1 = 600 mm
hs = 100 mm
ts = 10 mm
t = 12 mm
Table 35.2: Results
Units SOF. Kloppel EBPlate ABAQUS EN 1993-1-5
σcr
�
N
mm2
�
275.793 274.170 268.721 2682 290
Table 35.3: SOFiSTiK Buckling Eigenvalues
No. Loadcase Relative Error Buckling Factor
1. 2001 8.47E-22 275.793
2. 2002 2.91E-14 324.218
3. 2003 3.30E-13 350.579
4. 2004 7.14E-10 361.747
5. 2005 1.69E-10 374.351
1EBPlate, V2.012The results were overtaken from the ECCs reference example Beg et al. [22, Example 2.4-3]
SOFiSTiK 2018 | VERiFiCATiON MANUAL - Design Code Benchmarks 287
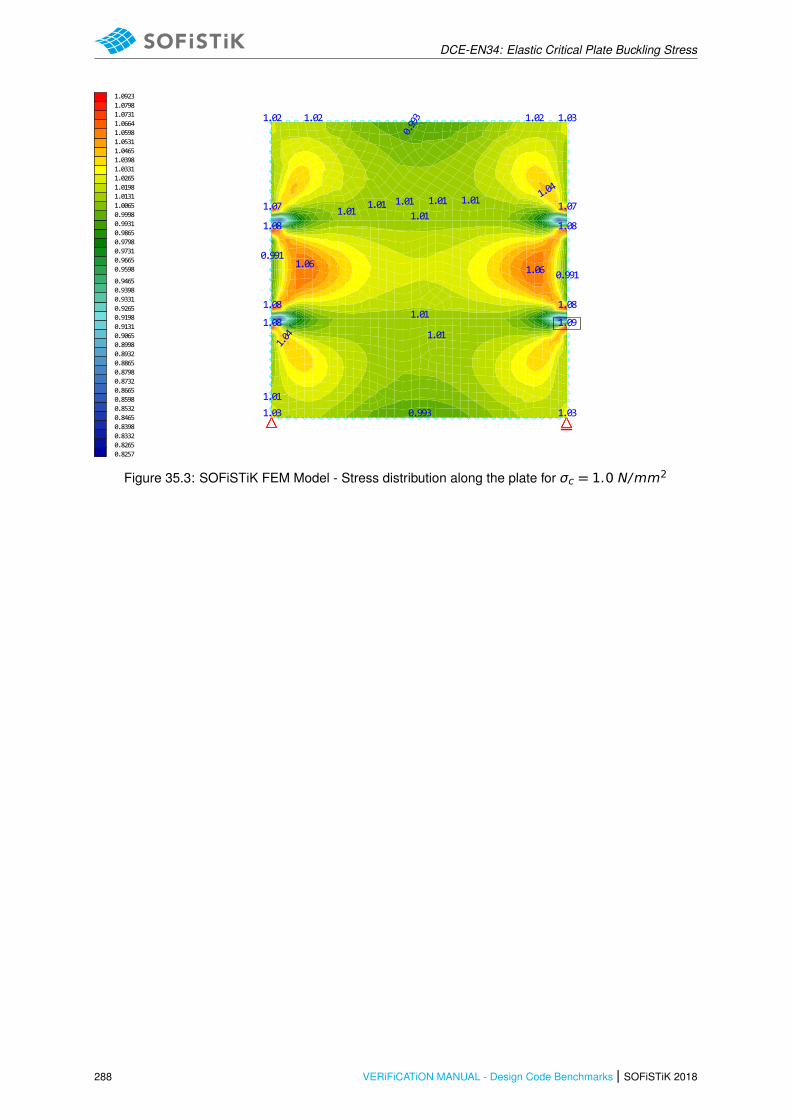
DCE-EN34: Elastic Critical Plate Buckling Stress
1.09
1.08
1.08
1.08
1.08
1.08
1.071.07
1.061.06
1.04
1.04
1.031.03
1.031.02 1.02 1.02
1.011.01
1.01
1.01 1.01
1.01
1.01
1.01
1.01
0.993
0.993
0.991
0.991
0.82570.82650.83320.83980.84650.85320.85980.86650.87320.87980.88650.89320.89980.90650.91310.91980.92650.93310.93980.9465
0.95980.96650.97310.97980.98650.99310.99981.00651.01311.01981.02651.03311.03981.04651.05311.05981.06641.07311.07981.0923
Figure 35.3: SOFiSTiK FEM Model - Stress distribution along the plate for σc = 1.0 N/mm2
288 VERiFiCATiON MANUAL - Design Code Benchmarks | SOFiSTiK 2018
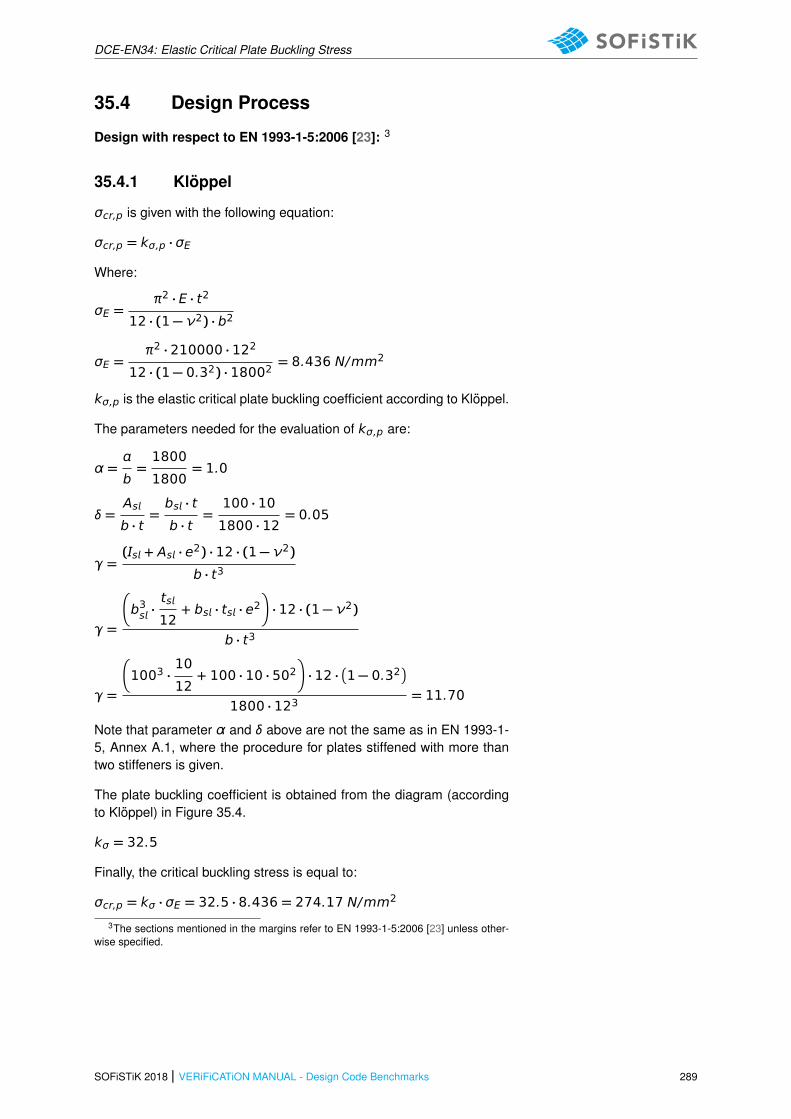
DCE-EN34: Elastic Critical Plate Buckling Stress
35.4 Design Process
Design with respect to EN 1993-1-5:2006 [23]: 3
35.4.1 Kloppel
σcr,p is given with the following equation:
σcr,p = kσ,p · σE
Where:
σE =π2 · E · t2
12 · (1 − ν2) · b2
σE =π2 · 210000 · 122
12 · (1 − 0.32) · 18002= 8.436 N/mm2
kσ,p is the elastic critical plate buckling coefficient according to Kloppel.
The parameters needed for the evaluation of kσ,p are:
α =
b=1800
1800= 1.0
δ =As
b · t=bs · t
b · t=100 · 10
1800 · 12= 0.05
γ =(s + As · e2) · 12 · (1 − ν2)
b · t3
γ =
�
b3s ·ts
12+ bs · ts · e2
�
· 12 · (1 − ν2)
b · t3
γ =
�
1003 ·10
12+ 100 · 10 · 502
�
· 12 ·�
1 − 0.32�
1800 · 123= 11.70
Note that parameter α and δ above are not the same as in EN 1993-1-5, Annex A.1, where the procedure for plates stiffened with more thantwo stiffeners is given.
The plate buckling coefficient is obtained from the diagram (accordingto Kloppel) in Figure 35.4.
kσ = 32.5
Finally, the critical buckling stress is equal to:
σcr,p = kσ · σE = 32.5 · 8.436 = 274.17 N/mm2
3The sections mentioned in the margins refer to EN 1993-1-5:2006 [23] unless other-wise specified.
SOFiSTiK 2018 | VERiFiCATiON MANUAL - Design Code Benchmarks 289
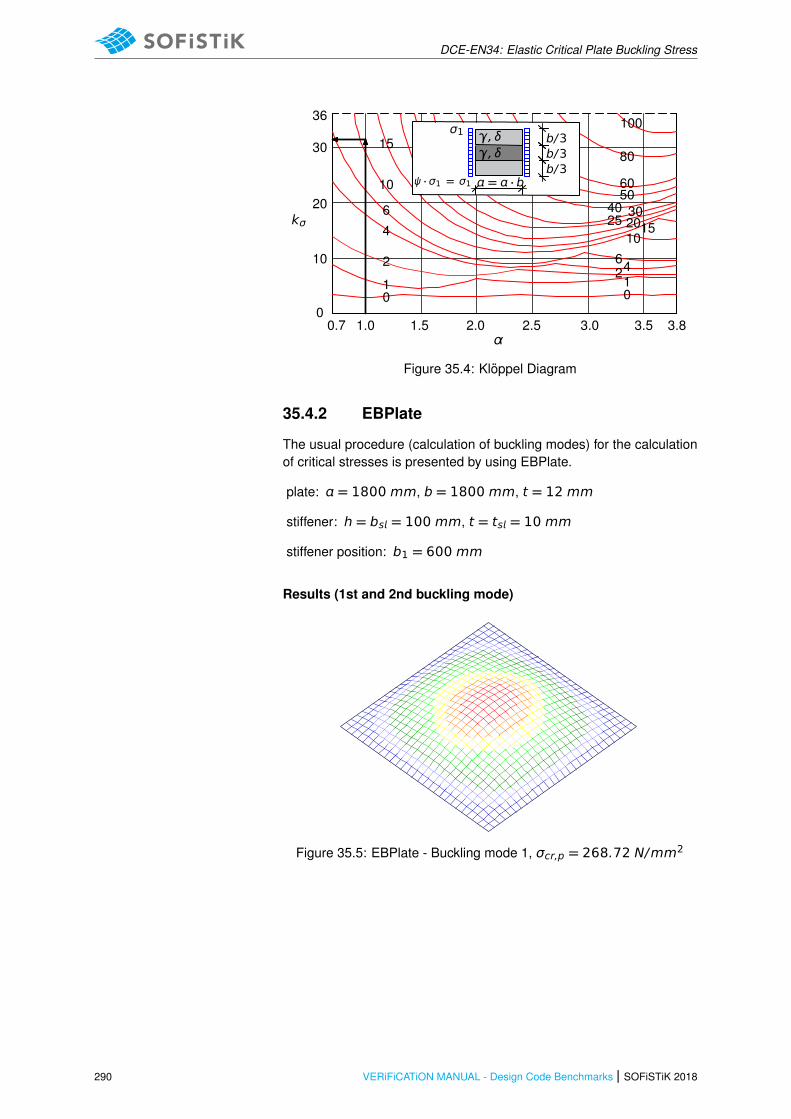
DCE-EN34: Elastic Critical Plate Buckling Stress
36
30
20
10
0
kσ
0.7 1.0 1.5 2.0 2.5 3.0 3.5 3.8α
σ1
ψ · σ1 = σ1
b/3b/3b/3
= · b
γ, δγ, δ
01
2
4
6
10
15
01
24610
1520253040
5060
80
100
Figure 35.4: Kloppel Diagram
35.4.2 EBPlate
The usual procedure (calculation of buckling modes) for the calculationof critical stresses is presented by using EBPlate.
plate: = 1800 mm, b = 1800 mm, t = 12 mm
stiffener: h = bs = 100 mm, t = ts = 10 mm
stiffener position: b1 = 600 mm
Results (1st and 2nd buckling mode)
Figure 35.5: EBPlate - Buckling mode 1, σcr,p = 268.72 N/mm2
290 VERiFiCATiON MANUAL - Design Code Benchmarks | SOFiSTiK 2018
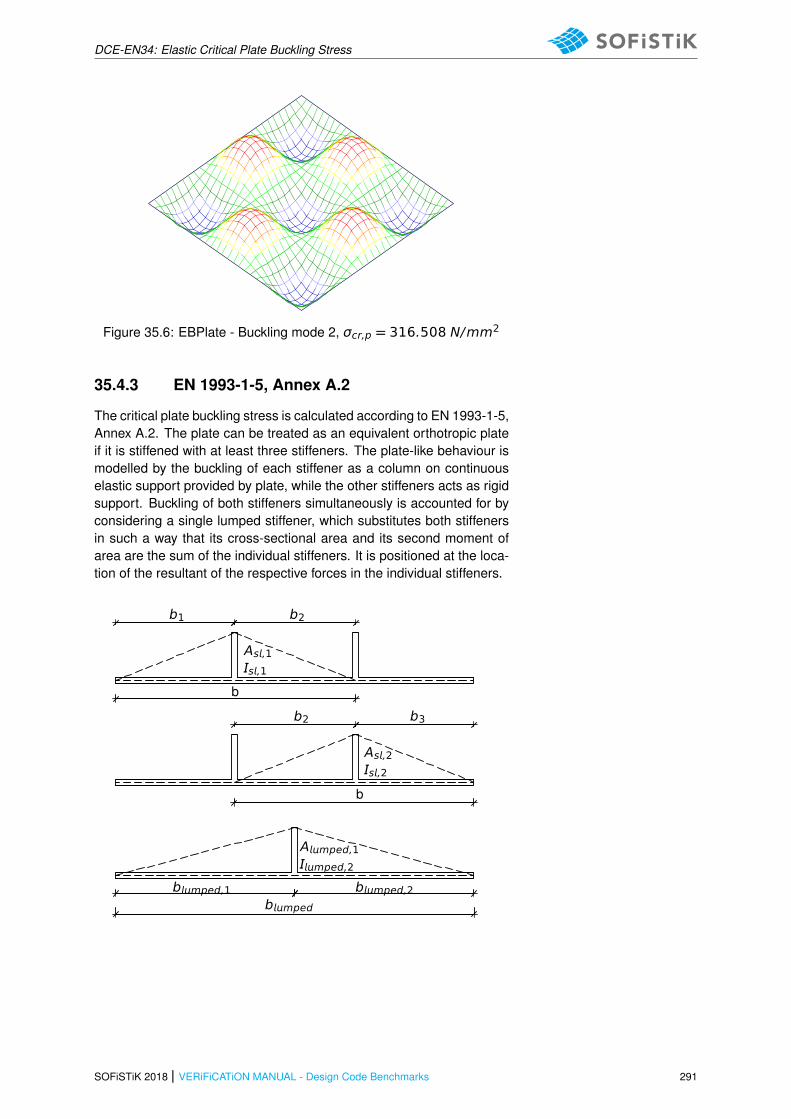
DCE-EN34: Elastic Critical Plate Buckling Stress
Figure 35.6: EBPlate - Buckling mode 2, σcr,p = 316.508 N/mm2
35.4.3 EN 1993-1-5, Annex A.2
The critical plate buckling stress is calculated according to EN 1993-1-5,Annex A.2. The plate can be treated as an equivalent orthotropic plateif it is stiffened with at least three stiffeners. The plate-like behaviour ismodelled by the buckling of each stiffener as a column on continuouselastic support provided by plate, while the other stiffeners acts as rigidsupport. Buckling of both stiffeners simultaneously is accounted for byconsidering a single lumped stiffener, which substitutes both stiffenersin such a way that its cross-sectional area and its second moment ofarea are the sum of the individual stiffeners. It is positioned at the loca-tion of the resultant of the respective forces in the individual stiffeners.
b1 b2
b
As,1s,1
b2 b3
b
As,2s,2
bmped,1 bmped,2
bmped
Amped,1mped,2
SOFiSTiK 2018 | VERiFiCATiON MANUAL - Design Code Benchmarks 291
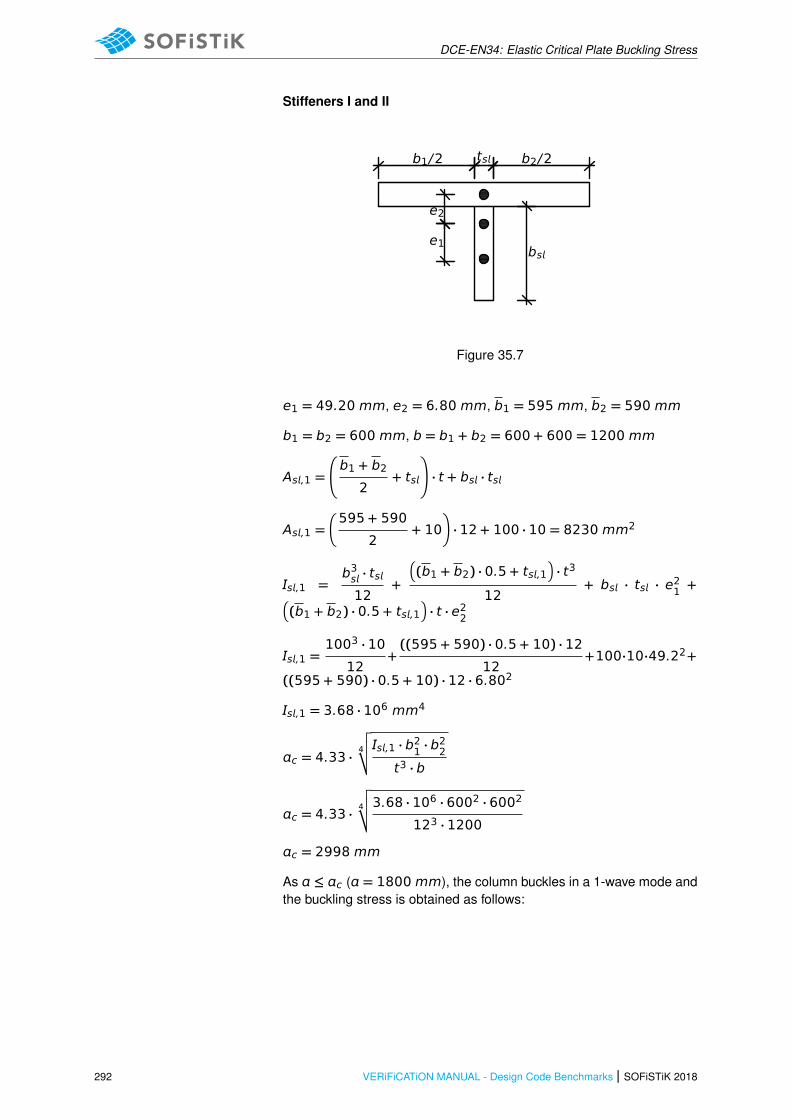
DCE-EN34: Elastic Critical Plate Buckling Stress
Stiffeners I and II
b1/2 ts b2/2
e2
e1bs
Figure 35.7
e1 = 49.20 mm, e2 = 6.80 mm, b1 = 595 mm, b2 = 590 mm
b1 = b2 = 600 mm, b = b1 + b2 = 600 + 600 = 1200 mm
As,1 =
b1 + b22
+ ts
!
· t + bs · ts
As,1 =�
595 + 590
2+ 10
�
· 12 + 100 · 10 = 8230 mm2
s,1 =b3s · ts12
+
�
(b1 + b2) · 0.5 + ts,1�
· t3
12+ bs · ts · e21 +
�
(b1 + b2) · 0.5 + ts,1�
· t · e22
s,1 =1003 · 10
12+((595 + 590) · 0.5 + 10) · 12
12+100·10·49.22+
((595 + 590) · 0.5 + 10) · 12 · 6.802
s,1 = 3.68 · 106 mm4
c = 4.33 ·4
√
√
√ s,1 · b21 · b22
t3 · b
c = 4.33 ·4
√
√
√3.68 · 106 · 6002 · 6002
123 · 1200
c = 2998 mm
As ≤ c ( = 1800mm), the column buckles in a 1-wave mode andthe buckling stress is obtained as follows:
292 VERiFiCATiON MANUAL - Design Code Benchmarks | SOFiSTiK 2018
DCE-EN34: Elastic Critical Plate Buckling Stress
σcr,s =π2 · E · s,1As,1 · 2
+E · t3 · b · 2
4 · π2 · (1 − ν2) · As,1 · b21 · b22
σcr,s =π2 · 210000 · 3.68 · 106
8230 · 18002
+210000 · 123 · 1200 · 18002
4 · π2 · (1 − 0.32) · 8230 · 6002 · 6002
σcr,s = 322 N/mm2
In case of a stress gradient over the plate width, the critical plate buck-ling stress should be properly interpolated from the position of the stiff-ener to the most stressed edge of the plate. In this case no stress gra-dient over the depth of the plate is present. Therefore, the critical platebuckling stress is equal to the critical stress calculated for the bucklingof the stiffener on the elastic support:
σcr,p= σ
cr,p= σcr,s = 322 N/mm2
Lumped stiffener
bmped,1 = bmped,2 = 900 mm, bmped = 1800 mm
Amped = As + As= 8230 + 8230 = 16460 mm4
mped = s + s= 3.675 · 106 + 3.675 · 106 = 7.35 · 106 mm4
c = 4.33 ·4
√
√
√
√
mped · b2mped,1 · b2mped,2
t3 · bmped
c = 4.33 ·4
√
√
√7.35 · 106 · 9002 · 9002
123 · 1800
c = 4832 mm
As < c ( = 1800mm), the column buckles in a 1-wave mode andthe buckling stress is obtained with equation:
σcr,mped =π2 · E · mped
Amped · 2
+E · t3 · bmped · 2
4 · π2 · (1 − ν2) · Amped · b2mped,1 · b2mped,2
SOFiSTiK 2018 | VERiFiCATiON MANUAL - Design Code Benchmarks 293
DCE-EN34: Elastic Critical Plate Buckling Stress
σcr,mped =π2 · 210000 · 7.35 · 106
16460 · 18002
+210000 · 123 · 1800 · 18002
4 · π2 · (1 − 0.32) · 16460 · 9002 · 9002
Finally we have:
σcr,mped = 290 N/mm2
σcr,p =mn�
σcr,p
, σmpedcr,p
�
σcr,p =mn [322,290] = 290 N/mm2
35.4.4 ABAQUS
The results from ABAQUS have be overtaken from the ECCS referenceexample Beg et al. [22, Example 2.4-3], see Table 35.2 for more details.
294 VERiFiCATiON MANUAL - Design Code Benchmarks | SOFiSTiK 2018
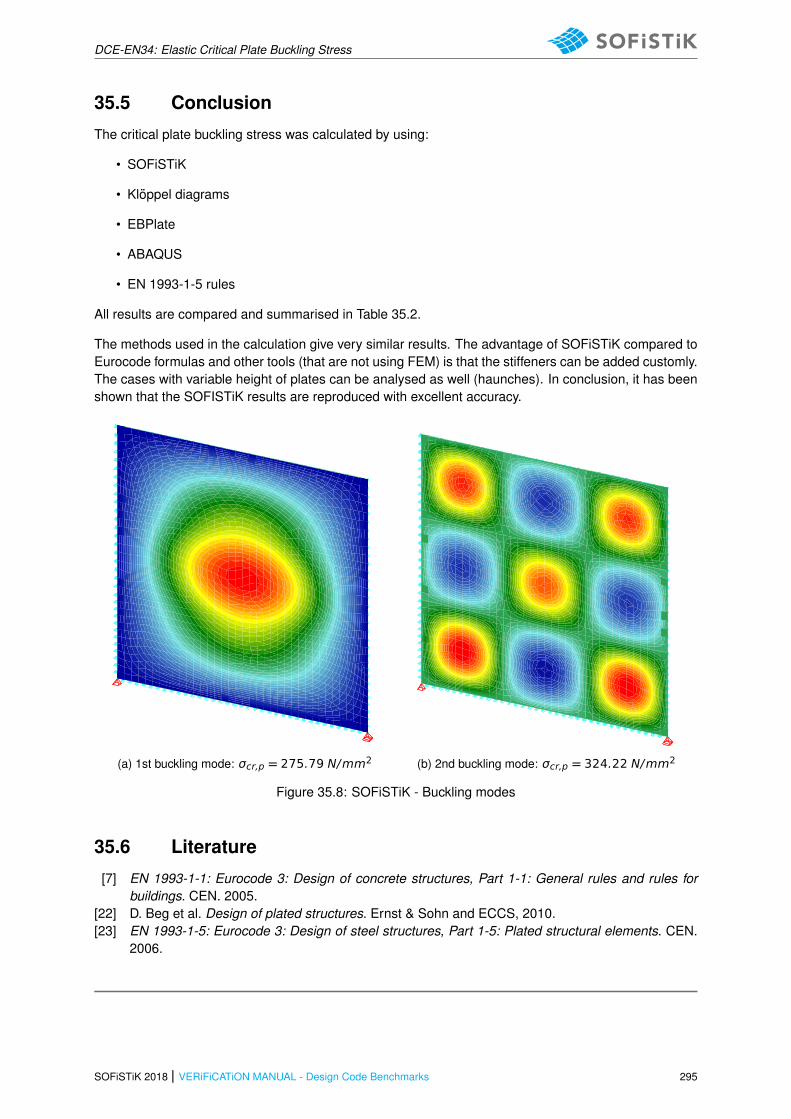
DCE-EN34: Elastic Critical Plate Buckling Stress
35.5 Conclusion
The critical plate buckling stress was calculated by using:
• SOFiSTiK
• Kloppel diagrams
• EBPlate
• ABAQUS
• EN 1993-1-5 rules
All results are compared and summarised in Table 35.2.
The methods used in the calculation give very similar results. The advantage of SOFiSTiK compared toEurocode formulas and other tools (that are not using FEM) is that the stiffeners can be added customly.The cases with variable height of plates can be analysed as well (haunches). In conclusion, it has beenshown that the SOFISTiK results are reproduced with excellent accuracy.
(a) 1st buckling mode: σcr,p = 275.79 N/mm2 (b) 2nd buckling mode: σcr,p = 324.22 N/mm2
Figure 35.8: SOFiSTiK - Buckling modes
35.6 Literature
[7] EN 1993-1-1: Eurocode 3: Design of concrete structures, Part 1-1: General rules and rules forbuildings. CEN. 2005.
[22] D. Beg et al. Design of plated structures. Ernst & Sohn and ECCS, 2010.[23] EN 1993-1-5: Eurocode 3: Design of steel structures, Part 1-5: Plated structural elements. CEN.
2006.
SOFiSTiK 2018 | VERiFiCATiON MANUAL - Design Code Benchmarks 295

DCE-EN34: Elastic Critical Plate Buckling Stress
296 VERiFiCATiON MANUAL - Design Code Benchmarks | SOFiSTiK 2018

DCE-MC1: Creep and Shrinkage Calculation using the Model Code 2010
36 DCE-MC1: Creep and Shrinkage Calculation usingthe Model Code 2010
Overview
Design Code Family(s): MC
Design Code(s): MC 2010
Module(s): AQB, CSM
Input file(s): creep shrinkage mc10.dat
36.1 Problem Description
The problem consists of a simply supported beam with a rectangular cross-section of prestressed con-crete, as shown in Fig. 36.1. The total creep and shrinkage is calculated.
My
Np
Ap
h
zp
Figure 36.1: Problem Description
36.2 Reference Solution
This example is concerned with the calculation of creep and shrinkage on a prestressed concrete cross-section, subject to bending and prestress force. The content of this problem is covered by the followingparts of fib Model Code 2010 [16]:
• Creep and Shrinkage (Section 5.1.9.4)
• Temperature effects (Section 5.1.10)
36.3 Model and Results
Benchmark 17 is here extended for the case of creep and shrinkage developing on a prestressed con-crete simply supported beam. In benchmark 18 the calculation was made using DIN EN 1992-1-1:2004design code. This example will explain the calculation for the case of creep and shrinkage using fibModel Code 2010 [16] The analysed system can be seen in Fig. 36.2, with properties as defined inTable 36.1. Further information about the tendon geometry and prestressing can be found in benchmark17. The beam consists of a rectangular cross-section and is prestressed and loaded with its own weight.A calculation of the creep and shrinkage is performed with respect to fib Model Code 2010 [16].
SOFiSTiK 2018 | VERiFiCATiON MANUAL - Design Code Benchmarks 297
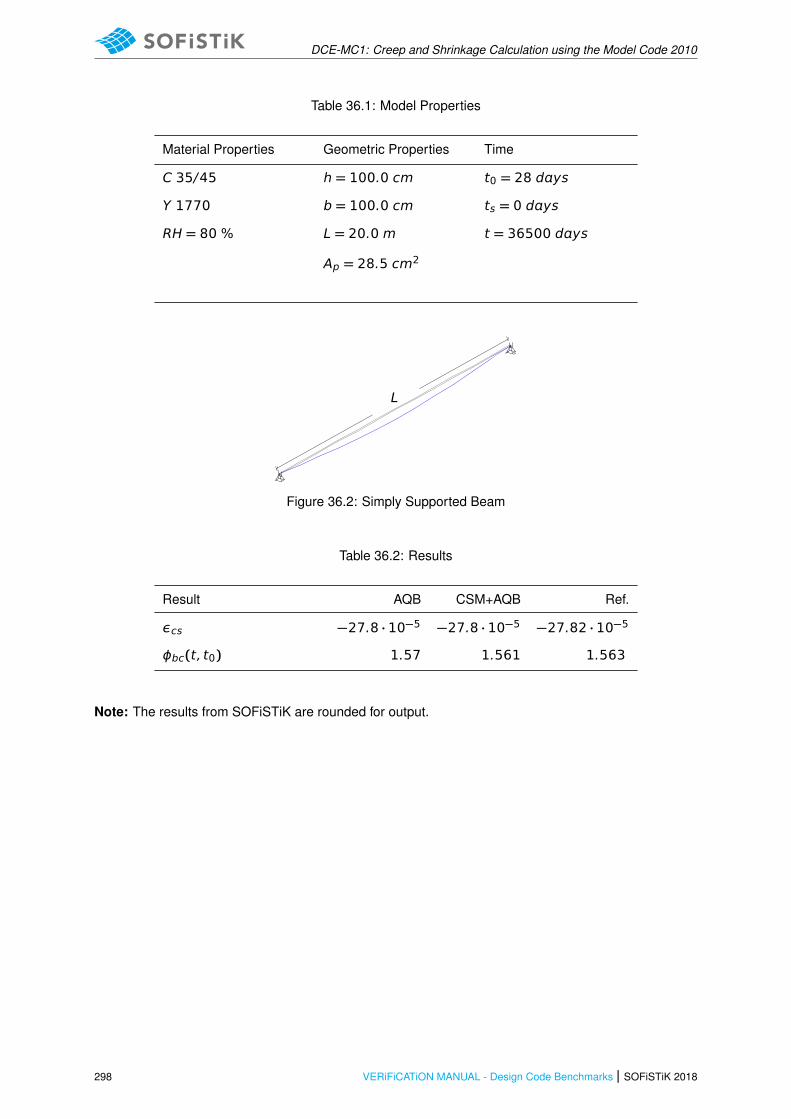
DCE-MC1: Creep and Shrinkage Calculation using the Model Code 2010
Table 36.1: Model Properties
Material Properties Geometric Properties Time
C 35/45 h = 100.0 cm t0 = 28 dys
Y 1770 b = 100.0 cm ts = 0 dys
RH = 80 % L = 20.0 m t = 36500 dys
Ap = 28.5 cm2
L
Figure 36.2: Simply Supported Beam
Table 36.2: Results
Result AQB CSM+AQB Ref.
εcs −27.8 · 10−5 −27.8 · 10−5 −27.82 · 10−5
ϕbc(t, t0) 1.57 1.561 1.563
Note: The results from SOFiSTiK are rounded for output.
298 VERiFiCATiON MANUAL - Design Code Benchmarks | SOFiSTiK 2018
DCE-MC1: Creep and Shrinkage Calculation using the Model Code 2010
36.4 Design Process
Design with respect to fib Model Code 2010 [16]
Material:
Concrete: C 35/45 5.1: Concrete
Ecm = 35000 N/mm2 5.1.7.2: Modulus of elasticity forC 35/45
ƒck = 35 N/mm2
ƒcm = 43 N/mm2 5.1.4: Mean value of compressivestrength ƒck . See the eq. (5.1-1)
Prestressing Steel: Y 1770 5.3: Prestressing Steel
Ep = 195000 N/mm2 Ep for wires
ƒpk = 1770 N/mm2 ƒpk Characteristic tensile strength ofprestressing steel
CALCULATION OF TOTAL SHRINKAGE AND SWELLING at =10.0 m midspan:
t0 = 28 days t0 age at first loadingts concrete age at the beginning ofshrinkage or swellingt age of concrete at the moment consid-ered
ts = 0 days
t = 36500 days
εcs(t, ts) = εcbs(t) + εcds(t, ts) 5.1.9.4.4: Eq. 5.1-75: εcs(t, ts) totalshrinkage or swelling strains
Calculating the basic shrinkage:
εcbs(t) = εcbs0(ƒcm) · βbs(t) 5.1.9.4.4: Eq. 5.1-76: εcbs(t) is the ba-sic shrinkage
ε(ƒcm) = −αbs ·�
0.1 · ƒcm6 + 0.1 · ƒcm
�2.5
· 10−6 5.1.9.4.4: Eq. 5.1-78: εcds0(ƒcm) is thenotional shrinkage coefficient
αbs = 700 for N class of cement αbs is a coefficient, dependent on thetype of cement (see table 5.1-12)
ε(ƒcm) = −700 ·�
0.1 · 43
6 + 0.1 · 43
�2.5
· 10−6
ε(ƒcm) = −700 · (4.3/10.3)2.5 · 10−6
ε(ƒcm) = −7.8827 · 10−5
The development of drying shrinkage strain in time strongly dependson βds(t, ts) factor. SOFiSTiK accounts not only for the age at startof drying ts but also for the influence of the age of prestressing t0.Therefore, the calculation of factor βds reads:
βbs(t) = 1 − ep(−0.2 ·pt) −
�
1 − ep(−0.2 ·p
t0)�
βbs(t) = 1 − ep(−0.2 ·p36500) −
�
1 − ep(−0.2 ·p28)
�
βbs(t) = 1 − ep(−38.2099) − (1 − ep(−1.0583))
βbs(t) = 0.347
SOFiSTiK 2018 | VERiFiCATiON MANUAL - Design Code Benchmarks 299
DCE-MC1: Creep and Shrinkage Calculation using the Model Code 2010
The basic shrinkage is calculated:
εcbs(t) = εcbs0(ƒcm) · βbs(t)
εcbs(t) = −7.8827 · 10−5 · 0.3475.1.9.4.4: Eq: 5.1-76
εcbs(t) = −0.0002735269 = −2.735 · 10−5
Calculating the drying shrinkage:
εcds(t, ts) = εcds0(ƒcm) · βRH(RH) · βds(t − ts)5.1.9.4.4: Eq. 5.1-77
The drying shrinkage is calculated εcds(t, ts) by means of the notionaldrying shrinkage coefficient εcds0(ƒcm), the coefficient βRH, taking intoaccount the effect of the ambient relative humidity, and the functionβds(t − ts) describing the time development:
εcds0 = [(220 + 110 · αds1) · ep(−αds2 · ƒcm)] · 10−65.1.9.4.4: Eq. 5.1-80
Coefficients (αds) are depending on the type of cement.See table 5.1-12
For normal class type of cement:αds1 = 4αds2 = 0.012
εcds0(ƒcm) = [(220 + 110 · 4) · ep(−0.012 · ƒcm)] · 10−6
εcds0(ƒcm) = [660 · ep(−0.516)] · 10−6
εcds0(ƒcm) = 39.39 · 10−5
βRH =
−1.55 ·�
1 −�
RH
100
�3�
, ƒor 40 ≤ RH < 99% · βs1
0.25, ƒor RH ≥ 99% · βs1
5.1.9.4.4: Eq. 5.1-81
βs1 =�
35
ƒcm
�0.1
≤ 1.0
βs1 =�
35
43
�0.1
= 0.9796 ≤ 1.05.1.9.4.4: Eq. 5.1-83
99% · βs1 = 99 · 0.9796 = 96.98
βRH = −1.55 ·�
1 −�
80
100
�3�
= −0.7564
SOFiSTiK accounts not only for the age at start of drying ts but alsofor the influence of the age of prestressing, so the time developmentfunction reads:
βds(t − ts) =
√
√
√
t − ts0.035 · h2 + (t − ts)
−
√
√
√
t0 − ts0.035 · h2 + (t0 − ts)
5.1.9.4.4: Eq. 5.1-82
βds(t − ts) =
√
√
√36500
0.035 · 5002 + 36500−
√
√
√28
0.035 · 5002 + 28
βds(t − ts) = 0.8981 − 0.05669 = 0.8416
The drying shrinkage is calculated:εcds(t, ts) = εcds0(ƒcm) · βRH · βds(t − ts)
300 VERiFiCATiON MANUAL - Design Code Benchmarks | SOFiSTiK 2018
DCE-MC1: Creep and Shrinkage Calculation using the Model Code 2010
εcds(t, ts) = 39.39 · 10−5 · (−0.7564) · 0.8416
εcds(t, ts) = −25.08 · 10−5
The total shrinkage or swelling strain is calculated:εcs(t, ts) = εcbs(t) + εcds(t, ts)
εcs(t, ts) = (−2.735 + (−25.08)) · 10−5 = −27.82 · 10−5
CALCULATION OF TOTAL CREEP at x=10.0 m midspan:
The creep coefficient:ϕ(t, t0) = ϕbc(t, t0) + ϕdc(t, t0) 5.1.9.4.3(b): Eq. 5.1-63: ϕ(t, t0) is the
creep coefficient; ϕbc(t, t0) is the basiccreep coefficient according to eq. 5.1-64; ϕdc(t, t0) is the drying creep coeffi-cient according to eq. 5.1-67
Calculating the basic creep:
ϕbc(t, t0) = β(ƒcm) · βbc(t, t0)
with: βbc(ƒcm) =1.8
(ƒcm)0.7=
1.8
(43)0.7= 0.12937
and the time development function:
βbc(t, t0) = n
�
�
30
t0,dj+ 0.035
�2
· (t − t0) + 1�
5.1.9.4.3(b): Eq. 5.1-66: βbc(t, t0) isthe time development function
t0,dj = t0,T ·
9
2 + t1.20,T+ 1
α
≥ 0.5 days t0,dj is the modified age at loading t0
tT =n∑
=1
Δt · ep�
13.65 −4000
273 + T(Δt)
�
5.1.10.2: Eq. 5.1-85; tT the adjustedconcrete age, during the effect of ele-vated or reduced temperatures on thematurity of concrete
t0,T =n∑
=1
28 · ep�
13.65 −4000
273 + 20
�
= 27.947 days
α = 0 for N class cement
t0,dj = 27.947 ·�
9
2 + 27.9471.2+ 1
�0
= 27.947 ≥ 0.5 days
βbc(t, t0) = n
�
�
30
27.947+ 0.035
�2
· 36472 + 1�
βbc(t, t0) = 10.71
The basic creep coefficient:ϕbc(t, t0) = 0.12937 · 10.71 = 1.385
Calculating the drying creep:
The drying coefficient may be estimated from:ϕdc(t, t0) = βdcƒcm · β(RH) · βdc(t0) · βdc(t, t0) 5.1.9.4.3b: Eq. 5.1-67; ϕdc(t, t0) is the
drying creep coefficient
with:
βdc(ƒcm) =412
(ƒcm)1.4= 2.1283 5.1.9.4.3: Eq.5.1-68
SOFiSTiK 2018 | VERiFiCATiON MANUAL - Design Code Benchmarks 301

DCE-MC1: Creep and Shrinkage Calculation using the Model Code 2010
β(RH) =1 −
RH
100
3
√
√
√
0.1 ·h
100
=1 −
80
100
3
√
√
√
0.1 ·500
100
= 0.2515.1.9.4.3(b): Eq. 5.1-69
βdc(t0) =1
0.1 + t0.20,dj=
1
0.1 + 27.947= 0.48865.1.9.4.3: Eq.5.1-70
βdc(t, t0) =�
t − t0βh + (t − t0)
�γ(t0)
5.1.9.4.3(b): Eq. 5.1-71a; βdc(t, t0) thedevelopment of drying creep with time
with:
γ(t0) =1
2 +3.5
p
t0,dj
=1
2.962= 0.33765.1.9.4.3: Eq. 5.1-71b
αƒcm =
√
√
√
35
ƒcm=
√
√
√35
43= 0.90215.1.9.4.3: Eq. 5.1-71d
βh = 1.5 · h + 250 · αƒcm ≤ 1500 · αƒcm5.1.9.4.3: Eq. 5.1-71c
βh = 1.5 · 500 + 250 · 0.9021 = 975.548 ≤ 1352.15
βdc(t, t0) =�
36500 − 28
975.548 + (36500 − 28)
�0.3376
= 0,99115.1.9.4.3: Eq. 5.1-71a
The drying creep coefficient:
ϕbc(t, t0) = 2.1283 · 0.251 · 0.4886 · 0.9911 = 0.2597
The total creep coefficient:
ϕ(t, t0) = ϕbc(t, t0) + ϕdc(t, t0)ϕ(t, t0) = 1.385 + 0.2587 = 1.64
According to Model Code 2010 [16], the creep value is related to thetangent Youngs modulus Ec, where Ec being defined as 1.05 ·Ecm. Toaccount for this, SOFiSTiK adopts this scaling for the computed creepcoefficient (in SOFiSTiK, all computations are consistently based onEcm.
ϕ(t, t0) = 1.64/1.05 = 1.56
302 VERiFiCATiON MANUAL - Design Code Benchmarks | SOFiSTiK 2018

DCE-MC1: Creep and Shrinkage Calculation using the Model Code 2010
36.5 Conclusion
This example shows the calculation of the creep and shrinkage using fib Model Code 2010 [16]. It hasbeen shown that the results are in very good agreement with the reference solution.
36.6 Literature
[16] fib Model Code 2010. fib Model Code for Concrete Structures 2010. International Federation forStructural Concrete (fib). 2010.
SOFiSTiK 2018 | VERiFiCATiON MANUAL - Design Code Benchmarks 303

DCE-MC1: Creep and Shrinkage Calculation using the Model Code 2010
304 VERiFiCATiON MANUAL - Design Code Benchmarks | SOFiSTiK 2018
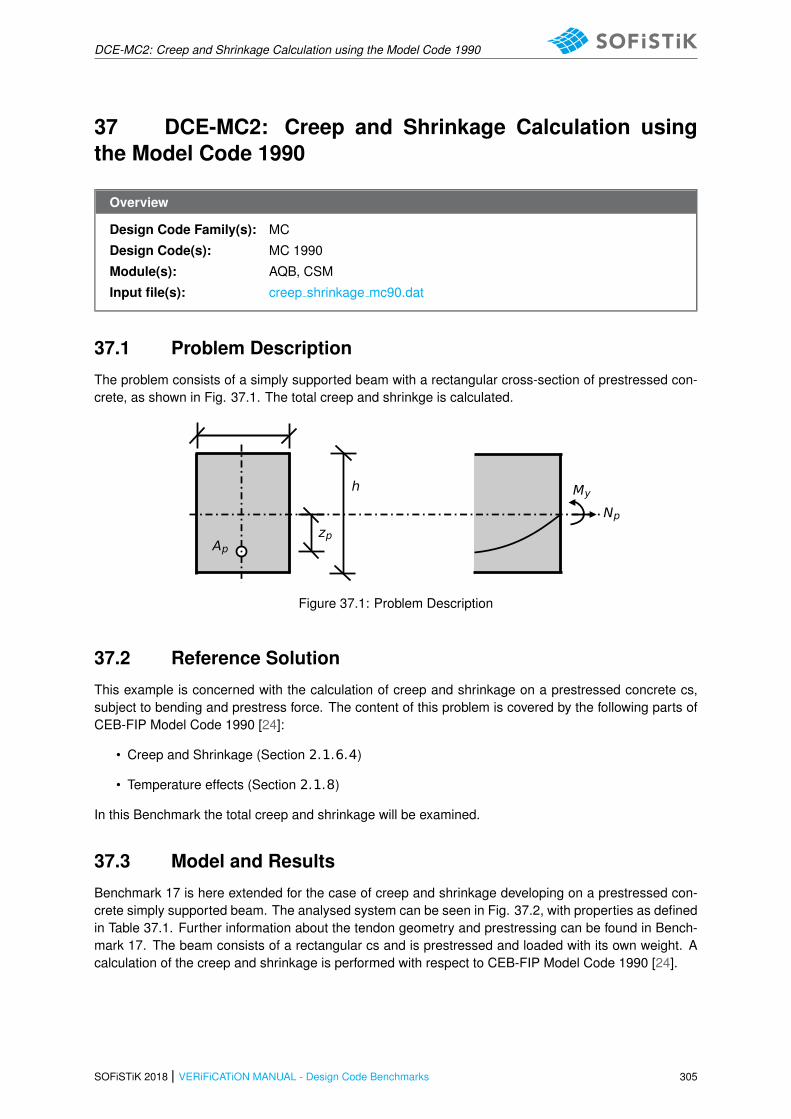
DCE-MC2: Creep and Shrinkage Calculation using the Model Code 1990
37 DCE-MC2: Creep and Shrinkage Calculation usingthe Model Code 1990
Overview
Design Code Family(s): MC
Design Code(s): MC 1990
Module(s): AQB, CSM
Input file(s): creep shrinkage mc90.dat
37.1 Problem Description
The problem consists of a simply supported beam with a rectangular cross-section of prestressed con-crete, as shown in Fig. 37.1. The total creep and shrinkge is calculated.
My
Np
Ap
h
zp
Figure 37.1: Problem Description
37.2 Reference Solution
This example is concerned with the calculation of creep and shrinkage on a prestressed concrete cs,subject to bending and prestress force. The content of this problem is covered by the following parts ofCEB-FIP Model Code 1990 [24]:
• Creep and Shrinkage (Section 2.1.6.4)
• Temperature effects (Section 2.1.8)
In this Benchmark the total creep and shrinkage will be examined.
37.3 Model and Results
Benchmark 17 is here extended for the case of creep and shrinkage developing on a prestressed con-crete simply supported beam. The analysed system can be seen in Fig. 37.2, with properties as definedin Table 37.1. Further information about the tendon geometry and prestressing can be found in Bench-mark 17. The beam consists of a rectangular cs and is prestressed and loaded with its own weight. Acalculation of the creep and shrinkage is performed with respect to CEB-FIP Model Code 1990 [24].
SOFiSTiK 2018 | VERiFiCATiON MANUAL - Design Code Benchmarks 305

DCE-MC2: Creep and Shrinkage Calculation using the Model Code 1990
Table 37.1: Model Properties
Material Properties Geometric Properties Time
C 35/45 h = 100.0 cm t0 = 28 dys
Y 1770 b = 100.0 cm ts = 0 dys
RH = 80 % L = 20.0 m t = 36500 dys
Ap = 28.5 cm2
L
Figure 37.2: Simply Supported Beam
Table 37.2: Results
Result AQB CSM+AQB Ref.
εcs −25.1 · 10−5 25.1 · 10−5 25.146 · 10−5
ϕ0 1.57 - 1.566
ϕ(t, t0) 1.48 1.476 1.47
Note: The results from SOFiSTiK are rounded for output.
306 VERiFiCATiON MANUAL - Design Code Benchmarks | SOFiSTiK 2018
DCE-MC2: Creep and Shrinkage Calculation using the Model Code 1990
37.4 Design Process
Design with respect to CEB-FIP Model Code 1990 [24]
Material:
Concrete: C 35/45 2.1 Concrete classification and constitu-tive relations
Ecm = 35000 N/mm2 2.1.4.2: Modulus of elasticity forC 35/45
ƒck = 35 N/mm2
ƒcm = 43 N/mm2 2.1.3.2: Mean value of compressivestrength ƒcm. See the eq. (2.1-1)
Prestressing Steel: Y 1770 5.3: Prestressing Steel
Ep = 195000 N/mm2 Ep for wires
ƒpk = 1770 N/mm2 ƒpk Characteristic tensile strength ofprestressing steel
CALCULATION OF TOTAL SHRINKAGE AND SWELLING at =10.0 m midspan:
t0 = 28 days t0 age at first loadingts concrete age at the beginning ofshrinkage or swellingt age of concrete at the moment consid-ered
ts = 0 days
t = 36500 days
The total shrinkage or swelling strans εcs(t, ts) may be calculated fromεcs(t, ts) = εcs0 · βs(t − ts) 2.1.6.4.4: Eq. 2.1-74; εcs(t, ts) is the
total or swelling strain
Calculating the notional shrinkage:
The notional shrinkage coefficient may be obtained from
εcs0 = εs(ƒcm) · βRH 2.1.6.4.4: Eq. 2.1-75; εcs0 is the no-tional shrinkage coefficient
with:
εs(ƒcm) =�
160 + 10 · βsc ·�
9 −ƒcm
ƒcm0
��
· 10−6 2.1.6.4.4: Eq.2.1-76; βsc is a coefficientwhich depends on the type of cement,for N class of cement βsc = 5; ƒcm0 =10 MP
εs(ƒcm) =�
160 + 10 · 5 ·�
9 −43
10
��
· 10−6
εs(ƒcm) = 39.5 · 10−5
βRH = −1.55 · βsRH for 40 % ≤ RH < 99 % 2.1.6.4.4: Eq.2.1-77
βsRH = 1 −�
RH
RH0
�3
= 1 −�
80
100
�3
= 0.488 2.1.6.4.4: Eq.2.1-78; RH0 = 100 %
βRH = −1.55 · 0.488 = −0.7564
εcso = 39.5 · 10−5 · (−0.7564) = −29.8778
SOFiSTiK 2018 | VERiFiCATiON MANUAL - Design Code Benchmarks 307
DCE-MC2: Creep and Shrinkage Calculation using the Model Code 1990
The development of shrinkage with time is given by:
βs(t − ts) =�
(t − ts)/ t1350 · (h/h0)2 + (t − ts)/ t1
�0.5
2.1.6.4.4: Eq.2.1-79; βs(t − ts) is thedevelopment of shrinkage with time;h0 = 100 mm; t1 = 1 dy
SOFiSTiK accounts not only for the age at start of drying ts but alsofor the influence of the age of prestressing, so the time developmentfunction reads:
βs = βs(t − ts) − βs(t0 − ts)
βs =�
36500
350 · 52 + 36500
�0.5
−�
28
350 · 52 + 28
�0.5
βs = 0.8981 − 0.05647 = 0.8416
The total shrinkage or swelling strain is calculated:εcs(t, ts) = εcs0 · βsεcs(t, ts) = −29.8778 · 10−5 · 0.8416 = 25.146 · 10−5
CALCULATION OF TOTAL CREEP at x=10.0 m midspan:
The creep coefficient may be calculated from:ϕ(t, t0) = ϕ0 · βc(t − t0)2.1.6.4.3(b): Eq. 2.1-64; ϕ(t, t0) is the
creep coefficient
The notional creep coefficient may be estimated from:ϕ0 = ϕRH · β(ƒcm) · β(t0)2.1.6.4.3(b): Eq. 2.1-65; ϕ0 is the no-
tional creep coefficient
with:
ϕRH = 1 +1 − (RH/RH0)
0.46 · (h/h0)1/3)2.1.6.4.3(b): Eq.2.1-66; h is the notional
size of member in [mm], h =2 · Ac
ϕRH = 1 +1 − (80/100)
0.46 · (500/100)1/3)= 1 +
0.2
0.78658= 1.2542.1.6.4.3(b): Eq. 2.1-66
β(ƒcm) =5.3
(ƒcm/ ƒcm0)0.5=
5.3
(43/10)0.5= 2.5562.1.6.4.3(b): Eq. 2.1-67
The adjusted time t0 is given by:
t0,T =n∑
=1
Δt · ep�
13.65 −4000
273 + T(Δt)/T0
�
2.1.8.2: Eq. 2.1-87; t0,T is the adjustedage of concrete at loading (days)
t0,T =n∑
=1
28 · ep�
13.65 −4000
273 + 20/1
�
= 27.947 days
t0,dj = t0,T ·
9
2 + (t0,T / t1.21,T )+ 1
α
≥ 0.5 dys2.1.6.4.3(c): Eq.2.1-71; the effect oftype of cement on the creep coefficientof concrete may be taken into accountby using the modified age at loadingt0,dj; α = 0 for cement class N
t0,dj = 27.947 ·�
9
2 + 27.9471.2+ 1
�0
= 27.947 ≥ 0.5 dys
β(t0) =1
0.1 + (t0/ t1)0.2=
1
0.1 + (27.947/1)0.2= 0.488622.1.6.4.3(b): Eq. 2.1-68
308 VERiFiCATiON MANUAL - Design Code Benchmarks | SOFiSTiK 2018
DCE-MC2: Creep and Shrinkage Calculation using the Model Code 1990
The development of creep with time is given by:
βc(t − t0) =�
(t − t0)/ t1βh + (t − t0)/ t1
�0.3
2.1.6.4.3(b): Eq. 2.1-70
with:
βH = 150 ·¨
1 +�
1.2 ·RH
RH0
�18«
·h
h0+ 250 ≤ 1500 2.1.6.4.3(b): Eq. 2.1-71; t1 = 1 dy;
RH0 = 100 %; h0 = 100 mm
βH = 150 ·¨
1 +�
1.2 ·80
100
�18«
·500
100+ 250 ≤ 1500
βH = 1359.702 ≤ 1500
βc(t − t0) =�
(36500 − 28)/1
1359.702 + (36500 − 28)/1
�0.3
= 0.989
ϕ0 = 1.254 · 2.556 · 0.48862 = 1.566
The creep coefficient:ϕ(t, t0) = 1.56613 · 0.989 = 1.5489
The creep value is related to the tangent Youngs modulus, where thetangent modulus being defined as 1.05 · Ecm. To account for this,SOFiSTiK adopts this scaling for the computed creep coefficient (inSOFiSTiK, all computations are consistently based on the secant mod-ulus of elasticity).
ϕ(t, t0) =1.5489
1.05= 1.47
SOFiSTiK 2018 | VERiFiCATiON MANUAL - Design Code Benchmarks 309
DCE-MC2: Creep and Shrinkage Calculation using the Model Code 1990
37.5 Conclusion
This example shows the calculation of the creep and shrinkage using Model Code 1990 [24]. It has beenshown that the results are in very good agreement with the reference solution.
37.6 Literature
[24] CEB-FIP Model Code 1990. Model Code for for Concrete Structures 1990. Euro-InternationalConcrete Committee. 1991.
310 VERiFiCATiON MANUAL - Design Code Benchmarks | SOFiSTiK 2018
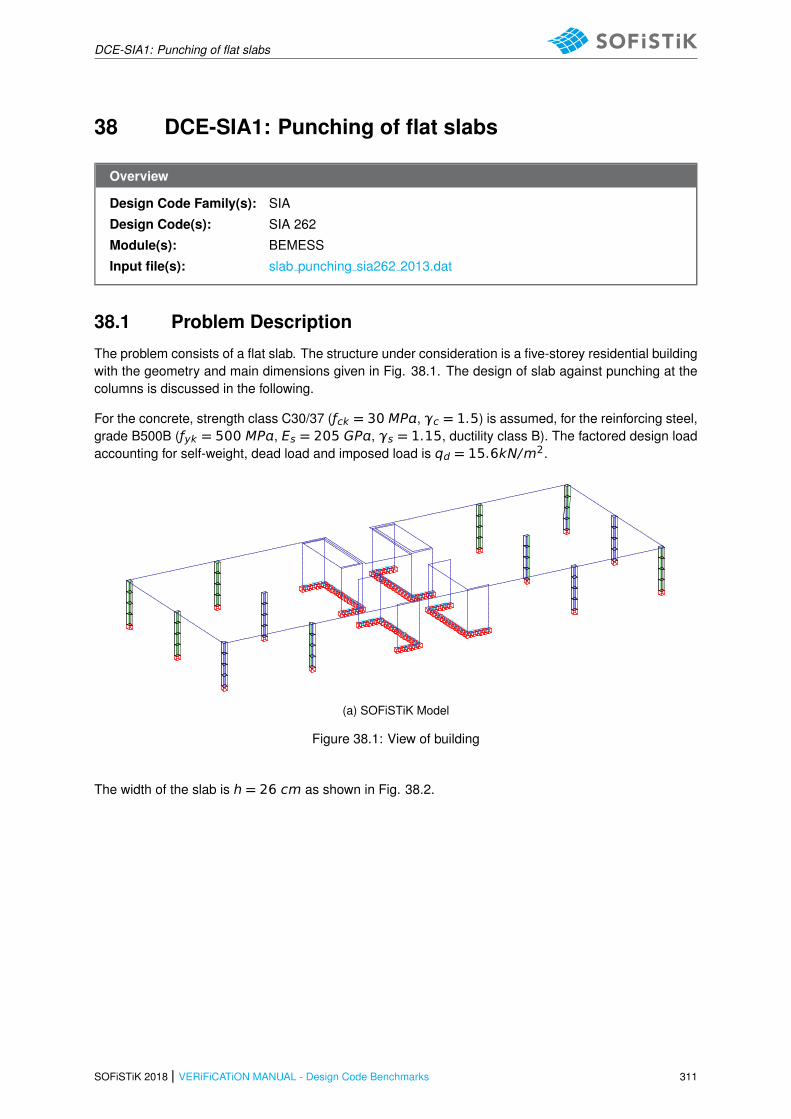
DCE-SIA1: Punching of flat slabs
38 DCE-SIA1: Punching of flat slabs
Overview
Design Code Family(s): SIA
Design Code(s): SIA 262
Module(s): BEMESS
Input file(s): slab punching sia262 2013.dat
38.1 Problem Description
The problem consists of a flat slab. The structure under consideration is a five-storey residential buildingwith the geometry and main dimensions given in Fig. 38.1. The design of slab against punching at thecolumns is discussed in the following.
For the concrete, strength class C30/37 (ƒck = 30 MP, γc = 1.5) is assumed, for the reinforcing steel,grade B500B (ƒyk = 500 MP, Es = 205 GP, γs = 1.15, ductility class B). The factored design loadaccounting for self-weight, dead load and imposed load is qd = 15.6kN/m2.
(a) SOFiSTiK Model
Figure 38.1: View of building
The width of the slab is h = 26 cm as shown in Fig. 38.2.
SOFiSTiK 2018 | VERiFiCATiON MANUAL - Design Code Benchmarks 311
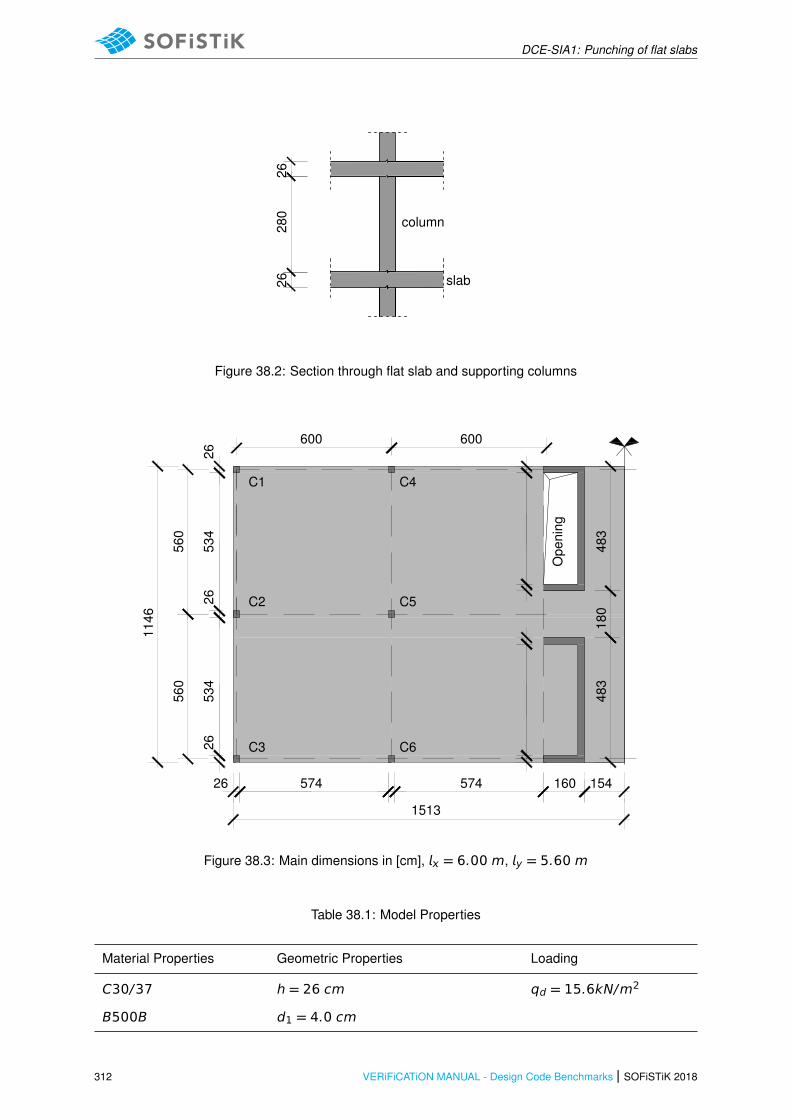
DCE-SIA1: Punching of flat slabs
2,3
80
,3
90
,3
726
280
26slab
column
Figure 38.2: Section through flat slab and supporting columns
2,42
2,42
0,132,87 0,13 2,87 0,8 0,77
7,57
0,13
2,67
0,13
2,67
0,13
2,8
2,8
5,73
3 3
0,13
2,16
0,13
0,9
0,13
2,16
0,13
1513
57426 574 160 154
600 600
534
534
2626
26
560
560
1146
483
483
180
C1
C2
C3
C4
C5
C6
Ope
ning
Figure 38.3: Main dimensions in [cm], = 6.00 m, y = 5.60 m
Table 38.1: Model Properties
Material Properties Geometric Properties Loading
C30/37 h = 26 cm qd = 15.6kN/m2
B500B d1 = 4.0 cm
312 VERiFiCATiON MANUAL - Design Code Benchmarks | SOFiSTiK 2018

DCE-SIA1: Punching of flat slabs
Table 38.1: (continued)
Material Properties Geometric Properties Loading
d = 21.0 cm
38.2 Reference Solution
This example is concerned with the punching of flat slabs. The content of this problem is covered by thefollowing parts of SIA 262:2013 [25]:
• Construction materials (Section 2.2 )
• Dimensoning values (Section 4.2)
• Shear force (Section 4.3.3)
• Punching (Section 4.3.6)
38.3 Model and Results
The goal of the preliminary design is to check if the dimensions of the structure are reasonable withrespect to the punching shear strength and if punching shear reinforcement is needed.
In the reference example the reaction forces are estimated by using contributive areas. The results aregiven in Table 38.2.
Table 38.2: Results
Result SOF. Ref.
Inner column C5 (Node 1070)
1.681 m 1.681 m
ke 0.9 0.9
red 1.5129 m 1.5129 m
ψ 1.31 % 1.325 %
ψy 1.41 % 1.424 %
kr 1.03 1.02786
VRd,c 349.2 kN 347.36 kN
VRdc,m 698.4 kN 694.69 kN
As 8.79 cm2 8.766 cm2
SOFiSTiK 2018 | VERiFiCATiON MANUAL - Design Code Benchmarks 313
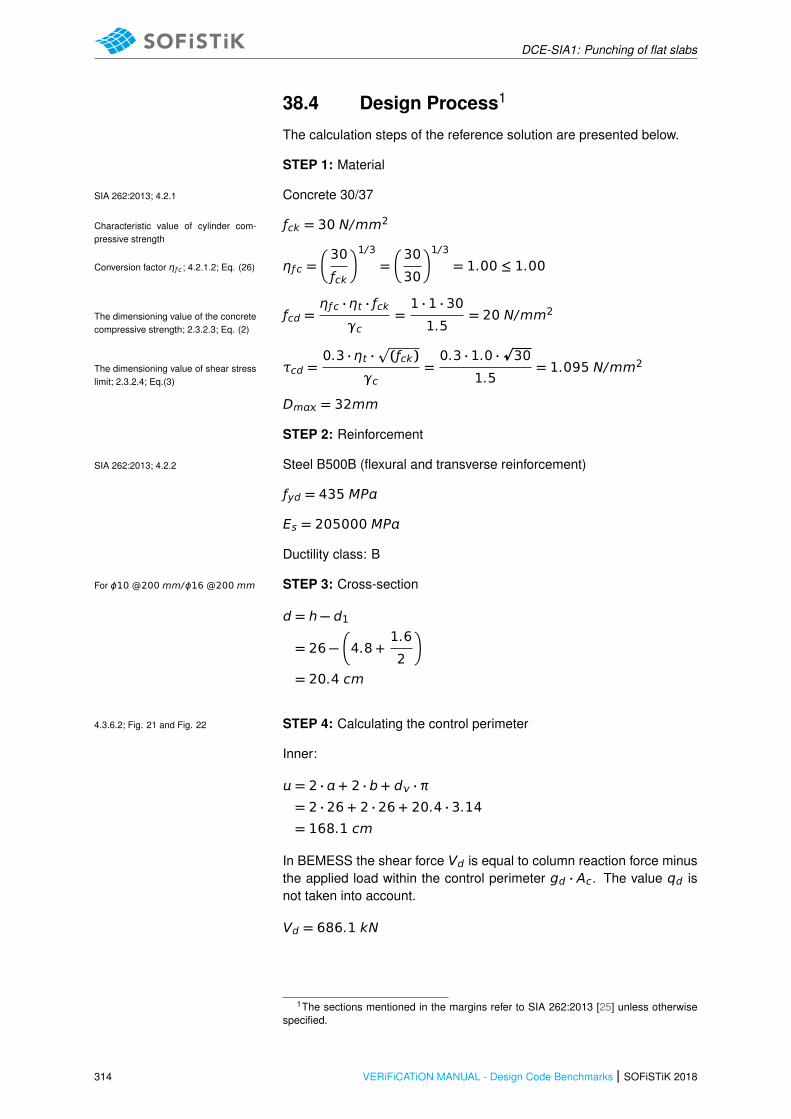
DCE-SIA1: Punching of flat slabs
38.4 Design Process1
The calculation steps of the reference solution are presented below.
STEP 1: Material
Concrete 30/37SIA 262:2013; 4.2.1
ƒck = 30 N/mm2Characteristic value of cylinder com-pressive strength
ηƒ c =�
30
ƒck
�1/3
=�
30
30
�1/3
= 1.00 ≤ 1.00Conversion factor ηƒ c; 4.2.1.2; Eq. (26)
ƒcd =ηƒ c · ηt · ƒck
γc=1 · 1 · 30
1.5= 20 N/mm2The dimensioning value of the concrete
compressive strength; 2.3.2.3; Eq. (2)
τcd =0.3 · ηt ·
p
(ƒck)
γc=0.3 · 1.0 ·
p30
1.5= 1.095 N/mm2The dimensioning value of shear stress
limit; 2.3.2.4; Eq.(3)
Dm = 32mm
STEP 2: Reinforcement
Steel B500B (flexural and transverse reinforcement)SIA 262:2013; 4.2.2
ƒyd = 435 MP
Es = 205000 MP
Ductility class: B
STEP 3: Cross-sectionFor ϕ10 @200 mm/ϕ16 @200 mm
d = h − d1
= 26 −�
4.8 +1.6
2
�
= 20.4 cm
STEP 4: Calculating the control perimeter4.3.6.2; Fig. 21 and Fig. 22
Inner:
= 2 · + 2 · b + d · π= 2 · 26 + 2 · 26 + 20.4 · 3.14= 168.1 cm
In BEMESS the shear force Vd is equal to column reaction force minusthe applied load within the control perimeter gd · Ac. The value qd isnot taken into account.
Vd = 686.1 kN
1The sections mentioned in the margins refer to SIA 262:2013 [25] unless otherwisespecified.
314 VERiFiCATiON MANUAL - Design Code Benchmarks | SOFiSTiK 2018
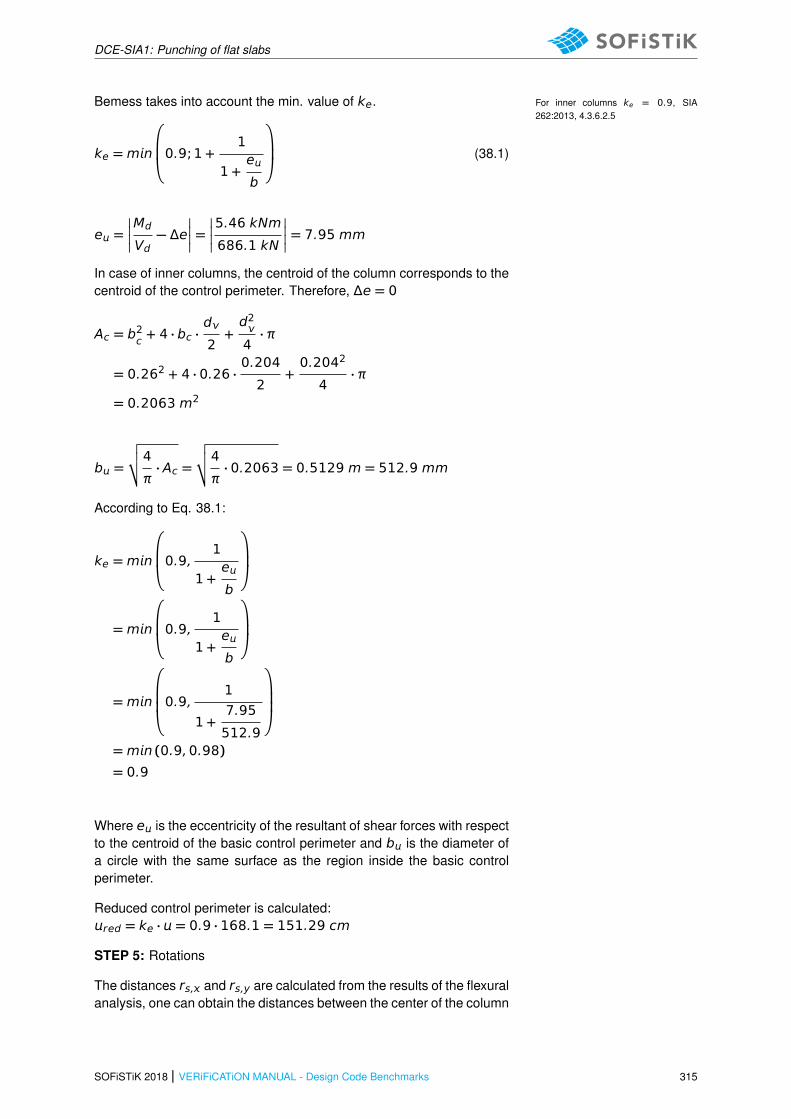
DCE-SIA1: Punching of flat slabs
Bemess takes into account the min. value of ke. For inner columns ke = 0.9, SIA262:2013, 4.3.6.2.5
ke =mn
0.9; 1 +
1
1 +e
b
(38.1)
e =�
�
�
�
Md
Vd− Δe
�
�
�
�
=�
�
�
�
5.46 kNm
686.1 kN
�
�
�
�
= 7.95 mm
In case of inner columns, the centroid of the column corresponds to thecentroid of the control perimeter. Therefore, Δe = 0
Ac = b2c + 4 · bc ·d
2+d2
4· π
= 0.262 + 4 · 0.26 ·0.204
2+0.2042
4· π
= 0.2063 m2
b =
√
√
√4
π· Ac =
√
√
√4
π· 0.2063 = 0.5129 m = 512.9 mm
According to Eq. 38.1:
ke =mn
0.9,
1
1 +e
b
=mn
0.9,
1
1 +e
b
=mn
0.9,1
1 +7.95
512.9
=mn (0.9,0.98)
= 0.9
Where e is the eccentricity of the resultant of shear forces with respectto the centroid of the basic control perimeter and b is the diameter ofa circle with the same surface as the region inside the basic controlperimeter.
Reduced control perimeter is calculated:red = ke · = 0.9 · 168.1 = 151.29 cm
STEP 5: Rotations
The distances rs, and rs,y are calculated from the results of the flexuralanalysis, one can obtain the distances between the center of the column
SOFiSTiK 2018 | VERiFiCATiON MANUAL - Design Code Benchmarks 315

DCE-SIA1: Punching of flat slabs
and the point, at which the bending moments are zero.
rs = 1.166 m
rsy = 1.248 m
The average moment of the strip is calculated by the integration of themoments at the strip section. Since the flexural moments md, andmd,y are negative, the absolute value of the twisting moment md,
needs to be subtracted so that the absolute value of msd, and msd,y
will be maximized:
msd, =md, − |md,y|
msd,y =md,y − |md,y|
By using FEM analysis:
msd, = 105.53 kNm/m
msd,y = 105.81 kNm/m
The representative width is calculated:The representative width bs; 4.3.6.4.6;Eq. (60)
bs = 1.5 ·p
rs · rsy ≤ mn
= 1.5 ·p
1.248 · 1.166= 1.8094 m
BEMESS calculates the ψ value by using LoA (Level of Approximation)III. LoA I is used only at beginning of the calculation for iteration, when:
msd
mRd= 1.
For Level of Approximation III:Rotation ψ; 4.3.6.4.1 and 4.3.6.4.2; Eq.(59)
ψ = 1.2 ·rs
d·ƒsd
Es·�
msd
mRd
�3/2
= 1.2 ·1.166
0.204·434.78
205000·�
105.53
112.306
�3/2
= 1.325 %
ψy = 1.2 ·rsy
d·ƒsd
Es·�
msdy
mRd
�3/2
= 1.2 ·1.248
0.204·434.78
205000·�
105.85
112.306
�3/2
= 1.424 %
The governing value is ψ =m(ψ, ψy) = 1.424 %
The coefficient kr :kr ; 4.3.6.3.2; Eq. (58)
316 VERiFiCATiON MANUAL - Design Code Benchmarks | SOFiSTiK 2018
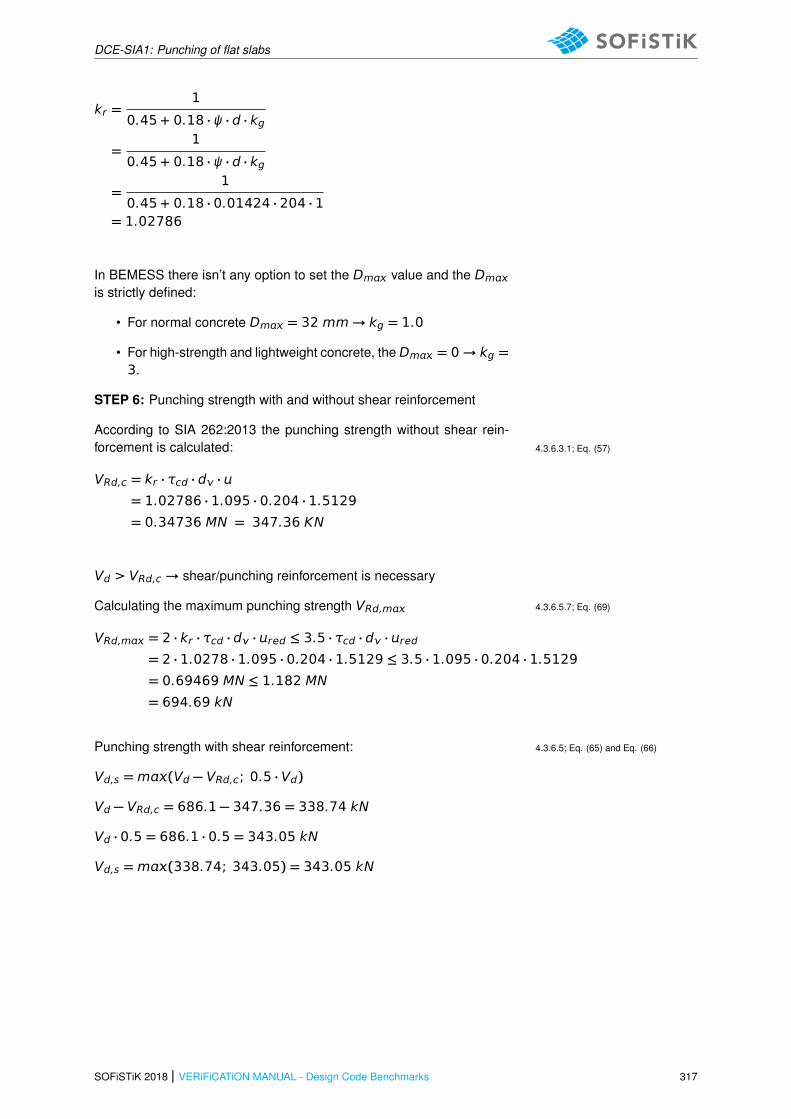
DCE-SIA1: Punching of flat slabs
kr =1
0.45 + 0.18 · ψ · d · kg
=1
0.45 + 0.18 · ψ · d · kg
=1
0.45 + 0.18 · 0.01424 · 204 · 1= 1.02786
In BEMESS there isn’t any option to set the Dm value and the Dm
is strictly defined:
• For normal concrete Dm = 32 mm→ kg = 1.0
• For high-strength and lightweight concrete, the Dm = 0→ kg =3.
STEP 6: Punching strength with and without shear reinforcement
According to SIA 262:2013 the punching strength without shear rein-forcement is calculated: 4.3.6.3.1; Eq. (57)
VRd,c = kr · τcd · d · = 1.02786 · 1.095 · 0.204 · 1.5129= 0.34736 MN = 347.36 KN
Vd > VRd,c → shear/punching reinforcement is necessary
Calculating the maximum punching strength VRd,m 4.3.6.5.7; Eq. (69)
VRd,m = 2 · kr · τcd · d · red ≤ 3.5 · τcd · d · red= 2 · 1.0278 · 1.095 · 0.204 · 1.5129 ≤ 3.5 · 1.095 · 0.204 · 1.5129= 0.69469 MN ≤ 1.182 MN= 694.69 kN
Punching strength with shear reinforcement: 4.3.6.5; Eq. (65) and Eq. (66)
Vd,s =m(Vd − VRd,c; 0.5 · Vd)
Vd − VRd,c = 686.1 − 347.36 = 338.74 kN
Vd · 0.5 = 686.1 · 0.5 = 343.05 kN
Vd,s =m(338.74; 343.05) = 343.05 kN
SOFiSTiK 2018 | VERiFiCATiON MANUAL - Design Code Benchmarks 317
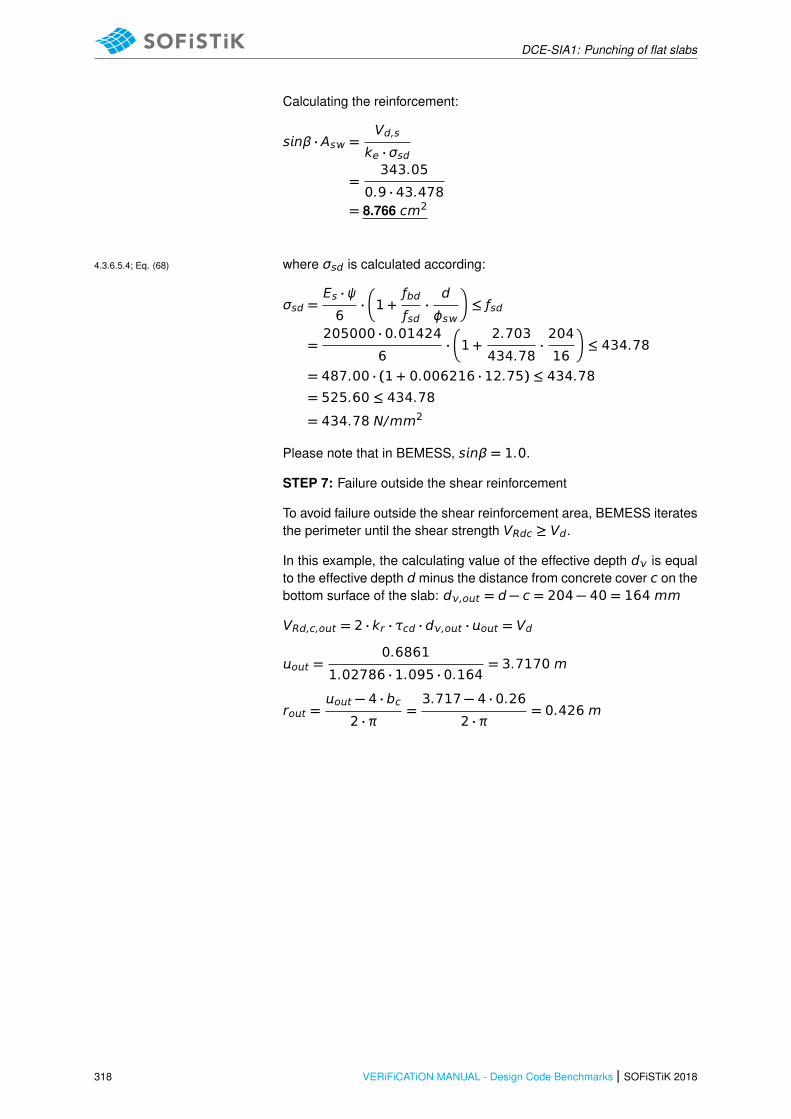
DCE-SIA1: Punching of flat slabs
Calculating the reinforcement:
snβ · As =Vd,s
ke · σsd
=343.05
0.9 · 43.478= 8.766 cm2
where σsd is calculated according:4.3.6.5.4; Eq. (68)
σsd =Es · ψ
6·�
1 +ƒbd
ƒsd·d
ϕs
�
≤ ƒsd
=205000 · 0.01424
6·�
1 +2.703
434.78·204
16
�
≤ 434.78
= 487.00 · (1 + 0.006216 · 12.75) ≤ 434.78= 525.60 ≤ 434.78
= 434.78 N/mm2
Please note that in BEMESS, snβ = 1.0.
STEP 7: Failure outside the shear reinforcement
To avoid failure outside the shear reinforcement area, BEMESS iteratesthe perimeter until the shear strength VRdc ≥ Vd.
In this example, the calculating value of the effective depth d is equalto the effective depth d minus the distance from concrete cover c on thebottom surface of the slab: d,ot = d − c = 204 − 40 = 164 mm
VRd,c,ot = 2 · kr · τcd · d,ot · ot = Vd
ot =0.6861
1.02786 · 1.095 · 0.164= 3.7170 m
rot =ot − 4 · bc
2 · π=3.717 − 4 · 0.26
2 · π= 0.426 m
318 VERiFiCATiON MANUAL - Design Code Benchmarks | SOFiSTiK 2018

DCE-SIA1: Punching of flat slabs
38.5 Conclusion
This example shows the calculation of punching of flat slabs and it has been shown that the results arereproduced with excellent accuracy.
38.6 Literature
[16] fib Model Code 2010. fib Model Code for Concrete Structures 2010. International Federation forStructural Concrete (fib). 2010.
[25] SIA 262:2013 Concrete Structures. Swiss Society of Engineers and Architects. 2013.[26] S. Lips, A. Muttoni, and M.F. Ruiz. “Punching of flat slabs: Design Example”. In: fib Model Code
2010 (2011).[27] A. Muttoni et al. Background to fib Model Code 2010 shear provisions - part II: punching shear.
Tech. rep. fib, 2013.
SOFiSTiK 2018 | VERiFiCATiON MANUAL - Design Code Benchmarks 319


