INF
5150
INF5150 INFUIT 1
Solution to exercises

INF
5150
INF5150 INFUIT 2
Exercise I, 1a) – initiate rule
What is the likelihood of the
threat scenario to the left?
If the vertices t and e are
related by initiate, we have: I.e.:
Servers infected
by malicious code[1 per year]
Malicious
code on computer
spreads via LANEmployee
0.1
Malicious
code on computer
spreads via LAN
[1 per year]

INF
5150
INF5150 INFUIT 3
Exercise I, 1b) – leads-to rule
What is the likelihood of the
threat scenario to the right?
If the vertices e1 and e2 are
related by leads-to, we have: 1 per 1 year × 0.1 = 1 per 10
years
Servers infected
by malicious code[1 per year]
Malicious
code on computer
spreads via LANEmployee
0.1
INF
5150
INF5150 INFUIT 4
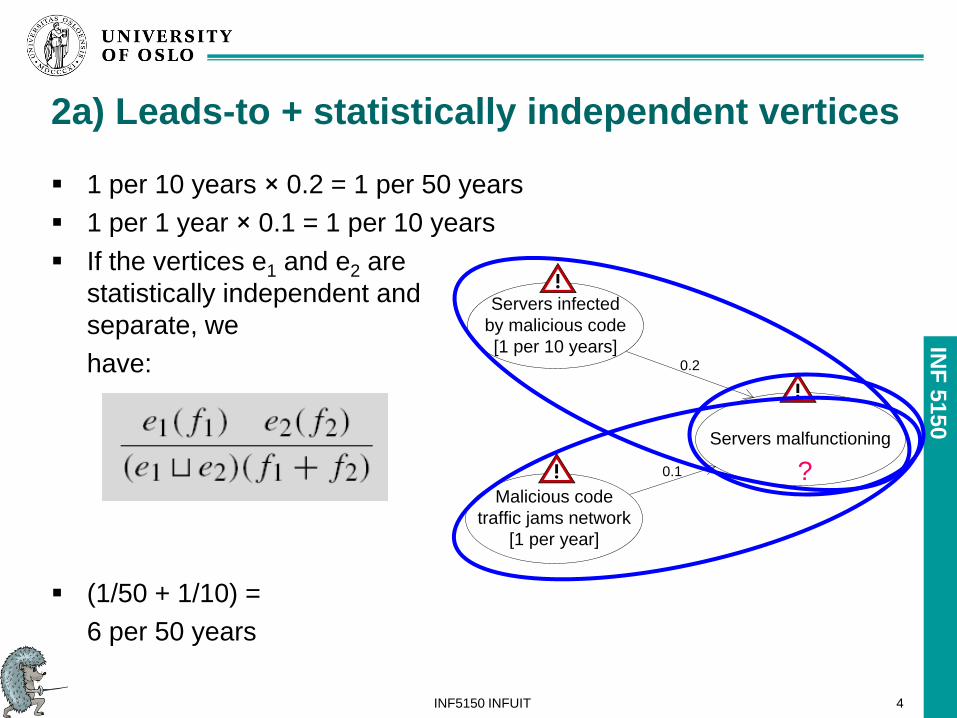
2a) Leads-to + statistically independent vertices
1 per 10 years × 0.2 = 1 per 50 years
1 per 1 year × 0.1 = 1 per 10 years
If the vertices e1 and e2 are
statistically independent and
separate, we
have:
(1/50 + 1/10) =
6 per 50 years
Servers malfunctioning
Servers infected
by malicious code
[1 per 10 years]
0.1
0.2
Malicious code
traffic jams network
[1 per year]
?

INF
5150
INF5150 INFUIT 5
2b) Leads-to + mutually exclusive vertices
If the vertices e1 and e2 are
mutually exclusive, we have:
1 or 5 per 50 years;
alternatively between 1 and 5
per 50 years
Servers malfunctioning
Servers infected
by malicious code
[1 per 10 years]
0.1
0.2
Malicious code
traffic jams network
[1 per year]
?

INF
5150
INF5150 INFUIT 6
2c) Consistency check
Both 6 per 50 years and 5 per 50 years are higher values
than 1 per 20 years
The diagram is inconsistent
Servers malfunctioning
[1 per 20 years]
Servers infected
by malicious code
[1 per 10 years]
0.1
0.2
Malicious code
traffic jams network
[1 per year]

INF
5150
INF5150 INFUIT 7
Exercise II – computing likelihood intervals
Scale Value
1 Rarely <= 1 per 10 years
2 Seldom > 1 per 10 years & <= 1 per 5 years
3 Sometimes > 1 per 5 years & <= 1 per 1 year
4 Often > 1 per 1 year

INF
5150
INF5150 INFUIT 8
Exercise I, 1a) – initiate rule
What is the likelihood of the
threat scenario to the left?
If the vertices t and e are
related by initiate, we have: I.e.:
Servers infected
by malicious code[sometimes]
Malicious
code on computer
spreads via LANEmployee
0.1
Malicious
code on computer
spreads via LAN
[sometimes]
INF
5150
INF5150 INFUIT 9
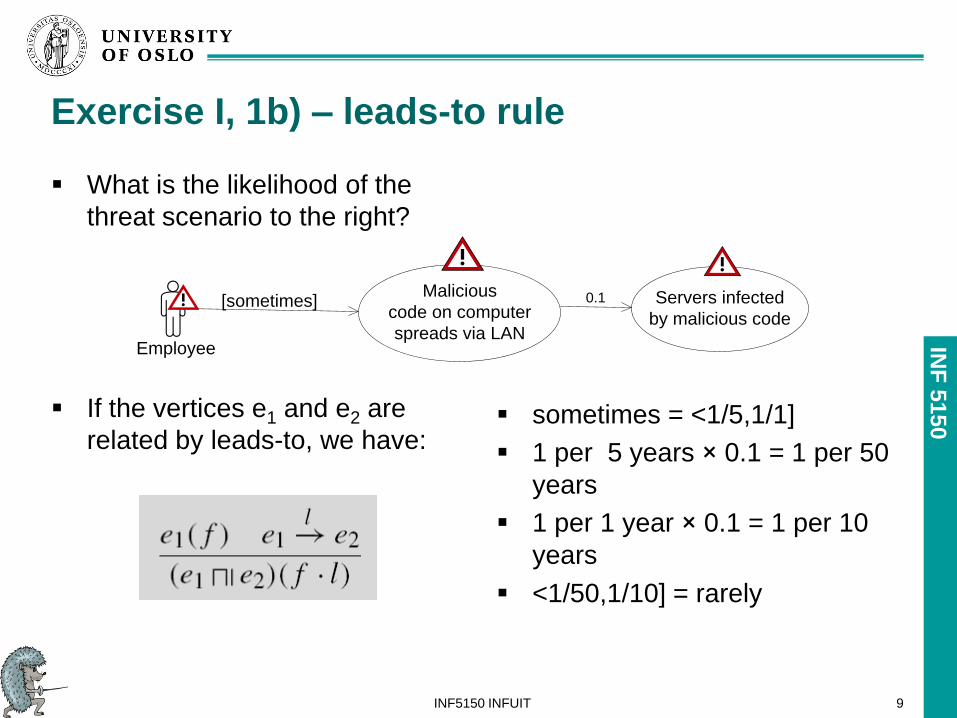
Exercise I, 1b) – leads-to rule
What is the likelihood of the
threat scenario to the right?
If the vertices e1 and e2 are
related by leads-to, we have: sometimes = <1/5,1/1]
1 per 5 years × 0.1 = 1 per 50
years
1 per 1 year × 0.1 = 1 per 10
years
<1/50,1/10] = rarely
Servers infected
by malicious code[sometimes]
Malicious
code on computer
spreads via LANEmployee
0.1

INF
5150
INF5150 INFUIT 10
2a) Leads-to + statistical independence
[0,1/10] × 0.2 = [0,1/50]
<1/5,1/1] × 0.1 = <1/50,1/10]
If the vertices e1 and e2 are
statistically independent and
separate, we have:
([0,1/50] + <1/50,1/10] ) =
<1/50,6/50]
1.2 per 10 years ∈ seldom
we interpret this as seldom
Servers malfunctioning
Servers infected
by malicious code
[rarely]
0.1
0.2
Malicious code
traffic jams network
[sometimes]

INF
5150
INF5150 INFUIT 11
2b) Leads-to + mutually exclusive vertices
If the vertices e1 and e2 are
mutually exclusive, we have:
rarely multiplied with 0.2 gives
rarely
sometimes multiplied with 0.2
gives rarely
In which case, we may deduce
rarely
?
Servers malfunctioning
Servers infected
by malicious code
[rarely]
0.1
0.2
Malicious code
traffic jams network
[sometimes]

INF
5150
INF5150 INFUIT 12
2c) Consistency check
seldom > rarely
The diagram is inconsistent wrt 2a)
Servers malfunctioning
[rarely]
Servers infected
by malicious code
[rarely]
0.1
0.2
Malicious code
traffic jams network
[sometimes]

INF
5150
INF5150 INFUIT 13
3a) Consistency check
0.5
Internal
infrastructure
Virus attack
Shared infrastructure
resources
Low
robustness
External
resource failure
U2: Unauthorized
modification of
users’ personal
information
[seldom]
1.0
U4: Unavailability
of service due to
infrastructure
failure
[sometimes]
1.0
0.2
External
resources
Internal hardware
or software failure U5: Unavailability
of service due to
malicious code
[seldom]0.2
High traffic on the
service may cause the
server to crash
[sometimes]
All active user
sessions are deleted
leaving the information
partly incorrect
Users’ personal
information
Availability of
service
moderate
major
moderate
External sources of
information fails or
malfunctions
[sometimes]
Internal parts of
the service fails or
malfunctions
[seldom]
INF
5150
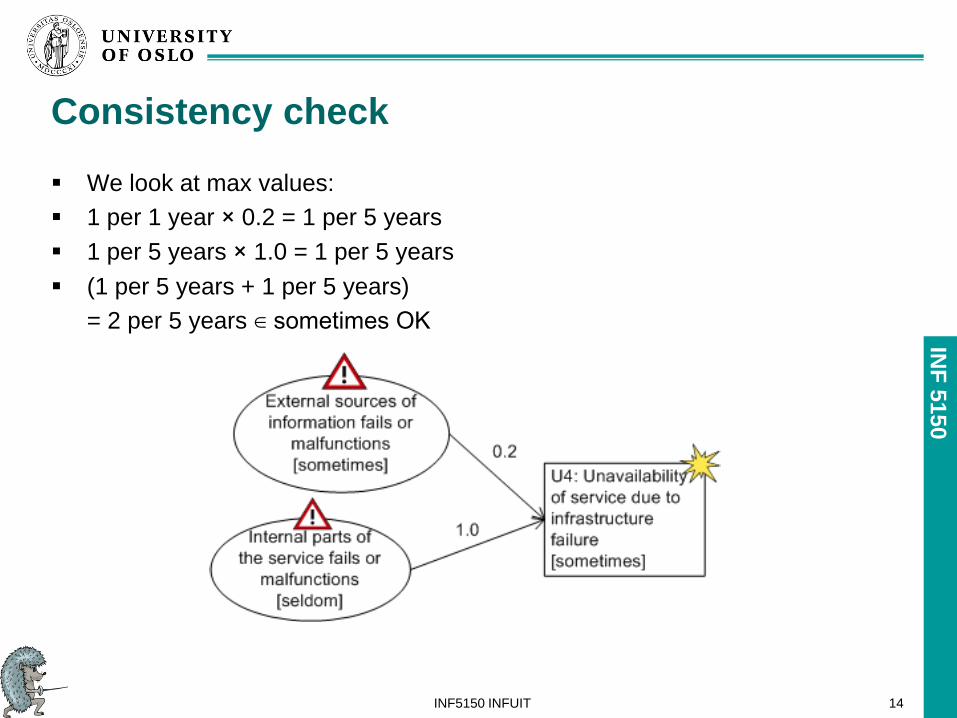
Consistency check
We look at max values:
1 per 1 year × 0.2 = 1 per 5 years
1 per 5 years × 1.0 = 1 per 5 years
(1 per 5 years + 1 per 5 years)
= 2 per 5 years ∈ sometimes OK
INF5150 INFUIT 14

INF
5150
Consistency check
1 per 1 year × 0.2 = 1 per 5 years ∈ seldom OK
1 per 1 year × 0.5 = 1 per 2 years × 1.0 = 1 per 2 years ∉
seldom Not OK
INF5150 INFUIT 15

INF
5150
Exercise III – associativity
Statistical independence, separate events and
frequencies: Associativity follows trivially since + is
associative
INF5150 INFUIT 16

INF
5150
Exercise III - associativity
Statistical independence and probabilities
Again we have associativity. We get the same expression
using the above rule twice independent of where we put
the brackets
INF5150 INFUIT 17

INF
5150
Exercise III - associativity
Mutual exclusion and frequencies: Associativity follows
trivially if all events have the same frequency
If they have different frequencies f_1, f_2, f_3 we get
– f_1 or f_2 or f_3
independent of where we put the brackets; hence, we
also have associativity in the general case
INF5150 INFUIT 18

INF
5150
Exercise III - associativity
Mutual exclusion and probabilities: Associativity follows
trivially since + is associative
INF5150 INFUIT 19


