SOME ASPECTS OF STRUCTURAL EUROCODES IN
EARTHQUAKE RESISTANT DESIGN FOR BUILDINGS
(Performance-based seismic design)
Mehmed Čaušević
University of Rijeka, Faculty of Civil Engineering,
R. Matejčić 3, 51000 Rijeka, Croatia
Keywords: Nonlinear response-history analysis, non-linear static methods, pushover
analysis, Eurocode 8, real time-history records, artificial records, the N2 method, the
extended N2 static method, NSP coefficient method, CSM capacity spectrum method
Abstract: Several procedures for non-linear static and dynamic analysis of structures have
been developed in recent years. This paper discusses those procedures that have been
implemented into the latest European and U.S. seismic provisions: the non-linear dynamic
response-history analysis; the N2 non-linear static pushover method (Eurocode 8); the non-
linear static procedure NSP (FEMA 356) and improved capacity spectrum method CSM
(FEMA 440). The presented methods differ in respect to accuracy, simplicity, transparency
and clarity of theoretical background. Non-linear static procedures were developed with
the aim of overcoming the insufficiency and the limitations of linear methods, whilst at the
same time maintaining a relative simple application. All procedures incorporate
performance-based concepts paying more attention to damage control. Application of the
presented procedures is illustrated by means of an example of an eight-storey reinforced
concrete frame building. The results obtained by non-linear dynamic response-history
analysis and non-linear static procedures are compared. It is concluded that these non-
linear static procedures are sustainable for application. At the end the extended non-linear
static methods are discussed in cases when the influence of higher modes cannot be
neglected.
1. INTRODUCTION
In the past several years, new methods of seismic analysis containing performance based
engineering concepts have been more frequently applied in order to pay greater attention to
damage control. For obtaining seismic actions more realistically the displacement-based
approach has proven itself as a much better choice than the traditional force-based
approach. The most precise description of the problem is by far the non-linear dynamic
seismic analysis, made by applying time-history records which, in the long term, represents
the correct development path. Yet, due to its complexity and high standards it goes beyond
the frames of practical application and is appropriate only for the research and analysis of
structures of special significance.
Between the linear methods and non-linear dynamic analysis, a non-linear static approach
based on pushover analysis is being imposed as a link and the most economical solution at
the moment. Thus, in recent years, the N2 method [1, 2, 3, 4, 5] has entered European
regulations. The U.S. ATC 40 [6] has analysed the Capacity Spectrum Method. Its newest
improved version is shown in FEMA 440 [7]. The coefficient method, that is the NSP
(Non-linear Static Procedure), was introduced to FEMA 274 [8] and the newer improved
version is shown in FEMA 356 [9].
This paper presents the non-linear static methods which are an integral part of
contemporary European and U.S. regulations. These methods include the dynamic analysis
of an equivalent single degree of freedom (SDOF) model. All the methods were presented
using the example of the reinforced concrete frame structure (Figure 1) and the obtained
results were compared to the "accurate" results reached by a non-linear response-history
analysis. The analysed methods differ in simplicity of the application, and transparency and
clarity of theoretical base, as well as the accuracy of the results. In each method, the
determination of the targeted displacement is based on explicitly or implicitly defined
equivalent SDOF model.
The pushover analysis is here performed in a way that the structure is subjected to
monotonously rising lateral load which represents the inertia forces which occur as a result
of ground acceleration. By gradual increase of lateral load, a progressive yielding of
structural elements occur which results in reduction of stiffness of structure. The pushover
analysis provides a characteristic non-linear curve of force-displacement relation and is
most frequently presented as a relation of the total base shear V and the top displacement
Dt. This kind of presentation simultaneously provides data about load-bearing capacity,
ductility and stiffness of the structure.
An important step in implementing the pushover analysis is determination of the
appropriate distribution of the lateral load. The base assumption of the pushover analysis is
the invariable form of displacement through time, which is true for a linear response.
However, in a non-linear field, the displacement form in reality is changing according to
the dynamic characteristics change of the structure due to stiffness degradation, i. e. the
formation of the plastic hinges.
2. DESCRIPTION OF THE BUILDING AND THE LOADING
Application of all non-linear static and dynamic procedures is here illustrated by means of
an example of an eight-storey reinforced concrete frame building. The structure has eight
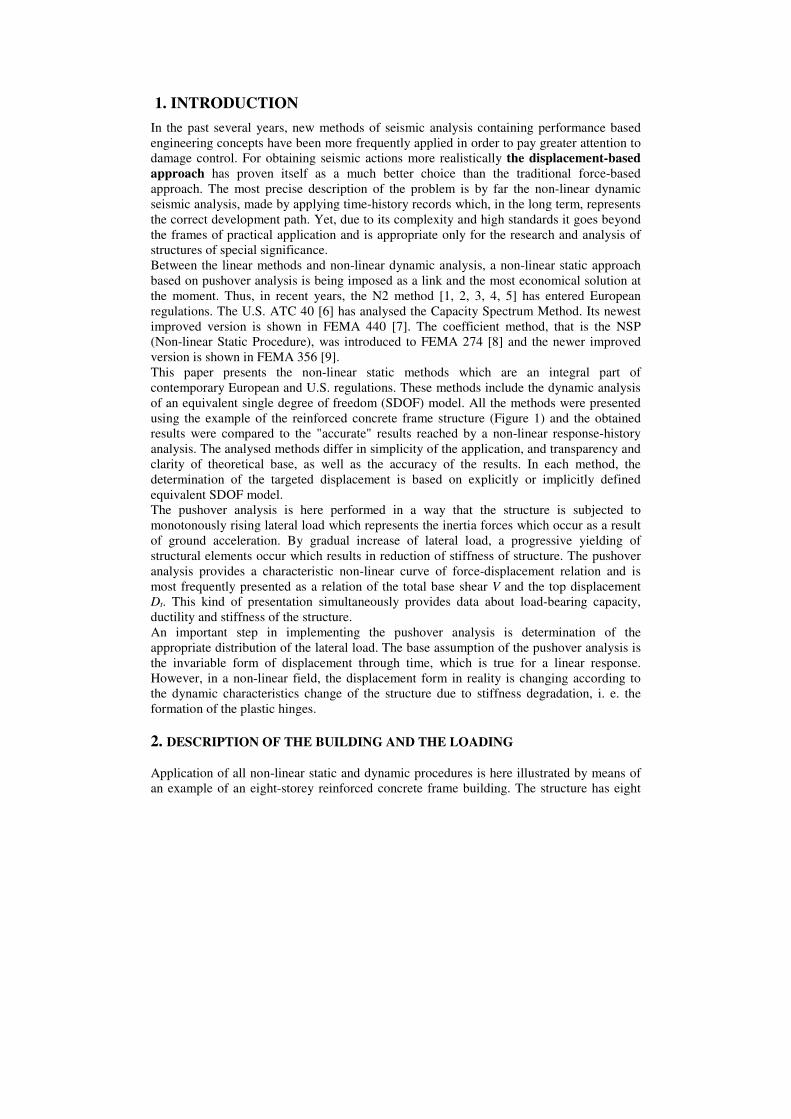
stores, the first two of which are 5.00m high and the other 3.10m (Figure 1). The dimension
of all columns is 60x60cm and of the beam 40x60cm (Figure 2). The plate is 20cm thick.
The concrete is of C25/30 class and the steel reinforcement is B500. Storey frame masses
for 3.10m high storeys are 66.96t and storey masses for 5.00m high storeys are 73.80t
which results in the mass total of 549.36t.
The structure was designed according to the European standard EN 1998-1:2004 [1] with
the following parameters: ground type B, importance class II (γI = 1), Type 1 elastic
response spectra (the expected surface-wave magnitude Ms larger than 5.5) and viscous
damping ratio (in percent) ξ = 5%. The analysis will be performed for the reference peak
ground acceleration agR = 0.3g. A behaviour factor of 5.85 was taken into account for the
DCH structures.
(a) (b)
Figure 1: (a) Building of garage of the Tower Centre, Rijeka, Croatia; (b) Cross-section of
the garage structure
Figure 2: Cross-sections of columns and beams with steel reinforcement
Since the structure meets the regularity requirements by its plan view and by its height [1,
15], the analysis was made on one plane frame. Due to symmetry only one direction of
seismic action was analysed.
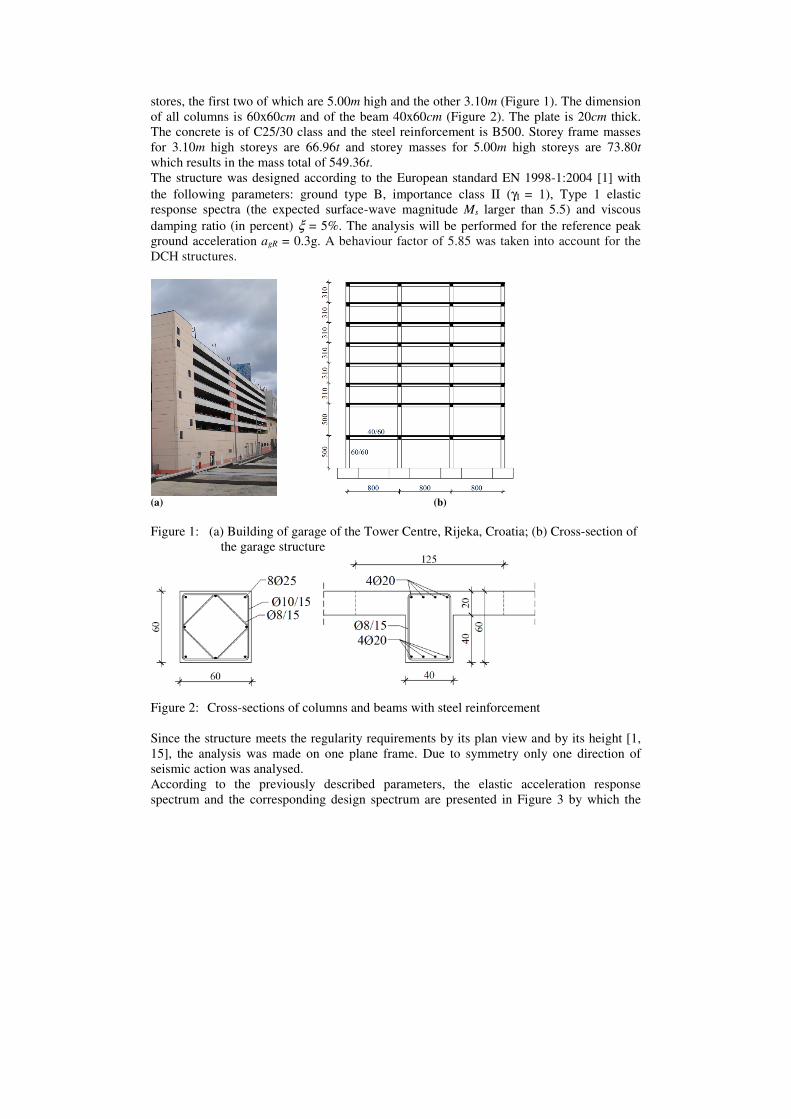
According to the previously described parameters, the elastic acceleration response
spectrum and the corresponding design spectrum are presented in Figure 3 by which the
seismic demand was defined. It can be noted that the structure has a fundamental period of
1s in the spectrum field with constant velocities (TC < T1 < TD).
Figure 3: Elastic acceleration response spectrum with 5% viscous damping ratio for peak
ground acceleration of 0.3g, ground type B and corresponding design spectrum
for behaviour factor 5.85
3. NON-LINEAR RESPONSE-HISTORY ANALYSIS
In order to evaluate the results obtained by non-linear static methods, time-history analysis
was conducted firstly by using a total of 14 time-history records, seven of which were
artificial, and the remaining seven as authentic. The artificial time-history records were
used for obtaining the mean value of structural response which corresponds to the specified
seismic demand, while the real records were used for access to response variability.
Processing of artificial and real time-history records was performed by using the
SeismoSignal program [11] while the pushover and time-history analyses were performed
by using the SeismoStruct program [10].
Seven artificial time-history records for this example were generated by the program
SIMQKE_GR (SIMulation of earthQuaKE GRound motions – Massachusetts Institute of
Technology) [12] for peak ground acceleration of 0.3g and soil class B with a 5% viscous
damping ratio. The earthquake duration was set on 20s. The acceleration value for zero
period was set on S·ag. In the field around the ground period there is no value of elastic
spectrum which is calculated from all time-history records, which is less than 90% of the
corresponding value of the elastic spectrum response (Figure 4). The field around the
fundamental period is usually defined within the limits 0.2T1 (thus taking into consideration
higher oscillation modes) and 2T1 (thus taking into consideration the structural stiffness
degradation due to earthquake and increase of the fundamental period as a consequence).
The real time-history records were taken from the libraries National Information Service for
Earthquake Engineering, Berkeley, California [13] and The Canadian Association for
Earthquake Engineering (CAEE) [14].
All the selected time-history records were registered on the soil class A or B. The ratio of
the maximum velocity to maximum acceleration (vmax/amax) for all the selected records lies
within the interval from 83 to 125, which corresponds to earthquakes of medium intensity.
The following records (Figure 5) were selected:
• Imperial Valley, California, USA (May 18th, 1940, El Centro),
• Ulcinj, Montenegro (April 15th, 1979, Hotel Albatros, Ulcinj),
• Mexico City, Mexico (September 19th, 1985, La Villita, Guerrero Array),
• Kocaeli, Turkey (August 17th, 1999, Sakaria),
• San Fernando, California, USA (February 9th 1971, 3838 Lankershim Blvd.,
L.A.),
• Honshu, close to the east coast, Japan (August 2nd, 1971, Kushiro Central Wharf),
• Kern County, California, USA (July 21st, 1951, Taft Lincoln School Tunnel).
(a) (b)
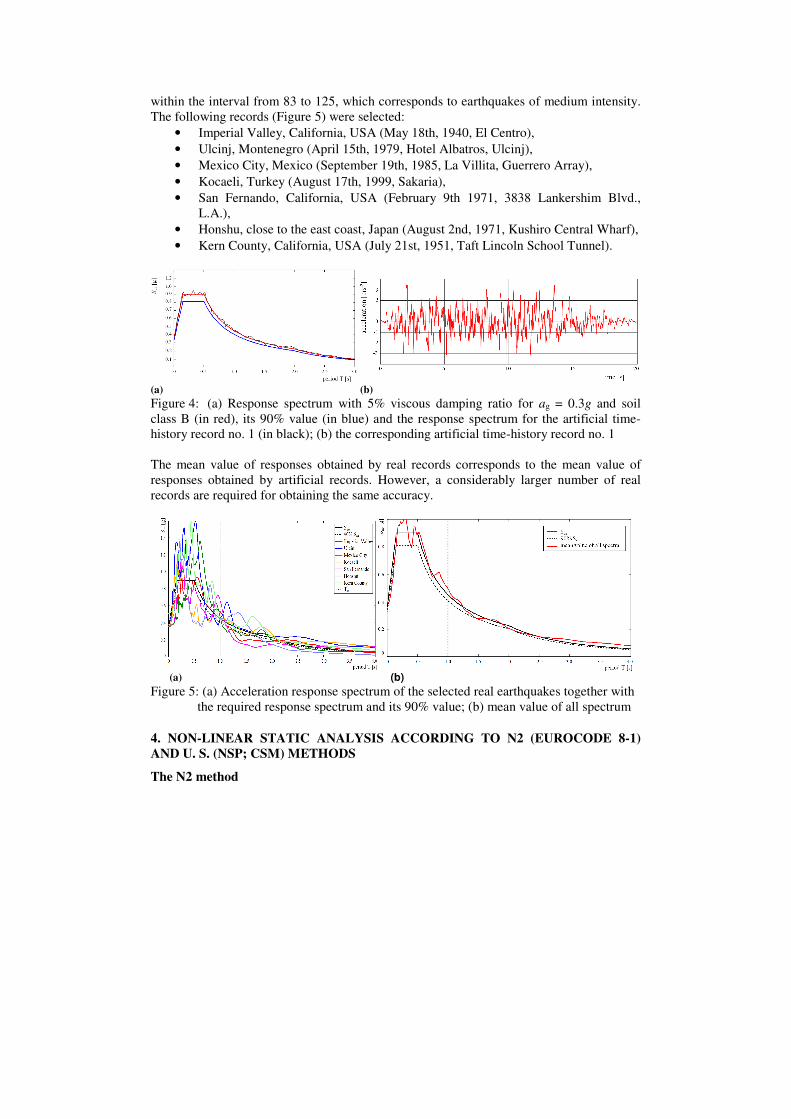
Figure 4: (a) Response spectrum with 5% viscous damping ratio for ag = 0.3g and soil
class B (in red), its 90% value (in blue) and the response spectrum for the artificial time-
history record no. 1 (in black); (b) the corresponding artificial time-history record no. 1
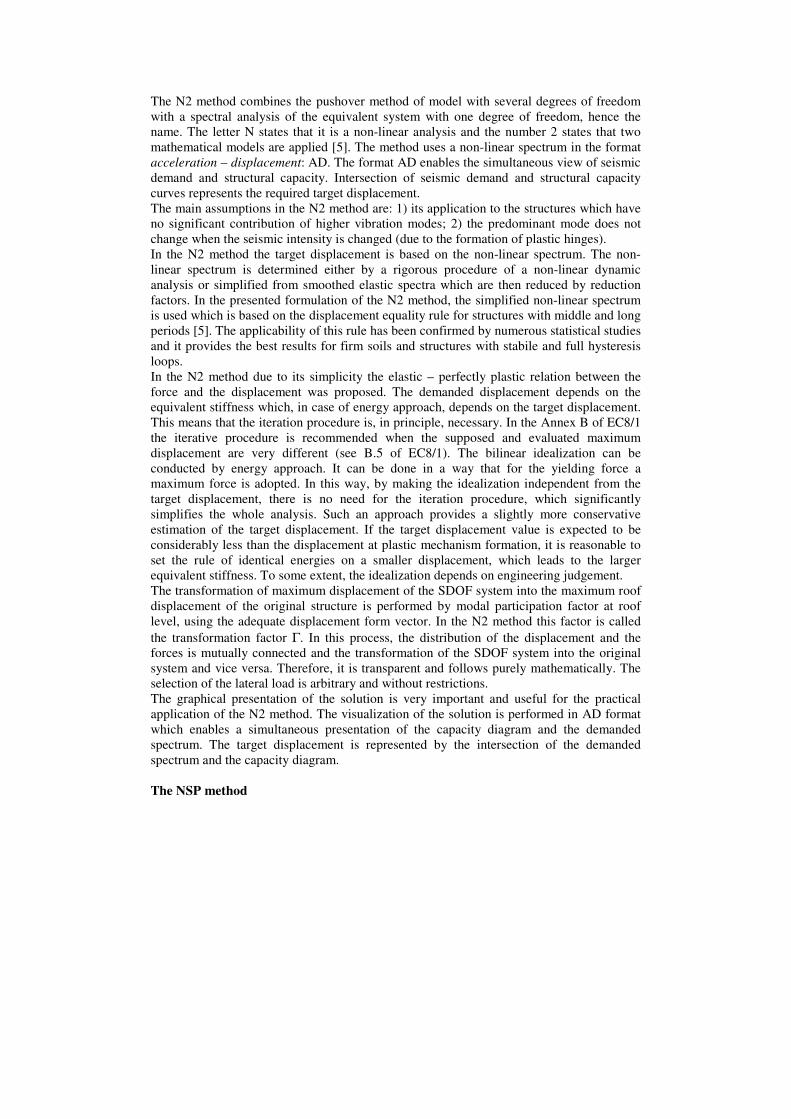
The mean value of responses obtained by real records corresponds to the mean value of
responses obtained by artificial records. However, a considerably larger number of real
records are required for obtaining the same accuracy.
(a) (b)
Figure 5: (a) Acceleration response spectrum of the selected real earthquakes together with
the required response spectrum and its 90% value; (b) mean value of all spectrum
4. NON-LINEAR STATIC ANALYSIS ACCORDING TO N2 (EUROCODE 8-1)
AND U. S. (NSP; CSM) METHODS
The N2 method
The N2 method combines the pushover method of model with several degrees of freedom
with a spectral analysis of the equivalent system with one degree of freedom, hence the
name. The letter N states that it is a non-linear analysis and the number 2 states that two
mathematical models are applied [5]. The method uses a non-linear spectrum in the format
acceleration – displacement: AD. The format AD enables the simultaneous view of seismic
demand and structural capacity. Intersection of seismic demand and structural capacity
curves represents the required target displacement.
The main assumptions in the N2 method are: 1) its application to the structures which have
no significant contribution of higher vibration modes; 2) the predominant mode does not
change when the seismic intensity is changed (due to the formation of plastic hinges).
In the N2 method the target displacement is based on the non-linear spectrum. The non-
linear spectrum is determined either by a rigorous procedure of a non-linear dynamic
analysis or simplified from smoothed elastic spectra which are then reduced by reduction
factors. In the presented formulation of the N2 method, the simplified non-linear spectrum
is used which is based on the displacement equality rule for structures with middle and long
periods [5]. The applicability of this rule has been confirmed by numerous statistical studies
and it provides the best results for firm soils and structures with stabile and full hysteresis
loops.
In the N2 method due to its simplicity the elastic – perfectly plastic relation between the
force and the displacement was proposed. The demanded displacement depends on the
equivalent stiffness which, in case of energy approach, depends on the target displacement.
This means that the iteration procedure is, in principle, necessary. In the Annex B of EC8/1
the iterative procedure is recommended when the supposed and evaluated maximum
displacement are very different (see B.5 of EC8/1). The bilinear idealization can be
conducted by energy approach. It can be done in a way that for the yielding force a
maximum force is adopted. In this way, by making the idealization independent from the
target displacement, there is no need for the iteration procedure, which significantly
simplifies the whole analysis. Such an approach provides a slightly more conservative
estimation of the target displacement. If the target displacement value is expected to be
considerably less than the displacement at plastic mechanism formation, it is reasonable to
set the rule of identical energies on a smaller displacement, which leads to the larger
equivalent stiffness. To some extent, the idealization depends on engineering judgement.
The transformation of maximum displacement of the SDOF system into the maximum roof
displacement of the original structure is performed by modal participation factor at roof
level, using the adequate displacement form vector. In the N2 method this factor is called
the transformation factor Γ. In this process, the distribution of the displacement and the
forces is mutually connected and the transformation of the SDOF system into the original
system and vice versa. Therefore, it is transparent and follows purely mathematically. The
selection of the lateral load is arbitrary and without restrictions.
The graphical presentation of the solution is very important and useful for the practical
application of the N2 method. The visualization of the solution is performed in AD format
which enables a simultaneous presentation of the capacity diagram and the demanded
spectrum. The target displacement is represented by the intersection of the demanded
spectrum and the capacity diagram.
The NSP method
The non-linear spectrum used in this method is identical to the non-linear spectrum used in
the N2 method. The idealization of pushover curve is required. It depends on the target
displacement, which makes the procedure iterative. The pushover curve is idealized by a
bilinear relation in which the value of stiffness, after having reached the yielding point,
generally differs from zero. The positive value of stiffness after yielding point (α > 0) has
no influence on the target displacement. The effective stiffness is assumed to be identical to
the secant stiffness which is determined by the shear force in the value of 60% of the force
at the yielding limit.
The coefficient C0, which connects the maximum displacement of the SDOF system and
the maximum roof displacement of the original structure, is defined in the same way as
transformation factor Γ in the N2 method. However, the transformation of the SDOF
system into the original system is theoretically inconsistent due to the allowed partial or
complete independence of displacement and force forms. In this process the transparency
and clarity are lost, yet no significant influence on accuracy occurs.
There is no possibility of a graphical presentation.
The CSM method The capacity spectrum method uses the equivalent linear spectrum which is determined by
the equivalent damping. The pseudo acceleration spectrum which determines the seismic
demand is practically the same as the spectrum of the total acceleration for lower values of
the damping. However, by increasing the damping the difference between the pseudo
acceleration and the total acceleration increases on the side of insecurity. The error
increases also with an increase of the fundamental period. It should be pointed out, as well
as the theoretical basis for the equivalent linearization, the advantage of the non-linear
spectra used in other two methods is obvious.
A bilinear idealization of pushover curve is required. The value of the effective damping
ration depends on ductility and stiffness after the yielding. In this method, the idealization
also depends on the target displacement so the iteration procedure is required. The
transformation of the SDOF system into the original system is identical to the one in N2
method. The graphical presentation is made in AD format. Both presented procedures for
determining the target displacement can be graphically presented.
5. COMPARISON OF PRESENTED METHODS
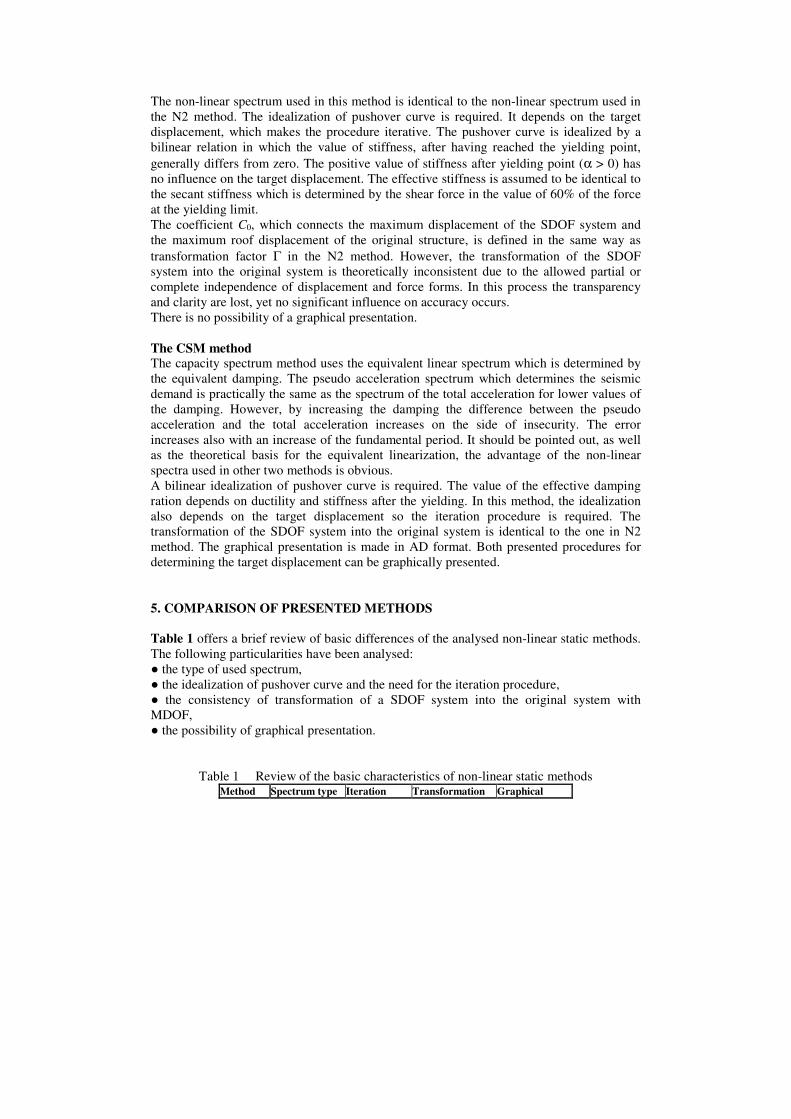
Table 1 offers a brief review of basic differences of the analysed non-linear static methods.
The following particularities have been analysed:
● the type of used spectrum,
● the idealization of pushover curve and the need for the iteration procedure,
● the consistency of transformation of a SDOF system into the original system with
MDOF,
● the possibility of graphical presentation.
Table 1 Review of the basic characteristics of non-linear static methods Method Spectrum type Iteration Transformation Graphical
requirement consistency SDOF→→→→MDOF
presentation
N2 Non-linear no yes yes
NSP Equiv. linear yes no no
CSM Non-linear no no yes
According to all the stated facts, it can be concluded that the N2 method and the NSP
coefficient method are basically very similar and provide the same results if the starting
assumptions are identical. In the NSP coefficient method there are two additional
coefficients which influence the value of the target displacement and which are not
included into other two methods (N2 and CSM): the coefficient C2 which represents the
effects of stiffness degradation and strength for maximum structure displacements and the
coefficient C3 which represents the displacement increase due to the dynamic P-Δ effect.
Their influence can easily be included into two other methods (N2 and NSP) in a way that
the target displacement is multiplied by the corresponding modification factor.
Neither of the analysed methods takes into consideration the accumulation of the damage
which can be significant for long duration earthquakes. The inclusion of this effect into the
existing methods can be made by increasing the seismic demand or by introducing the
equivalent ductility factor which will reduce the deformation capacity.
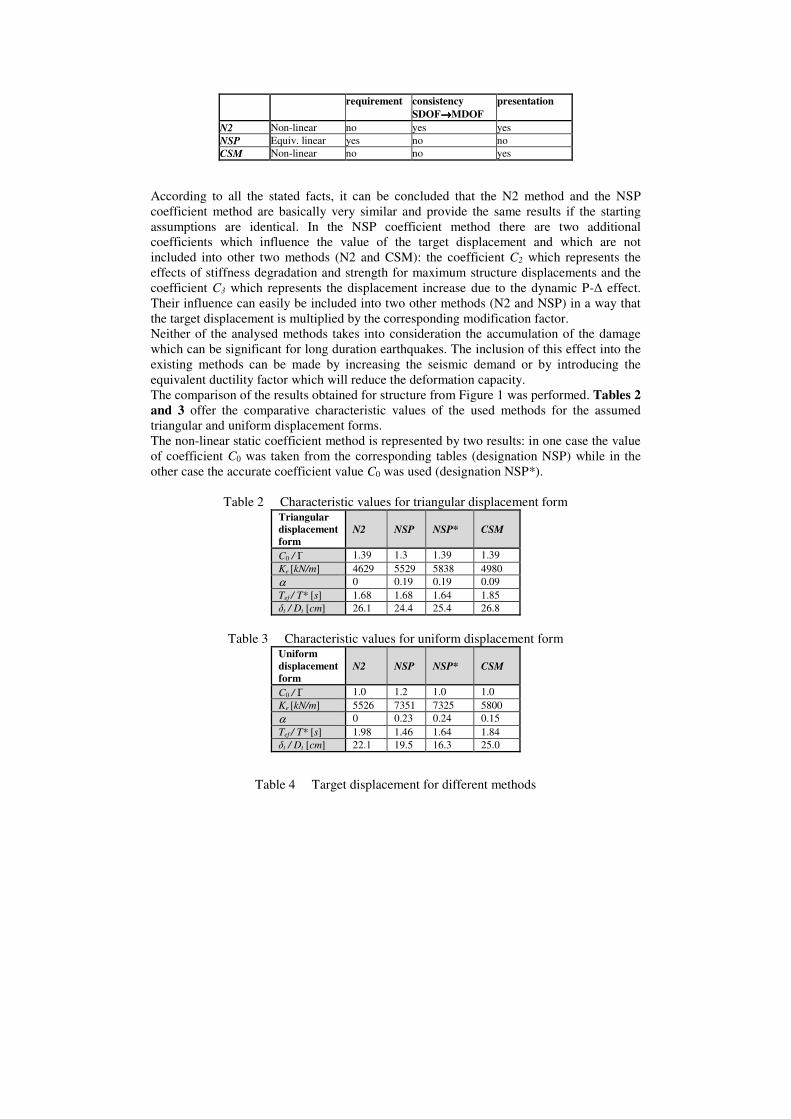
The comparison of the results obtained for structure from Figure 1 was performed. Tables 2
and 3 offer the comparative characteristic values of the used methods for the assumed
triangular and uniform displacement forms.
The non-linear static coefficient method is represented by two results: in one case the value
of coefficient C0 was taken from the corresponding tables (designation NSP) while in the
other case the accurate coefficient value C0 was used (designation NSP*).
Table 2 Characteristic values for triangular displacement form Triangular displacement
form N2 NSP NSP* CSM
C0 / Γ 1.39 1.3 1.39 1.39
Ke [kN/m] 4629 5529 5838 4980
α 0 0.19 0.19 0.09
Tef / T* [s] 1.68 1.68 1.64 1.85
δt / Dt [cm] 26.1 24.4 25.4 26.8
Table 3 Characteristic values for uniform displacement form Uniform
displacement
form N2 NSP NSP* CSM
C0 / Γ 1.0 1.2 1.0 1.0
Ke [kN/m] 5526 7351 7325 5800
α 0 0.23 0.24 0.15
Tef / T* [s] 1.98 1.46 1.64 1.84
δt / Dt [cm] 22.1 19.5 16.3 25.0
Table 4 Target displacement for different methods
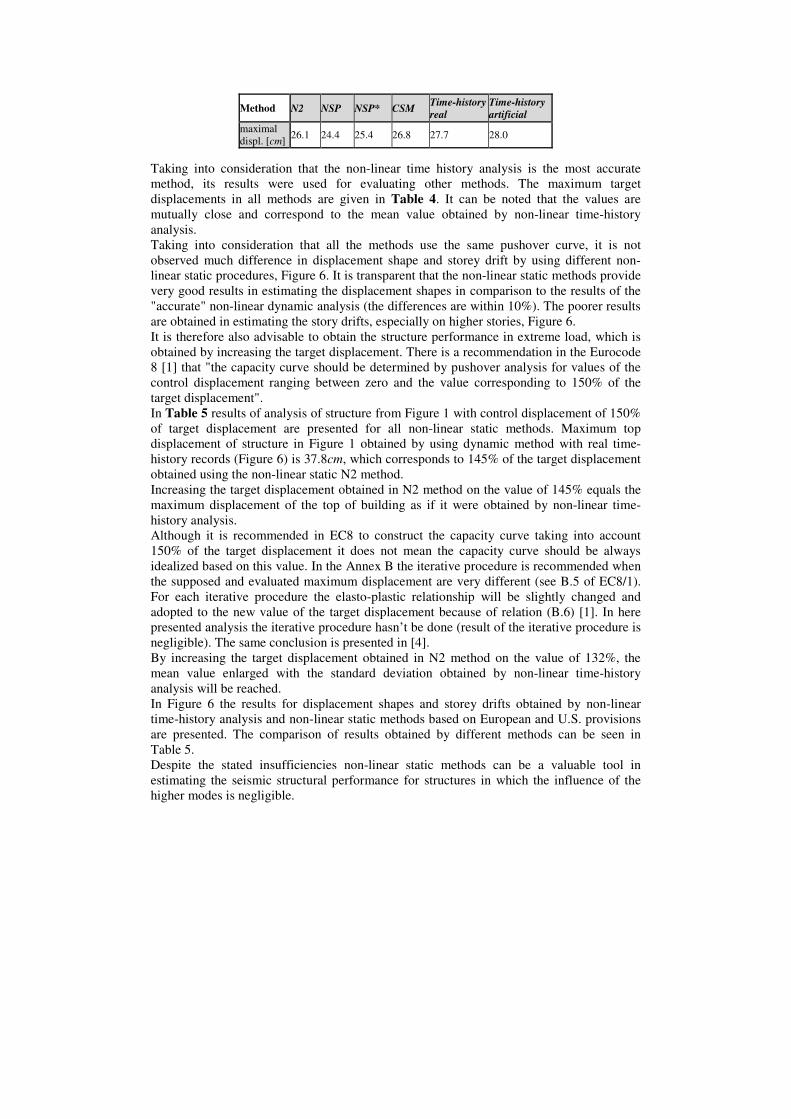
Method N2 NSP NSP* CSM Time-history
real
Time-history
artificial
maximal
displ. [cm] 26.1 24.4 25.4 26.8 27.7 28.0
Taking into consideration that the non-linear time history analysis is the most accurate
method, its results were used for evaluating other methods. The maximum target
displacements in all methods are given in Table 4. It can be noted that the values are
mutually close and correspond to the mean value obtained by non-linear time-history
analysis.
Taking into consideration that all the methods use the same pushover curve, it is not
observed much difference in displacement shape and storey drift by using different non-
linear static procedures, Figure 6. It is transparent that the non-linear static methods provide
very good results in estimating the displacement shapes in comparison to the results of the
"accurate" non-linear dynamic analysis (the differences are within 10%). The poorer results
are obtained in estimating the story drifts, especially on higher stories, Figure 6.
It is therefore also advisable to obtain the structure performance in extreme load, which is
obtained by increasing the target displacement. There is a recommendation in the Eurocode
8 [1] that "the capacity curve should be determined by pushover analysis for values of the
control displacement ranging between zero and the value corresponding to 150% of the
target displacement".
In Table 5 results of analysis of structure from Figure 1 with control displacement of 150%
of target displacement are presented for all non-linear static methods. Maximum top
displacement of structure in Figure 1 obtained by using dynamic method with real time-
history records (Figure 6) is 37.8cm, which corresponds to 145% of the target displacement
obtained using the non-linear static N2 method.
Increasing the target displacement obtained in N2 method on the value of 145% equals the
maximum displacement of the top of building as if it were obtained by non-linear time-
history analysis.
Although it is recommended in EC8 to construct the capacity curve taking into account
150% of the target displacement it does not mean the capacity curve should be always
idealized based on this value. In the Annex B the iterative procedure is recommended when
the supposed and evaluated maximum displacement are very different (see B.5 of EC8/1).
For each iterative procedure the elasto-plastic relationship will be slightly changed and
adopted to the new value of the target displacement because of relation (B.6) [1]. In here
presented analysis the iterative procedure hasn’t be done (result of the iterative procedure is
negligible). The same conclusion is presented in [4].
By increasing the target displacement obtained in N2 method on the value of 132%, the
mean value enlarged with the standard deviation obtained by non-linear time-history
analysis will be reached.
In Figure 6 the results for displacement shapes and storey drifts obtained by non-linear
time-history analysis and non-linear static methods based on European and U.S. provisions
are presented. The comparison of results obtained by different methods can be seen in
Table 5.
Despite the stated insufficiencies non-linear static methods can be a valuable tool in
estimating the seismic structural performance for structures in which the influence of the
higher modes is negligible.
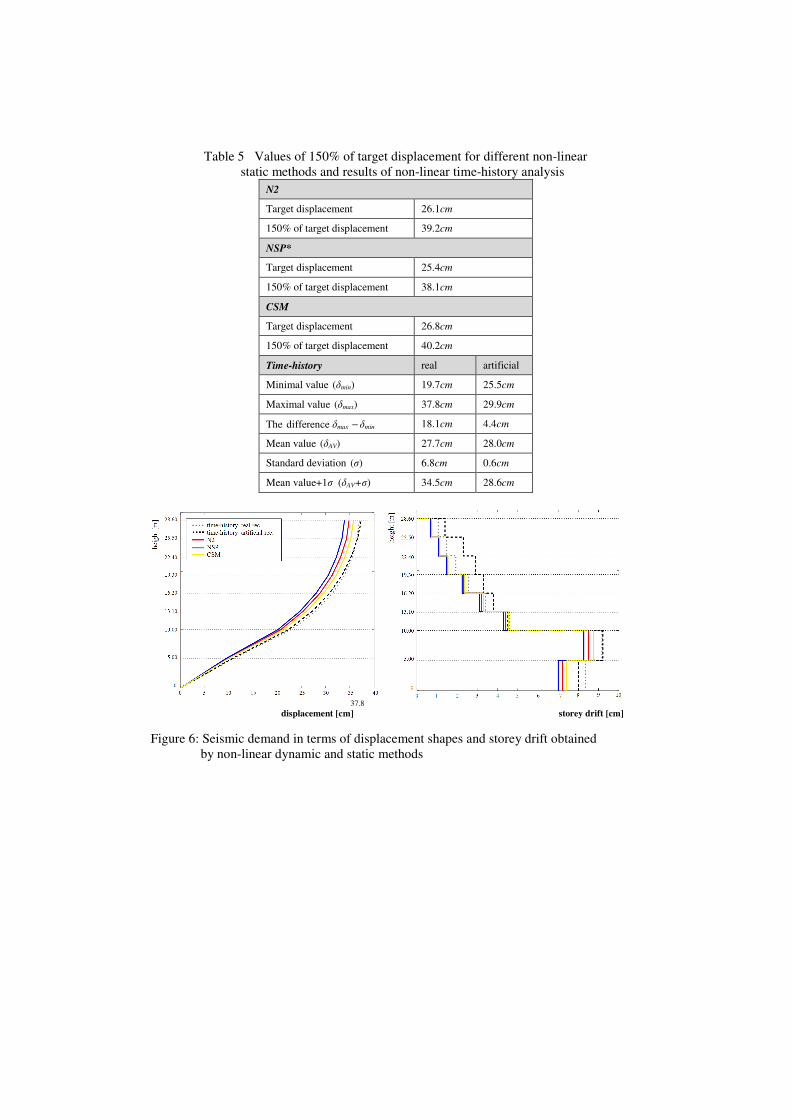
Table 5 Values of 150% of target displacement for different non-linear
static methods and results of non-linear time-history analysis
N2
Target displacement 26.1cm
150% of target displacement 39.2cm
NSP*
Target displacement 25.4cm
150% of target displacement 38.1cm
CSM
Target displacement 26.8cm
150% of target displacement 40.2cm
Time-history real artificial
Minimal value (δmin) 19.7cm 25.5cm
Maximal value (δmax) 37.8cm 29.9cm
The difference δmax − δmin 18.1cm 4.4cm
Mean value (δAV) 27.7cm 28.0cm
Standard deviation (σ) 6.8cm 0.6cm
Mean value+1σ (δAV+σ) 34.5cm 28.6cm
37.8
displacement [cm] storey drift [cm]
Figure 6: Seismic demand in terms of displacement shapes and storey drift obtained
by non-linear dynamic and static methods
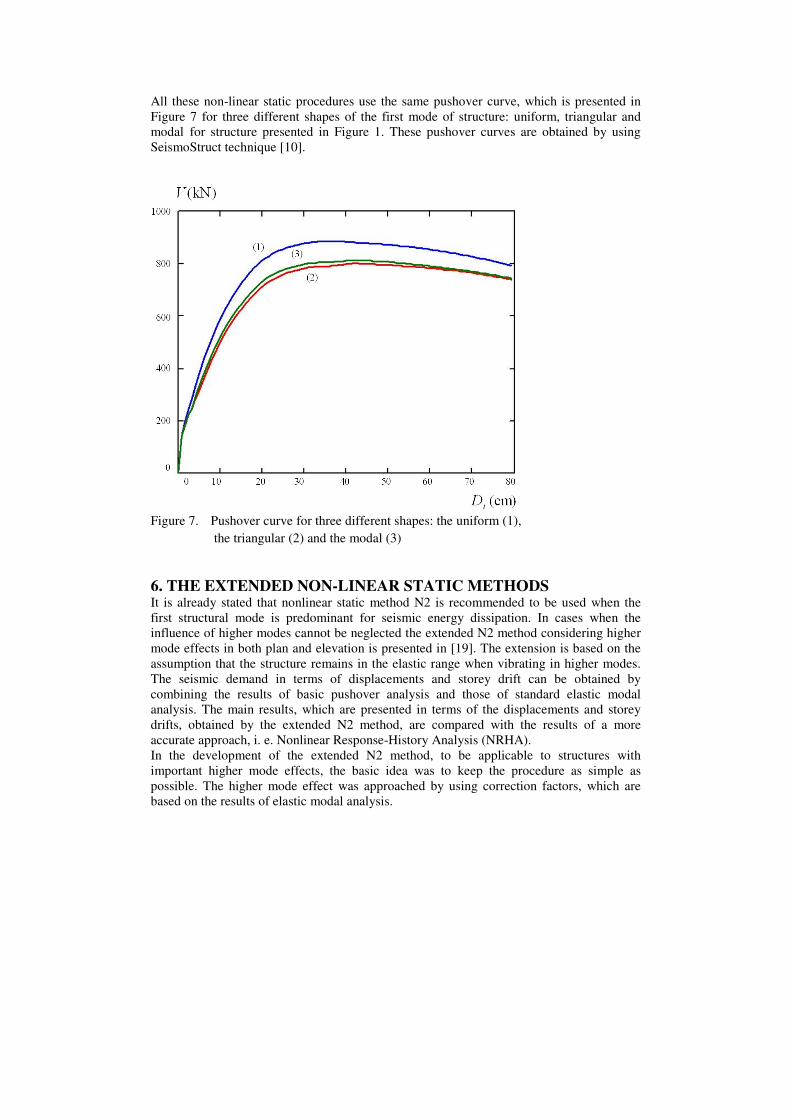
All these non-linear static procedures use the same pushover curve, which is presented in
Figure 7 for three different shapes of the first mode of structure: uniform, triangular and
modal for structure presented in Figure 1. These pushover curves are obtained by using
SeismoStruct technique [10].
Figure 7. Pushover curve for three different shapes: the uniform (1),
the triangular (2) and the modal (3)
6. THE EXTENDED NON-LINEAR STATIC METHODS It is already stated that nonlinear static method N2 is recommended to be used when the
first structural mode is predominant for seismic energy dissipation. In cases when the
influence of higher modes cannot be neglected the extended N2 method considering higher
mode effects in both plan and elevation is presented in [19]. The extension is based on the
assumption that the structure remains in the elastic range when vibrating in higher modes.
The seismic demand in terms of displacements and storey drift can be obtained by
combining the results of basic pushover analysis and those of standard elastic modal
analysis. The main results, which are presented in terms of the displacements and storey
drifts, obtained by the extended N2 method, are compared with the results of a more
accurate approach, i. e. Nonlinear Response-History Analysis (NRHA).
In the development of the extended N2 method, to be applicable to structures with
important higher mode effects, the basic idea was to keep the procedure as simple as
possible. The higher mode effect was approached by using correction factors, which are
based on the results of elastic modal analysis.
An approach taking into account higher mode effects in plane, which can be used for plan-
asymmetric buildings, was proposed in [20]. An approach which takes into account higher
mode effects in elevation was presented in [21]. Both approaches are combined to a single
procedure which enables the analysis of plan-asymmetric medium and high-rise buildings.
Also the main results, which are presented in terms of the displacements and storey drifts,
obtained by these methods [20], [21], are compared with the results of a more accurate
approach, i. e. Nonlinear Response-History Analysis (NRHA).
A similar idea for taking into account higher modes along the elevation was used by U.S.
authors in the Modified Modal Pushover Analysis (MMPA) method [22], which deals with
higher modes in elevation, and in the Practical Modal Pushover Analysis (PMPA) method
[23], which includes torsional effects.
The extended N2 method differs from MMPA and PMPA methods in the procedure for the
combination of results of pushover analysis and elastic modal analysis.
7. CONCLUSIONS It can be concluded that the discussed methods differ in their application simplicity,
transparency and clarity of the theoretical basis, but the basis of all methods is the same –
the pushover procedure. The main difference among presented methods is the
determination of the pushover limit of the target displacement. Three different displacement
forms (uniform, triangular and modal) are applied and the differences of the obtained target
displacement are presented.
According to here presented results of analysis the N2 method and the NSP coefficient
method are basically very similar and provide the same results if the starting assumptions
are identical. In the NSP coefficient method there are two additional coefficients which
influence the value of the target displacement and which are not included into other two
methods (N2 and CSM). Neither of the analysed methods takes into consideration the
accumulation of the damage which can be significant for long duration earthquakes. The
inclusion of this effect into the existing methods can be made by increasing the seismic
demand or by introducing the equivalent ductility factor which will reduce the deformation
capacity.
Having in mind that the non-linear response-history analysis is the most accurate method,
its results were used for evaluating other methods. The maximum target displacements in
all methods are obtained. The values for non-linear static analysis are mutually close and
correspond to the mean value obtained by non-linear response-history analysis.
It is discussed the structure performance in extreme load, which is obtained by increasing
the target displacement. Maximum top displacement of structure obtained by using
dynamic method with real time-history records corresponds to 145% of the target
displacement obtained using the non-linear static N2 method. It means that increasing the
target displacement obtained in N2 method on the value of 145% equals the maximum
displacement of the top of building as if it were obtained by non-linear response-history
analysis. By increasing the target displacement obtained in N2 method on the value of
130%, the mean value enlarged with the standard deviation obtained by non-linear
response-history analysis is reached.
ACKNOWLWDGEMENT
This paper represents part of the research project: "Development of structures with
increased reliability with regard to earthquakes", which is sponsored by the
University of Rijeka, Croatia, within the project no. 402-01/14-01/11.
REFERENCES
[1] Eurocode 8 – Design of structures for earthquake resistance – Part 1: General rules,
seismic actions and rules for buildings, European Committee for Standardization, CEN,
Brussels, EN 1998-1: 2004.
[2] Causevic, M., Mitrovic, S. (2011), Comparison between non-linear dynamic and static
seismic analysis of structures according to European and US provisions, Bulletin of
Earthquake Engineering, 9(2): 467-489.
[3] Mitrovic, S., Causevic, M. (2009) Non-linear static seismic analysis of structures
according to European and American methods, Gradevinar, Zagreb, No. 6.
[4] Causevic, M., Zehentner E. (2007) Non-linear seismic analysis of structures according
to EN 1998-1:2004, Gradevinar, Zagreb, No. 09.
[5] Fajfar, P. (2000) A Nonlinear Analysis Method for Performance Based Seismic Design,
Earthquake Spectra 16(3): 573-592.
[6] ATC-40. (1996) Seismic Evaluation and Retrofit of Concrete Buildings, Applied
Technology Council.
[7] Federal Emergency Management Agency (FEMA). (2005) Improvement of Nonlinear
Static Seismic Analysis Procedures FEMA-440, Federal Emergency Management
Agency, Washington, D.C.
[8] Federal Emergency Management Agency (FEMA) (1997) NEHRP guidelines for
seismic rehabilitation of buildings, FEMA 273, and NEHRP Commentary on the
guidelines for the seismic rehabilitation of buildings, FEMA 274, Federal Emergency
Management Agency, Washington, D.C.
[9] Federal Emergency Management Agency (FEMA) (2000) Pre standard and
Commentary for the Seismic Rehabilitation of Buildings FEMA-356, Federal
Emergency Management Agency, Washington, D.C.
[10] SeismoSoft : SeismoStruct (v7.0.6) A computer program for static and dynamic
nonlinear analysis of framed structures, Available from URL:
http://www.seismosoft.com.
[11] SeismoSoft : SeismoSignal (v5.1.2), SeismoSpect (v2.1.2) A computer program for
processing strong-motion data, Available from URL: http://www.seismosoft.com.
[12] Gelfi, P. SIMQKE_GR, Programma per la generazione di accelerogrammi artificiali
spettro-compatibili, University of Brescia, Italy
[13] NISEE – National Information Service for Earthquake Engineering, University of
California Berkeley, Earthquake Engineering Research Centre, http://nisee.berkeley.edu
[14] Naumoski, N. Representative Ensembles of Strong Earthquake Records, CAEE - The
Canadian Association for Earthquake Engineering, http://www.caee.uottawa.ca/
[15] Causevic, M. (2014) DINAMIKA KONSTRUKCIJA – potresno inženjerstvo,
aerodinamika, konstrukcijske euronorme, Drugo dopunjeno izdanje, Golden marketing-
Tehnička knjiga, Zagreb.
[16] Chopra, A.K. (2012) Dynamics of Structures – Theory and Applications to Earthquake
Engineering, Fourth edition, Prentice Hall, New Jersey.
[17] Chopra, A.K., Goel, R.K. (1999) Capacity-Demand-Diagram Methods for Estimating
Seismic Deformation of Inelastic Structures, Pacific Earthquake Engineering Research
Centre.
[18] Rozman, M., Fajfar, P. (2009) Seismic response of a RC frame building designed
according to old and modern practices, Bulletin of Earthquake Engineering, 7:779-799.
[19] Kreslin, M., Fajfar, P (2012) The extended N2 method considering higher mode effects
in both plan and elevation, Bulletin of Earthquake Engineering, 10(2): 695-715.
[20] Fajfar, P., Marusic, D, Perus, I. (2005) Torsional effects in the pushover-based seismic
analysis of buildings, Journal of Earthquake Engineering, 9(6):831-854.
[21] Kreslin, M., Fajfar, P. (2011) The extended N2 method taking into account higher
mode effects in elevation, Earthq Eng Struct Dyn., 40(14): 1571–1589.
[22] Chopra, A.K., Goel, R.K., Chintanapakdee, C. (2004) Evaluation of a modified MPA
procedure assuming higher modes as elastic to estimate seismic demands, Earthquake
Spectra, 20(3):757-778
[23] Reyes, J.C, Chopra, A.K. (2011) Three-dimensional modal pushover analysis of
buildings subjected to two components of ground motion including its elevation for tall
buildings, Earthq Eng Struct Dyn., 40(7):789–806,


