South Dakota Timber Industry:An Assessment of Timber Product Output and Use
2009
Ronald J. PivaGregory J. Josten
United StatesUnited StatesDepartment of Department of AgricultureAgriculture
Forest ServiceForest Service
Northern Northern Research StationResearch Station
Resource BulletinResource BulletinNRS-80NRS-80
Visit our homepage at: http://www.nrs.fs.fed.us/
Published by: For additional copies:
U.S. FOREST SERVICE U.S. Forest Service 11 CAMPUS BLVD SUITE 200 Publications DistributionNEWTOWN SQUARE PA 19073 359 Main Road Delaware, OH 43015-8640 Fax: (740)368-0152June 2013 Email: [email protected]
Abstract
In 2009, there were 23 active primary wood-processing mills in South Dakota, 2 fewer mills than in 2004. Industrial roundwood processed by South Dakota mills increased by 4 percent, from 24.9 million cubic feet in 2004 to 26.0 million cubic feet in 2009. More than 80 percent of the industrial roundwood processed by South Dakota mills was harvested from South Dakota. Eighty-five percent of the imported industrial roundwood processed by South Dakota mills came from Wyoming. There was a total of 24.7 million cubic feet of industrial roundwood harvested in South Dakota in 2009, an increase of 13 percent from 2004. Ninety-five percent of the exported industrial roundwood went to mills in Wyoming. Saw logs accounted for 95 percent of the total harvest. The harvesting of industrial roundwood products resulted in 10.4 million cubic feet of harvest residues. Primary wood-processing mills generated 372,000 green tons of mill residues. Nearly 40 percent of the mill residues generated were used by pulp and particleboard industries. Less than 1 percent of the mill residues were not used for other secondary uses.
Cover Photo
Ponderosa pine harvest on Black Hills National Forest. Photo by Gregory Josten, South Dakota Department of Agriculture, used with permission.
Manuscript received for publication 5 September 2012

Contents
Introduction .......................................................................................................................1
Study Methods ..................................................................................................................2
Primary Timber Industry in South Dakota
Industrial Roundwood ....................................................................................................4
Saw Logs ........................................................................................................................6
Other Products ...............................................................................................................6
Timber Removals ...........................................................................................................6
Harvest Intensity ............................................................................................................7
Primary Mill Residues .....................................................................................................8
Acknowledgments ............................................................................................................9
Literature Cited .................................................................................................................9
Appendix
Definition of Terms ........................................................................................................ 10
Common and Scientific Names of Tree Species by Species Group ............................. 15
Tables ........................................................................................................................... 17

Page intentionally left blank
1
INTRODUCTION
South Dakota’s primary wood products manufacturing industry1 employs 2,470 workers and has a total value of shipments of $590.9 million (U.S. Census Bureau 2007). Given the importance of this industry to the economy of South Dakota, this bulletin analyzes recent forest industry trends and reports the results of a detailed study of forest industry, industrial roundwood production, and associated primary mill wood and bark residue in 2009. Such detailed information is necessary for intelligent planning and decisionmaking in wood procurement, economic research, forest resources management, and forest industry development.
Th e last published report of timber product output and use in South Dakota was for a 2004 study and is used in this study as a basis for comparison. When new surveys are completed, errors and omissions from previous surveys are corrected. As a result of our ongoing eff orts to improve the survey’s effi ciency and reliability, changes may have been made to the previous survey’s data. All comparisons and analysis in this report are based on the reprocessed data from earlier surveys, which may not match earlier published data. Rows and columns of supporting tables may not sum due to rounding, but data in each table cell are accurately displayed.
Information about the forest resources of South Dakota is available at the Forest Inventory and Analysis Web site at: http://nrs.fs.fed.us/fi a/data-tools/state-reports/SD.
Th e Authors
RONALD J. PIVA works for the Forest Inventory and Analysis Program at the Northern Research Station in St. Paul, MN. He received a B.S. in forest management from the University of Missouri-Columbia in 1984 and joined the Forest Service in 1987.
GREGORY J. JOSTEN, CF, is an ag program administrator-stewardship. He joined the South Dakota Department of Agriculture, Resource Conservation and Forestry Division in 1983 and currently works in Rapid City, SD. He received a B.S. in forest resource management and an M.S. in forest science from the University of Montana, School of Forestry.
1North American Industry Classifi cation System (NAICS) 321 (wood product manufacturing) and NAICS 322 (paper manufacturing).

2
STUDY METHODS
Th is study was a cooperative eff ort between the South Dakota Department of Agriculture, Resource Conservation and Forestry Division (SDRCF) and the Forest Inventory and Analysis (FIA) programs at the Northern Research Station (NRS) of the U.S. Forest Service. Th e FIA program is responsible for providing forest resource statistics for all ownerships across the United States, including timber product outputs.
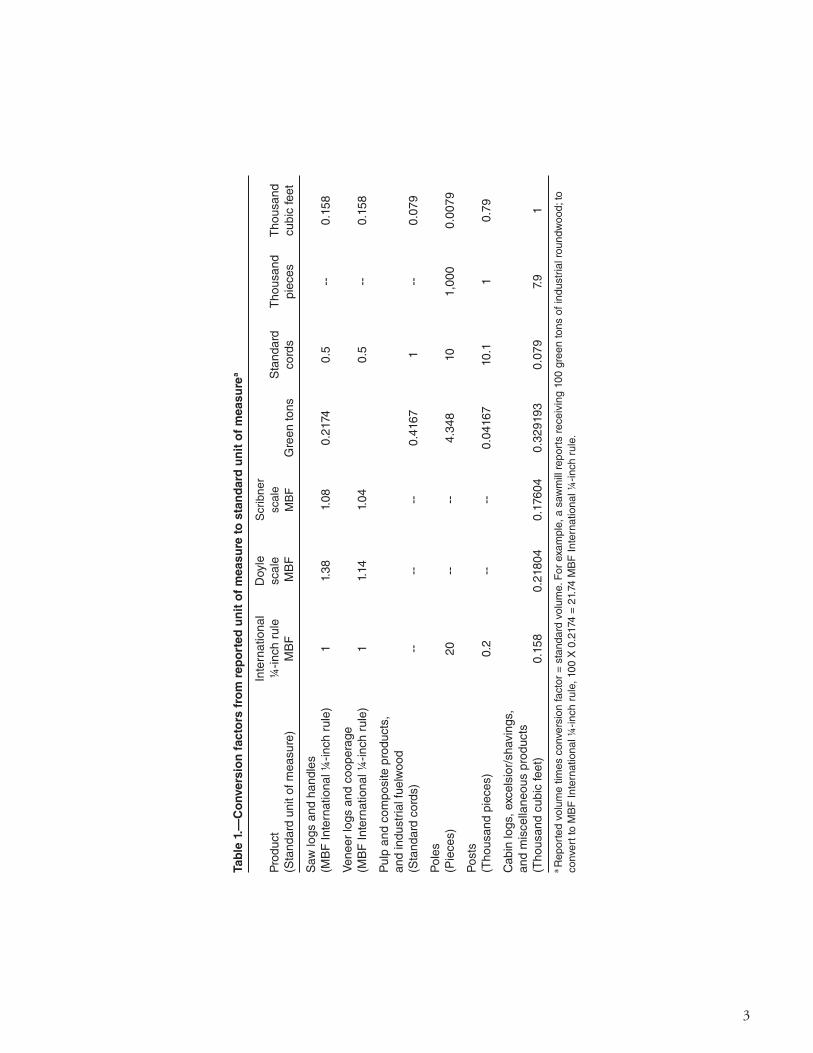
SDRCF personnel surveyed all known primary wood-using mills, using questionnaires supplied by NRS, to obtain a 100 percent response rate. Th e questionnaires were designed to determine the size and composition of the State’s primary wood-using industry, its use of roundwood, and its generation and disposition of wood residues. Completed questionnaires were sent to the NRS for processing and analysis. As part of data processing, all industrial roundwood volumes reported on the questionnaires were converted to standard units of measure using regional conversion factors (Table 1). Timber removals by source of material and harvest residues generated during logging were estimated from standard product volumes using factors developed from logging utilization studies previously conducted by the NRS. To provide a complete assessment of South Dakota’s timber product output, data on the State’s industrial roundwood receipts were loaded into a regional timber removals database where they were supplemented with data on out-of-State uses of South Dakota roundwood.
Certain terms used in this report—retained, exports, imports, production, and receipts—have specialized meanings and relationships unique to the FIA program that surveys timber product output (TPO) (Fig. 1). Tables in the appendix relating to saw log volume and sawtimber removal volume are presented in both International ¼-inch rule and Scribner rule. International ¼-inch rule is the U.S. Forest Service standard while Scribner rule is the common measure used in South Dakota by forest industries and land management agencies
Figure 1.—The movement of industrial roundwood.
RetainedRoundwood volume processed by mills in the State in which it is
harvested.
ReceiptsRoundwood volume
processed by mills within the State (both Retained and
Imported).
ExportsRoundwood volume transported to mills outside the State.
ImportsRoundwood volume received from other
States.
ProductionRoundwood volume
harvested within the State (both Retained and
Exported).
Production = Retained + Exports Receipts = Retained + Imports
3
Tab
le 1
.—C
on
vers
ion
facto
rs f
rom
rep
ort
ed
un
it o
f m
easu
re t
o s
tan
dard
un
it o
f m
easu
rea
Pro
duct
(Sta
ndar
d un
it of
mea
sure
)
Inte
rnat
iona
l ¼
-inch
rul
e M
BF
Doy
le
scal
e M
BF
Scr
ibne
r sc
ale
MB
FG
reen
tons
Sta
ndar
d co
rds
Tho
usan
d pi
eces
Tho
usan
d cu
bic
feet
Saw
logs
and
han
dles
(MB
F In
tern
atio
nal ¼
-inch
rul
e)1
1.38
1.08
0.21
740.
5--
0.15
8
Ven
eer
logs
and
coo
pera
ge(M
BF
Inte
rnat
iona
l ¼-in
ch r
ule)
11.
141.
04
0.5
--0.
158
Pul
p an
d co
mpo
site
pro
duct
s,
and
indu
stria
l fue
lwoo
d(S
tand
ard
cord
s)--
----
0.41
671
--0.
079
Pol
es(P
iece
s)20
----
4.34
810
1,00
00.
0079
Pos
ts(T
hous
and
piec
es)
0.2
----
0.04
167
10.1
10.
79
Cab
in lo
gs, e
xcel
sior
/sha
ving
s,
and
mis
cella
neou
s pr
oduc
ts(T
hous
and
cubi
c fe
et)
0.15
80.
2180
40.
1760
40.
3291
930.
079
7.9
1a R
epor
ted
volu
me
times
con
vers
ion
fact
or =
sta
ndar
d vo
lum
e. F
or e
xam
ple,
a s
awm
ill r
epor
ts r
ecei
ving
100
gre
en to
ns o
f ind
ustr
ial r
ound
woo
d; to
co
nver
t to
MB
F In
tern
atio
nal ¼
-inch
rul
e, 1
00 X
0.2
174
= 2
1.74
MB
F In
tern
atio
nal ¼
-inch
rul
e.
4
PRIMARY TIMBER INDUSTRY IN SOUTH DAKOTA
Industrial Roundwood
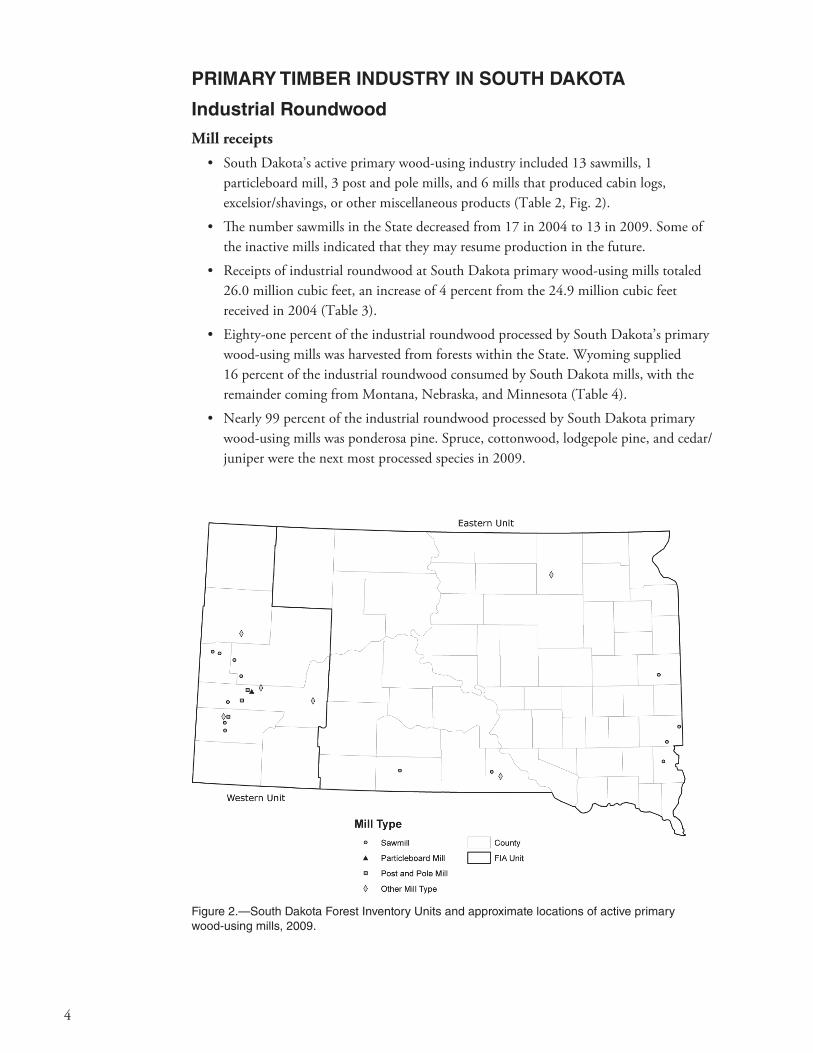
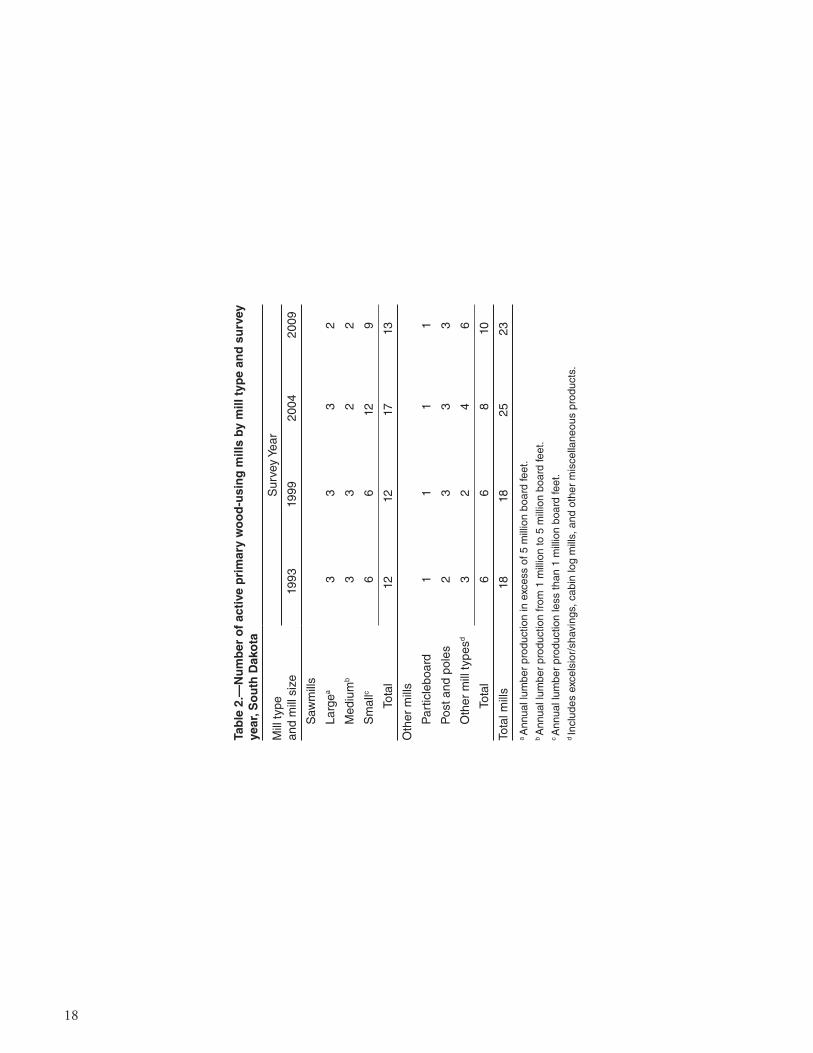
Mill receipts• South Dakota’s active primary wood-using industry included 13 sawmills, 1
particleboard mill, 3 post and pole mills, and 6 mills that produced cabin logs, excelsior/shavings, or other miscellaneous products (Table 2, Fig. 2).
• Th e number sawmills in the State decreased from 17 in 2004 to 13 in 2009. Some of the inactive mills indicated that they may resume production in the future.
• Receipts of industrial roundwood at South Dakota primary wood-using mills totaled 26.0 million cubic feet, an increase of 4 percent from the 24.9 million cubic feet received in 2004 (Table 3).
• Eighty-one percent of the industrial roundwood processed by South Dakota’s primary wood-using mills was harvested from forests within the State. Wyoming supplied 16 percent of the industrial roundwood consumed by South Dakota mills, with the remainder coming from Montana, Nebraska, and Minnesota (Table 4).
• Nearly 99 percent of the industrial roundwood processed by South Dakota primary wood-using mills was ponderosa pine. Spruce, cottonwood, lodgepole pine, and cedar/juniper were the next most processed species in 2009.
Figure 2.—South Dakota Forest Inventory Units and approximate locations of active primary wood-using mills, 2009.

5
Industrial roundwood production (harvest)• Industrial roundwood production increased 13 percent, from 21.8 million cubic feet in
2004 to 24.7 million cubic feet in 2009 (Table 5).
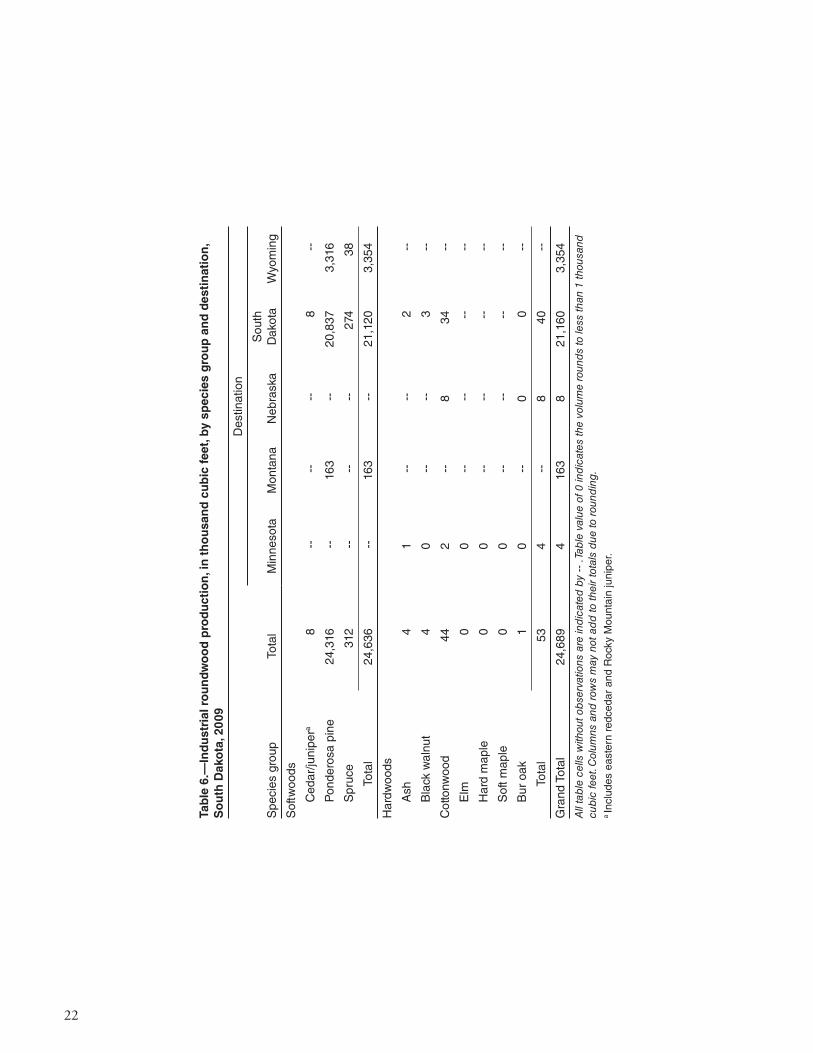
• Ninety-fi ve percent of industrial roundwood harvested in South Dakota was retained for processing by primary wood-using mills in the State. Mills in Wyoming received 95 percent of the industrial roundwood that was exported (Table 6).
• Th e Western Forest Inventory Unit accounted for nearly 100 percent of total State production. Less that 1 percent of the industrial roundwood harvested in South Dakota came from the Eastern Forest Inventory Unit.
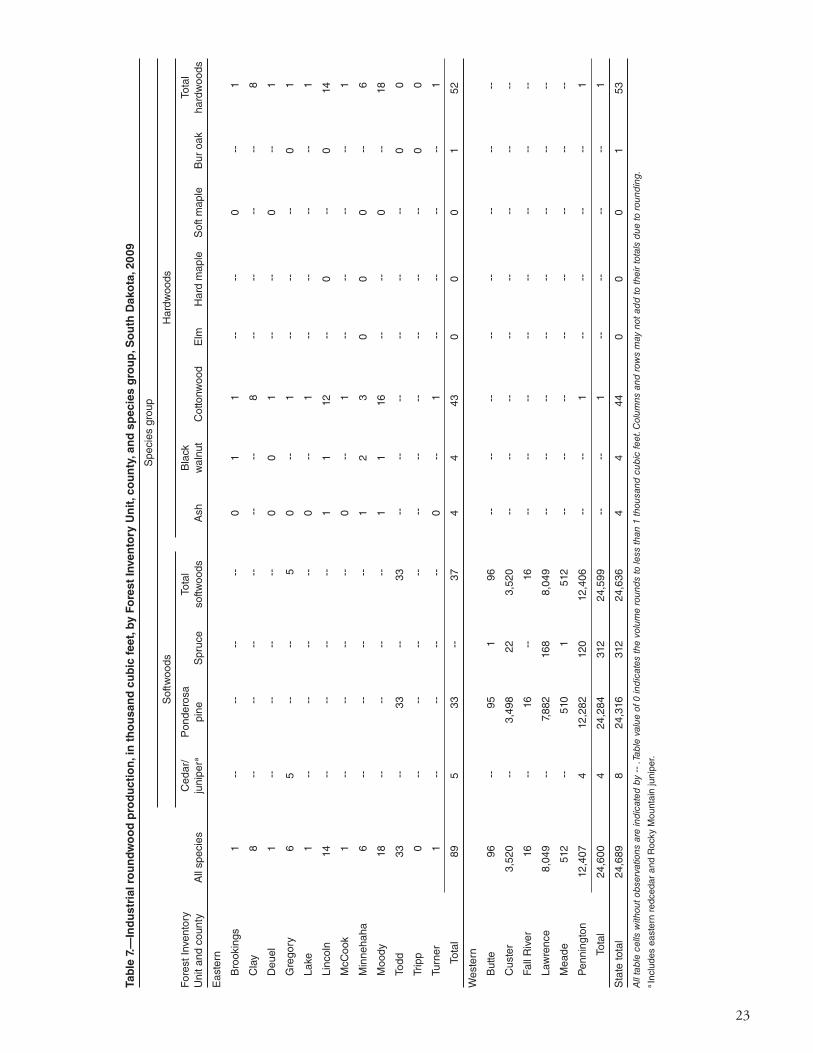
• Softwoods, mainly ponderosa pine, accounted for nearly 100 percent of the total industrial roundwood harvested. Spruce, the second most harvested species, accounted for only 1 percent of the total roundwood production (Table 7, Fig. 3).
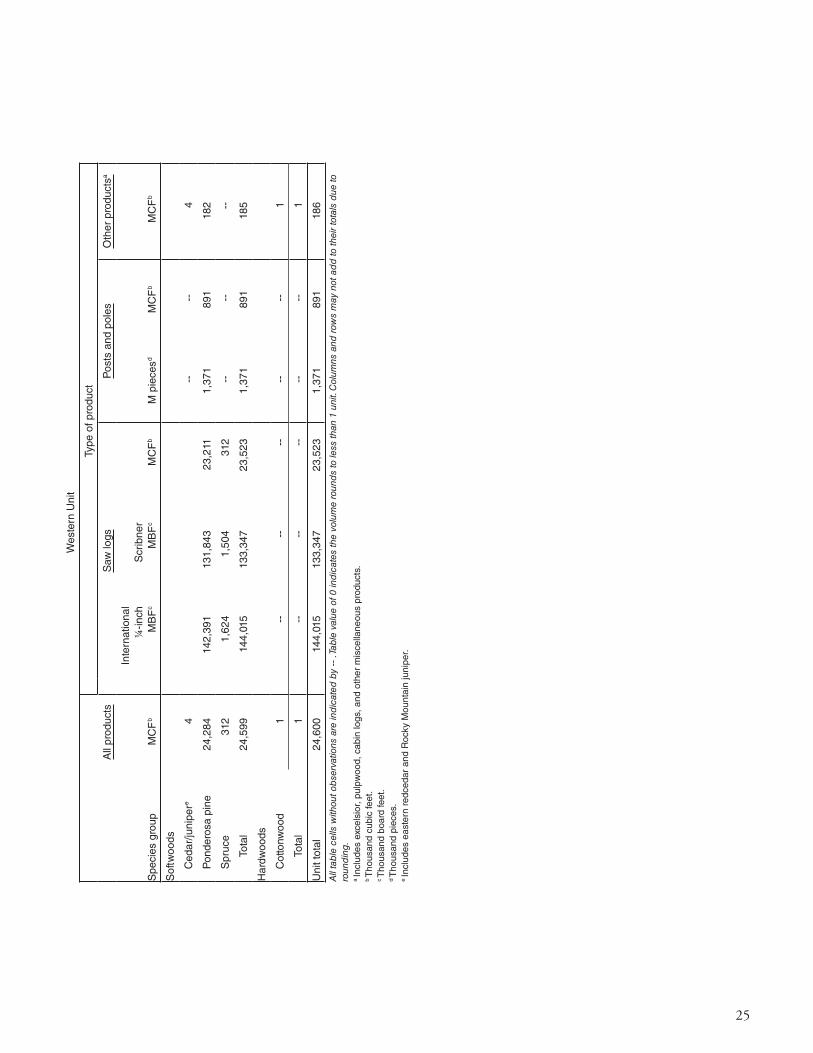
• Th e production of saw logs accounted for 95 percent of total industrial roundwood production. Posts and poles were second in production, accounting for 4 percent. Th e remaining 1 percent of the industrial roundwood products harvested included pulpwood, cabin logs, excelsior/shavings, and other miscellaneous products (Table 8, Fig. 4).
Figure 3.—Industrial roundwood production by softwoods and hardwoods, and survey year, South Dakota (Choate and Spencer 1969, Collins and Green 1988, Hackett and Sowers 1996, Piva and Josten 2003, Piva et al. 2006).
Figure 4.—Industrial roundwood production by product and survey year, South Dakota (Choate and Spencer 1969, Collins and Green 1988, Hackett and Sowers 1996, Piva and Josten 2003, Piva et al. 2006).
0
5
10
15
20
25
1962 1983 1993 1999 2004 2009
Indu
stria
l Rou
ndw
ood
Prod
uctio
n (In
mill
ion
cubi
c fe
et)
Softwoods Hardwoods
Survey Year
0
5
10
15
20
25
1962 1983 1993 1999 2004 2009
Indu
stria
l Rou
ndw
ood
Prod
uctio
n (In
mill
ion
cubi
c fe
et)
Saw logs Other products
Survey Year
6
Saw Logs
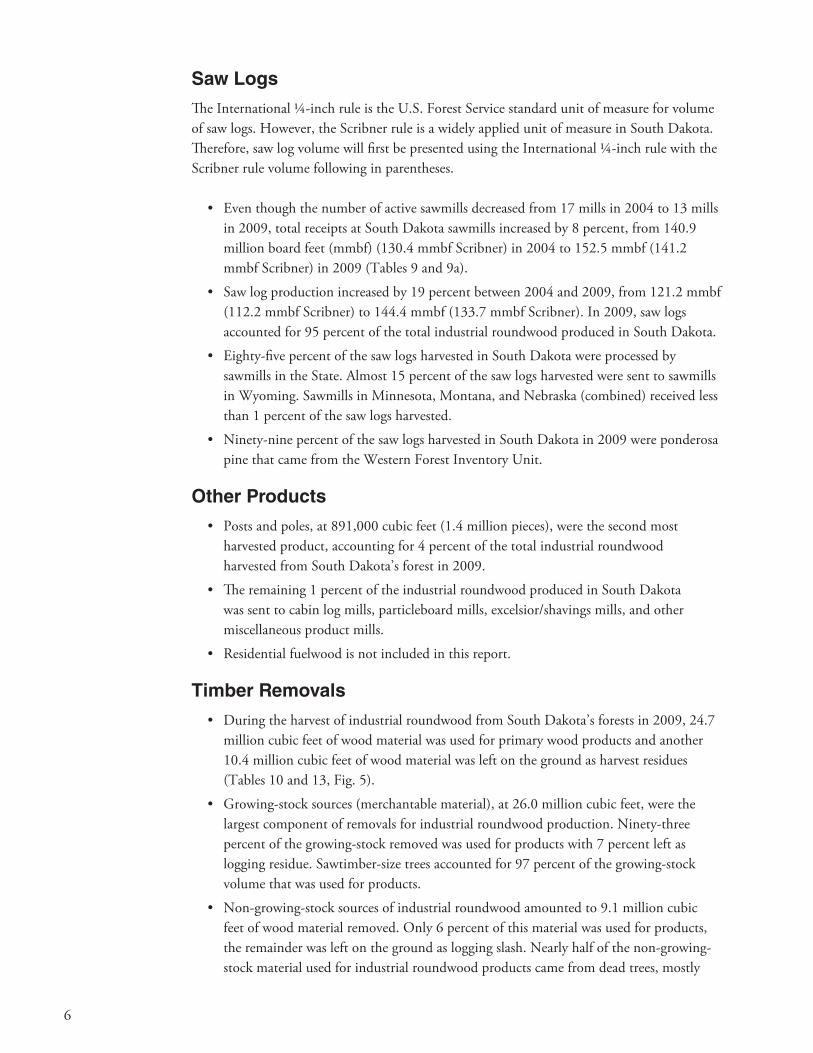
Th e International ¼-inch rule is the U.S. Forest Service standard unit of measure for volume of saw logs. However, the Scribner rule is a widely applied unit of measure in South Dakota. Th erefore, saw log volume will fi rst be presented using the International ¼-inch rule with the Scribner rule volume following in parentheses.
• Even though the number of active sawmills decreased from 17 mills in 2004 to 13 mills in 2009, total receipts at South Dakota sawmills increased by 8 percent, from 140.9 million board feet (mmbf) (130.4 mmbf Scribner) in 2004 to 152.5 mmbf (141.2 mmbf Scribner) in 2009 (Tables 9 and 9a).
• Saw log production increased by 19 percent between 2004 and 2009, from 121.2 mmbf (112.2 mmbf Scribner) to 144.4 mmbf (133.7 mmbf Scribner). In 2009, saw logs accounted for 95 percent of the total industrial roundwood produced in South Dakota.
• Eighty-fi ve percent of the saw logs harvested in South Dakota were processed by sawmills in the State. Almost 15 percent of the saw logs harvested were sent to sawmills in Wyoming. Sawmills in Minnesota, Montana, and Nebraska (combined) received less than 1 percent of the saw logs harvested.
• Ninety-nine percent of the saw logs harvested in South Dakota in 2009 were ponderosa pine that came from the Western Forest Inventory Unit.
Other Products
• Posts and poles, at 891,000 cubic feet (1.4 million pieces), were the second most harvested product, accounting for 4 percent of the total industrial roundwood harvested from South Dakota’s forest in 2009.
• Th e remaining 1 percent of the industrial roundwood produced in South Dakota was sent to cabin log mills, particleboard mills, excelsior/shavings mills, and other miscellaneous product mills.
• Residential fuelwood is not included in this report.
Timber Removals
• During the harvest of industrial roundwood from South Dakota’s forests in 2009, 24.7 million cubic feet of wood material was used for primary wood products and another 10.4 million cubic feet of wood material was left on the ground as harvest residues (Tables 10 and 13, Fig. 5).
• Growing-stock sources (merchantable material), at 26.0 million cubic feet, were the largest component of removals for industrial roundwood production. Ninety-three percent of the growing-stock removed was used for products with 7 percent left as logging residue. Sawtimber-size trees accounted for 97 percent of the growing-stock volume that was used for products.
• Non-growing-stock sources of industrial roundwood amounted to 9.1 million cubic feet of wood material removed. Only 6 percent of this material was used for products, the remainder was left on the ground as logging slash. Nearly half of the non-growing-stock material used for industrial roundwood products came from dead trees, mostly

7
ponderosa pine trees killed by mountain pine beetle. Th e remainder came from cull trees, limbwood, and saplings.
• Nearly 100 percent of the growing-stock material removed from South Dakota’s timberland came from the Western Forest Inventory Unit (Table 11). Even though less than 1 percent of the growing-stock volume removed came from the Eastern Forest Inventory Unit, this unit accounted for 98 percent of the hardwood growing-stock removals.
• In 2009, 144.3 million board feet-International ¼ -inch rule (133.6 million board feet -Scribner rule) of South Dakota’s sawtimber inventory was removed from timberland (Tables 12 and 12a).
Harvest Intensity
• For 2005 through 2009, FIA reported an average of 20.7 cubic feet of annual net growth of live trees per acre per year on forest land (total annual net growth of live trees divided by forest land area), and 14.8 cubic feet of harvest-related live tree removals per acre per year on forest land (total annual harvest removals of live trees divided by forest land area) (Piva 2010).
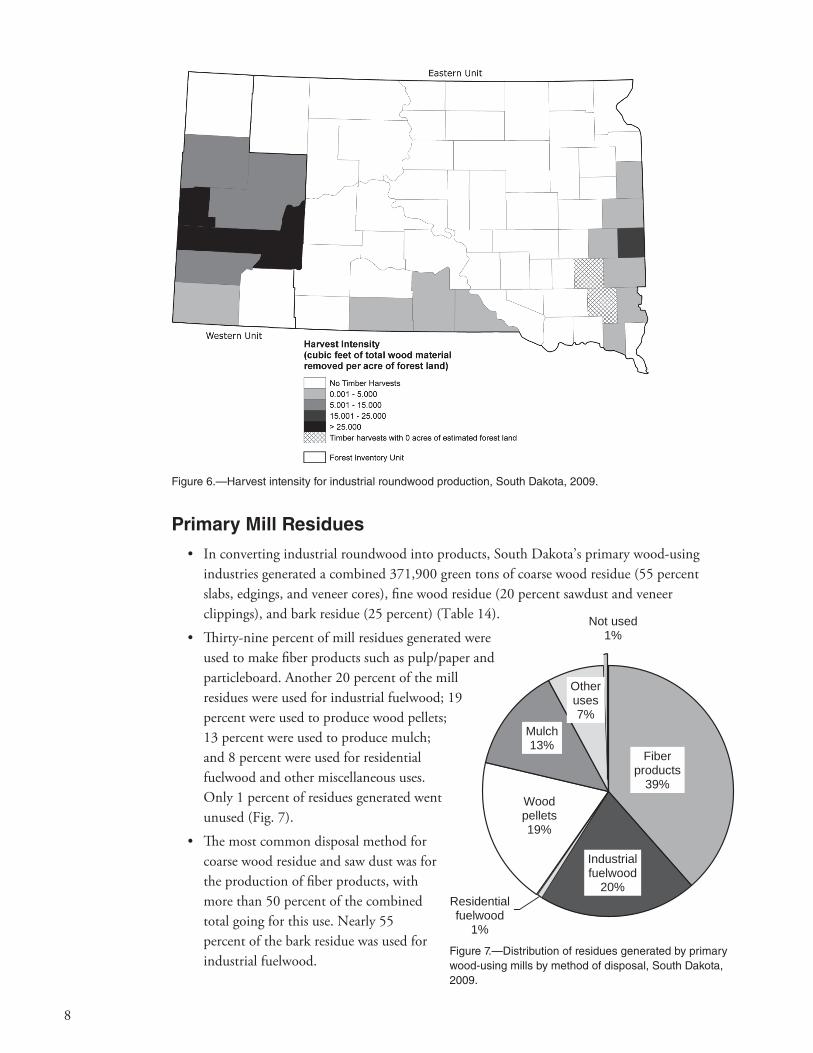
• Based on this TPO study for South Dakota, the current removals for the year 2009 averaged 18.6 cubic feet of total harvest removals (removals for product plus harvest residues) per acre of forest land. Only 18 of the 66 total counties in South Dakota reported industrial roundwood removals in 2009, and only 3 counties reported more than 15.0 cubic feet of harvest removals per acre of forest land (Fig. 6). (For reference, a cord of roundwood contains about 80 cubic feet of wood.)
• Th e Western Forest Inventory Unit averaged 24.1 cubic feet of harvest removals per acre of forest land, and the Eastern Forest Inventory Unit averaged just 0.3 cubic feet of harvest removals per acre of forest land.
• South Dakota’s net volume of live trees on forest land in 2009 was 2.3 billion cubic feet (Piva 2010). Th e 35.1 million cubic feet of total wood material removed due to harvesting (Table 10) represents only 1.5 percent of the total live volume of trees on forest land.
Figure 5.—Distribution of timber removals for industrial roundwood by source of material, South Dakota, 2009.
Sawtimber 67%
Poletimber 2%
Saplings, limbwood, cull, dead trees, and nonforest trees,
2%
Logging residue
5%
Logging slash 24%
Utilized-industrial
Not utilized-harvest residues
Growing-stock sources Sawtimber size trees Poletimber size trees Logging residue Non-growing-stock sources Saplings, limbwood, cull, dead trees, and nonforest trees
Logging slash
8
Figure 7.—Distribution of residues generated by primary wood-using mills by method of disposal, South Dakota, 2009.
Figure 6.—Harvest intensity for industrial roundwood production, South Dakota, 2009.
Fiber products
39%
Industrial fuelwood
20% Residential fuelwood
1%
Wood pellets 19%
Mulch 13%
Other uses 7%
Not used 1%
Primary Mill Residues
• In converting industrial roundwood into products, South Dakota’s primary wood-using industries generated a combined 371,900 green tons of coarse wood residue (55 percent slabs, edgings, and veneer cores), fi ne wood residue (20 percent sawdust and veneer clippings), and bark residue (25 percent) (Table 14).
• Th irty-nine percent of mill residues generated were used to make fi ber products such as pulp/paper and particleboard. Another 20 percent of the mill residues were used for industrial fuelwood; 19 percent were used to produce wood pellets; 13 percent were used to produce mulch; and 8 percent were used for residential fuelwood and other miscellaneous uses. Only 1 percent of residues generated went unused (Fig. 7).
• Th e most common disposal method for coarse wood residue and saw dust was for the production of fi ber products, with more than 50 percent of the combined total going for this use. Nearly 55 percent of the bark residue was used for industrial fuelwood.

9
ACKNOWLEDGMENTS
Special thanks are given to the primary wood-using fi rms for supplying information for this study and to the South Dakota Department of Agriculture, Resource Conservation and Forestry Division, whose cooperation in canvassing survey respondents is greatly appreciated.
Figures 2 and 6 were created by Brian Walters, forester with Forest Inventory and Analysis in St. Paul, MN.
LITERATURE CITED
Choate, G.A.; Spencer, J., Jr. 1969. Forest in South Dakota. Resour. Bull. INT-8. Ogden, UT; U.S. Department of Agriculture, Forest Service, Intermountain Forest & Range Experiment Station. 40 p.
Collins, D.C.; Green, A.W. 1988. South Dakota’s timber resources. Resour. Bull. INT-56. Ogden, UT; U.S. Department of Agriculture, Forest Service, Intermountain Research Station. 48 p.
Hackett, R.L.; Sowers, R.A. 1996. South Dakota timber industry—an assessment of timber product output and use, 1993. Resour. Bull. NC-175. St. Paul, MN: U.S. Department of Agriculture, Forest Service, North Central Forest Experiment Station. 19 p.
Piva, R.J. 2010. South Dakota’s forest resources, 2009. Res. Note. NRS-82. Newtown Square, PA: U.S. Department of Agriculture, Forest Service, Northern Research Station. 4 p. (Available only online at: http://www.nrs.fs.fed.us/pubs/rn/rn_nrs82.pdf).
Piva, R.J.; Josten, G.J. 2003. South Dakota timber industry—an assessment of timber product output and use, 1999. Resour. Bull. NC-213. St. Paul, MN: U.S. Department of Agriculture, Forest Service, North Central Research Station. 31 p.
Piva, R.J.; Josten, G.J.; Mayko, Richard D. 2006. South Dakota timber industry—an assessment of timber product output and use, 2004. Resour. Bull. NC-264. St. Paul, MN: U.S. Department of Agriculture, Forest Service, North Central Research Station. 36 p.
U. S. Census Bureau. 2007. 2007 Economic Census. Available at: http://www.census.gov/econ/census07/ (Accessed May 2, 2012).
10
APPENDIX
Definition of Terms
Board foot. Unit of measure applied to roundwood. It relates to lumber that is 1 foot long, 1 foot wide, and 1 inch thick (or its equivalent).
Bolt. A short log no more than 8 feet long, to be sawn for lumber, peeled or sliced for veneer, shaved for excelsior, or converted into shingles, cooperage stock, dimension stock, blocks, blanks, or other products.
Central stem. Th e portion of a tree between a 1-foot stump and the minimum 4.0-inch top diameter outside bark, or point where the central stem breaks into limbs.
Coarse mill residue. Wood residue suitable for chipping such as slabs, edgings, and veneer cores.
Commercial species. Tree species presently or prospectively suitable for industrial wood products. (Note: Excludes species of typically small size, poor form, or inferior quality such as hophornbeam, Osage-orange, and redbud.)
Cull removals. Net volume of rough and rotten trees plus the net volume in sections of the central stem of growing-stock trees that do not meet regional merchantability standards but are harvested for industrial roundwood products.
Diameter at breast height (d.b.h.). Th e outside bark diameter at 4.5 feet above the forest fl oor on the uphill side of the tree. For determining breast height, the forest fl oor includes the duff layer that may be present, but does not include unincorporated woody debris that may rise above the ground line.
Doyle rule. A simple log rule or formula for estimating the board-foot volume of logs based on a 4-inch slabbing allowance to square the log. Th is rule is used in the Eastern and Southern United States.
Exports. Th e volume of roundwood utilized by mills outside the state where the timber was harvested.
Fine mill residue. Wood residue not suitable for chipping, such as sawdust and veneer clippings.
Forest land. Land at least 10 percent stocked with trees of any size, or formerly having had such tree cover, and not currently developed for nonforest use. (Note: Stocking is measured by comparing specifi ed standards with basal area and/or number of trees, age or size, and spacing.) Th e minimum area for classifi cation of forest land is 1 acre. Roadside, streamside, and shelterbelt strips of timber must have a crown width of at least 120 feet to qualify as

11
forest land. Unimproved roads and trails, streams or other bodies of water, or clearings in forest areas shall be classifi ed as forest if less than 120 feet wide.
Growing-stock removals. Th e growing-stock volume removed from timberland by harvesting industrial roundwood products. (Note: Includes sawtimber removals, poletimber removals, and logging residues.)
Growing-stock tree. A live timberland tree of commercial species that meets specifi ed standards of size, quality, and merchantability. (Note: Excludes rough, rotten, and dead trees.)
Growing-stock volume. Net volume of growing-stock trees 5.0 inches d.b.h. and larger, from 1 foot above the ground to a minimum 4.0-inch top diameter outside bark of the central stem or to the point where the central stem breaks into limbs.
Hardwoods. Dicotyledonous trees, usually broad-leaved and deciduous.
Harvest residues. Th e total net volume of unused portions of trees cut or killed by logging. (Note: Includes both logging residues and logging slash.)
Industrial fuelwood. A roundwood product, with or without bark, used to generate energy at manufacturing facilities and schools, correctional institutions, or electric generating plants.
Imports. Th e volume of roundwood delivered to a mill or group of mills in a specifi c state but harvested outside that state.
Industrial roundwood exports. Th e quantity of industrial roundwood harvested in a geographical area and transported to other geographical areas.
Industrial roundwood imports. Th e quantity of industrial roundwood received from other geographical areas.
Industrial roundwood products. Saw logs, pulpwood, veneer logs, poles, commercial posts, pilings, cooperage logs, particleboard bolts, shaving bolts, lath bolts, charcoal bolts, and chips from roundwood used for pulp or board products.
Industrial roundwood production. Th e quantity of industrial roundwood harvested in a geographic area plus all industrial roundwood exported to other geographical areas.
Industrial roundwood receipts. Th e quantity of industrial roundwood received by commercial mills in a geographic area plus all industrial roundwood imported from other geographical areas.
Industrial roundwood retained. Th e quantity of industrial roundwood harvested from and processed by commercial mills within the same geographical area.

12
International 1/4-inch rule. A log rule or formula for estimating the board-foot volume of logs, allowing ½ inch of taper for each 4-foot length and assuming ¼ inch of kerf. Th is rule is used as the U.S. Forest Service standard log rule in the Eastern United States.
Limbwood removals. Net volume of all portions of a tree other than the central stem (including forks, large limbs, tops, and stumps) harvested for industrial roundwood products.
Logging residue. Th e net volume of unused portions of the merchantable central stem of growing-stock trees cut or killed by logging.
Logging slash. Th e net volume of unused portions of the unmerchantable (non-growing stock) sections of trees cut or killed by logging.
Merchantable sections. Refers to sections of the central stem of growing-stock trees that meet either pulpwood or saw log specifi cations.
Net volume. Gross volume less deductions for rot, sweep, or other defects aff ecting use for roundwood products.
Noncommercial species. Trees species of typically small size, poor form, or inferior quality that normally do not develop into trees suitable for industrial roundwood products. Noncommercial species are listed in the volume tables as rough trees.
Nonforest land. Land that has never supported forests, and land formerly forested where use for timber management is precluded by development for other uses. (Note: Includes areas used for crops, active Christmas tree plantations, orchards, nurseries, improved pasture, residential areas, city parks, improved roads of any width and adjoining clearings, powerline clearings of any width, and 1- to 39.9-acre areas of water classifi ed by the Bureau of the Census as land.) If intermingled in forest areas, unimproved roads and nonforest strips must be more than 120 feet wide and more than 1 acre to qualify as nonforest land.
Nonforest land removals. Net volume of trees on nonforest lands harvested for industrial roundwood products.
Poletimber. A growing-stock tree at least 5.0 inches d.b.h. but smaller than sawtimber size (9.0 inches d.b.h. for softwoods, 11.0 inches d.b.h. for hardwoods).
Poletimber removals. Net volume in the merchantable central stem of poletimber trees harvested for industrial roundwood products.
Primary wood-using mills. Mills receiving roundwood or chips from roundwood for processing into products such as lumber, veneer, and pulp.
Primary wood-using mill residue. Wood materials (coarse and fi ne) and bark generated at manufacturing plants that process industrial roundwood into principal products. Th ese

13
residues include wood products obtained incidental to production of principal products and wood materials not utilized for some product.
Production. Th e quantity of roundwood material harvested in a geographic area plus all roundwood material exported to other geographical areas.
Receipts. Th e quantity of roundwood material received by commercial mills in a geographic area plus all roundwood material imported from other geographical areas.
Retained. Roundwood volume harvested from and processed by mills within the same state.
Rotten tree. A tree that does not meet regional merchantability standards because of excessive unsound cull.
Rough tree. A tree that does not meet regional merchantability standards because of excessive sound cull (includes forks, sweep and crook, and large branches or knots), including noncommercial tree species.
Roundwood. Logs, bolts, or other round sections cut from trees (including chips from roundwood).
Sapling. A live tree between 1.0 and 5.0 inches d.b.h.
Saw log portion. Th at portion of the central stem of sawtimber trees between the stump and the saw log top.
Saw log top. Th e point on the central stem of sawtimber trees above which a saw log cannot be produced. Th e minimum saw log top is 7.0 inches diameter outside bark for softwoods and 9.0 inches diameter outside bark for hardwoods.
Sawtimber removals. As used in Table 10, sawtimber removals refers to the net volume in the merchantable central stem of sawtimber-size trees harvested for industrial roundwood products. (Note: includes the saw log and upper stem portions of sawtimber-size trees.) When referring to the sawtimber volume removed from timberland as in Table 12 and 12a, sawtimber removals refers to the net volume in the saw log portion of sawtimber-size trees harvested for roundwood products or left on the ground as harvest residue, and is usually expressed in thousands of board feet (International 1/4-inch rule or Scribner rule).
Sawtimber tree. A growing-stock tree containing at least a 12-foot saw log or two noncontiguous saw logs 8 feet or longer, and meeting regional specifi cations for freedom from defect. Softwoods must be at least 9.0 inches d.b.h. and hardwoods must be at least 11.0 inches d.b.h.
Sawtimber volume. Net volume in the saw log portion of sawtimber trees.
14
Scribner rule. A log rule or formula for estimating the board-foot volume of logs based on diagrams of perfect circles, with 1 inch thick boards of varying 2 inch multiple widths, positioned in the circle to provide the best utilization, and allowing for ¼ inch of kerf. Th is rule is used in the Western United States.
Softwoods. Coniferous trees, usually evergreen, having needles or scale-like leaves.
Timber product output. Th e volume of roundwood products produced from an area’s forests.
Timberland. Forest land that is producing, or is capable of producing, in excess of 20 cubic feet per acre per year of industrial roundwood products under natural conditions, is not withdrawn from timber utilization by statute or administrative regulation, and is not associated with urban or rural development.
Tree. A woody perennial plant, typically large, with a single well-defi ned stem carrying a more or less defi nite crown; sometimes defi ned as attaining a minimum diameter of 3 inches (7.6 cm) and a minimum height of 15 feet (4.6 m) at maturity. For FIA, any plant on the tree list in the current fi eld manual is measured as a tree.
Upper stem portion. Th at portion of the central stem of sawtimber trees between the saw log top and the minimum top diameter of 4.0 inches outside bark, or to the point where the central stem breaks into limbs.

15
Common and Scientific Names of Tree Species by Species Group
Softwoods
Cedar/juniper Eastern redcedar Juniperus virginiana Rocky Mountain juniper Juniperus scopulorumSpruce White spurce Picea glaucaLodgepole pine Pinus contortaPonderosa pine Pinus ponderosaOther Pines Red pine Pinus resinosa White pine Pinus strobusDouglas-fi r Pseudotsuga menziesii
Hardwoods
Hard maple Black maple Acer nigrum Sugar maple Acer saccharumSoft maple Boxelder Acer negundo Red maple Acer rubrum Silver maple Acer saccharinumHackberry Celtis occidentalisAsh Green ash Fraxinus pennsylvanicaHoneylocust Gleditsia triacanthosBlack walnut Juglans nigraCottonwood Eastern cottonwood Populus deltoides Plains cottonwood Populus deltoides ssp. moniliferaAspen Quaking aspen Populus tremuloidesBur oak Quercus macrocarpaAmerican basswood Tilia americanaElm American elm Ulmus americana Siberian elm Ulmus pumila Slippery elm Ulmus rubra

16
17
Tables
Table 1.—Conversion factors from reported unit of measure to standard unit of measure (Th is table is in the Study Methods section.)
Table 2.—Number of active primary wood-using mills by mill type and survey year, South Dakota
Table 3.—Industrial roundwood receipts, in million cubic feet, by mill type, survey year, and hardwoods and softwoods, South Dakota
Table 4.—Industrial roundwood receipts, in thousand cubic feet, by species group and state of origin, South Dakota, 2009
Table 5.—Industrial roundwood production, in million cubic feet, by product, hardwoods and softwoods, and survey year, South Dakota
Table 6.—Industrial roundwood production, in thousand cubic feet, by species group, and destination, South Dakota, 2009
Table 7.—Industrial roundwood production, in thousand cubic feet, by Forest Inventory Unit, county, and species group, South Dakota, 2009
Table 8.—Industrial roundwood production by Forest Inventory Unit, species group, and type of product, South Dakota, 2009
Table 9.—Saw log receipts and production, in thousand board feet (International ¼-inch rule), by Forest Inventory Unit and species group, South Dakota, 2004 and 2009
Table 9a.—Saw log receipts and production, in thousand board feet (Scribner rule), by Forest Inventory Unit and species group, South Dakota, 2004 and 2009
Table 10.—Wood material harvested for industrial roundwood, in thousand cubic feet, by Forest Inventory Unit, source of material, and species group, South Dakota, 2009
Table 11.—Growing-stock removals from timberland for industrial roundwood, in thousand cubic feet, by Forest Inventory Unit, county, and species group, South Dakota, 2009
Table 12.—Sawtimber removals from timberland for industrial roundwood, in thousand board feet (International ¼-inch rule), by Forest Inventory Unit, county, and species group, South Dakota
Table 12a.—Sawtimber removals from timberland for industrial roundwood, in thousand board feet (Scribner rule), by Forest Inventory Unit, county, and species group, South Dakota, 2009
Table 13.—Harvest residue generated by industrial roundwood harvesting, in thousand cubic feet, by Forest Inventory Unit, county, and species group, South Dakota, 2009
Table 14.—Disposition of residues produced at primary wood-using mills, in thousand green tons, by Forest Inventory Unit, disposition, residue type, and softwoods and hardwoods, South Dakota, 2009
18
Tab
le 2
.—N
um
ber
of
acti
ve p
rim
ary
wo
od
-usin
g m
ills
by m
ill
typ
e a
nd
su
rvey
year,
So
uth
Dako
ta
Mill
type
and
mill
siz
e
Sur
vey
Year
1993
1999
2004
2009
Saw
mill
s
Larg
ea3
33
2
Med
ium
b3
32
2
Sm
allc
66
129
Tota
l12
1217
13
Oth
er m
ills
Par
ticle
boar
d1
11
1
Pos
t and
pol
es2
33
3
Oth
er m
ill ty
pesd
32
46
Tota
l6
68
10
Tota
l mill
s18
1825
23a A
nnua
l lum
ber
prod
uctio
n in
exc
ess
of 5
mill
ion
boar
d fe
et.
b A
nnua
l lum
ber
prod
uctio
n fr
om 1
mill
ion
to 5
mill
ion
boar
d fe
et.
c A
nnua
l lum
ber
prod
uctio
n le
ss th
an 1
mill
ion
boar
d fe
et.
d In
clud
es e
xcel
sior
/sha
ving
s, c
abin
log
mill
s, a
nd o
ther
mis
cella
neou
s pr
oduc
ts.

19
Tab
le 3
.—In
du
str
ial
rou
nd
wo
od
receip
ts, in
mil
lio
n c
ub
ic f
eet,
by m
ill
typ
e, su
rvey
ye
ar,
an
d
so
ftw
oo
ds a
nd
hard
wo
od
s, S
ou
th D
ako
ta
Sur
vey
Year
2004
- 2
009
% c
hang
eP
rodu
ct19
9319
9920
0420
09
ALL
SP
EC
IES
Saw
mill
s17
.921
.523
.024
.88%
Pos
t and
pol
e m
ills
0.0
0.2
0.3
0.9
205%
Oth
er m
illsa
1.0
1.0
1.6
0.3
-84%
To
tal
18.9
22.6
24.9
26.0
4%
SO
FT
WO
OD
S
Saw
mill
s17
.821
.222
.924
.78%
Pos
t and
pol
e m
ills
0.0
0.2
0.3
0.9
209%
Oth
er m
illsa
1.0
1.0
1.6
0.3
-84%
To
tal
18.9
22.4
24.8
25.9
4%
HA
RD
WO
OD
S
Saw
mill
s0.
10.
20.
10.
0-4
5%
Pos
t and
pol
e m
ills
--
--
0.0
--
--
Oth
er m
illsa
--
--
0.0
0.0
322%
To
tal
0.1
0.2
0.1
0.0
-46%
All
tab
le c
ells
with
out o
bse
rvat
ions
are
ind
icat
ed b
y --
. Ta
ble
val
ue o
f 0.0
ind
icat
es th
e vo
lum
e ro
und
s to
less
than
0.
1 m
illio
n cu
bic
feet
. Col
umns
and
row
s m
ay n
ot a
dd
to th
eir
tota
ls d
ue to
rou
ndin
g.
a In
clud
es m
ills
prod
ucin
g ex
cels
ior,
pulp
woo
d, v
enee
r, ca
bin
logs
, etc
.

20
Tab
le 4
.—In
du
str
ial
rou
nd
wo
od
receip
ts, in
th
ou
san
d c
ub
ic f
eet,
by s
pecie
s g
rou
p a
nd
sta
te o
f o
rig
in,
So
uth
Dako
ta, 20
09
Sta
te o
f orig
in
Spe
cies
gro
upTo
tal
Min
neso
taM
onta
naN
ebra
ska
Sou
thD
akot
aW
yom
ing
Sof
twoo
ds
Ced
ar/ju
nipe
ra18
--
--
98
--
Dou
glas
-fir
4 -
- 4
--
--
0
Lodg
epol
e pi
ne40
--
33 -
- -
- 6
Pon
dero
sa p
ine
25,5
74 -
- 66
52
20,8
374,
069
Oth
er p
ines
11
--
--
--
--
Spr
uce
276
--
--
--
274
1
Tota
l25
,912
170
211
21,1
204,
077
Har
dwoo
ds
Ash
2 -
- -
- -
- 2
--
Bla
ck w
alnu
t3
--
--
--
3 -
-
Cot
tonw
ood
34 -
- -
- -
- 34
--
Bur
oak
1 -
- -
- -
- 0
1
Tota
l41
--
--
--
401
Sta
te to
tal
25,9
521
702
1121
,160
4,07
8
All
tab
le c
ells
with
out o
bse
rvat
ions
are
ind
icat
ed b
y --
. Ta
ble
val
ue o
f 0 in
dic
ates
the
volu
me
roun
ds
to le
ss th
an 1
thou
sand
cu
bic
feet
. Col
umns
and
row
s m
ay n
ot a
dd
to th
eir
tota
ls d
ue to
rou
ndin
g.
a In
clud
es e
aste
rn r
edce
dar
and
Roc
ky M
ount
ain
juni
per.

21
Tab
le 5
.-—
Ind
ustr
ial
rou
nd
wo
od
pro
du
cti
on
, in
mil
lio
n c
ub
ic f
eet,
by p
rod
uc
t, s
oft
wo
od
s a
nd
hard
wo
od
s, an
d s
urv
ey y
ear,
So
uth
Dako
ta
Pro
duct
Sur
vey
Year
2004
- 2
009
% c
hang
e19
9319
9920
0420
09
ALL
SP
EC
IES
Saw
logs
16.4
20.0
19.9
23.6
18%
Cab
in lo
gs -
- 0.
00.
20.
1-5
4%
Pos
ts0.
00.
20.
30.
918
9%
Oth
er p
rodu
ctsa
0.9
0.9
1.3
0.1
-91%
Tota
l17
.221
.121
.824
.713
%
SO
FT
WO
OD
S
Saw
logs
16.2
19.7
19.8
23.5
19%
Cab
in lo
gs -
- 0.
00.
20.
1-5
4%
Pos
ts0.
00.
20.
30.
919
2%
Oth
er p
rodu
ctsa
0.9
0.9
1.3
0.1
-92%
Tota
l17
.020
.821
.624
.614
%
HA
RD
WO
OD
S
Saw
logs
0.2
0.3
0.1
0.1
-58%
Cab
in lo
gs -
- -
- -
- -
- --
Pos
ts -
- -
- 0.
0 -
- --
Oth
er p
rodu
ctsa
--
--
--
0.0
--
Tota
l0.
20.
30.
10.
1-5
8%
All
tab
le c
ells
with
out o
bse
rvat
ions
are
ind
icat
ed b
y --
. Ta
ble
val
ue o
f 0.0
ind
icat
es th
e vo
lum
e ro
und
s to
less
th
an 0
.1 m
illio
n cu
bic
feet
. Col
umns
and
row
s m
ay n
ot a
dd
to th
eir
tota
ls d
ue to
rou
ndin
g.
a In
clud
es m
ills
prod
ucin
g ex
cels
ior,
pulp
woo
d, v
enee
r, po
les,
and
oth
er m
isce
llane
ous
prod
ucts
.
22
Tab
le 6
.—In
du
str
ial
rou
nd
wo
od
pro
du
cti
on
, in
th
ou
san
d c
ub
ic f
eet,
by s
pecie
s g
rou
p a
nd
de
sti
na
tio
n,
So
uth
Dako
ta, 20
09
Spe
cies
gro
upTo
tal
Des
tinat
ion
Min
neso
taM
onta
naN
ebra
ska
Sou
th
Dak
ota
Wyo
min
g
Sof
twoo
ds
Ced
ar/ju
nipe
ra8
--
--
--
8 -
-
Pon
dero
sa p
ine
24,3
16 -
- 16
3 -
- 20
,837
3,31
6
Spr
uce
312
--
--
--
274
38
Tota
l24
,636
--
163
--
21,1
203,
354
Har
dwoo
ds
Ash
41
--
--
2 -
-
Bla
ck w
alnu
t4
0 -
- -
- 3
--
Cot
tonw
ood
442
--
834
--
Elm
00
--
--
--
--
Har
d m
aple
00
--
--
--
--
Sof
t map
le0
0 -
- -
- -
- -
-
Bur
oak
10
--
00
--
Tota
l53
4 -
- 8
40 -
-
Gra
nd T
otal
24,6
894
163
821
,160
3,35
4
All
tab
le c
ells
with
out o
bse
rvat
ions
are
ind
icat
ed b
y --
. Ta
ble
val
ue o
f 0 in
dic
ates
the
volu
me
roun
ds
to le
ss th
an 1
thou
sand
cu
bic
feet
. Col
umns
and
row
s m
ay n
ot a
dd
to th
eir
tota
ls d
ue to
rou
ndin
g.
a In
clud
es e
aste
rn r
edce
dar
and
Roc
ky M
ount
ain
juni
per.
23
Tab
le 7
.—In
du
str
ial ro
un
dw
oo
d p
rod
ucti
on
, in
th
ou
sa
nd
cu
bic
fe
et,
by
Fo
res
t In
ve
nto
ry U
nit
, c
ou
nty
, a
nd
sp
ec
ies
gro
up
, S
ou
th D
ako
ta, 2
00
9
Spe
cies
gro
up
Sof
twoo
dsH
ardw
oods
For
est I
nven
tory
Uni
t and
cou
nty
All
spec
ies
Ced
ar/
juni
pera
Pon
dero
sapi
neS
pruc
eTo
tal
softw
oods
Ash
Bla
ck
wal
nut
Cot
tonw
ood
Elm
Har
d m
aple
Sof
t map
leB
ur o
akTo
tal
hard
woo
ds
Eas
tern
Bro
okin
gs1
--
--
--
--
01
1 -
- -
- 0
--
1
Cla
y8
--
--
--
--
--
--
8 -
- -
- -
- -
- 8
Deu
el1
--
--
--
--
00
1 -
- -
- 0
--
1
Gre
gory
65
--
--
50
--
1 -
- -
- -
- 0
1
Lake
1 -
- -
- -
- -
- 0
--
1 -
- -
- -
- -
- 1
Linc
oln
14 -
- -
- -
- -
- 1
112
--
0 -
- 0
14
McC
ook
1 -
- -
- -
- -
- 0
--
1 -
- -
- -
- -
- 1
Min
neha
ha6
--
--
--
--
12
30
00
--
6
Moo
dy18
--
--
--
--
11
16 -
- -
- 0
--
18
Todd
33 -
- 33
--
33 -
- -
- -
- -
- -
- -
- 0
0
Trip
p0
--
--
--
--
--
--
--
--
--
--
00
Turn
er1
--
--
--
--
0 -
- 1
--
--
--
--
1
Tota
l89
533
--
374
443
00
01
52
Wes
tern
But
te96
--
951
96 -
- -
- -
- -
- -
- -
- -
- -
-
Cus
ter
3,52
0 -
- 3,
498
223,
520
--
--
--
--
--
--
--
--
Fall
Riv
er16
--
16 -
- 16
--
--
--
--
--
--
--
--
Law
renc
e8,
049
--
7,88
216
88,
049
--
--
--
--
--
--
--
--
Mea
de51
2 -
- 51
01
512
--
--
--
--
--
--
--
--
Pen
ning
ton
12,4
074
12,2
8212
012
,406
--
--
1 -
- -
- -
- -
- 1
To
tal
24,6
004
24,2
8431
224
,599
--
--
1 -
- -
- -
- -
- 1
Sta
te to
tal
24,6
898
24,3
1631
224
,636
44
440
00
153
All
tab
le c
ells
with
out o
bse
rvat
ions
are
ind
icat
ed b
y --
. Ta
ble
val
ue o
f 0 in
dic
ates
the
volu
me
roun
ds
to le
ss th
an 1
thou
sand
cub
ic fe
et. C
olum
ns a
nd r
ows
may
not
ad
d to
thei
r to
tals
due
to r
ound
ing
.a In
clud
es e
aste
rn r
edce
dar
and
Roc
ky M
ount
ain
juni
per.

24
Tab
le 8
.—In
du
str
ial
rou
nd
wo
od
pro
du
cti
on
by
Fo
res
t S
urv
ey
Un
it, s
pe
cie
s g
rou
p, a
nd
ty
pe
of
pro
du
ct,
So
uth
Da
ko
ta, 2
00
9
All
Uni
ts
Type
of p
rodu
ct
All
prod
ucts
Saw
logs
Pos
ts a
nd p
oles
Oth
er p
rodu
ctsa
Spe
cies
gro
upM
CF
b
Inte
rnat
iona
l¼
-inch
MB
Fc
Scr
ibne
rM
BF
cM
CF
bM
pie
cesd
MC
Fb
MC
Fb
Sof
twoo
ds
Ced
ar/ju
nipe
re8
1110
2 -
- -
- 6
Pon
dero
sa p
ine
24,3
1614
2,49
213
1,93
723
,227
1,37
189
119
8
Spr
uce
312
1,62
41,
504
312
--
--
--
Tota
l24
,636
144,
127
133,
451
23,5
411,
371
891
204
Har
dwoo
ds
Ash
421
204
--
--
--
Bla
ck w
alnu
t4
2119
4 -
- -
- -
-
Cot
tonw
ood
4424
622
843
--
--
1
Elm
00
00
--
--
--
Har
d m
aple
02
20
--
--
--
Sof
t map
le0
11
0 -
- -
- -
-
Bur
oak
14
31
--
--
--
Tota
l53
296
274
52 -
- -
- 1
Sta
te to
tal
24,6
8914
4,42
313
3,72
523
,593
1,37
189
120
5
Eas
tern
Uni
t
Sof
twoo
ds
Ced
ar/ju
nipe
re5
1110
2 -
- -
- 3
Pon
dero
sa p
ine
3310
194
17 -
- -
- 16
Tota
l37
112
104
19 -
- -
- 19
Har
dwoo
ds
Ash
421
204
--
--
--
Bla
ck w
alnu
t4
2119
4 -
- -
- -
-
Cot
tonw
ood
4324
622
843
--
--
--
Elm
00
00
--
--
--
Har
d m
aple
02
20
--
--
--
Sof
t map
le0
11
0 -
- -
- -
-
Bur
oak
14
31
--
--
--
Tota
l52
296
274
52 -
- -
- -
-
Uni
t tot
al89
408
378
70 -
- -
- 19
25
Wes
tern
Uni
t
Type
of p
rodu
ct
All
prod
ucts
Saw
logs
Pos
ts a
nd p
oles
Oth
er p
rodu
ctsa
Spe
cies
gro
upM
CF
b
Inte
rnat
iona
l¼
-inch
MB
Fc
Scr
ibne
rM
BF
cM
CF
bM
pie
cesd
MC
Fb
MC
Fb
Sof
twoo
ds
Ced
ar/ju
nipe
re4
--
--
4
Pon
dero
sa p
ine
24,2
8414
2,39
113
1,84
323
,211
1,37
189
118
2
Spr
uce
312
1,62
41,
504
312
--
--
--
Tota
l24
,599
144,
015
133,
347
23,5
231,
371
891
185
Har
dwoo
ds
Cot
tonw
ood
1 -
- -
- -
- -
- -
- 1
Tota
l1
--
--
--
--
--
1
Uni
t tot
al24
,600
144,
015
133,
347
23,5
231,
371
891
186
All
tab
le c
ells
with
out o
bse
rvat
ions
are
ind
icat
ed b
y --
. Ta
ble
val
ue o
f 0 in
dic
ates
the
volu
me
roun
ds
to le
ss th
an 1
uni
t. C
olum
ns a
nd r
ows
may
not
ad
d to
thei
r to
tals
due
to
roun
din
g.
a In
clud
es e
xcel
sior
, pul
pwoo
d, c
abin
logs
, and
oth
er m
isce
llane
ous
prod
ucts
.b T
hous
and
cubi
c fe
et.
c T
hous
and
boar
d fe
et.
d T
hous
and
piec
es.
e In
clud
es e
aste
rn r
edce
dar
and
Roc
ky M
ount
ain
juni
per.

26
Tab
le 9
.—S
aw
lo
g r
eceip
ts a
nd
pro
du
cti
on
, in
th
ou
san
d b
oard
feet
(In
tern
ati
on
al
¼-i
nch
ru
le),
by
sp
ecie
s g
rou
p, S
ou
th D
ako
ta, 20
04 a
nd
20
09
Rec
eipt
sP
rodu
ctio
n
Spe
cies
gro
up20
0420
09P
erce
ntC
hang
e20
0420
09P
erce
ntC
hang
e
Sof
twoo
ds
Ced
ar/ju
nipe
ra30
23-2
3%14
11-2
1%
Pon
dero
sa p
ine
135,
613
150,
811
11%
115,
500
142,
492
23%
Spr
uce
4,79
61,
428
-70%
4,99
21,
624
-67%
Tota
l14
0,43
915
2,26
38%
120,
506
144,
127
20%
Har
dwoo
ds
Ash
1614
-12%
1321
62%
Asp
en5
--
--
5 -
- -
-
Bas
swoo
d0
--
--
0 -
- -
-
Bla
ck w
alnu
t12
1850
%8
2115
4%
Cot
tonw
ood
349
190
-46%
648
246
-62%
Elm
14 -
- -
- 14
0-9
8%
Hac
kber
ry0
--
--
0 -
- -
-
Hon
eylo
cust
1 -
- -
- 1
--
--
Har
d m
aple
0 -
- -
- 0
271
7%
Sof
t map
le -
- -
- -
- -
- 1
--
Bur
oak
121
-91%
124
-71%
Tota
l41
222
3-4
6%70
229
6-5
8%
All
spec
ies
140,
851
152,
486
8%12
1,20
814
4,42
319
%
All
tab
le c
ells
with
out o
bse
rvat
ions
are
ind
icat
ed b
y --
. Ta
ble
val
ue o
f 0 in
dic
ates
the
volu
me
roun
ds
to le
ss th
an 1
th
ousa
nd b
oard
feet
. Col
umns
and
row
s m
ay n
ot a
dd
to th
eir
tota
ls d
ue to
rou
ndin
g.
a In
clud
es e
aste
rn r
edce
dar
and
Roc
ky M
ount
ain
juni
per.

27
Tab
le 9
a.—
Saw
lo
g r
eceip
ts a
nd
pro
du
cti
on
, in
th
ou
san
d b
oard
feet
(Scri
bn
er
rule
), b
y s
pe
cie
s
gro
up
, S
ou
th D
ako
ta, 20
04 a
nd
20
09 Rec
eipt
sP
rodu
ctio
n
Spe
cies
gro
up20
0420
09P
erce
ntC
hang
e20
0420
09P
erce
ntC
hang
e
Sof
twoo
ds
Ced
ar/ju
nipe
ra28
21-2
3%13
10-2
1%
Pon
dero
sa p
ine
125,
568
139,
640
11%
106,
944
131,
937
23%
Spr
uce
4,44
11,
322
-70%
4,62
21,
504
-67%
Tota
l13
0,03
614
0,98
48%
111,
580
133,
451
20%
Har
dwoo
ds
Ash
1513
-12%
1220
62%
Asp
en5
--
--
5 -
- -
-
Bas
swoo
d0
--
--
0 -
- -
-
Bla
ck w
alnu
t11
1750
%8
1915
4%
Cot
tonw
ood
323
176
-46%
600
228
-62%
Elm
13 -
- -
- 13
0-9
8%
Hac
kber
ry0
--
--
0 -
- -
-
Hon
eylo
cust
1 -
- -
- 1
--
--
Har
d m
aple
0 -
- -
- 0
271
7%
Sof
t map
le -
- -
- -
- -
- 1
--
Bur
oak
121
-91%
123
-71%
Tota
l38
120
7-4
6%65
027
4-5
8%
All
spec
ies
130,
417
141,
191
8%11
2,23
013
3,72
519
%A
ll ta
ble
cel
ls w
ithou
t ob
serv
atio
ns a
re in
dic
ated
by
-- .
Tab
le v
alue
of 0
ind
icat
es th
e vo
lum
e ro
und
s to
less
than
1
thou
sand
boa
rd fe
et. C
olum
ns a
nd r
ows
may
not
ad
d to
thei
r to
tals
due
to r
ound
ing
.a In
clud
es e
aste
rn r
edce
dar
and
Roc
ky M
ount
ain
juni
per.

28
Ta
ble
10.—
Wo
od
mate
rial h
arv
este
d f
or
ind
ustr
ial ro
un
dw
oo
d, in
th
ou
san
d c
ub
ic f
eet,
by F
ore
st
Inven
tory
Un
it, so
urc
e o
f m
ate
rial, a
nd
sp
ecie
s g
rou
p, S
ou
th D
ako
ta, 20
09
a
All
Uni
ts
Sou
rce
of m
ater
ial
Gro
win
g st
ock
Non
-gro
win
g st
ock
Tota
lw
ood
mat
eria
lus
ed
Tota
lw
ood
mat
eria
lno
t use
d
Tota
lw
ood
mat
eria
lha
rves
ted
Use
d fo
r pr
oduc
tsLo
ggin
gre
sidu
e(n
ot u
sed)
Tota
lgr
owin
gst
ock
Use
d fo
r pr
oduc
tsLo
ggin
gsl
ash
(not
use
d)
Tota
l non
-gr
owin
gst
ock
Spe
cies
gro
upS
awtim
ber
Pol
e-tim
ber
Lim
bwoo
dS
aplin
gsC
ull
tree
sD
ead
tree
s
Sof
twoo
ds
Ced
ar/ju
nipe
rb5.
72.
50.
78.
90.
1 -
- 0.
0 -
- 0.
60.
78.
31.
39.
5
Pon
dero
sa p
ine
23,0
12.7
803.
31,
801.
825
,617
.826
.222
6.3
--
246.
78,
500.
28,
999.
424
,315
.210
,302
.034
,617
.2
Spr
uce
290.
19.
78.
830
8.6
12.0
--
0.2
--
64.3
76.5
312.
073
.138
5.1
Tota
l23
,308
.481
5.6
1,81
1.3
25,9
35.3
38.3
226.
30.
224
6.7
8,56
5.1
9,07
6.5
24,6
35.5
10,3
76.4
35,0
11.8
Har
dwoo
ds
Ash
3.4
0.0
0.5
3.9
0.0
--
0.1
--
0.9
1.0
3.5
1.4
4.9
Bla
ck w
alnu
t3.
20.
20.
74.
10.
1 -
- 0.
1 -
- 1.
31.
53.
62.
05.
6
Cot
tonw
ood
39.4
2.9
8.4
50.7
1.2
--
0.9
--
15.5
17.5
44.4
23.9
68.2
Elm
0.0
0.0
0.0
0.1
0.0
--
0.0
--
0.0
0.0
0.1
0.0
0.1
Har
d m
aple
0.4
0.0
0.1
0.5
0.0
--
0.0
--
0.1
0.1
0.4
0.2
0.6
Sof
t map
le0.
20.
00.
00.
20.
0 -
- 0.
0 -
- 0.
10.
10.
20.
10.
3
Bur
oak
0.6
0.0
0.1
0.7
0.0
--
0.0
--
0.2
0.2
0.6
0.2
0.8
Tota
l47
.33.
29.
860
.31.
3 -
- 1.
0 -
- 18
.020
.352
.827
.880
.6
Sta
te to
tal
23,3
55.7
818.
81,
821.
025
,995
.639
.622
6.3
1.2
246.
78,
583.
19,
096.
924
,688
.310
,404
.135
,092
.4
Eas
tern
Uni
t
Sou
rce
of m
ater
ial
Gro
win
g st
ock
Non
-gro
win
g st
ock
Tota
lw
ood
mat
eria
lus
ed
Tota
lw
ood
mat
eria
lno
t use
d
Tota
lw
ood
mat
eria
lha
rves
ted
Use
d fo
r pr
oduc
tsLo
ggin
gre
sidu
e(n
ot u
sed)
Tota
lgr
owin
gst
ock
Use
d fo
r pr
oduc
tsLo
ggin
gsl
ash
(not
use
d)
Tota
l non
-gr
owin
gst
ock
Spe
cies
gro
upS
awtim
ber
Pol
e-tim
ber
Lim
bwoo
dS
aplin
gsC
ull
tree
sD
ead
tree
s
Sof
twoo
ds
Ced
ar/ju
nipe
rb3.
41.
10.
34.
80.
1 -
- 0.
0 -
- 0.
50.
64.
60.
85.
4
Pon
dero
sa p
ine
31.8
0.3
2.5
34.7
--
--
--
0.3
11.8
12.1
32.5
14.3
46.8
Tota
l35
.31.
42.
839
.50.
1 -
- 0.
00.
312
.212
.737
.115
.152
.2
Har
dwoo
ds
Ash
3.4
0.0
0.5
3.9
0.0
--
0.1
--
0.9
1.0
3.5
1.4
4.9
Bla
ck w
alnu
t3.
20.
20.
74.
10.
1 -
- 0.
1 -
- 1.
31.
53.
62.
05.
6
Cot
tonw
ood
38.8
2.5
8.3
49.6
1.2
--
0.9
--
15.5
17.5
43.4
23.8
67.1
Elm
0.0
0.0
0.0
0.1
0.0
--
0.0
--
0.0
0.0
0.1
0.0
0.1
Har
d m
aple
0.4
0.0
0.1
0.5
0.0
--
0.0
--
0.1
0.1
0.4
0.2
0.6
Sof
t map
le0.
20.
00.
00.
20.
0 -
- 0.
0 -
- 0.
10.
10.
20.
10.
3
Bur
oak
0.6
0.0
0.1
0.7
0.0
--
0.0
--
0.2
0.2
0.6
0.2
0.8
Tota
l46
.72.
89.
759
.21.
3 -
- 1.
0 -
- 18
.020
.351
.827
.779
.5
Sta
te to
tal
82.0
4.1
12.5
98.6
1.4
--
1.0
0.3
30.2
33.0
88.9
42.7
131.
6

29
Wes
tern
Uni
t
Sou
rce
of m
ater
ial
Gro
win
g st
ock
Non
-gro
win
g st
ock
Tota
lw
ood
mat
eria
lus
ed
Tota
lw
ood
mat
eria
lno
t use
d
Tota
lw
ood
mat
eria
lha
rves
ted
Use
d fo
r pr
oduc
tsLo
ggin
gre
sidu
e(n
ot u
sed)
Tota
lgr
owin
gst
ock
Use
d fo
r pr
oduc
tsLo
ggin
gsl
ash
(not
use
d)
Tota
l non
-gr
owin
gst
ock
Spe
cies
gro
upS
awtim
ber
Pol
e-tim
ber
Lim
bwoo
dS
aplin
gsC
ull
tree
sD
ead
tree
s
Sof
twoo
ds
Ced
ar/ju
nipe
rb2.
21.
50.
44.
1 -
- -
- -
- -
- 0.
10.
13.
70.
54.
1
Pon
dero
sa p
ine
22,9
80.8
803.
01,
799.
325
,583
.226
.222
6.3
--
246.
48,
488.
48,
987.
324
,282
.710
,287
.834
,570
.4
Spr
uce
290.
19.
78.
830
8.6
12.0
--
0.2
--
64.3
76.5
312.
073
.138
5.1
Tota
l23
,273
.181
4.2
1,80
8.5
25,8
95.8
38.3
226.
30.
224
6.4
8,55
2.8
9,06
3.8
24,5
98.4
10,3
61.3
34,9
59.7
Har
dwoo
ds -
- -
- -
- -
- -
- -
- -
- -
- -
- -
- -
- -
- -
-
Cot
tonw
ood
0.6
0.4
0.1
1.1
--
--
--
--
0.0
0.0
1.0
0.1
1.1
Tota
l0.
60.
40.
11.
1 -
- -
- -
- -
- 0.
00.
01.
00.
11.
1
Sta
te to
tal
23,2
73.7
814.
61,
808.
625
,896
.938
.322
6.3
0.2
246.
48,
552.
89,
063.
924
,599
.410
,361
.434
,960
.8
All
tab
le c
ells
with
out o
bse
rvat
ions
are
ind
icat
ed b
y --
. Ta
ble
val
ue o
f 0 in
dic
ates
the
volu
me
roun
ds
to le
ss th
an 0
.1 th
ousa
nd c
ubic
feet
. Col
umns
and
row
s m
ay n
ot a
dd
to th
eir
tota
ls d
ue to
rou
ndin
g.
a B
ased
on
fact
ors
obta
ined
from
reg
iona
l util
izat
ion
stud
ies.
b In
clud
es e
aste
rn r
edce
dar
and
Roc
ky M
ount
ain
juni
per.

30
Tab
le 1
1.—
Gro
win
g-s
tock r
em
ovals
fro
m t
imb
erl
an
d f
or
ind
us
tria
l ro
un
dw
oo
d p
rod
uc
tio
n, in
th
ou
sa
nd
cu
bic
fe
et,
by
Fo
res
t In
ve
nto
ry U
nit
, c
ou
nty
, a
nd
sp
ec
ies
gro
up
,
So
uth
Dako
ta, 20
09
Spe
cies
gro
up
Sof
twoo
dsH
ardw
oods
For
est I
nven
tory
Uni
t and
cou
nty
All
spec
ies
Ced
ar/
juni
pera
Pon
dero
sapi
neS
pruc
eTo
tal
softw
oods
Ash
Bla
ckw
alnu
tC
otto
n-w
ood
Elm
Har
dm
aple
Sof
tm
aple
Bur
oak
Tota
lha
rdw
oods
Eas
tern
Bro
okin
gs2
-- -
- -
- -
-0
11
----
0--
2
Cla
y9
-- -
- -
- -
---
--
9--
----
--9
Deu
el1
-- -
- -
- -
-0
01
----
0--
1
Gre
gory
65
--
--
50
--
1--
----
01
Lake
1--
--
--
--
0 -
- 1
----
----
1
Linc
oln
16--
--
--
--
11
14--
0--
016
McC
ook
1--
--
--
--
0 -
- 1
----
----
1
Min
neha
ha6
-- -
- -
- -
-1
23
00
0--
6
Moo
dy20
-- -
- -
- -
-1
119
-- -
- 0
--20
Todd
35--
35 -
-35
-- -
- -
---
----
00
Trip
p0
-- -
- -
- -
---
--
--
----
--0
0
Turn
er1
-- -
- -
- -
-0
--
1--
----
--
1
Tota
l99
535
--
394
450
00
01
59
Wes
tern
But
te10
2--
101
110
2--
--
--
----
----
--
Cus
ter
3,59
7--
3,57
521
3,59
7--
--
--
----
----
--
Fall
Riv
er17
--17
--
17--
--
--
----
----
--
Law
renc
e8,
559
--8,
393
166
8,55
9--
--
--
----
----
--
Mea
de54
5--
544
154
5--
--
--
----
----
--
Pen
ning
ton
13,0
764
12,9
5211
913
,075
-- -
- 1
----
----
1
Tota
l25
,897
425
,583
309
25,8
96--
--
1--
----
--1
Sta
te to
tal
25,9
969
25,6
1830
925
,935
44
510
00
160
All
tab
le c
ells
with
out o
bse
rvat
ions
are
ind
icat
ed b
y --
. Ta
ble
val
ue o
f 0 in
dic
ates
the
volu
me
roun
ds
to le
ss th
an 1
thou
sand
cub
ic fe
et. C
olum
ns a
nd r
ows
may
not
ad
d to
thei
r to
tals
due
to r
ound
ing
.a In
clud
es e
aste
rn r
edce
dar
and
Roc
ky M
ount
ain
juni
per.
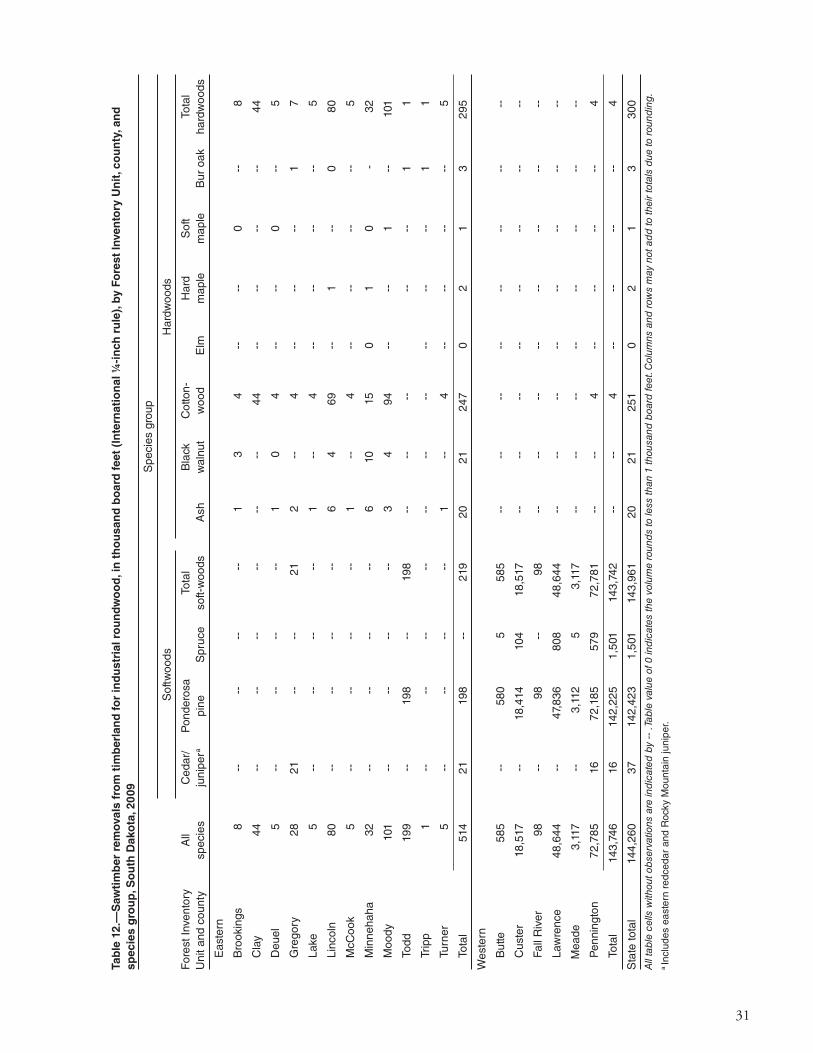
31
Tab
le 1
2.—
Saw
tim
ber
rem
ovals
fro
m t
imb
erl
an
d f
or
ind
us
tria
l ro
un
dw
oo
d, in
th
ou
sa
nd
bo
ard
fe
et
(In
tern
ati
on
al
¼-i
nch
ru
le),
by
Fo
res
t In
ve
nto
ry U
nit
, c
ou
nty
, a
nd
sp
ecie
s g
rou
p, S
ou
th D
ako
ta, 20
09
Spe
cies
gro
up
Sof
twoo
dsH
ardw
oods
For
est I
nven
tory
Uni
t and
cou
nty
All
spec
ies
Ced
ar/
juni
pera
Pon
dero
sapi
neS
pruc
eTo
tal
soft-
woo
dsA
shB
lack
wal
nut
Cot
ton-
woo
dE
lmH
ard
map
leS
oft
map
leB
ur o
akTo
tal
hard
woo
ds
Eas
tern
Bro
okin
gs8
-- -
- -
- -
-1
34
----
0--
8
Cla
y44
-- -
- -
- -
- -
- -
-44
----
----
44
Deu
el5
-- -
- -
- -
-1
04
----
0--
5
Gre
gory
2821
--
--
212
--
4--
----
17
Lake
5--
--
--
--
1 -
-4
----
----
5
Linc
oln
80--
--
--
--
64
69--
1--
080
McC
ook
5--
--
--
--
1 -
-4
----
----
5
Min
neha
ha32
-- -
- -
- -
-6
1015
01
0 -
32
Moo
dy10
1--
--
--
--
34
94--
--1
--10
1
Todd
199
--19
8 -
-19
8 -
- -
- -
- --
--1
1
Trip
p1
-- -
- -
- -
- -
- -
- -
- --
----
11
Turn
er5
-- -
- -
- -
-1
--
4--
----
--5
Tota
l51
421
198
--
219
2021
247
02
13
295
Wes
tern
But
te58
5--
580
558
5 -
- -
- -
- --
----
-- -
-
Cus
ter
18,5
17--
18,4
1410
418
,517
--
--
--
----
----
--
Fall
Riv
er98
--98
--
98 -
- -
- -
- --
----
-- -
-
Law
renc
e48
,644
--47
,836
808
48,6
44 -
- -
- -
- --
----
-- -
-
Mea
de3,
117
--3,
112
53,
117
--
--
--
----
----
--
Pen
ning
ton
72,7
8516
72,1
8557
972
,781
--
--
4--
----
--4
Tota
l14
3,74
616
142,
225
1,50
114
3,74
2 -
- -
-4
----
----
4
Sta
te to
tal
144,
260
3714
2,42
31,
501
143,
961
2021
251
02
13
300
All
tab
le c
ells
with
out o
bse
rvat
ions
are
ind
icat
ed b
y --
. Ta
ble
val
ue o
f 0 in
dic
ates
the
volu
me
roun
ds
to le
ss th
an 1
thou
sand
boa
rd fe
et. C
olum
ns a
nd r
ows
may
not
ad
d to
thei
r to
tals
due
to r
ound
ing
.a In
clud
es e
aste
rn r
edce
dar
and
Roc
ky M
ount
ain
juni
per.

32
Tab
le 1
2a.—
Saw
tim
ber
rem
ovals
fro
m t
imb
erl
an
d f
or
ind
us
tria
l ro
un
dw
oo
d, in
th
ou
sa
nd
bo
ard
fe
et
(Sc
rib
ne
r ru
le),
by
Fo
res
t In
ve
nto
ry U
nit
, c
ou
nty
, a
nd
sp
ec
ies
gro
up
, S
ou
th D
ako
ta, 20
09
Spe
cies
gro
up
Sof
twoo
dsH
ardw
oods
For
est I
nven
tory
Uni
t and
cou
nty
All
spec
ies
Ced
ar/
juni
pera
Pon
dero
sapi
neS
pruc
eTo
tal
softw
oods
Ash
Bla
ckw
alnu
tC
otto
n-w
ood
Elm
Har
dm
aple
Sof
tm
aple
Bur
oak
Tota
lha
rdw
oods
Eas
tern
Uni
t
Bro
okin
gs7
-- -
- -
- -
-0
34
--
--0
--7
Cla
y41
-- -
- -
- -
- -
- -
-41
--
----
--41
Deu
el5
-- -
- -
- -
-1
04
--
--0
--5
Gre
gory
2619
--
--
191
--
4 -
- --
--1
6
Lake
5--
--
--
--
1 -
-4
--
----
--5
Linc
oln
74--
--
--
--
53
64 -
- 1
--0
74
McC
ook
5--
--
--
--
1 -
-4
--
----
--5
Min
neha
ha30
-- -
- -
- -
-5
914
01
0--
30
Moo
dy94
-- -
- -
- -
-3
387
--
--0
--94
Todd
184
--18
3 -
-18
3 -
- -
- -
- -
- --
--1
1
Trip
p1
-- -
- -
- -
- -
- -
- -
- -
- --
--1
1
Turn
er5
-- -
- -
- -
-1
--
4 -
- --
----
5
Tota
l47
619
183
--
203
1919
229
02
13
273
Wes
tern
Uni
t
But
te54
1--
537
554
1 -
- -
- -
- -
- --
----
--
Cus
ter
17,1
46--
17,0
5096
17,1
46 -
- -
- -
- -
- --
----
--
Fall
Riv
er91
--91
--
91 -
- -
- -
- -
- --
----
--
Law
renc
e45
,041
--44
,293
748
45,0
41 -
- -
- -
- -
- --
----
--
Mea
de2,
886
--2,
882
52,
886
--
--
--
--
----
-- -
-
Pen
ning
ton
67,3
9415
66,8
3853
767
,390
--
--
4 -
- --
----
4
Tota
l13
3,09
815
131,
690
1,39
013
3,09
4 -
- -
-4
--
----
--4
Sta
te to
tal
133,
574
3413
1,87
31,
390
133,
297
1919
233
02
13
277
All
tab
le c
ells
with
out o
bse
rvat
ions
are
ind
icat
ed b
y --
. Ta
ble
val
ue o
f 0 in
dic
ates
the
volu
me
roun
ds
to le
ss th
an 1
thou
sand
boa
rd fe
et. C
olum
ns a
nd r
ows
may
not
ad
d to
thei
r to
tals
due
to r
ound
ing
.a In
clud
es e
aste
rn r
edce
dar
and
Roc
ky M
ount
ain
juni
per.

33
Tab
le 1
3.—
Harv
est
resid
ue g
en
era
ted
by i
nd
ustr
ial
rou
nd
wo
od
ha
rve
sti
ng
, in
th
ou
sa
nd
cu
bic
fe
et,
by
Fo
res
t In
ven
tory
Un
it, c
ou
nty
, a
nd
sp
ec
ies
gro
up
, S
ou
th D
ako
ta,
20
09
Spe
cies
gro
up
Sof
twoo
dsH
ardw
oods
For
est I
nven
tory
Uni
t and
cou
nty
All
spec
ies
Ced
ar/
juni
pera
Pon
dero
sapi
neS
pruc
eTo
tal
softw
oods
Ash
Bla
ckw
alnu
tC
otto
n-w
ood
Elm
Har
dm
aple
Sof
tm
aple
Bur
oak
Tota
lha
rdw
oods
Eas
tern
Bro
okin
gs1
--
--
--
--
00
0 -
- -
- 0
--
1
Cla
y4
--
--
--
--
--
--
4 -
- -
- -
- -
- 4
Deu
el0
--
--
--
--
00
0 -
- -
- 0
--
0
Gre
gory
11
--
--
10
--
0 -
- -
- -
- 0
1
Lake
0 -
- -
- -
- -
- 0
--
0 -
- -
- -
- -
- 0
Linc
oln
7 -
- -
- -
- -
- 0
07
--
0 -
- 0
7
McC
ook
0 -
- -
- -
- -
- 0
--
0 -
- -
- -
- -
- 0
Min
neha
ha3
--
--
--
--
01
10
00
--
3
Moo
dy10
--
--
--
--
00
9 -
- -
- 0
--
10
Todd
14 -
- 14
--
14 -
- -
- -
- -
- -
- -
- 0
0
Trip
p0
--
--
--
--
--
--
--
--
--
--
00
Turn
er0
--
--
--
--
0 -
- 0
--
--
--
--
0
Tota
l43
114
--
151
224
00
00
28
Wes
tern
But
te42
--
420
42 -
- -
- -
- -
- -
- -
- -
- -
-
Cus
ter
1,35
7 -
- 1,
352
51,
357
--
--
--
--
--
--
--
--
Fall
Riv
er7
--
7 -
- 7
--
--
--
--
--
--
--
--
Law
renc
e3,
484
--
3,44
439
3,48
4 -
- -
- -
- -
- -
- -
- -
- -
-
Mea
de22
4 -
- 22
40
224
--
--
--
--
--
--
--
--
Pen
ning
ton
5,24
70
5,21
928
5,24
7 -
- -
- 0
--
--
--
--
0
To
tal
10,3
610
10,2
8873
10,3
61 -
- -
- 0
--
--
--
--
0
Sta
te to
tal
10,4
041
10,3
0273
10,3
761
224
00
00
28
All
tab
le c
ells
with
out o
bse
rvat
ions
are
ind
icat
ed b
y --
. Ta
ble
val
ue o
f 0 in
dic
ates
the
volu
me
roun
ds
to le
ss th
an 1
thou
sand
cub
ic fe
et. C
olum
ns a
nd r
ows
may
not
ad
d to
thei
r to
tals
due
to r
ound
ing
.a In
clud
es e
aste
rn r
edce
dar
and
Roc
ky M
ount
ain
juni
per.

34
Tab
le 1
4.—
Dis
po
sit
ion
of
resid
ues p
rod
uced
at
pri
ma
ry w
oo
d-u
sin
g m
ills
, in
th
ou
sa
nd
gre
en
to
ns
, b
y F
ore
st
Inve
nto
ry U
nit
, d
isp
os
itio
n, re
sid
ue
ty
pe
, a
nd
so
ftw
oo
ds a
nd
hard
wo
od
s, S
ou
th D
ako
ta, 20
09
Res
idue
type
Woo
d re
sidu
e
For
est I
nven
tory
Uni
t and
dis
posi
tion
Tota
l all
resi
dues
Tota
l woo
d re
sidu
eC
oars
eaF
ineb
Bar
k
Sof
twoo
dH
ardw
ood
Sof
twoo
dH
ardw
ood
Sof
twoo
dH
ardw
ood
Sof
twoo
dH
ardw
ood
Sof
twoo
dH
ardw
ood
All
Uni
ts
Fib
er p
rodu
cts
143.
18 -
- 14
3.18
--
104.
90 -
- 38
.28
--
--
--
Indu
stria
l fue
lwoo
d75
.58
0.22
26.1
50.
1619
.57
0.15
6.58
0.00
49.4
30.
07
Res
iden
tial f
uelw
ood
2.31
0.17
1.90
0.15
1.90
0.15
--
--
0.41
0.03
Woo
d pe
llets
71.1
4 -
- 71
.14
--
53.2
5 -
- 17
.90
--
--
--
Mul
ch50
.13
0.03
9.55
0.03
5.69
--
3.86
0.03
40.5
90.
00
Mis
cella
neou
s us
esc
26.9
20.
0926
.92
0.09
19.6
30.
007.
300.
090.
000.
00
Not
use
d2.
040.
061.
400.
020.
710.
010.
690.
010.
640.
04
Tota
l37
1.31
0.57
280.
240.
4420
5.64
0.31
74.6
00.
1391
.07
0.13
Eas
tern
Uni
t
Indu
stria
l fue
lwoo
d0.
040.
220.
030.
160.
020.
150.
010.
000.
010.
07
Res
iden
tial f
uelw
ood
0.13
0.17
0.13
0.15
0.13
0.15
--
--
--
0.02
Mul
ch0.
030.
020.
020.
020.
02 -
- -
- 0.
020.
01 -
-
Mis
cella
neou
s us
esc
0.05
0.09
0.05
0.09
0.05
--
0.00
0.09
0.00
--
Not
use
d0.
270.
050.
150.
010.
00 -
- 0.
140.
010.
120.
04
Tota
l0.
510.
550.
380.
420.
230.
300.
150.
120.
130.
13
Wes
tern
Uni
t
Fib
er p
rodu
cts
143.
18 -
- 14
3.18
--
104.
90 -
- 38
.28
--
--
--
Indu
stria
l fue
lwoo
d75
.54
--
26.1
2 -
- 19
.54
--
6.57
--
49.4
3 -
-
Res
iden
tial f
uelw
ood
2.18
0.00
1.77
0.00
1.77
0.00
--
--
0.41
0.00
Woo
d pe
llets
71.1
4 -
- 71
.14
--
53.2
5 -
- 17
.90
--
--
--
Mul
ch50
.11
0.00
9.53
0.00
5.67
--
3.86
0.00
40.5
80.
00
Mis
cella
neou
s us
esc
26.8
80.
0026
.88
0.00
19.5
80.
007.
300.
000.
000.
00
Not
use
d1.
770.
021.
250.
010.
710.
010.
550.
000.
520.
00
Tota
l37
0.80
0.02
279.
860.
0220
5.41
0.01
74.4
50.
0190
.93
0.01
All
tab
le c
ells
with
out o
bse
rvat
ions
are
ind
icat
ed b
y --
. Ta
ble
val
ue o
f 0.0
0 in
dic
ates
the
volu
me
roun
ds
to le
ss th
an 5
gre
en to
ns. C
olum
ns a
nd r
ows
may
not
ad
d to
thei
r to
tals
due
to r
ound
ing
.a S
uita
ble
for
chip
ping
suc
h as
sla
bs, e
dgin
gs, v
enee
r co
res,
etc
.b N
ot s
uita
ble
for
chip
ping
suc
h as
saw
dust
, ven
eer
clip
ping
s, e
tc.
c Li
vest
ock
bedd
ing,
sm
all d
imen
sion
, and
spe
cial
ty p
rodu
cts.

Printed on Recycled Paper
The U.S. Department of Agriculture (USDA) prohibits discrimination in all its programs and activities on the basis of race, color, national origin, age, disability, and where applicable, sex, marital status, familial status, parental status, religion, sexual orientation, genetic information, political beliefs, reprisal, or because all or part of an individual’s income is derived from any public assistance program. (Not all prohibited bases apply to all programs.) Persons with disabilities who require alternate means for communication of program information (Braille, large print, audiotape, etc.) should contact USDA’s TARGET Center at (202)720-2600 (voice and TDD). To fi le a complaint of discrimination, write to USDA, Director, Offi ce of Civil Rights, 1400 Independence Avenue, S.W., Washington, DC 20250-9410, or call (800)795-3272 (voice) or (202)720-6382 (TDD). USDA is an equal opportunity provider and employer.
Piva, Ronald J.; Josten, Gregory J. 2013. South Dakota timber industry: an
assessment of timber product output and use, 2009. Resour. Bull. NRS-80. Newtown Square, PA: U.S. Department of Agriculture, Forest Service, Northern Research Station. 34 p.
Presents recent South Dakota forest industry trends; production and receipts of industrial roundwood; and production of saw logs, veneer logs, pulpwood, and other products in 2009. Logging residue generated from timber harvest operations is reported, as well as wood and bark residue generated at primary wood-using mills and disposition of mill residues.
KEY WORDS: industrial roundwood, harvest residue, mill residue, production, pulpwood, receipts, saw logs, veneer logs


