
Spatial Analysis of Road Safety and Traffic Behaviour
using High Resolution Multi-parametric Data
Apostolos Ziakopoulos
Civil – Transportation Engineer
PhD Candidate – Researcher
National Technical University of Athens
www.nrso.ntua.gr/apziak
July 2020
2
Spatial analysis of harsh event frequencies (harsh
brakings/accelerations) in road segments
Exploitation of multi-parametric high-resolution data:
1. Road segment geometric and road network
characteristic data from digital maps
2. Naturalistic driving data from smartphone sensors
3. High resolution traffic data
Scope of the dissertation
Apostolos Ziakopoulos | Spatial Analysis of Road Safety and Traffic Behaviour using High Resolution Multi-parametric Data
3
Thorough review of 132 international scientific studies of
spatial analysis applications in road safety
Available methodologies:1. Geographically Weighted Regression (GWR)
2. Bayesian Conditional Autoregression (CAR)
3. Full/Empirical Bayesian Analyses
4. Machine learning approaches
5. Kernel density approaches etc.
Wide array of parameters related to:1. Road traffic (speed, traffic volume, vehicle-kilometers)
2. Road environment (gradient, curvature, lane number/width, intersection
number/density etc.)
3. Demographic characteristics (population, road user age)
4. Socio-economic characteristics (income, employment)
5. Land use (commercial, industrial, residential)
Several available unit scales for spatial analysis(road segment, TAZ, region, grid structures)
Literature review: Spatial analyses (1/2)
Apostolos Ziakopoulos | Spatial Analysis of Road Safety and Traffic Behaviour using High Resolution Multi-parametric Data
4
The majority of studies analyze crash frequency specially with count-
data models (GWPR/CAR Poisson)
Additional issues:1. Boundary problem
2. Modifiable areal unit problem
3. Lack of common working framework
4. Most research done in modernized countries
5. Harder examination of certain parameters due to lack of data or means of
calculation (e.g. geometric characteristics)
All variables – parameters are examined and analyzed on a spatial unit
basis (AADT/zone, average speed/road section)
Methodological advantages and disadvantages:1. Frequentist models (e.g. GWPR): Intuitive interpretation, reduced fit capabilities
2. Bayesian models (e.g. CAR): Wide applications & adaptation to new data trends,
lack of informative priors for initialization
3. Machine learning (e.g. SVM/CNN): Flexibility & handling of big data, harder
interpretation – occasional ‘black box’ effect
Literature review: Spatial analyses (2/2)
Apostolos Ziakopoulos | Spatial Analysis of Road Safety and Traffic Behaviour using High Resolution Multi-parametric Data

5
Spatial analysis objectives are dictated by data availability:• No research was found in urban road networks due to lack of data
Dependent variables:• Limited analyses regarding crash injury severity
• No research pertinent with spatial analysis of harsh events was
found
Despite precise hotspot location capabilities, there is a lack of
transferability of spatial analysis results:• No predictions are conducted for different study areas
Large margins for exploitation of new technological
advancements for spatial analyses:• Enhancement of existing data – production of new datasets
Literature review: Knowledge gaps in road safety spatial analyses
Apostolos Ziakopoulos | Spatial Analysis of Road Safety and Traffic Behaviour using High Resolution Multi-parametric Data

6
Parameters of exposure to danger• Serve for the creation of a common baseline between models
and results
• Most prevalent parameters:
roadway length, vehicle-miles/kms, AADT
Meta-regressions: Original research• Quantitative investigation of factors which systematically
influence exposure parameters
• A means of investigating heterogeneity of scientific study
results
• Conducted with the inverse variance technique
Results for road safety spatial analyses1. AADT coefficients are positively correlated with taking speed
limit and road user age into consideration
2. Roadway length coefficients are positively correlated with
analyzing only fatal crashes compared to total crashes
3. AADT coefficients are positively correlated with analyzing
crashes on a county level compared to TAZ level
Literature review: Meta-regressions
Apostolos Ziakopoulos | Spatial Analysis of Road Safety and Traffic Behaviour using High Resolution Multi-parametric Data
7
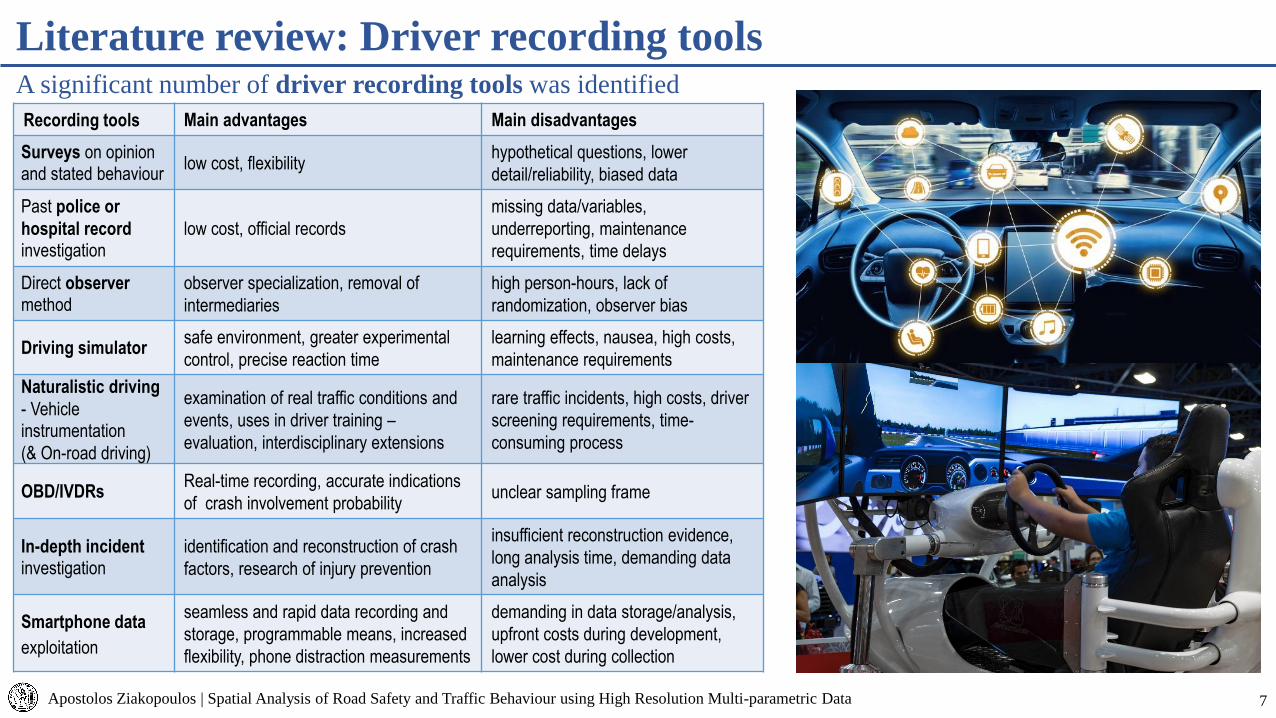
A significant number of driver recording tools was identified
Literature review: Driver recording tools
Apostolos Ziakopoulos | Spatial Analysis of Road Safety and Traffic Behaviour using High Resolution Multi-parametric Data
Recording tools Main advantages Main disadvantages
Surveys on opinion and stated behaviour
low cost, flexibilityhypothetical questions, lower
detail/reliability, biased data
Past police or
hospital recordinvestigation
low cost, official records
missing data/variables,
underreporting, maintenance
requirements, time delays
Direct observermethod
observer specialization, removal of
intermediaries
high person-hours, lack of
randomization, observer bias
Driving simulator safe environment, greater experimental
control, precise reaction time
learning effects, nausea, high costs,
maintenance requirements
Naturalistic driving
- Vehicle instrumentation
(& On-road driving)
examination of real traffic conditions and
events, uses in driver training –
evaluation, interdisciplinary extensions
rare traffic incidents, high costs, driver
screening requirements, time-
consuming process
OBD/IVDRsReal-time recording, accurate indications
of crash involvement probabilityunclear sampling frame
In-depth incident investigation
identification and reconstruction of crash
factors, research of injury prevention
insufficient reconstruction evidence,
long analysis time, demanding data
analysis
Smartphone data
exploitation
seamless and rapid data recording and
storage, programmable means, increased
flexibility, phone distraction measurements
demanding in data storage/analysis,
upfront costs during development,
lower cost during collection
8
Harsh events: harsh brakings and harsh accelerations
occurring during naturalistic driving
• Parameters measuring road safety levels
(correlations with spatial and temporal headways)
• Different phenomena, correlations with different variables
• Correlation with driver risk
Considerable comparative advantages for investigation:
1. Applications in driver evaluation and classification
2. Proactive road safety indicators – evaluations before
crashes occur
3. Considerable research gaps regarding the investigation of
harsh event frequencies
Literature review: Harsh events
Apostolos Ziakopoulos | Spatial Analysis of Road Safety and Traffic Behaviour using High Resolution Multi-parametric Data
9
1. How can smartphone data and map data be combined (map-
matched) and examined in road safety investigations?
2. How can harsh event frequencies be analyzed spatially in
these environments, and which methods are appropriate for
that purpose?
3. Is there spatial autocorrelation present in harsh event
frequencies for road segments in urban road environments?
4. Which road geometry and road network characteristics
affect harsh event frequencies in urban road network
environments? How transferable are the previous results in
a different study area?
5. Do traffic and driver behavioural parameters have a
statistical impact on harsh event frequencies?
Research questions
Apostolos Ziakopoulos | Spatial Analysis of Road Safety and Traffic Behaviour using High Resolution Multi-parametric Data

10
Spatial analysis of harsh event frequencies along two pillars:
1. Urban road networksPredictive modelling – Measurement of result transferability
2. Urban arterialsExplanatory modelling – Examination of additional traffic and driver behaviour
characteristics (without result transferability)
Exploratory spatial analyses (Moran’s I coefficients and variograms)
Selection of four spatial analysis methods1. Geographically Weighted Poisson Regression (GWPR)
2. Conditional Autoregressive Prior Regression (CAR)
3. Extreme Gradient Boosting (XGBoost) with Random Cross-Validation (RCV)
4. Extreme Gradient Boosting (XGBoost) with Spatial Cross-Validation (SPCV)
Model averaging for harsh event predictions in urban road networks
Methodological approach
Apostolos Ziakopoulos | Spatial Analysis of Road Safety and Traffic Behaviour using High Resolution Multi-parametric Data
11
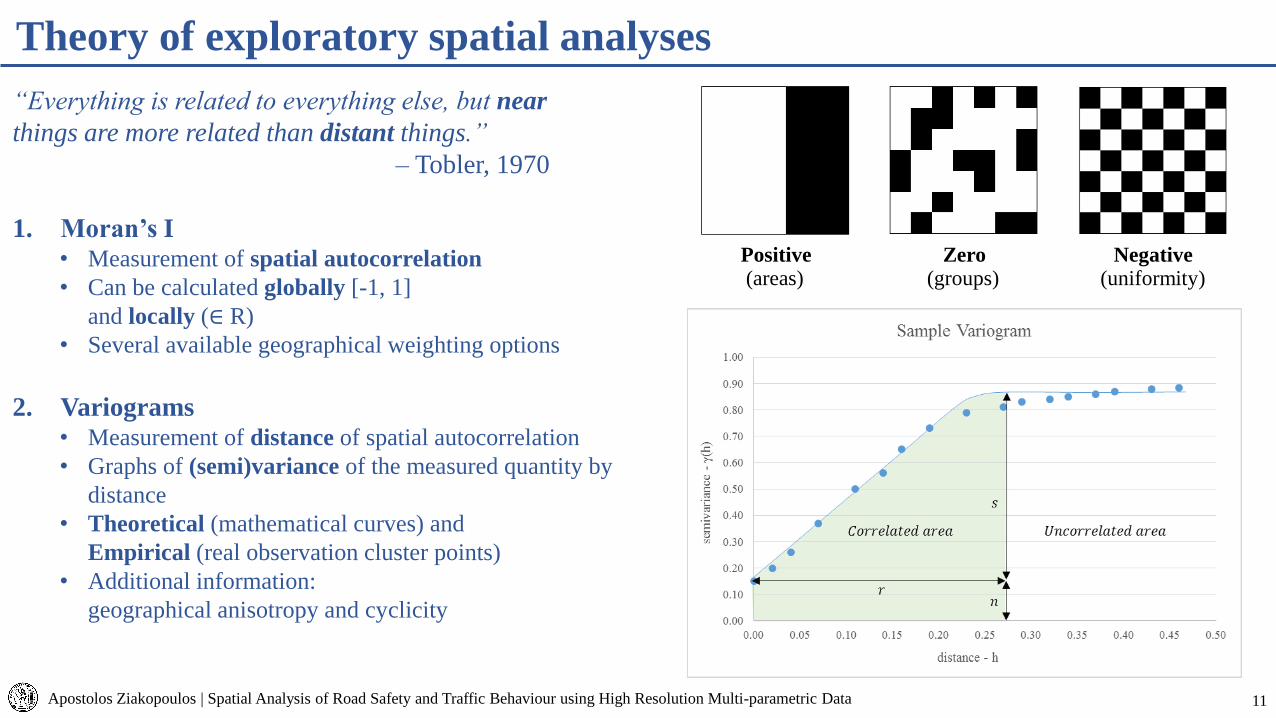
“Everything is related to everything else, but near
things are more related than distant things.”
– Tobler, 1970
1. Moran’s I• Measurement of spatial autocorrelation
• Can be calculated globally [-1, 1]
and locally (∈ R)
• Several available geographical weighting options
2. Variograms• Measurement of distance of spatial autocorrelation
• Graphs of (semi)variance of the measured quantity by
distance
• Theoretical (mathematical curves) and
Empirical (real observation cluster points)
• Additional information:
geographical anisotropy and cyclicity
Theory of exploratory spatial analyses
Apostolos Ziakopoulos | Spatial Analysis of Road Safety and Traffic Behaviour using High Resolution Multi-parametric Data
Positive Zero Negative(areas) (groups) (uniformity)

12
Integration of spatial heterogeneity
Event frequencies: Log-normal Poisson framework
1. Geographically Weighted Poisson Regression (GWPR)• Frequentist functional models: local micro-regressions are conducted,
b coefficients can vary locally
2. Conditional Autoregressive Prior Regression (CAR)• Bayesian functional models: Bayesian regressions are conducted with
spatially structured and unstructured terms, b coefficient distributions
are obtained
3. Extreme Gradient Boosting (XGBoost) • Machine learning: Multiple additive regression trees (ensemble),
obtained information regarding variable contribution (gain)
• Random Cross-Validation – RCV
• Spatial Cross-Validation – SPCV
Theory of spatial statistical models
Apostolos Ziakopoulos | Spatial Analysis of Road Safety and Traffic Behaviour using High Resolution Multi-parametric Data
Source: Lovelace et al. (2019)
13
Model performance metrics: Difference between true and predicted values
1. Root Mean Squared Error (RMSE)
2. Mean Absolute Error (ΜΑΕ)
3. Root Mean Squared Log Error (RMSLE)
Additional indicator:4. Custom accuracy (CA – percentage):
Percentage of accurate predictions within a ± 1 margin over
total number of predictions
Performance metric selection is also affected by input and output data
Frequencies: Natural numbers (positive integer or zero values)
Evaluation of model performance
Apostolos Ziakopoulos | Spatial Analysis of Road Safety and Traffic Behaviour using High Resolution Multi-parametric Data

14
Data of road segment geometry and road network
characteristics on a microscopic level from digital maps
OpenStreetMap: Open source digital map platformHierarchical elements:
1. Nodes
2. Ways from node groups
3. Relations from node and way groups
Obtaining a wealth of data in WGS84 through API queries
(Overpass Turbo API through Overpass Query Language)
NASA SRTM topography
Altitude data provided by NASA:• Freely available
• Altitude resolution per 10 cm
• Majority of populated areas available
Data collection (1/3): Digital map road geometry data
Apostolos Ziakopoulos | Spatial Analysis of Road Safety and Traffic Behaviour using High Resolution Multi-parametric Data
Source: SRTM website, (2020)

15
Naturalistic driving data from real-world conditions
obtained from smartphones (per trip-second)
Utilization of the application/platform of OSeven Telematics
• ΑPIs utilization for data reading from smartphone sensors
• Exploited sensors: GPS, accelerometer, gyroscope, device orientation
• Transmission from smartphone to central storage database
• Data cleaning and processing via a series of filtering, signal
processing, Machine Learning (ML) and scoring algorithms
• Several data are provided, indicatively: trip position, speed,
acceleration, harsh brakings/accelerations, event intensity, speeding,
mobile phone use
• Total anonymity during all data handling phases (GDPR)
Obtained high resolution big data from driver trips including
behaviour indicators
Data collection (2/3): Naturalistic driving data from smartphones
Apostolos Ziakopoulos | Spatial Analysis of Road Safety and Traffic Behaviour using High Resolution Multi-parametric Data
Source: OSeven Telematics, (2020)

16
Traffic data in urban arterials provided by the
Traffic Management Centre of Attica Region
Instrumentation in urban arterial corridors in Attica
• 550 inductive loop detectors
• 217 computer vision traffic cameras
• 24 variable message signs (VMS)
Regulation of ~ 1500 traffic lights in 850 intersections
Through vehicle time occupancy as a percentage,
the TMC collects:
• Occupancy [% of time]
• Traffic volume [vehicle number / temporal unit]
Secondarily, traffic speed [km/h] is calculated as well
Several temporal resolutions for data: 1 h, 5 min or 90 s (high resolution)
Data collection (3/3): Traffic data
Apostolos Ziakopoulos | Spatial Analysis of Road Safety and Traffic Behaviour using High Resolution Multi-parametric Data
Source: TMC, (2020)
17
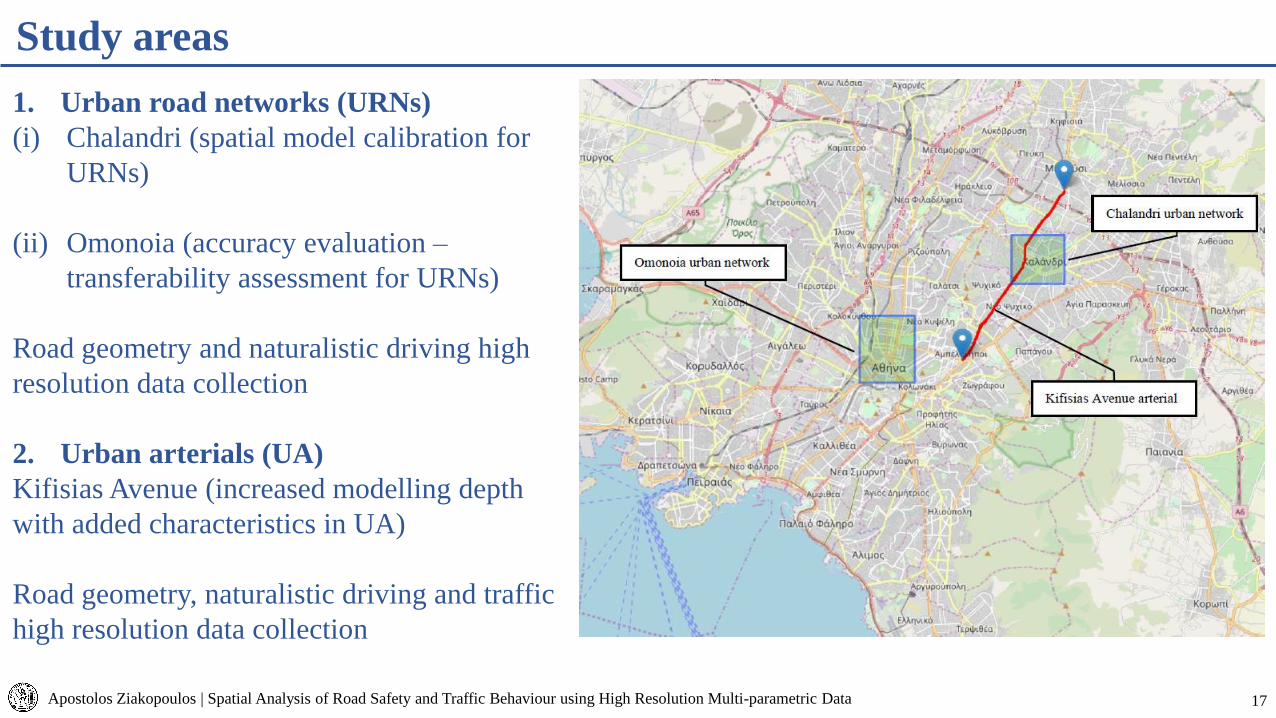
1. Urban road networks (URNs)
(i) Chalandri (spatial model calibration for
URNs)
(ii) Omonoia (accuracy evaluation –
transferability assessment for URNs)
Road geometry and naturalistic driving high
resolution data collection
2. Urban arterials (UA)
Kifisias Avenue (increased modelling depth
with added characteristics in UA)
Road geometry, naturalistic driving and traffic
high resolution data collection
Study areas
Apostolos Ziakopoulos | Spatial Analysis of Road Safety and Traffic Behaviour using High Resolution Multi-parametric Data
18
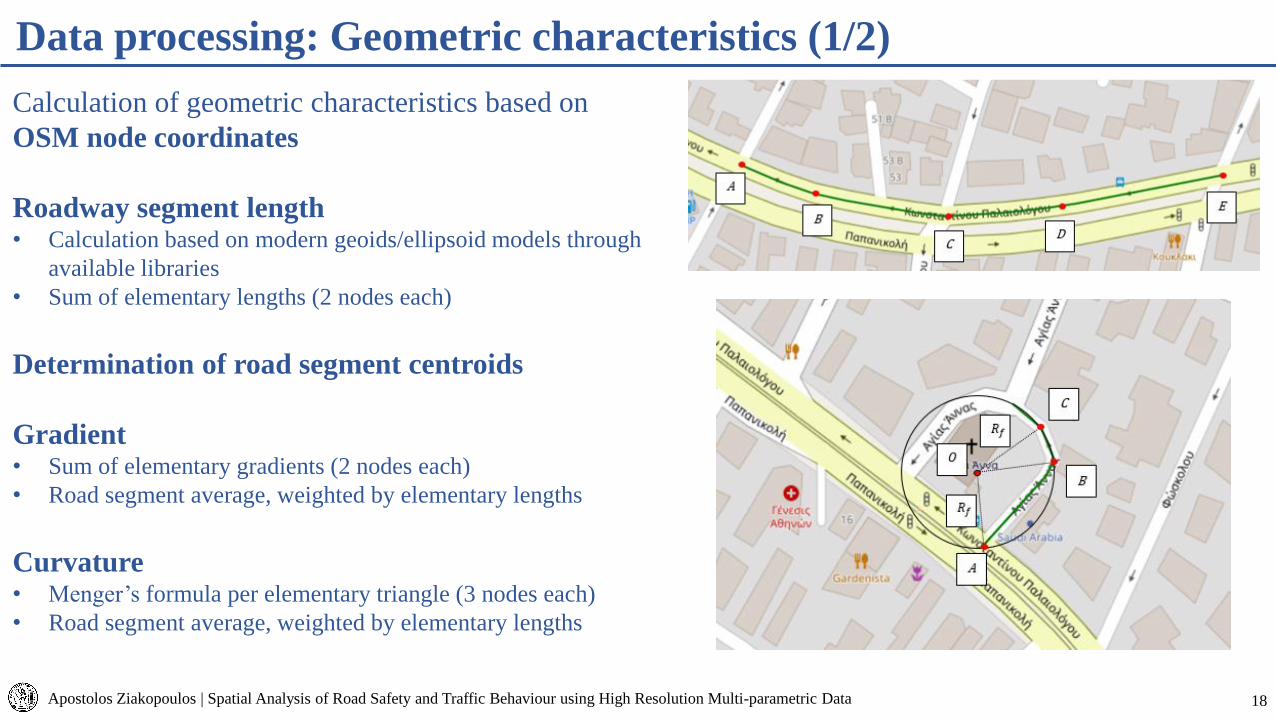
Calculation of geometric characteristics based on
OSM node coordinates
Roadway segment length• Calculation based on modern geoids/ellipsoid models through
available libraries
• Sum of elementary lengths (2 nodes each)
Determination of road segment centroids
Gradient• Sum of elementary gradients (2 nodes each)
• Road segment average, weighted by elementary lengths
Curvature• Menger’s formula per elementary triangle (3 nodes each)
• Road segment average, weighted by elementary lengths
Data processing: Geometric characteristics (1/2)
Apostolos Ziakopoulos | Spatial Analysis of Road Safety and Traffic Behaviour using High Resolution Multi-parametric Data

19
Data processing: Geometric characteristics (2/2)
Apostolos Ziakopoulos | Spatial Analysis of Road Safety and Traffic Behaviour using High Resolution Multi-parametric Data
Neighborhood complexity calculation• Measurement of density and complexity of immediate road segment
environment: (i) in reality (ii) on the digital maps
• Logarithm of nodes within a window of 470m * 470m from each road
segment centroid
Obtaining of additional road segment characteristics from OSM:
1. Presence of pedestrian crossing
2. Presence of traffic lights
3. Lane number
4. Road type
(exclusion of walkways/footpaths/surfaces without vehicles)
5. Direction number (one-way or two-way)
Calculation with original purpose-made algorithms and sub-routines
created in R-studio, iteratively for each road segment

20
Data processing: Map-matching (1/2)
Apostolos Ziakopoulos | Spatial Analysis of Road Safety and Traffic Behaviour using High Resolution Multi-parametric Data
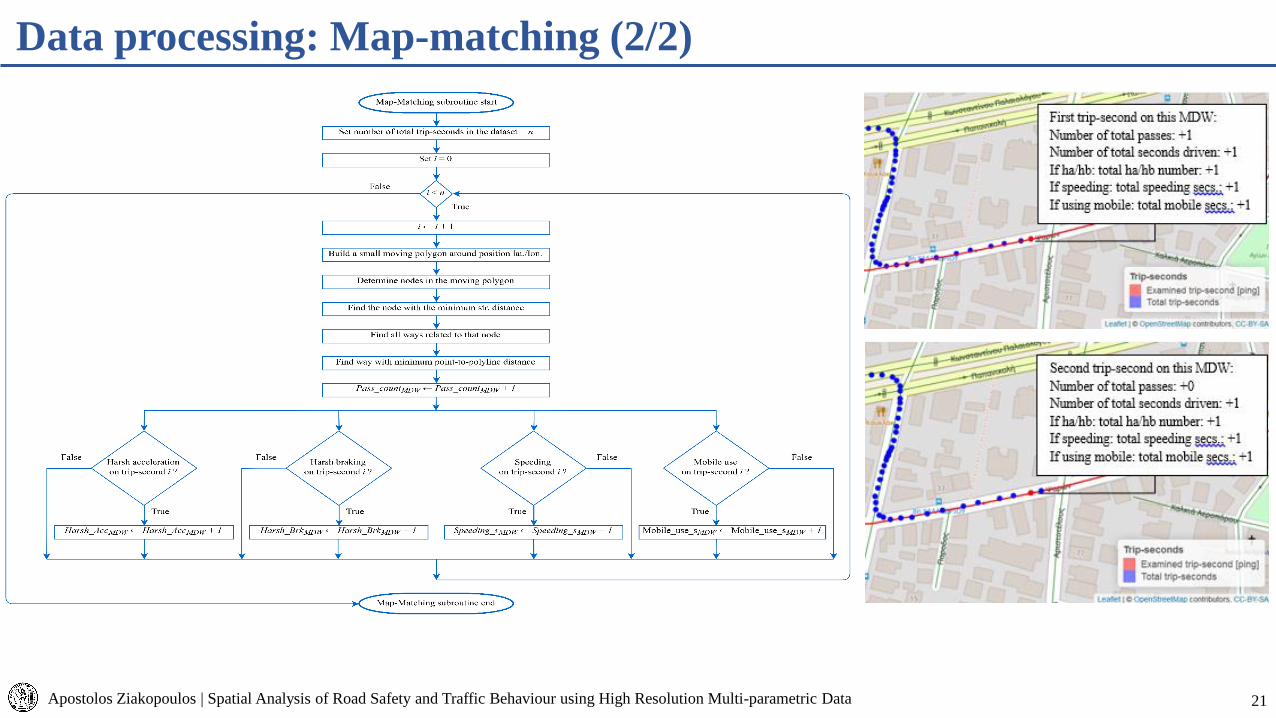
Map-matching: Plotting of naturalistic driving data on maps
after determination of the corresponding segment
Matching of GPS trace to each road segment per second
Identification of:1. Nearest node (point-to-point distance)
2. Minimum distance way – MDW (point-to-polyline distance)
• Moving polygon serving to reduce candidate ways
• Time-consuming and computationally demanding process
• Corrections are essential in dense road segments with parallel
axes through a specialized vote-count algorithm
Recording and assignment per road segment:1. Pass count
2. Harsh brakings/accelerations
3. Speeding seconds
4. Mobile use seconds
21
Data processing: Map-matching (2/2)
Apostolos Ziakopoulos | Spatial Analysis of Road Safety and Traffic Behaviour using High Resolution Multi-parametric Data
22
Data processing: Traffic parameter integration
Apostolos Ziakopoulos | Spatial Analysis of Road Safety and Traffic Behaviour using High Resolution Multi-parametric Data
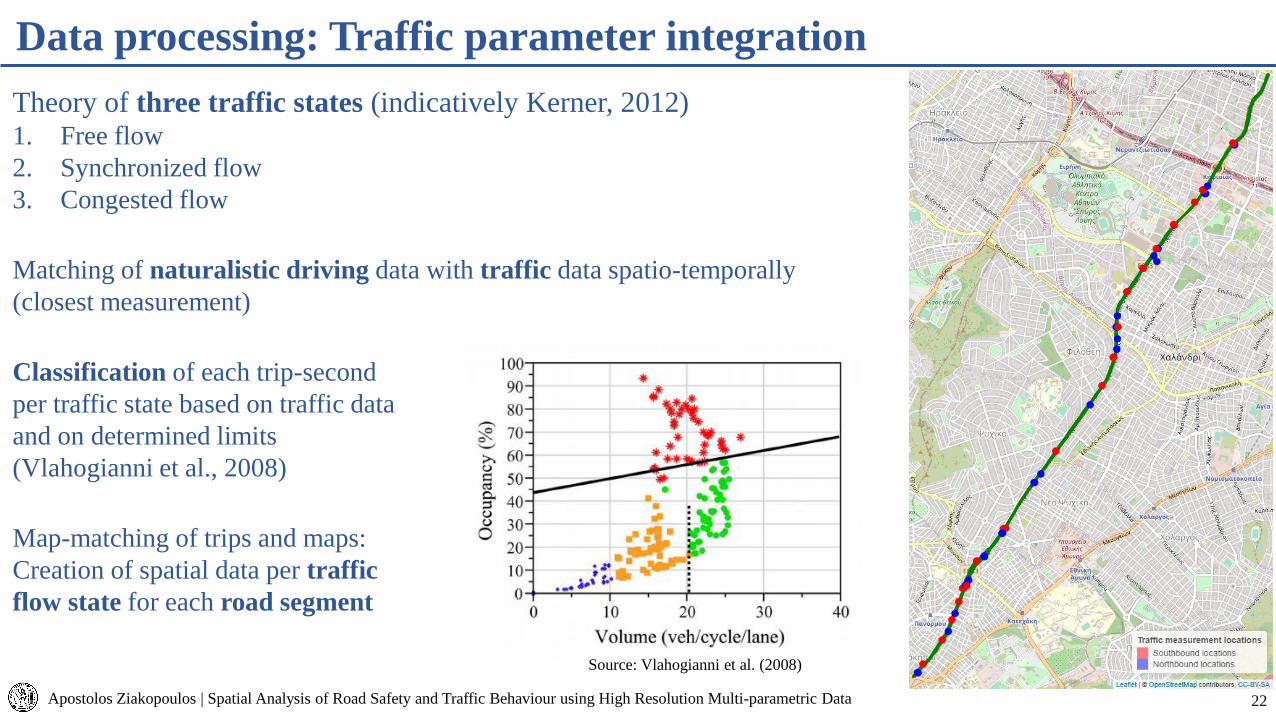
Theory of three traffic states (indicatively Kerner, 2012)1. Free flow
2. Synchronized flow
3. Congested flow
Matching of naturalistic driving data with traffic data spatio-temporally
(closest measurement)
Classification of each trip-second
per traffic state based on traffic data
and on determined limits
(Vlahogianni et al., 2008)
Map-matching of trips and maps:
Creation of spatial data per traffic
flow state for each road segment
Source: Vlahogianni et al. (2008)

23
Urban road networks: Sample description (1/2) – Chalandri
Apostolos Ziakopoulos | Spatial Analysis of Road Safety and Traffic Behaviour using High Resolution Multi-parametric Data
869 road segments (removal of 14 footways)
with 4293 nodes• 49 road segments with traffic lights
• 80 road segments with pedestrian crossings
Naturalistic driving data:• Trips between 01-10-2019 & 29-11-2019 – 2 months
• A total of 3294 trips from 230 drivers
• 1,000,273 driving seconds: average trip duration 304 s
• 1348 harsh brakings
• 921 harsh accelerations
90% of road segments feature at least 1 trip
Variable distributions
• Positive skewness (larger right tails)
• High kurtosis (non-normal distributions)
24
Urban road networks: Sample description (2/2) – Omonoia
Apostolos Ziakopoulos | Spatial Analysis of Road Safety and Traffic Behaviour using High Resolution Multi-parametric Data
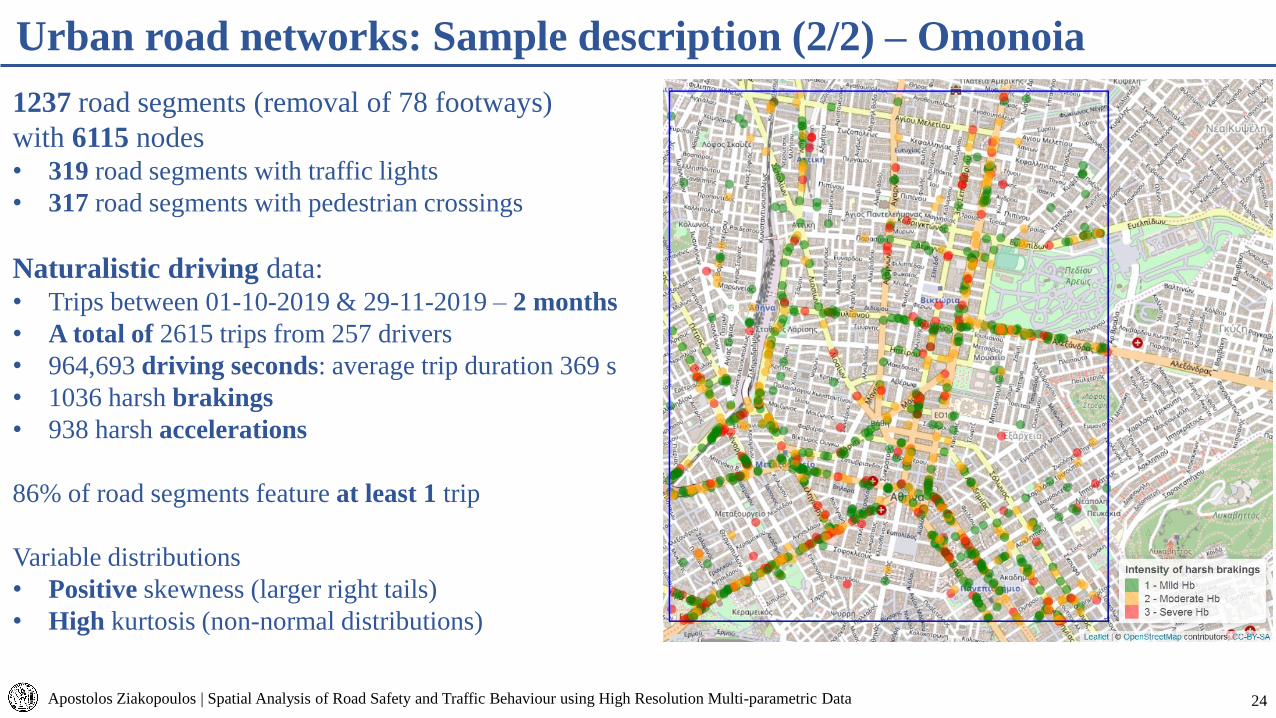
1237 road segments (removal of 78 footways)
with 6115 nodes• 319 road segments with traffic lights
• 317 road segments with pedestrian crossings
Naturalistic driving data:• Trips between 01-10-2019 & 29-11-2019 – 2 months
• A total of 2615 trips from 257 drivers
• 964,693 driving seconds: average trip duration 369 s
• 1036 harsh brakings
• 938 harsh accelerations
86% of road segments feature at least 1 trip
Variable distributions
• Positive skewness (larger right tails)
• High kurtosis (non-normal distributions)

25
Urban road networks: Exploratory spatial analyses (1/2)
Apostolos Ziakopoulos | Spatial Analysis of Road Safety and Traffic Behaviour using High Resolution Multi-parametric Data
Global and local Moran’s I coefficients (Chalandri area)
1. Distance-based weighting (DB)
2. k nearest-neighbor weighting (kNN)
Interpretation of k nearest-neighbors is more reasonable:
• Harsh event frequencies are influenced from the more
proximal road environment
• Positive spatial autocorrelation manifests in harsh
event frequencies
Very few outlier values
appear for local Moran’s I
(within 2σ per Anselin, 1995)
Volatility of the coefficient:
appropriate for preliminary
– exploratory analysis
kΝΝ Global Moran's ICorrelation
thresholdk
Coefficient
valueExpectation p-value
Harsh brakings
0.0
15 0.0806 -0.0012 0.000
Harsh accelerations 39 0.0945 -0.0012 0.000
Harsh brakings
0.1
5 0.1421 -0.0012 0.000
Harsh accelerations 5 0.2206 -0.0012 0.000
26
Urban road networks: Exploratory spatial analyses (2/2)
Apostolos Ziakopoulos | Spatial Analysis of Road Safety and Traffic Behaviour using High Resolution Multi-parametric Data
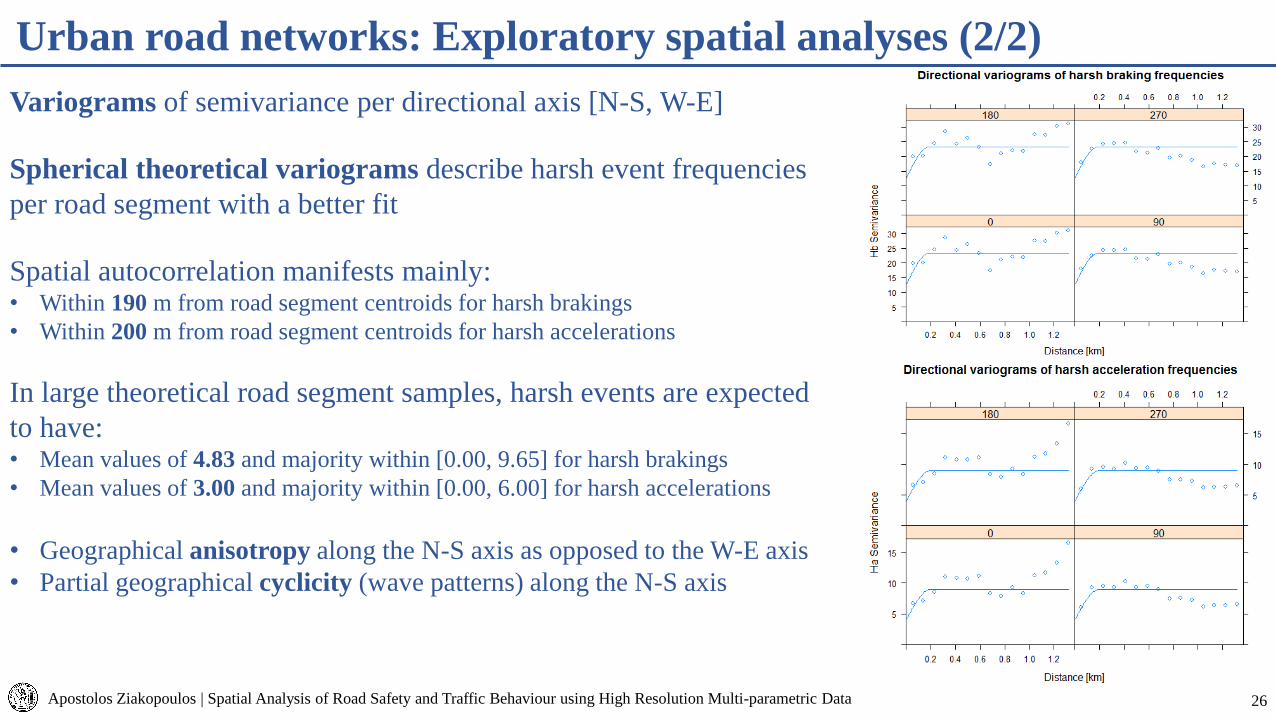
Variograms of semivariance per directional axis [N-S, W-E]
Spherical theoretical variograms describe harsh event frequencies
per road segment with a better fit
Spatial autocorrelation manifests mainly:• Within 190 m from road segment centroids for harsh brakings
• Within 200 m from road segment centroids for harsh accelerations
In large theoretical road segment samples, harsh events are expected
to have:• Mean values of 4.83 and majority within [0.00, 9.65] for harsh brakings
• Mean values of 3.00 and majority within [0.00, 6.00] for harsh accelerations
• Geographical anisotropy along the N-S axis as opposed to the W-E axis
• Partial geographical cyclicity (wave patterns) along the N-S axis

27
Urban road networks: Harsh braking spatial analyses
Apostolos Ziakopoulos | Spatial Analysis of Road Safety and Traffic Behaviour using High Resolution Multi-parametric Data
Independent variablesGWPR CAR RCV XGBoost SPCV XGBoost
Coefficients Mean posterior values Gain values Gain values
Intercept 0.4636 -1.4134 N/A N/A
Gradient -2.4864 -9.7538 0.0806 0.0860
Curvature ― ― 0.0444 0.0626
Neighborhood complexity -0.2919 -0.1787 0.0344 0.0684
Segment length 0.0039 0.0075 0.1436 0.1400
Pass count 0.0040 0.0086 0.6788 0.6271
Traffic lights: Yes [Ref.: Traffic lights: No] 0.2563 -0.0902 0.0037 0.0010
Pedestrian crossing: Yes [Ref.: Pedestrian crossing: No] -0.1463 0.3820 0.0024 0.0024
Lanes: 2 [Ref.: Lanes: 1] -0.2435 -0.1713
0.0072 0.0048Lanes: 3 [Ref.: Lanes: 1] 0.3669 -0.5719
Lanes: 4 [Ref.: Lanes: 1] 0.3578 1.9169
Road type: secondary [Ref.: Road type: primary] 1.0520 -0.1094
0.0049 0.0078Road type: tertiary [Ref.: Road type: primary] -0.0070 -1.6389
Road type: residential [Ref.: Road type: primary] -1.0084 -2.5578
Sigma-phi2 [Spatially structured effects] N/A 700.3172 N/A N/A
Sigma-theta2 [Spatially unstructured effects] N/A 2.3455 N/A N/A
Performance metrics
RMSE 3.2954 1.2830 1.4215 1.8293
MAE 1.3048 0.4115 0.4971 0.4994
RMSLE 0.5569 0.1727 0.3140 0.2390
CA 80.90% 96.32% 90.56% 91.71%
Positive correlation:
Segment length
Pass count
Negative correlation:
Gradient
Neighborhood complexity
Road type [Residential]
Marginally positive correlation:
Road type [Secondary]
Traffic lights
Pedestrian crossing
Marginally negative correlation:
Road type [Tertiary]
28
Urban road networks: Harsh braking prediction & transferability
Apostolos Ziakopoulos | Spatial Analysis of Road Safety and Traffic Behaviour using High Resolution Multi-parametric Data
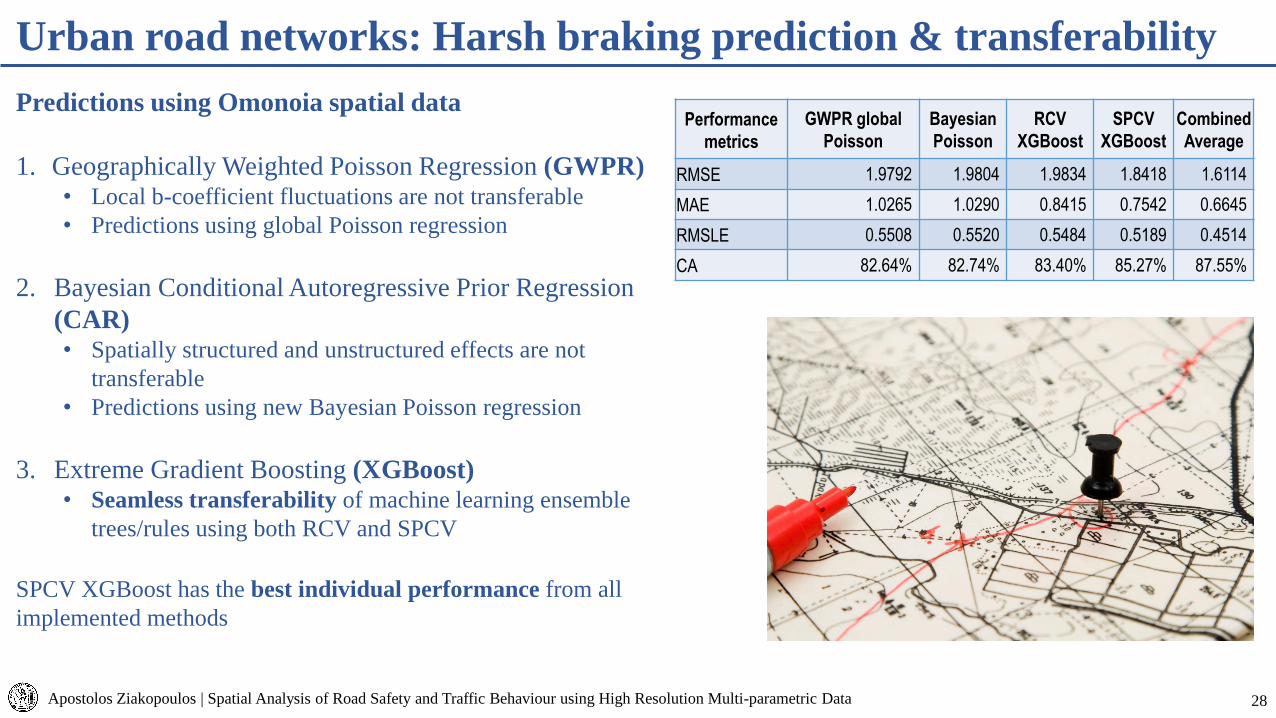
Predictions using Omonoia spatial data
1. Geographically Weighted Poisson Regression (GWPR)• Local b-coefficient fluctuations are not transferable
• Predictions using global Poisson regression
2. Bayesian Conditional Autoregressive Prior Regression
(CAR)• Spatially structured and unstructured effects are not
transferable
• Predictions using new Bayesian Poisson regression
3. Extreme Gradient Boosting (XGBoost) • Seamless transferability of machine learning ensemble
trees/rules using both RCV and SPCV
SPCV XGBoost has the best individual performance from all
implemented methods
Performance
metrics
GWPR global
Poisson
Bayesian
Poisson
RCV
XGBoost
SPCV
XGBoost
Combined
Average
RMSE 1.9792 1.9804 1.9834 1.8418 1.6114
MAE 1.0265 1.0290 0.8415 0.7542 0.6645
RMSLE 0.5508 0.5520 0.5484 0.5189 0.4514
CA 82.64% 82.74% 83.40% 85.27% 87.55%
29
Urban road networks: Combined harsh braking predictions
Apostolos Ziakopoulos | Spatial Analysis of Road Safety and Traffic Behaviour using High Resolution Multi-parametric Data
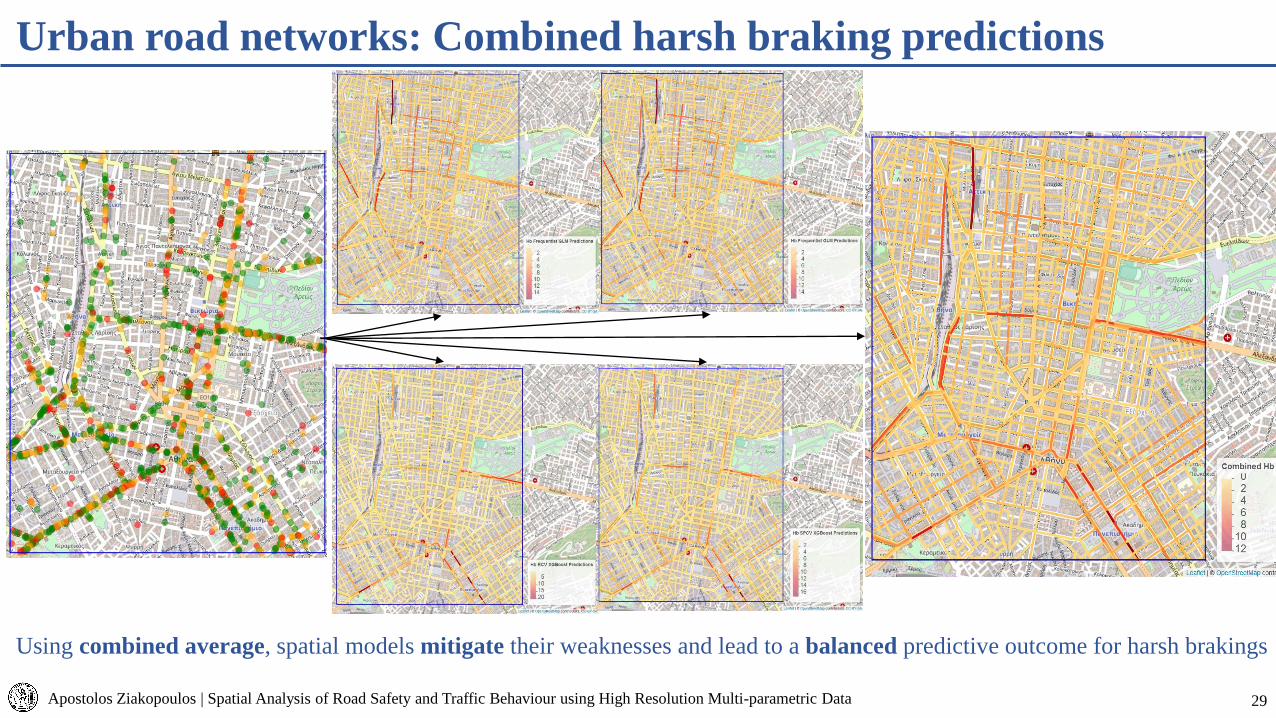
Using combined average, spatial models mitigate their weaknesses and lead to a balanced predictive outcome for harsh brakings

30
Positive correlation:
Segment length
Pass count
Curvature
Road type [Secondary]
Road type [Tertiary]
Traffic lights
Negative correlation:
Road type [Residential]
Marginally positive correlation:
Pedestrian crossing
Marginally negative correlation:
Neighborhood complexity
Urban road networks: Harsh acceleration spatial analyses
Apostolos Ziakopoulos | Spatial Analysis of Road Safety and Traffic Behaviour using High Resolution Multi-parametric Data
Independent variablesGWPR CAR RCV XGBoost SPCV XGBoost
Coefficients Mean posterior values Gain values Gain values
Intercept -1.4230 -1.2399 N/A N/A
Gradient ― ― 0.0588 0.0189
Curvature 9.0471 6.3926 0.0323 0.0309
Neighborhood complexity ― -0.2308 0.0532 0.0355
Segment length 0.0030 0.0038 0.1058 0.0766
Pass count 0.0042 0.0071 0.7184 0.8253
Traffic lights: Yes [Ref.: Traffic lights: No] 0.3791 0.1147 0.0069 0.0026
Pedestrian crossing: Yes [Ref.: Pedestrian crossing: No] ― 0.4554 0.0045 0.0011
Lanes: 2 [Ref.: Lanes: 1] 0.0794 -0.0134
0.0033 0.0027Lanes: 3 [Ref.: Lanes: 1] 0.4741 -0.1702
Lanes: 4 [Ref.: Lanes: 1] 0.3828 0.4380
Road type: secondary [Ref.: Road type: primary] 0.7323 0.7202
0.0109 0.0065Road type: tertiary [Ref.: Road type: primary] 0.3720 0.3610
Road type: residential [Ref.: Road type: primary] -0.6642 -0.6715
Sigma-phi2 [Spatially structured effects] N/A 255.3276 N/A N/A
Sigma-theta2 [Spatially unstructured effects] N/A 0.2827 N/A N/A
Performance metrics
RMSE 2.0861 0.7961 0.9128 1.1327
MAE 0.9125 0.4111 0.3728 0.4891
RMSLE 0.4704 0.2512 0.3000 0.3504
CA 84.69% 95.74% 93.32% 89.87%
31
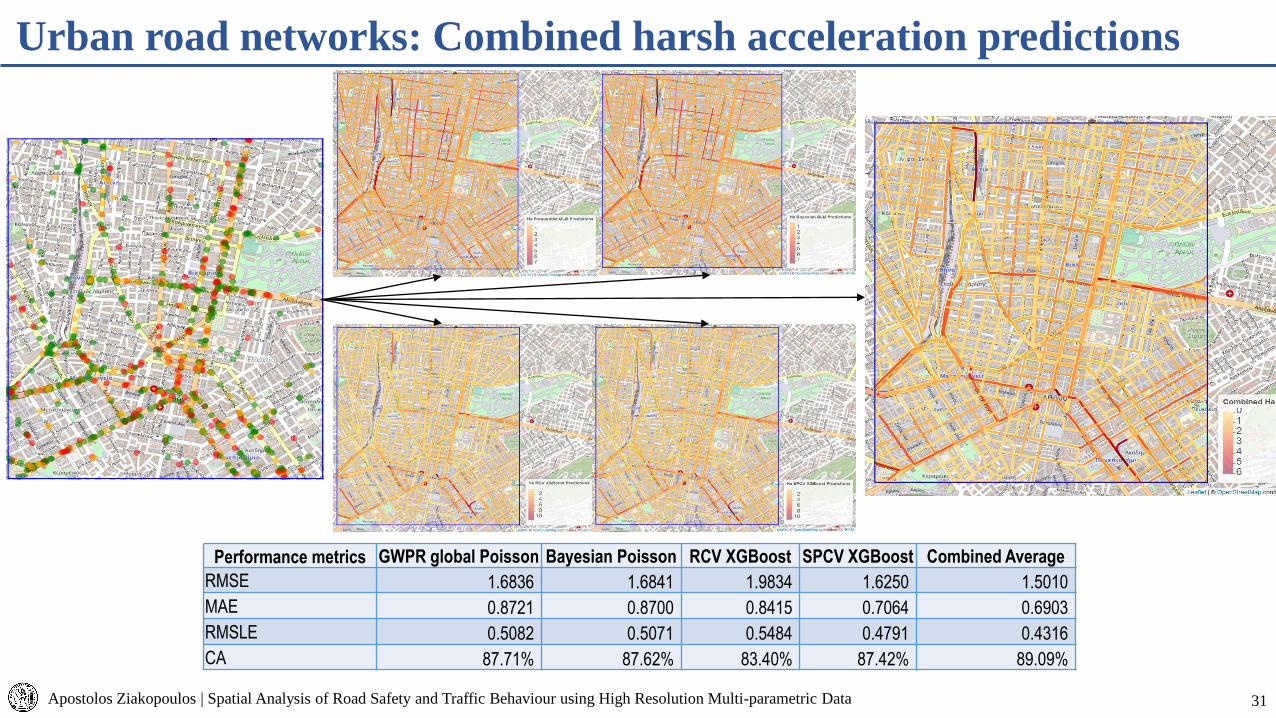
Urban road networks: Combined harsh acceleration predictions
Apostolos Ziakopoulos | Spatial Analysis of Road Safety and Traffic Behaviour using High Resolution Multi-parametric Data
Performance metrics GWPR global Poisson Bayesian Poisson RCV XGBoost SPCV XGBoost Combined Average
RMSE 1.6836 1.6841 1.9834 1.6250 1.5010
MAE 0.8721 0.8700 0.8415 0.7064 0.6903
RMSLE 0.5082 0.5071 0.5484 0.4791 0.4316
CA 87.71% 87.62% 83.40% 87.42% 89.09%

32
Urban road networks: Main findings
Apostolos Ziakopoulos | Spatial Analysis of Road Safety and Traffic Behaviour using High Resolution Multi-parametric Data
• Spatial analyses of harsh braking and harsh acceleration frequencies are
feasible using GWPR, CAR, RCV XGBoost and SPCV XGBoost methodologies
• Very good model fit on training spatial data (Chalandri) and precise predictions
in the test spatial data (Omonoia)
• The investigated exposure parameters (segment length and pass count) are
consistently positively correlated with harsh braking and harsh acceleration
frequencies
• The presence of pedestrian crossings and traffic lights is mostly positively
correlated with harsh braking and harsh acceleration frequencies
• Conversely, gradient and neighborhood complexity are negatively correlated
with harsh acceleration frequency
• Curvature is positively correlated with harsh acceleration frequency
• Road type and number of lanes are parameters with unclear influence:
However, they offer useful information for the calibration of spatial terms/
tree separation limits

33
Urban arterial: Sample description – Kifisias Avenue (1/2)
Apostolos Ziakopoulos | Spatial Analysis of Road Safety and Traffic Behaviour using High Resolution Multi-parametric Data
152 road segments with 658 nodes• 15 road segments with traffic lights
• 21 road segments with pedestrian crossings
Naturalistic driving data:• Trips between 01-09-2019 & 29-11-2019 – 3 months
• A total of 8756 trips from 314 drivers
• 930,346 driving seconds: average trip duration 221 s
• 1543 harsh brakings
• 1033 harsh accelerations
Variable distributions
• Positive skewness (larger right tails)
• High kurtosis (segment length/neighborhood complexity)
and low kurtosis (gradient/curvature) – non-normal
distributions

34
Urban arterial: Sample description – Kifisias Avenue (2/2)
Apostolos Ziakopoulos | Spatial Analysis of Road Safety and Traffic Behaviour using High Resolution Multi-parametric Data
Classification of trip-seconds and traffic data per
traffic state
At least 1 trip:• 100% of road segments under free flow conditions
• 94.74% of road segments under synchronized flow
conditions
• 95.39% of road segments under congested flow
conditions
Free flow conditions
• 563 harsh brakings & 363 harsh accelerations
Synchronized flow conditions• 215 harsh brakings & 142 harsh accelerations
Congested flow conditions• 10 harsh brakings & 4 harsh accelerations
• No sufficient harsh event frequencies to conduct spatial analysis
35
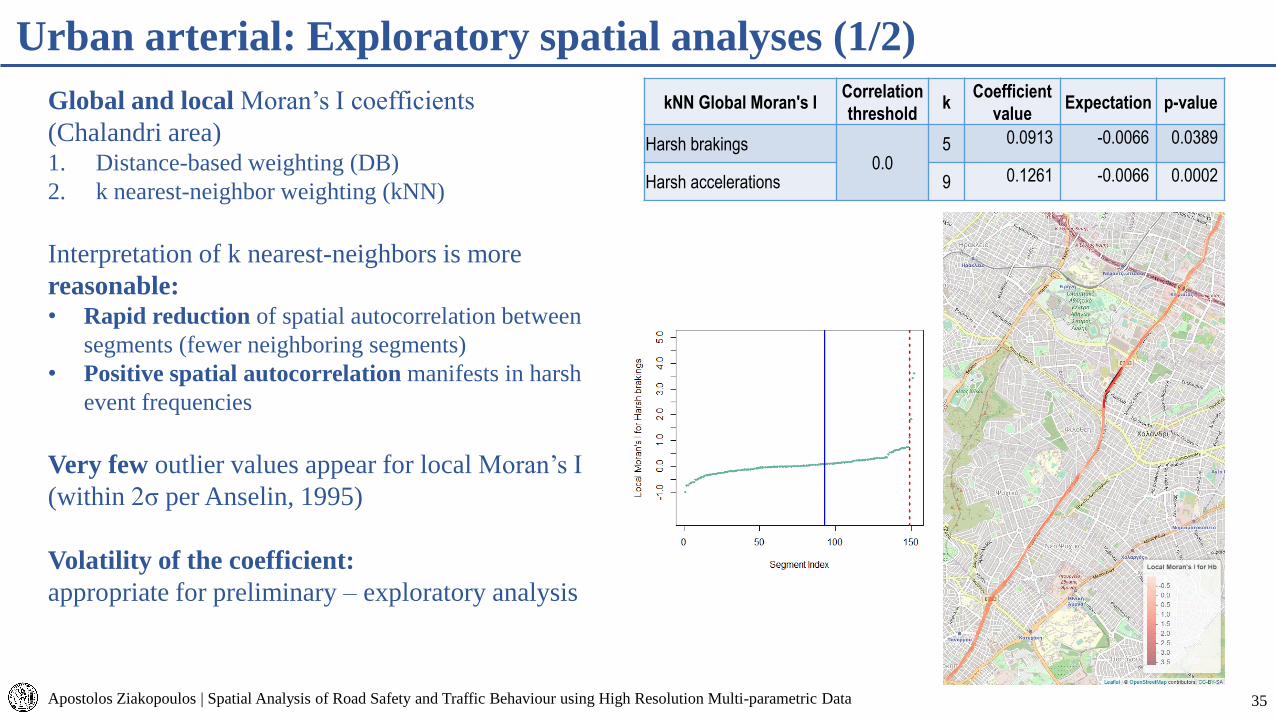
Urban arterial: Exploratory spatial analyses (1/2)
Apostolos Ziakopoulos | Spatial Analysis of Road Safety and Traffic Behaviour using High Resolution Multi-parametric Data
kΝΝ Global Moran's ICorrelation
thresholdk
Coefficient
valueExpectation p-value
Harsh brakings0.0
5 0.0913 -0.0066 0.0389
Harsh accelerations 9 0.1261 -0.0066 0.0002
Global and local Moran’s I coefficients
(Chalandri area)1. Distance-based weighting (DB)
2. k nearest-neighbor weighting (kNN)
Interpretation of k nearest-neighbors is more
reasonable:• Rapid reduction of spatial autocorrelation between
segments (fewer neighboring segments)
• Positive spatial autocorrelation manifests in harsh
event frequencies
Very few outlier values appear for local Moran’s I
(within 2σ per Anselin, 1995)
Volatility of the coefficient:
appropriate for preliminary – exploratory analysis

36
Urban arterial: Exploratory spatial analyses (2/2)
Apostolos Ziakopoulos | Spatial Analysis of Road Safety and Traffic Behaviour using High Resolution Multi-parametric Data
Merged variograms of semivariance
Exponential theoretical variograms describe harsh event frequencies
per road segment with a better fit
Spatial autocorrelation manifests mainly:• Within 310 m from road segment centroids for harsh brakings
• Within 320 m from road segment centroids for harsh accelerations
In large theoretical road segment samples, harsh events are expected to
have:• Mean values of 9.89 and majority within [0.00, 19.78] for harsh brakings
• Mean values of 7.88 and majority within [0.00, 15.75] for harsh accelerations
Additional observations:• Greater empirical variogram volatility compared to urban road networks
• Partial geographical cyclicity (wave patterns), denoting patterns of
repetition in the data
37
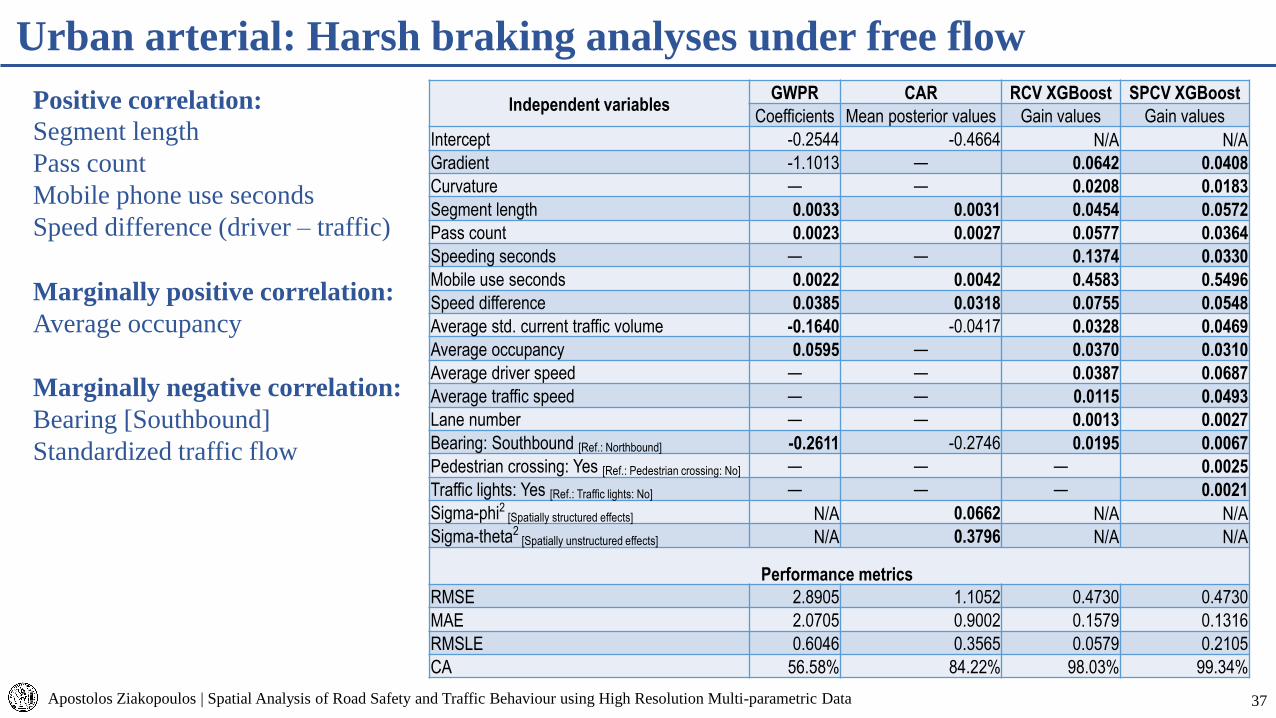
Urban arterial: Harsh braking analyses under free flow
Apostolos Ziakopoulos | Spatial Analysis of Road Safety and Traffic Behaviour using High Resolution Multi-parametric Data
Independent variablesGWPR CAR RCV XGBoost SPCV XGBoost
Coefficients Mean posterior values Gain values Gain values
Intercept -0.2544 -0.4664 N/A N/A
Gradient -1.1013 ― 0.0642 0.0408
Curvature ― ― 0.0208 0.0183
Segment length 0.0033 0.0031 0.0454 0.0572
Pass count 0.0023 0.0027 0.0577 0.0364
Speeding seconds ― ― 0.1374 0.0330
Mobile use seconds 0.0022 0.0042 0.4583 0.5496
Speed difference 0.0385 0.0318 0.0755 0.0548
Average std. current traffic volume -0.1640 -0.0417 0.0328 0.0469
Average occupancy 0.0595 ― 0.0370 0.0310
Average driver speed ― ― 0.0387 0.0687
Average traffic speed ― ― 0.0115 0.0493
Lane number ― ― 0.0013 0.0027
Bearing: Southbound [Ref.: Northbound] -0.2611 -0.2746 0.0195 0.0067
Pedestrian crossing: Yes [Ref.: Pedestrian crossing: No] ― ― ― 0.0025
Traffic lights: Yes [Ref.: Traffic lights: No] ― ― ― 0.0021
Sigma-phi2 [Spatially structured effects] N/A 0.0662 N/A N/A
Sigma-theta2 [Spatially unstructured effects] N/A 0.3796 N/A N/A
Performance metrics
RMSE 2.8905 1.1052 0.4730 0.4730
MAE 2.0705 0.9002 0.1579 0.1316
RMSLE 0.6046 0.3565 0.0579 0.2105
CA 56.58% 84.22% 98.03% 99.34%
Positive correlation:
Segment length
Pass count
Mobile phone use seconds
Speed difference (driver – traffic)
Marginally positive correlation:
Average occupancy
Marginally negative correlation:
Bearing [Southbound]
Standardized traffic flow
38
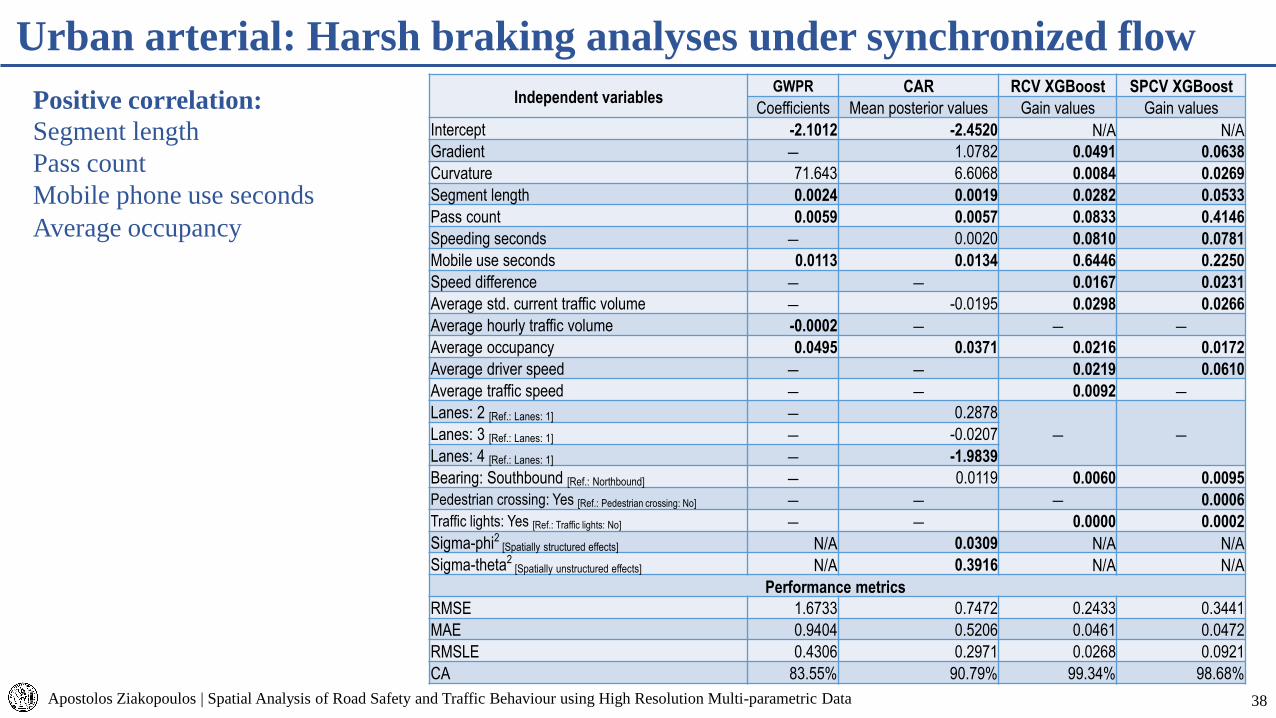
Urban arterial: Harsh braking analyses under synchronized flow
Apostolos Ziakopoulos | Spatial Analysis of Road Safety and Traffic Behaviour using High Resolution Multi-parametric Data
Independent variablesGWPR CAR RCV XGBoost SPCV XGBoost
Coefficients Mean posterior values Gain values Gain values
Intercept -2.1012 -2.4520 N/A N/A
Gradient ― 1.0782 0.0491 0.0638
Curvature 71.643 6.6068 0.0084 0.0269
Segment length 0.0024 0.0019 0.0282 0.0533
Pass count 0.0059 0.0057 0.0833 0.4146
Speeding seconds ― 0.0020 0.0810 0.0781
Mobile use seconds 0.0113 0.0134 0.6446 0.2250
Speed difference ― ― 0.0167 0.0231
Average std. current traffic volume ― -0.0195 0.0298 0.0266
Average hourly traffic volume -0.0002 ― ― ―
Average occupancy 0.0495 0.0371 0.0216 0.0172
Average driver speed ― ― 0.0219 0.0610
Average traffic speed ― ― 0.0092 ―
Lanes: 2 [Ref.: Lanes: 1] ― 0.2878
― ―Lanes: 3 [Ref.: Lanes: 1] ― -0.0207
Lanes: 4 [Ref.: Lanes: 1] ― -1.9839
Bearing: Southbound [Ref.: Northbound] ― 0.0119 0.0060 0.0095
Pedestrian crossing: Yes [Ref.: Pedestrian crossing: No] ― ― ― 0.0006
Traffic lights: Yes [Ref.: Traffic lights: No] ― ― 0.0000 0.0002
Sigma-phi2 [Spatially structured effects] N/A 0.0309 N/A N/A
Sigma-theta2 [Spatially unstructured effects] N/A 0.3916 N/A N/A
Performance metrics
RMSE 1.6733 0.7472 0.2433 0.3441
MAE 0.9404 0.5206 0.0461 0.0472
RMSLE 0.4306 0.2971 0.0268 0.0921
CA 83.55% 90.79% 99.34% 98.68%
Positive correlation:
Segment length
Pass count
Mobile phone use seconds
Average occupancy

39
Urban arterial: Harsh acceleration analyses under free flow
Apostolos Ziakopoulos | Spatial Analysis of Road Safety and Traffic Behaviour using High Resolution Multi-parametric Data
Independent variablesGWPR CAR RCV XGBoost SPCV XGBoost
Coefficients Mean posterior values Gain values Gain values
Intercept -0.2237 -1.0912 N/A N/A
Gradient ― 1.2874 0.0573 0.0756
Curvature ― ― 0.0337 0.0413
Segment length 0.0017 0.0011 0.0831 0.0759
Pass count 0.0032 0.0022 0.1097 0.1183
Speeding seconds -0.0011 -0.0012 0.0711 0.0631
Mobile use seconds 0.0027 0.0047 0.2865 0.2212
Speed difference 0.0528 0.0323 ― 0.0749
Average std. current traffic volume ― ― 0.0795 0.1281
Average occupancy 0.0258 0.0328 0.0500 0.0656
Average driver speed ― ― 0.1457 0.1136
Average traffic speed -0.0240 ― 0.0585 ―
Lane number ― ― 0.0148 0.0092
Bearing: Southbound [Ref.: Northbound] -0.2434 -0.2327 0.0001 0.0021
Pedestrian crossing: Yes [Ref.: Pedestrian crossing: No] ― ― ― 0.0056
Traffic lights: Yes [Ref.: Traffic lights: No] ― ― 0.0100 0.0058
Sigma-phi2 [Spatially structured effects] N/A 0.5614 N/A N/A
Sigma-theta2 [Spatially unstructured effects] N/A 0.3253 N/A N/A
Performance metrics
RMSE 2.2817 1.0912 0.3974 0.3536
MAE 1.5816 0.8612 0.1316 0.1118
RMSLE 0.6305 0.4286 0.0776 0.0507
CA 63.16% 86.18% 98.68% 99.34%
Positive correlation:
Pass count
Mobile phone use seconds
Speed difference (driver – traffic)
Average occupancy
Negative correlation:
Speeding seconds
Marginally positive correlation:
Segment length
Marginally negative correlation:
Bearing [Southbound]

40
Urban arterial: Harsh acceleration analyses in synchronized flow
Apostolos Ziakopoulos | Spatial Analysis of Road Safety and Traffic Behaviour using High Resolution Multi-parametric Data
Independent variablesGWPR CAR RCV XGBoost SPCV XGBoost
Coefficients Mean posterior values Gain values Gain values
Intercept -1.2573 -2.9399 N/A N/A
Gradient ― 1.7464 0.0243 0.0258
Curvature ― ― 0.0183 0.0180
Segment length ― -0.0005 0.0240 0.0259
Pass count 0.0035 0.0065 0.2169 0.5617
Speeding seconds ― -0.0039 0.0017 0.0071
Mobile use seconds 0.0148 0.0159 0.5723 0.2209
Speed difference ― ― 0.0332 0.0144
Average std. current traffic volume ― ― 0.0032 0.022
Average traffic volume 0.0003 0.0008 ― ―
Average occupancy ― 0.0237 0.0457 0.0407
Average driver speed ― -0.0224 0.0604 0.0568
Average traffic speed -0.0240 ― ― ―
Lanes: 2 [Ref.: Lanes: 1] ― -1.0085
― ―Lanes: 3 [Ref.: Lanes: 1] ― -1.8321
Lanes: 4 [Ref.: Lanes: 1] ― -2.8837
Bearing: Southbound [Ref.: Northbound] 0.4721 0.2981 ― 0.0067
Sigma-phi2 [Spatially structured effects] N/A 0.0699 N/A N/A
Sigma-theta2 [Spatially unstructured effects] N/A 1.0935 N/A N/A
Performance metrics
RMSE 1.2978 0.5404 0.5000 0.281
MAE 0.8258 0.3904 0.1711 0.0658
RMSLE 0.4507 0.2475 0.1638 0.0842
CA 86.84% 97.36% 97.37% 98.68%
Positive correlation:
Pass count
Mobile phone use seconds
Marginally positive correlation:
Traffic flow
(hourly or standardized)
41
Urban arterial: Main findings
Apostolos Ziakopoulos | Spatial Analysis of Road Safety and Traffic Behaviour using High Resolution Multi-parametric Data
• Spatial analyses of harsh braking and harsh acceleration frequencies are
feasible using GWPR, CAR, RCV XGBoost and SPCV XGBoost
methodologies per traffic state as well
• Very good model fit on study area data, with the exception of GWPR
under free flow conditions
• GWPR performance seems to be affected by the pronounced geographical
anisotropy under free flow conditions – the avenue is practically 1-dimensional
• The other methodologies (CAR, RCV XGBoost and SPCV XGBoost) are not
likewise affected
• Results indicate that different traffic parameters are correlated with harsh
event frequencies per traffic state
• The exposure parameters (segment length and pass count) continue to display
a positive influence on harsh braking and harsh acceleration frequencies
• The creation – examination of directional variograms does not have physical
meaning: merged variograms are appropriate
42
Conclusions of the dissertation (1/5)
Apostolos Ziakopoulos | Spatial Analysis of Road Safety and Traffic Behaviour using High Resolution Multi-parametric Data
1. It is possible to combine high resolution multi-parametric naturalistic
driving, geometric and traffic data that can be combined and exploited
to conduct meaningful spatial analyses on a road segment basis
2. The implementation of both common spatial methods (GWPR, CAR,
Moran’s I and variograms) and innovative methods (RCV & SPCV
XGBoost) is feasible for spatial analyses of harsh event frequencies on
a road segment basis
3. Positive autocorrelation is detected in harsh braking and harsh
acceleration frequencies in both urban road networks and urban
arterials
4. In urban road networks, spatial autocorrelation manifests mainly within
190 m from road segment centroids for harsh brakings and within 200
m from road segment centroids for harsh accelerations. The respective
distances for urban arterials are estimated at 310 m and 320 m
43
Conclusions of the dissertation (2/5)
Apostolos Ziakopoulos | Spatial Analysis of Road Safety and Traffic Behaviour using High Resolution Multi-parametric Data
Urban road networks:
1. The exposure parameters (segment length and pass
count) are positively correlated with harsh braking and
harsh acceleration frequencies.
2. Conversely, gradient, neighborhood complexity and
residential road type are parameters negatively
correlated with harsh braking frequencies.
3. Curvature, traffic lights and secondary and tertiary
road types are parameters positively correlated with
harsh acceleration frequencies.
4. Residential road type is negatively correlated with
harsh acceleration frequencies.

44
Conclusions of the dissertation (3/5)
Apostolos Ziakopoulos | Spatial Analysis of Road Safety and Traffic Behaviour using High Resolution Multi-parametric Data
Urban road networks:
5. Precise predictions of harsh event frequencies can
be successfully conducted via the exploitation of
the examined data and using the implemented
methods.
Custom accuracy achieved:
87.6% for harsh brakings and
89.1% for harsh accelerations.
6. Using combined average, spatial models mitigate
their weaknesses and lead to a balanced predictive
outcome for harsh events. A more complete image
of hotspots is obtained.
45
Conclusions of the dissertation (4/5)
Apostolos Ziakopoulos | Spatial Analysis of Road Safety and Traffic Behaviour using High Resolution Multi-parametric Data
Urban arterial:
1. It is meaningful to create and examine spatial data per
traffic state in order to analyze harsh event frequencies; as
a bridge between road safety and traffic flow disciplines.
2. Results indicate that different variables are correlated
with increased harsh event frequencies under free flow
conditions compared to synchronized flow conditions.
3. The inclusion of traffic and driver behaviour parameters
offers additional capabilities for in-depth examination of
causal parameters, without any transferability or prediction
capabilities.
46
Conclusions of the dissertation (5/5)
Apostolos Ziakopoulos | Spatial Analysis of Road Safety and Traffic Behaviour using High Resolution Multi-parametric Data
Urban arterial:
4. The exposure parameters (segment length and pass count) as
well as mobile use seconds are positively correlated with harsh
braking and harsh acceleration frequencies.
5. The parameter of average occupancy is positively correlated
with harsh event frequencies under synchronized flow and
marginally positively correlated under free flow.
6. The parameter of speed difference of driver and vehicle is
positively correlated with harsh braking frequencies under free
flow and with harsh acceleration frequencies (under both
conditions).
7. Circumstantial correlations are found with traffic flow
parameters (reduction of brakings under free flow, increase of
accelerations under synchronized flow).

47
Innovative contributions
Apostolos Ziakopoulos | Spatial Analysis of Road Safety and Traffic Behaviour using High Resolution Multi-parametric Data
Innovative Contributions
1. Novel methodological
research framework
3. Innovative spatial
analyses & predictions for
urban networks
2. Big-data mapping &
processing algorithms
5. Original insights &
statistical correlations
4. Spatial analyses with
added depth for urban
arterials
1. Novel methodological research frameworkConducting road safety spatial analysis for harsh event frequencies using
multi-parametric high-resolution data per road segment
2. Inception of a number of purpose-made big-data algorithms Implementation of the algorithms for critical functions:
(i) calculation of additional geometric characteristics
(ii) data processing and merging
(iii) map-matching of trip-seconds to road segments
3. Innovative types of spatial analyses(i) spatial analyses of urban road networks
(ii) spatial analyses results were used for successful predictions of
harsh event frequencies
4. Spatial analyses with added depth for urban arterials – Separate
examinations for free flow and synchronized flow traffic states
5. Original insights and statistical correlations were obtained for the
parameters affecting harsh event frequencies
48
Future research
Apostolos Ziakopoulos | Spatial Analysis of Road Safety and Traffic Behaviour using High Resolution Multi-parametric Data
1. Correlation with crash dataConducting spatial analyses including crash data per road
segment –examination of possible hotspot overlap
2. Introduction of temporal dimensionConducting spatio-temporal analyses for the identification of
seasonal trends and the detection of any hotspot migration effects
3. Analyses per driver aggressivenessDriver classification based on their aggressiveness and produced
harsh events
4. Implementation of additional spatial or machine
learning modelsIndicatively: Neural networks, additional CAR priors, spatial lag
models
5. Investigation of additional environments or parametersRural roads, multiple countries, presence of public transport,
low speed zones

49Apostolos Ziakopoulos | Spatial Analysis of Road Safety and Traffic Behaviour using High Resolution Multi-parametric Data
Spatial Analysis of Road Safety and Traffic Behaviour
using High Resolution Multi-parametric Data
Apostolos Ziakopoulos
Civil – Transportation Engineer
PhD Candidate – Researcher
National Technical University of Athens
www.nrso.ntua.gr/apziak
July 2020


