
31st European Hotel Industry Conference
Impossible• Robin Rossmann | Wednesday 6 November

© 2019 STR. All Rights Reserved.
Agenda
Nounthe point at which a series of small changes or incidents becomes significant enough to cause a larger, more important change.
Tipping points:
1. Hotel performance
2. Competitive landscape
3. Sustainability and climate change
Tipping points:

© 2019 STR. All Rights Reserved.
Tipping point…
Hotel performance cycle
Source: Giphy.com

© 2019 STR. All Rights Reserved.
Demand growth
Supplygrowth

© 2019 STR. All Rights Reserved.
2.1%1.2% 1.3% 1.4%
6.1%
1.1%
3.5%
2.0%1.9%
-2.4%
3.6%
1.7%
7.9%
3.0%1.9%
0.6%
North America &Caribbean
Central America South America Europe Middle East Africa Asia Australia &Oceania
Supply Demand
Supply now outpacing demand growth in regions around the worldGlobal Supply & Demand % Change, September 2019 YTD
Supply > Demand Supply > Demand Supply > Demand Supply > Demand

© 2019 STR. All Rights Reserved.
Middle East
Southern Africa
Northern Africa
-36.6%
… driving RevPAR declines in most cases Constant Currency, September 2019 YTD
Europe
Asia
+0.9%
+4.0%
+2.3%
+10.0%
+1.2%
-6.2%-2.4%
Australia & Oceania
-2.2%
North America
Central America
South America

© 2019 STR. All Rights Reserved.
-2%
0%
2%
4%
6%
8%
10%
2017 2018 2019 Aug-19
Occ % chg ADR % chg
… but occupancy growth has stalled and ADR growth is followingEurope – ADR & Occupancy % Change, CC, EUR, Jan 2017 – Aug 2019

© 2019 STR. All Rights Reserved.
0.8%
0.6%0.7%
0.6%0.6%
0.9%
1.2%
1.4%
0.0%
0.2%
0.4%
0.6%
0.8%
1.0%
1.2%
1.4%
1.6%
2012 2013 2014 2015 2016 2017 2018 2019 YTD
Supply % change
Supply growth has been acceleratingEurope – New rooms as a % existing supply, August 2019 YTD

© 2019 STR. All Rights Reserved.
… with supply growth much higher than average in certain citiesEurope – Supply increase in 2019 as a percentage of total supply
Vienna
Madrid
LondonBrussels
Dublin
Edinburgh
Paris
Lisbon
HelsinkiSt. Petersburg
Moscow
Zurich
Barcelona
Amsterdam
IstanbulBelgradeBucharest
Kiev
Budapest
BerlinWarsaw
Prague
1
1
0
3
7
4
1
2 3
4
3
1
0
3
0
0
8
5
Copenhagen
01
0Rome
Athens2
Tel Aviv 11
Tbilisi6
Nursultan 0
2
2

© 2019 STR. All Rights Reserved.
Spain strong outside resort marketsRevPAR % Change, Local Currency, August 2019 YTD
© 2019 STR. All Rights Reserved.
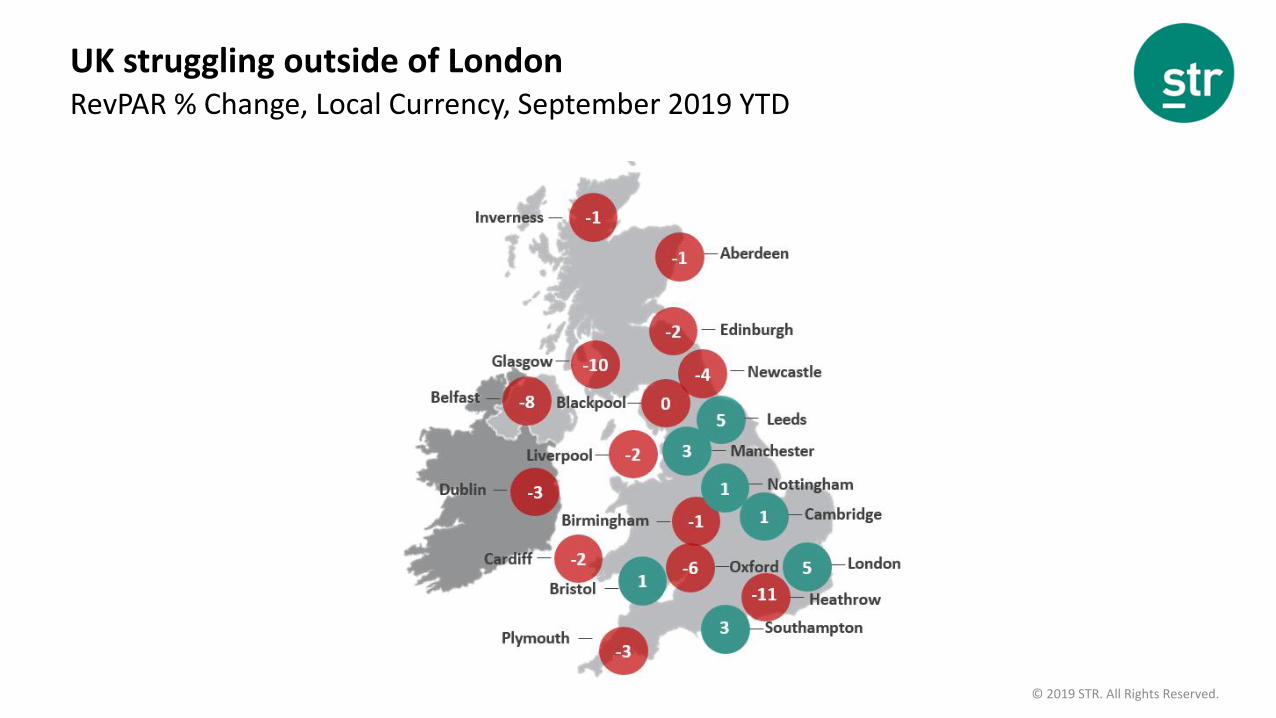
UK struggling outside of LondonRevPAR % Change, Local Currency, September 2019 YTD
© 2019 STR. All Rights Reserved.
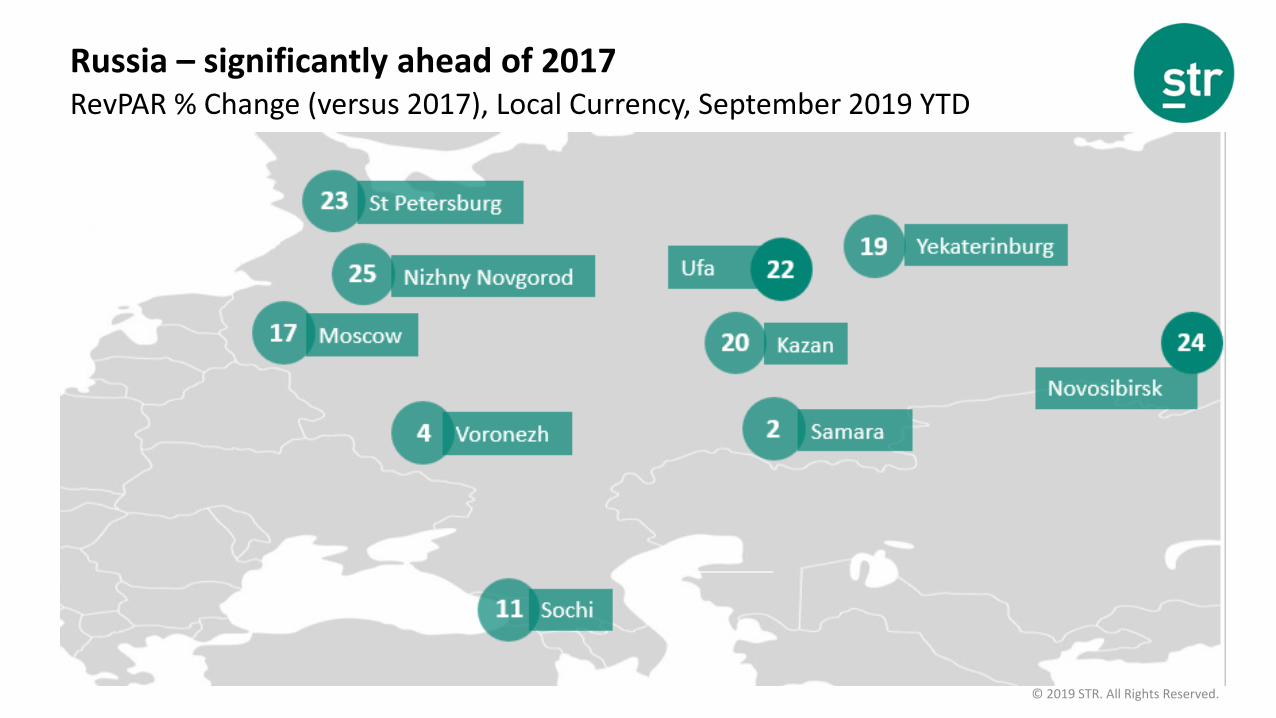
Russia – significantly ahead of 2017RevPAR % Change (versus 2017), Local Currency, September 2019 YTD

© 2019 STR. All Rights Reserved.
Germany impacted by new supply and slower economyRevPAR % Change, Local Currency, September 2019 YTD
© 2019 STR. All Rights Reserved.
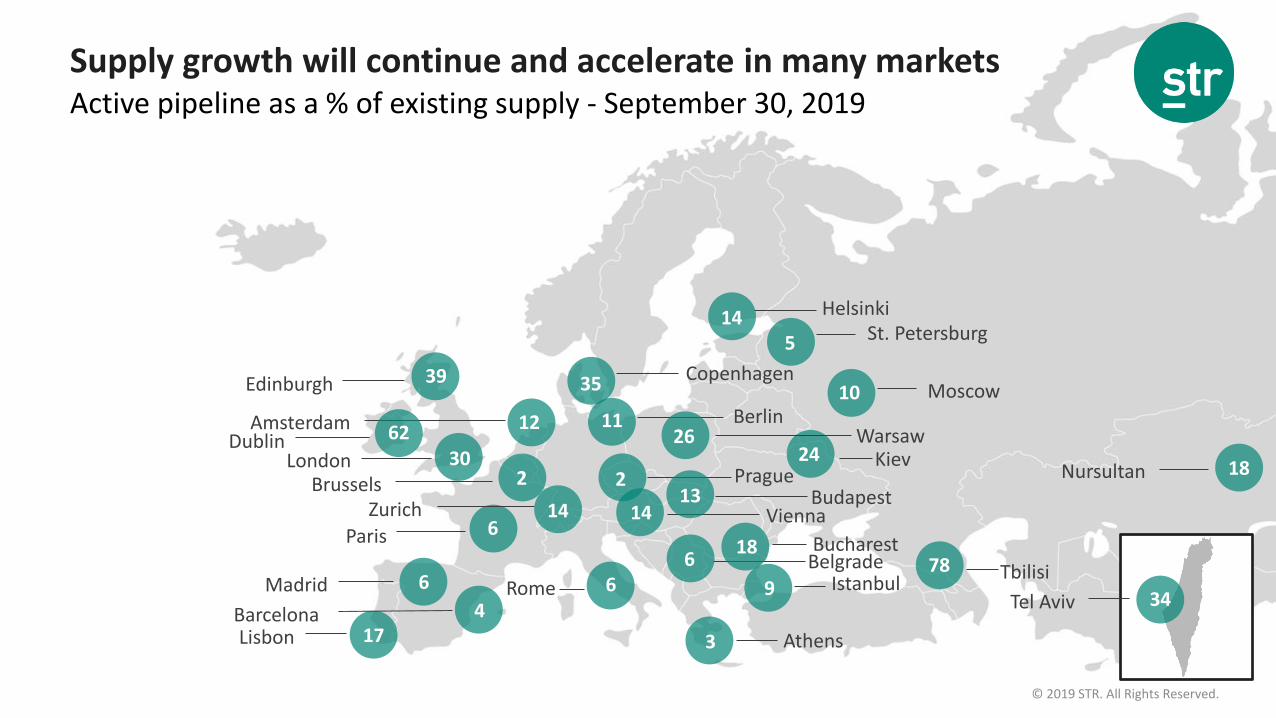
Supply growth will continue and accelerate in many marketsActive pipeline as a % of existing supply - September 30, 2019
Vienna
Madrid
LondonBrussels
Dublin
Edinburgh
Paris
Lisbon
HelsinkiSt. Petersburg
Moscow
Zurich
Barcelona
Amsterdam
IstanbulBelgradeBucharest
Kiev
Budapest
BerlinWarsaw
Prague
17
6
24
6
39
12
2
14 14
62
18
11
10
9
5
6
26
13
Copenhagen
230
4Rome
Athens3
Tel Aviv 346
Tbilisi78
Nursultan 18
35
14

© 2018 STR. All Rights Reserved.

© 2019 STR. All Rights Reserved.
Tipping point… tech and competitive landscape
Source: Giphy.com

© 2019 STR. All Rights Reserved.
The industry is consolidating but still very fragmentedWorldwide Independent vs Chain Hotels, By Total Number of Rooms, as of September 2018
32.6%
61.4% 59.8% 57.1%
46.7%
67.4%
38.6% 40.2% 42.9%
53.3%
North America Central & SouthAmerica
Europe Middle East & Africa Asia Pacific
Independent Chain
5% chg 8% chg 11% chg5% chg 7% chg
Percentage point change in last decade

© 2019 STR. All Rights Reserved.
Group #Hotels NA International
8,977 75% 25%
7,941 6% 94%
7,071 89% 11%
7,029 75% 25%
5,929 84% 16%
5,632 71% 29%
5,151 0% 100%
4,853 2% 98%
3,766 60% 40%
The big global hotel groups are no longer just US chainsNumber of hotels as of September 2018

© 2019 STR. All Rights Reserved.
Group #Hotels NA International
8,977 75% 25%
7,071 89% 11%
7,029 75% 25%
5,929 84% 16%
5,632 71% 29%
4,854 2% 98%
3,766 60% 40%
5,151 0% 100%
7,941 6% 94%
+ 35,000 0% 100%
… and a new disruptor has entered the fray

© 2019 STR. All Rights Reserved. © 2017 STR. All Rights Reserved.
OYO has more than 2,000 software engineers and data scientists
© 2019 STR. All Rights Reserved.
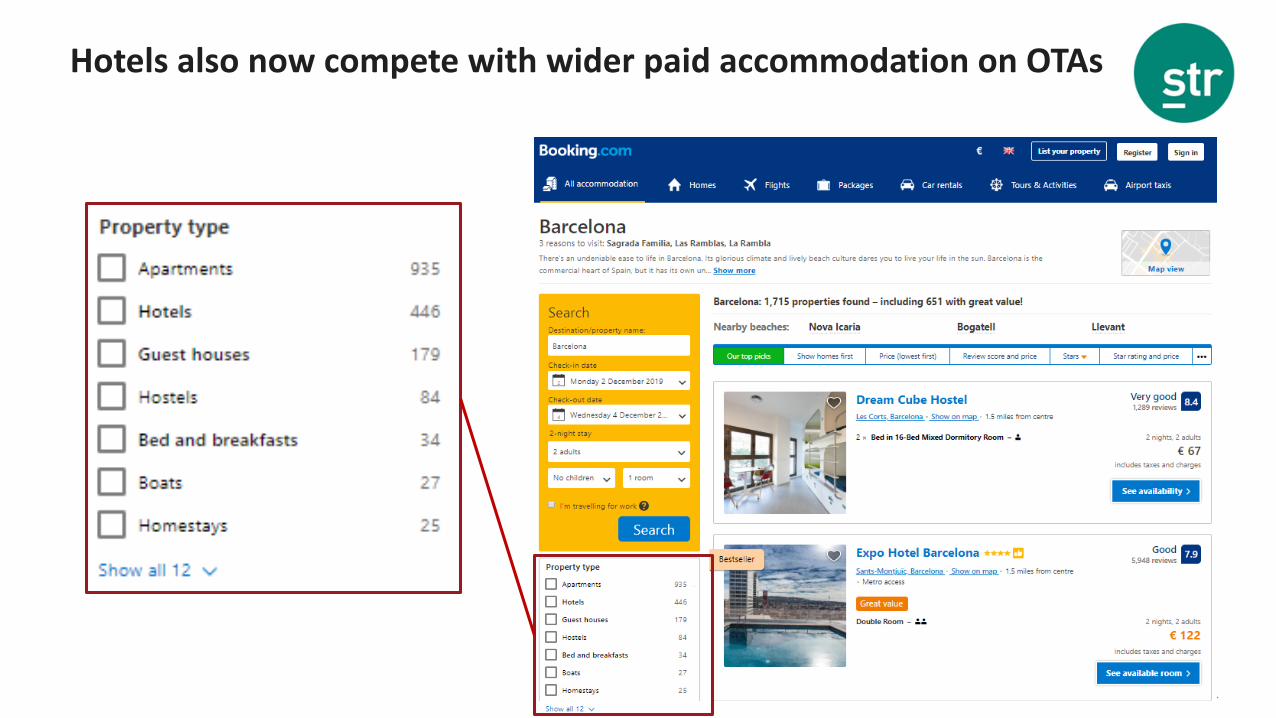
Hotels also now compete with wider paid accommodation on OTAs

© 2019 STR. All Rights Reserved.
6000
13301128 944 867 820 804 696 579
So perhaps the total competitive landscape looks more like this….Largest hotel groups by number of rooms in 2019 (‘000)
525
© 2019 STR. All Rights Reserved.
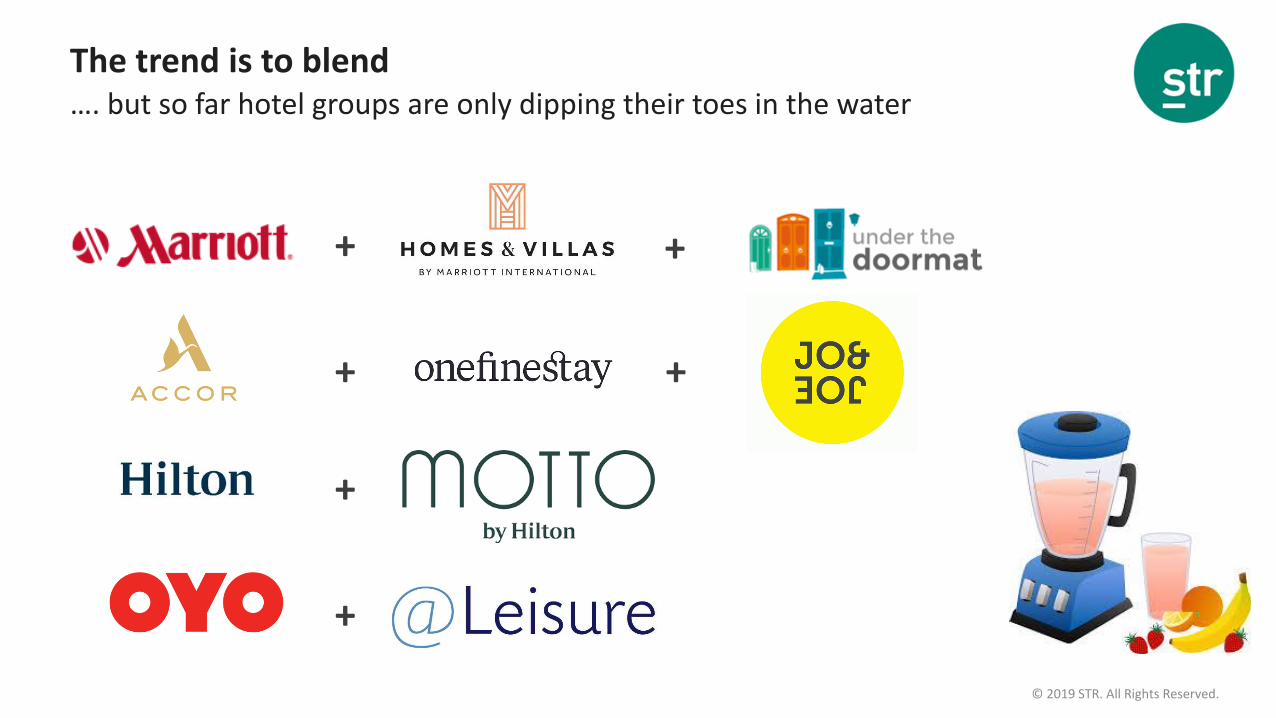
The trend is to blend…. but so far hotel groups are only dipping their toes in the water
+ +
+ +
+
+

© 2019 STR. All Rights Reserved.
Tipping point… sustainability & climate change

© 2019 STR. All Rights Reserved.
Google Trend: Climate ChangeOver the past 5 years
0
20
40
60
80
100
120
+260%

© 2019 STR. All Rights Reserved.
Google Trends: sustainable travel & carbon footprintTrend growth over the past year
0
20
40
60
80
100
120Sustainable travel: (Worldwide)
0
20
40
60
80
100
120
Carbon footprint: (Worldwide)
+60% +60%

© 2019 STR. All Rights Reserved.
Emissions from different modes of transportEmissions per passenger per km travelled

© 2019 STR. All Rights Reserved.
Making it more important to think about source markets … and how they get to your hotels
© 2019 STR. All Rights Reserved.
How many plastic bottles are use a day in the UK?
?21 million a day

© 2019 STR. All Rights Reserved.
Major chains ban single use plasticA significant positive trens

© 2019 STR. All Rights Reserved.
Conclusions

© 2019 STR. All Rights Reserved.
Tipping points
1. Hotel performance cycle
• Supply growth outpacing demand in many regions around the world
• Next few years likely to be challenging but opportunities for growth exist
2. Technology
• Expect more consolidation of our fragmented industry through technology
• The lines of competition will continue to blur across total paid accommodation
3. Sustainability and Climate Change
Source: Giphy.com
• Sustainability credentials and carbon footprint will play an increase role in the purchasing decisions of certain segments of consumers
• Don’t underestimate the ability for one individual to change a whole family’s purchasing decision

© 2019 STR, Inc. All Rights Reserved. Any reprint, use or republication of all or a part of this presentation without the prior written approval of STR, Inc. or STR Global, Ltd. trading as STR (collectively “STR”) is strictly prohibited. Any such reproduction shall specifically credit STR as the source. This presentation is based on data collected by STR. No strategic advice or marketing recommendation is intended or implied.
Thank You!
www.str.com
Robin Rossmann – Managing Director, STR


