Staff report for action on the Toronto Strong Neighbourhoods Strategy 2020 1
STAFF REPORT ACTION REQUIRED
Toronto Strong Neighbourhoods Strategy 2020 –
Recommended Neighbourhood Improvement Areas
Date: March 4, 2014
To: Community Development and Recreation Committee
From: Executive Director, Social Development, Finance and Administration
Wards: All
Reference
Number: AFS #18226
SUMMARY
This report recommends that Council adopt a Neighbourhood Equity Score for
establishing Neighbourhood Improvement Areas (NIAs) under the Toronto Strong
Neighbourhoods Strategy 2020 (TSNS 2020). The recommended Neighbourhood Equity
Score is a single number designed to capture the total weight of unnecessary, unfair and
unjust differences1 faced by neighbourhood residents in five key areas: Economic
Opportunities, Social Development, Healthy Lives, Participation in Decision-Making and
Physical Surroundings. The Score and Benchmark have been calculated using Urban
HEART@Toronto, an evidence-based standard for measuring the well-being of Toronto's
neighbourhoods.
The report recommends that Council designate 31 neighbourhoods as Neighbourhood
Improvement Areas under the Strategy. These recommended neighbourhoods have the
lowest overall Neighbourhood Equity Scores. Their Scores fall below the recommended
Neighbourhood Equity Benchmark, a measure that signals that the overall burden of
inequities faced by a neighbourhood requires action.
Under the 2005 Toronto Strong Neighbourhoods Strategy, a total of 23 of the City's 140
social planning neighbourhoods were designated and grouped together into 13 Priority
Neighbourhood Areas for Investment (PNIs) for implementation purposes. The 31
neighbourhoods recommended as NIAs under TSNS 2020 include 15 neighbourhoods
that were a part of the PNIs and 16 new neighbourhoods. A total of 8 neighbourhoods
included in the 2005-designated PNIs have Neighbourhood Equity Scores above
1 By definition, an inequity is an unnecessary, unfair and unjust difference. Because these differences are
unnecessary, action can be taken to remedy them.
Staff report for action on the Toronto Strong Neighbourhoods Strategy 2020 2
Benchmark and are not recommended as NIAs. A complete listing of Neighbourhood
Equity Scores for Toronto's 140 neighbourhoods, the Neighbourhood Equity Benchmark,
and recommended NIAs are provided in Appendix B.
Once NIAs have been designated by Council, implementation of the Strategy will begin
in five areas:
• Engagement with partners to establish implementation priorities;
• Targeted action in approved Neighbourhood Improvement Areas;
• Implementation in neighbourhoods that are not NIAs;
• Systemic change to improve equity across all neighbourhoods; and
• Strategy monitoring, evaluation and data development.
RECOMMENDATIONS
The Executive Director, Social Development, Finance and Administration
recommends that:
1. City Council adopt the method for calculating the Neighbourhood Equity Score and
Neighbourhood Equity Benchmark provided in Appendix A of this report;
2. City Council designate the 31 neighbourhoods with Neighbourhood Equity Scores
below the Neighbourhood Equity Benchmark as Neighbourhood Improvement Areas.
These neighbourhoods are listed in Appendix B of this report; and
3. City Council direct the Executive Director, Social Development, Finance and
Administration to work with partners in the implementation of the Toronto Strong
Neighbourhoods Strategy 2020, including residents, community agencies, funders
and City Agencies, Corporations and Divisions, to identify implementation priorities
for 2014 and beyond.
Financial Impact This report will have no financial impact beyond what has already been approved in the
2014 Operating Budget.
As a part of the 2014 Operating Budget process, Council approved an additional
$300,000 in Community Funding to support emerging needs in underserved areas. These
funds will be allocated during 2014 and 2015 to support the 8 neighbourhoods that are
transitioning from the Neighbourhood Improvement Area portfolio.
As a part of its 2014 Capital Budget process, Council approved a total of $12M in
funding for infrastructure investments in Neighbourhood Improvement Areas. A total of
$3M has been approved for each of 4 years beginning in 2015.

Staff report for action on the Toronto Strong Neighbourhoods Strategy 2020 3
Any financial impacts arising from implementation priorities for 2015 and beyond that
are identified by the Executive Director, Social Development, Finance and
Administration in conjunction with implementation partners will be considered as a part
of the appropriate budget process.
The Deputy City Manager and Chief Financial Officer has reviewed this report and
agrees with the financial impact information.
DECISION HISTORY At its meeting on June 29, 2011, the Community Development and Recreation
Committee, in response to a communication from Councillor Vincent Crisanti titled
Priority Neighbourhood Designation, directed the Executive Director of Social
Development, Finance and Administration to provide a report updating the Toronto
Strong Neighbourhoods Strategy.
http://app.toronto.ca/tmmis/viewAgendaItemHistory.do?item=2011.CD5.9
At its meeting of March 5, 6, and 7, 2012, Council adopted the report titled
Toronto Strong Neighbourhoods Strategy 2020 and directed the Executive Director,
Social Development, Finance and Administration to report back on the designation
criteria for NIAs and to seek authority for the next group of Neighbourhood Improvement
Areas. http://app.toronto.ca/tmmis/viewAgendaItemHistory.do?item=2012.CD10.3
At its meeting of July 16, 17, 18 and 19, 2013, City Council adopted the report titled
Toronto Strong Neighbourhoods Strategy 2020 Implementation with amendments. The
report provided updates on the process to develop the Neighbourhood Equity Score and
establish an evidence-based approach for the designation of Neighbourhood Improvement
Areas. http://app.toronto.ca/tmmis/viewAgendaItemHistory.do?item=2013.CD22.7
ISSUE BACKGROUND
The Toronto Strong Neighbourhoods Strategy was first adopted by Council in 2005,
premised on the understanding that an historic under-investment in the community
infrastructure of some Toronto neighbourhoods had resulted in a variety of challenges,
particularly in the area of community safety, and particularly for racialized youth.2 The
Strategy introduced Priority Neighbourhood Areas for Investment (PNI), neighbourhoods
where targeted investments in community infrastructure were most urgently needed.
The Strategy is one of the many approaches the City has available to improve the quality
of life for residents and enhance Toronto's reputation as a world class city. The Strategy's
2 Racialization is the process of assigning socially constructed racial categories onto certain groups, often to
their detriment. It is the act of imposing a racial interpretation on someone, typically casting them as 'other'
and inferior. The term 'racialized' commonly refers to people of non-European ancestry, or what was
previously known as 'visible minority. 'Non-racialized' commonly refers to individuals of European
ancestry, often thought to be the dominant group, and held up as the norm in society.
Staff report for action on the Toronto Strong Neighbourhoods Strategy 2020 4
intensive focus on the quality of life in neighbourhoods most closely parallels the City's
neighbourhood revitalization strategies that targets intensive capital and service
investments to strengthen neighbourhoods with a large number of social housing units.
TSNS 2020 also complements the development efforts that are reshaping Toronto's
waterfront, and enhances the broader city-building efforts that are guided by the Official
Plan. It also provides an important complement to sector strategies such as
Collaborating for Competitiveness, The Creative City, Housing Opportunities Toronto,
and Working as One, and to population-focused strategies such as the Middle Childhood
Strategy, the Toronto Youth Equity Strategy, the Toronto Seniors Strategy, and the
Toronto Newcomer Strategy.
In 2012, the Strategy was updated to reflect learnings from implementation and respond
to changes in the City's strategic goals and objectives that had taken place since 2005.
This first update to the Strategy has been designed to advance outcomes across Toronto
neighbourhoods until 2020, when a second update to the Strategy will be made with the
goal of strengthening all Toronto neighbourhoods.
The key change approved by Council in 2012 was a significant broadening of the
Strategy's goals and objectives. Whereas the 2005 Strategy placed its primary focus on
community safety, the updated Strategy will work to advance equitable economic, social,
health, environmental and participation outcomes in addition to community safety. This
change was motivated by a desire to build on the success of the 2005 Strategy and was
supported by a wide range of partners in the implementation of the Strategy.
Consistent with its goals and objectives, three factors were considered to identify PNIs
under the 2005 Strategy:
• A combination of demographic indicators (such as the percentage of recent
immigrants and the percentage of lone parent families) were used as a measure of
resident needs;
• the percentage of residents within one kilometre of the services they might most
need was used as a measure of the historical investments in social infrastructure;
and
• homicides and other gun shootings were used as a measure of community safety.
Although the designation of neighbourhoods under the Strategy was widely supported,
many residents and community agencies noted that their neighbourhoods had outcomes
that were similar to those of PNIs even though there was some service infrastructure in
place. They noted that because the method used a fairly simple measure of the services
or "inputs" available to address social needs, neighbourhoods that would have benefited
from a targeted approach to improve outcomes had not been identified for investment.
To support the updated Strategy's expanded goals, a revised, transparent method of
identifying neighbourhoods based on equity of outcomes has been under development
since 2012. This work has included extensive consultation, and the resulting
Staff report for action on the Toronto Strong Neighbourhoods Strategy 2020 5
Neighbourhood Equity Score and Neighbourhood Equity Benchmark are described in
detail in the following section.
The recommended approach allows the City to move from a primary focus on social
needs and service inputs to focus more sharply on the outcomes it wants to achieve for all
neighbourhoods. TSNS 2020 focuses squarely on reducing inequities: the unnecessary,
unfair and unjust differences in outcomes that the City, residents, community agencies
and other partners can take action to address.
COMMENTS
Measuring Neighbourhood Equity
To identify those neighbourhoods most in need of targeted attention to improve
outcomes, a measure of equity at the neighbourhood level was developed in five stages:
1. Research on neighbourhood equity measurement;
2. Public consultation on neighbourhood equity;
3. Development of options for calculating a neighbourhood equity score;
4. Implementation partner meetings; and
5. Finalizing an approach to measuring neighbourhood equity.
Research on Neighbourhood Equity Measurement:
To create a measure of neighbourhood equity, the City partnered with United Way
Toronto, the Centre for Research on Inner City Health, the Toronto Central Local Health
Integration Network and other partners to form the Urban HEART@Toronto project
(UHT). The project engaged a total of 80 researchers from the community, public,
private and academic sectors to determine the best available measures of neighbourhood
equity from five different perspectives: Economic Opportunities, Social Development,
Participation in Decision Making, Healthy Lives and Physical Surroundings.
A total of 15 indicators were selected by the project across these five areas, with each
indicator functioning like a snapshot of neighbourhood equity taken from a different
angle and location. Taken together, these 15 snapshots provide a compact, composite
picture of neighbourhood equity in Toronto. The full set of UHT indicators is provided
in Appendix A.
To create the clearest possible picture of neighbourhood equity, UHT also developed a
benchmark for each indicator. These benchmarks act as marker of the most serious
inequities. When a snapshot shows that a neighbourhood is beneath the benchmark for
the indicator, the neighbourhood likely requires immediate attention in the corresponding
equity area.
Staff report for action on the Toronto Strong Neighbourhoods Strategy 2020 6
Four methods were considered for each indicator to establish an appropriate benchmark:
1. Population Quintile: the rate at the 20th percentile of the population with the worst
rates;
2. Standard Deviation: the rate worse than 1 Standard Deviation from the mean rate;
3. Rate Ratio: the rate 1.2 times (20%) worse than city rate; and,
4. External Benchmark: based on the 20th percentile of 15 comparisons cities ranked by
worst rates.3
Potential benchmarks were screened against six criteria that paralleled those used to
screen the UHT indicator set:
1. Clear: the measures are understandable and easy to interpret;
2. Relevant: the measures are relevant and useful for Toronto neighbourhoods;
3. Equity-Focused: the measures demonstrate inequities, and the cut-off values are at a
level that represents issues of concern;
4. Variability: the measures reveal variability across Toronto neighbourhoods. A
benchmark should not be so low that fewer than 10% (14) or so high that more than
50% (70) of neighbourhoods are below benchmark;
5. Analytically Sound: the measures are quality, accepted and well-established in theory
and practice and are broadly supported as approaches for making comparisons; and
6. Comparability: the comparison data were available and measured the same way as the
Urban HEART indicators, and the external urban comparison places are relevant to
Toronto's urban density and population diversity.
The method that best met these six criteria was used to establish the benchmark for the
indicator. The complete set of UHT benchmarks is provided in Appendix A, along with a
map of each UHT indicator.
The UHT project's indicator identification phase concluded in September 2013, and
results are available online as a part of the Toronto Health Profiles at
http://www.torontohealthprofiles.ca/urbanheartattoronto.php.
Public Consultations on Neighbourhood Equity:
As soon as the UHT project's indicator identification phase was complete, public
consultations were conducted to provide residents with an opportunity help shape the use
of the data and the implementation of the overall Strategy. Consultations took place in
3 The 14 Canadian cities with at least 5% of the population comprised of recent immigrants in the previous
5 years and density of at least 1000 persons/km2 were chosen as comparators: Montréal, Calgary,
Edmonton, Mississauga, Winnipeg, Vancouver, Brampton, Surrey, Markham, Burnaby, Saskatoon,
Richmond, Richmond Hill, and Coquitlam.
Staff report for action on the Toronto Strong Neighbourhoods Strategy 2020 7
October and November 2013, and engaged 380 residents in person through both City and
community-agency led meetings. Approximately 1,400 residents participated in a survey
that was available online and in print format. The full results of the consultation process
are provided in Appendix C.
Development of Options for Calculating a Neighbourhood Equity Score:
During December 2013, a number of possible options for calculating a Neighbourhood
Equity Score using the UHT data in a way that reflected the advice provided by residents
during consultations were developed and tested. Of these, two options were identified as
being both methodologically sound and consistent with resident advice. Materials were
developed to explain these options and their implications for subsequent discussion by
the Strategy's implementation partners.
Implementation Partner Meetings:
A series of meetings were held in January 2014 with both past and potential partners in
the implementation of the Toronto Strong Neighbourhoods Strategy 2020 (TSNS 2020).
These meetings engaged City Divisions, Agencies and Corporations, educational
institutions, government and community funders, community agencies and resident
leaders. Partners reviewed and commented on the two options developed for creating a
Neighbourhood Equity Score, and provided advice on key implementation issues and
approaches.
Finalizing an Approach to Neighbourhood Equity Measurement:
A preferred option for creating a Neighbourhood Equity Score was identified based on
the advice of implementation partners and the public consultations. This preferred option
was reviewed with the Deputy City Manager , Cluster A, Division Heads from Cluster A,
the Chief Planner, and the Medical Officer of Health, all of whom were supportive of this
option.
Neighbourhood Equity Scores for all 140 Toronto neighbourhoods were calculated using
the preferred option, and the corresponding Neighbourhood Equity Benchmark
determined. This option is described in greater detail in the following section.
Calculating a Neighbourhood Equity Score
The recommended Neighbourhood Equity Score and Neighbourhood Equity Benchmark
have been calculated by applying a statistical method called a Principle Components
Analysis (PCA) to the UHT indicators and benchmarks. This technique identifies how
much of the overall composite picture of equity across Toronto neighbourhoods each of
the 15 UHT indicator snapshots provide.
The PCA technique found that each of the 15 UHT indicator snapshots provide different
percentages of the overall composite picture of neighbourhood equity. For example, the
unemployment indicator provides 10.6% of the overall picture of neighbourhood equity,
Staff report for action on the Toronto Strong Neighbourhoods Strategy 2020 8
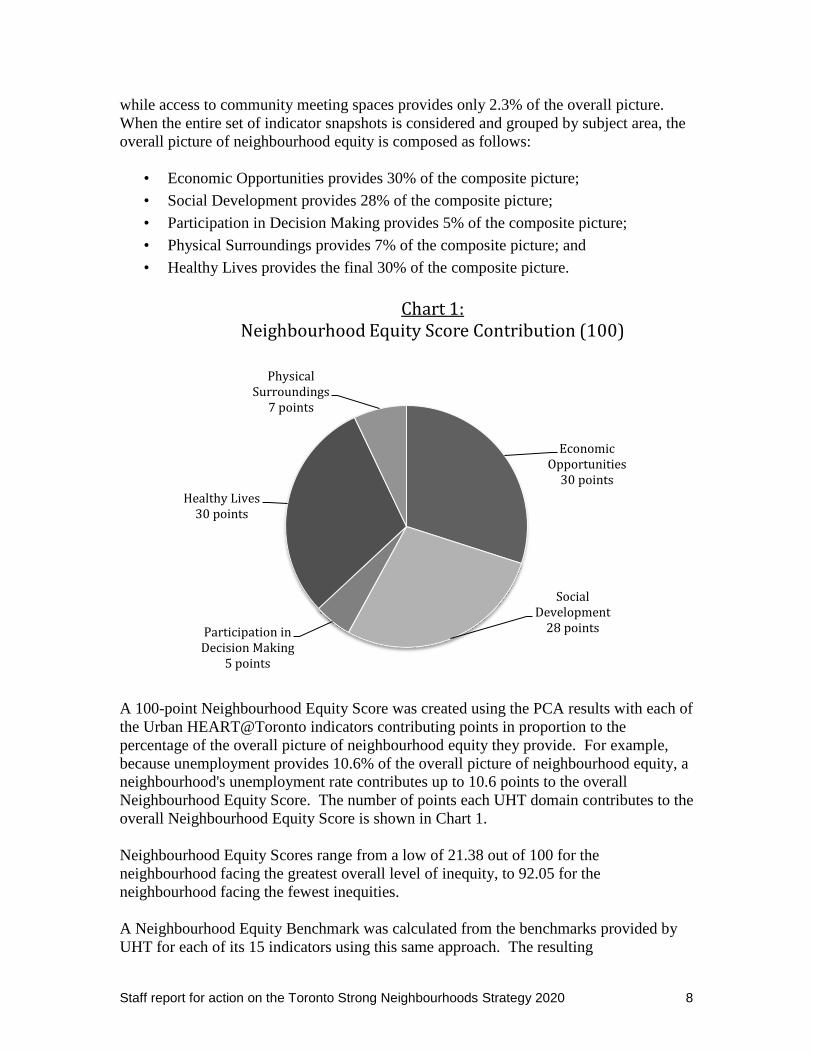
while access to community meeting spaces provides only 2.3% of the overall picture.
When the entire set of indicator snapshots is considered and grouped by subject area, the
overall picture of neighbourhood equity is composed as follows:
• Economic Opportunities provides 30% of the composite picture;
• Social Development provides 28% of the composite picture;
• Participation in Decision Making provides 5% of the composite picture;
• Physical Surroundings provides 7% of the composite picture; and
• Healthy Lives provides the final 30% of the composite picture.
A 100-point Neighbourhood Equity Score was created using the PCA results with each of
the Urban HEART@Toronto indicators contributing points in proportion to the
percentage of the overall picture of neighbourhood equity they provide. For example,
because unemployment provides 10.6% of the overall picture of neighbourhood equity, a
neighbourhood's unemployment rate contributes up to 10.6 points to the overall
Neighbourhood Equity Score. The number of points each UHT domain contributes to the
overall Neighbourhood Equity Score is shown in Chart 1.
Neighbourhood Equity Scores range from a low of 21.38 out of 100 for the
neighbourhood facing the greatest overall level of inequity, to 92.05 for the
neighbourhood facing the fewest inequities.
A Neighbourhood Equity Benchmark was calculated from the benchmarks provided by
UHT for each of its 15 indicators using this same approach. The resulting
Economic Opportunities
30 points
Social Development
28 points Participation in Decision Making
5 points
Healthy Lives 30 points
Physical Surroundings
7 points
Chart 1: Neighbourhood Equity Score Contribution (100)
Staff report for action on the Toronto Strong Neighbourhoods Strategy 2020 9
Neighbourhood Equity Benchmark was calculated at 42.89 points out of 100, and
neighbourhoods with Scores below this value face a significant burden of inequities
across the five UHT domains.
A total of 31 neighbourhoods, or 22% of Toronto's 140 neighbourhoods, have Scores
below the Neighbourhood Equity Benchmark. These neighbourhoods face significant
inequities in Economic Opportunities, Social Development, Participation in Decision-
Making, Healthy Lives and Physical Surroundings and are recommended for targeted
support as Neighbourhood Improvement Areas (NIAs) under the Strategy. The
Neighbourhood Equity Scores for all neighbourhoods and the Neighbourhood Equity
Benchmark are provided in Appendix B.
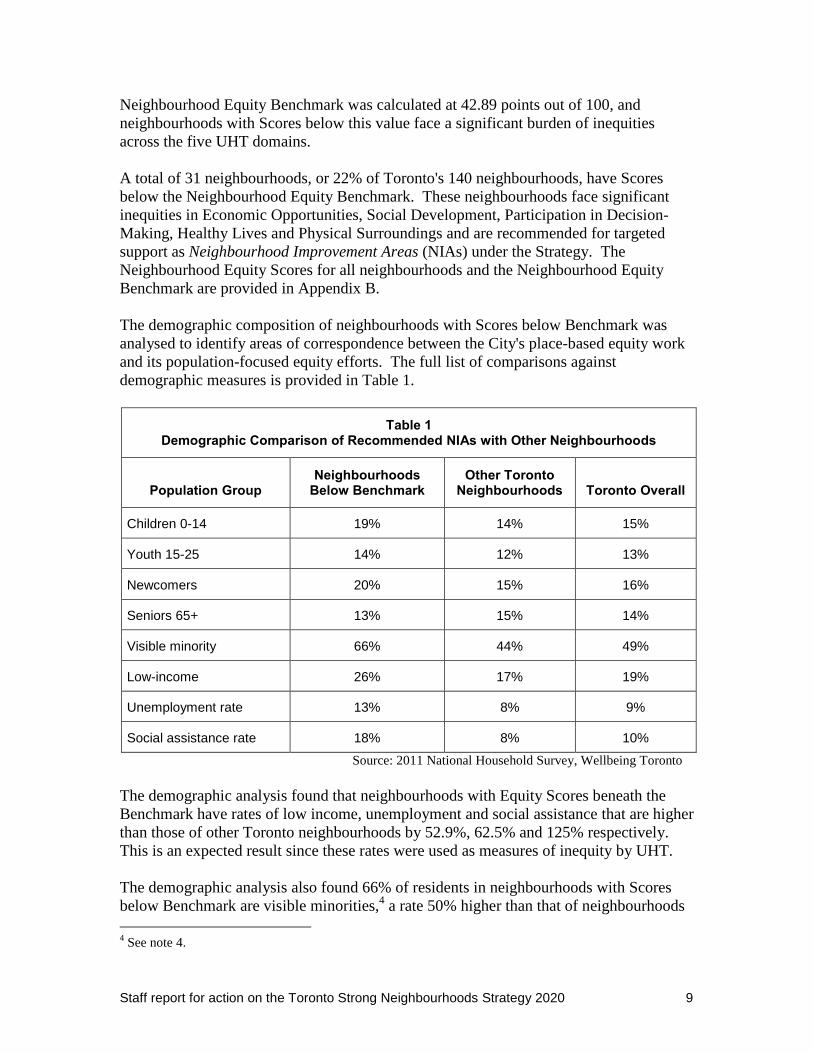
The demographic composition of neighbourhoods with Scores below Benchmark was
analysed to identify areas of correspondence between the City's place-based equity work
and its population-focused equity efforts. The full list of comparisons against
demographic measures is provided in Table 1.
Table 1 Demographic Comparison of Recommended NIAs with Other Neighbourhoods
Population Group Neighbourhoods
Below Benchmark Other Toronto
Neighbourhoods Toronto Overall
Children 0-14 19% 14% 15%
Youth 15-25 14% 12% 13%
Newcomers 20% 15% 16%
Seniors 65+ 13% 15% 14%
Visible minority 66% 44% 49%
Low-income 26% 17% 19%
Unemployment rate 13% 8% 9%
Social assistance rate 18% 8% 10%
Source: 2011 National Household Survey, Wellbeing Toronto
The demographic analysis found that neighbourhoods with Equity Scores beneath the
Benchmark have rates of low income, unemployment and social assistance that are higher
than those of other Toronto neighbourhoods by 52.9%, 62.5% and 125% respectively.
This is an expected result since these rates were used as measures of inequity by UHT.
The demographic analysis also found 66% of residents in neighbourhoods with Scores
below Benchmark are visible minorities,4 a rate 50% higher than that of neighbourhoods
4 See note 4.
Staff report for action on the Toronto Strong Neighbourhoods Strategy 2020 10
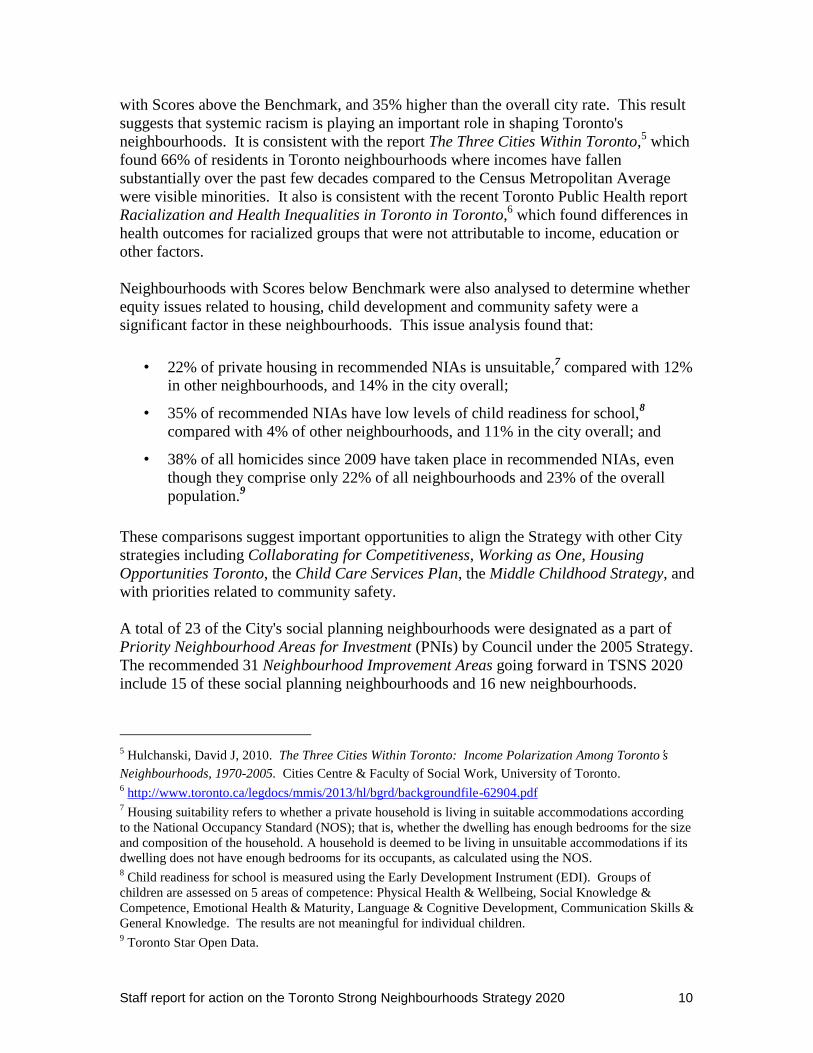
with Scores above the Benchmark, and 35% higher than the overall city rate. This result
suggests that systemic racism is playing an important role in shaping Toronto's
neighbourhoods. It is consistent with the report The Three Cities Within Toronto,5 which
found 66% of residents in Toronto neighbourhoods where incomes have fallen
substantially over the past few decades compared to the Census Metropolitan Average
were visible minorities. It also is consistent with the recent Toronto Public Health report
Racialization and Health Inequalities in Toronto in Toronto,6 which found differences in
health outcomes for racialized groups that were not attributable to income, education or
other factors.
Neighbourhoods with Scores below Benchmark were also analysed to determine whether
equity issues related to housing, child development and community safety were a
significant factor in these neighbourhoods. This issue analysis found that:
• 22% of private housing in recommended NIAs is unsuitable,7 compared with 12%
in other neighbourhoods, and 14% in the city overall;
• 35% of recommended NIAs have low levels of child readiness for school,8
compared with 4% of other neighbourhoods, and 11% in the city overall; and
• 38% of all homicides since 2009 have taken place in recommended NIAs, even
though they comprise only 22% of all neighbourhoods and 23% of the overall
population.9
These comparisons suggest important opportunities to align the Strategy with other City
strategies including Collaborating for Competitiveness, Working as One, Housing
Opportunities Toronto, the Child Care Services Plan, the Middle Childhood Strategy, and
with priorities related to community safety.
A total of 23 of the City's social planning neighbourhoods were designated as a part of
Priority Neighbourhood Areas for Investment (PNIs) by Council under the 2005 Strategy.
The recommended 31 Neighbourhood Improvement Areas going forward in TSNS 2020
include 15 of these social planning neighbourhoods and 16 new neighbourhoods.
5 Hulchanski, David J, 2010. The Three Cities Within Toronto: Income Polarization Among Toronto’s
Neighbourhoods, 1970-2005. Cities Centre & Faculty of Social Work, University of Toronto. 6 http://www.toronto.ca/legdocs/mmis/2013/hl/bgrd/backgroundfile-62904.pdf
7 Housing suitability refers to whether a private household is living in suitable accommodations according
to the National Occupancy Standard (NOS); that is, whether the dwelling has enough bedrooms for the size
and composition of the household. A household is deemed to be living in unsuitable accommodations if its
dwelling does not have enough bedrooms for its occupants, as calculated using the NOS. 8 Child readiness for school is measured using the Early Development Instrument (EDI). Groups of
children are assessed on 5 areas of competence: Physical Health & Wellbeing, Social Knowledge &
Competence, Emotional Health & Maturity, Language & Cognitive Development, Communication Skills &
General Knowledge. The results are not meaningful for individual children. 9 Toronto Star Open Data.
Staff report for action on the Toronto Strong Neighbourhoods Strategy 2020 11
A total of eight neighbourhoods included in the PNIs have Neighbourhood Equity Scores
above Benchmark and are not recommended in the next generation of NIAs: Malvern,
Dorset Park, Westminster-Branson, Steeles and L'Amoreaux (adjacent neighbourhoods
referred to as the Steeles-L'Amoreaux PNI), Yorkdale-Glen Park and Englemount-
Lawrence (adjacent neighbourhoods referred to as the Lawrence Heights PNI), and
Humber Heights-Westmount (included as a part of the Weston-Mount Dennis PNI). The
work that will be undertaken to ensure the gains made in these neighbourhoods under the
2005 Strategy are maintained and strengthened are described in the following section of
the report.
This report makes two recommendations related to Neighbourhood Improvement Areas.
First, the report recommends that Council adopt the method of calculating a
Neighbourhood Equity Score and Neighbourhood Equity Benchmark described here and
in detail in Appendix A. Second, the report recommends that Council designate the 31
neighbourhoods with Scores below the Benchmark as Neighbourhood Improvement
Areas under TSNS 2020.
Next Steps in TSNS 2020's Implementation
Once Council approves the next generation of NIAs, work will take place in five inter-
related areas to implement TSNS 2020:
1. Engagement with partners to establish implementation priorities;
2. Targeted action in approved Neighbourhood Improvement Areas;
3. Implementation across neighbourhoods that are not NIAs;
4. Systemic change to improve equity across all neighbourhoods; and
5. Strategy monitoring, evaluation and data development.
Engagement with partners to establish implementation priorities:
During consultations on neighbourhood equity, residents, community agencies, funders
and other partners critical to the success of the 2005 Strategy expressed significant
interest in participating in the revised Strategy's implementation planning. City Agencies,
Corporations and Divisions are also committed to drawing from best practices to advance
equitable outcomes across neighbourhoods and have identified a number of opportunities
to align activities under the Strategy with their own strategic initiatives.
To ensure the Strategy makes best use of all available resources, this report recommends
that the Executive Director, Social Development, Finance and Administration work with
implementation partners to identify implementation priorities for 2014 and beyond. This
engagement and coordination will take place during the second and third quarters of
2014.
Staff report for action on the Toronto Strong Neighbourhoods Strategy 2020 12
Targeted action in approved Neighbourhood Improvement Areas:
The strength of the 2005 Toronto Strong Neighbourhoods Strategy was its ability to focus
a wide range of resources on the Council designated Priority Neighbourhood Areas for
Investment. Since 2005, the Strategy has brought significant activity and investment in
the form of improved City and community services; investments in new programs,
facilities and initiatives by the City, United Way Toronto, the federal and provincial
governments, the private sector, and community partners; new and strengthened
partnerships among service providers from all sectors; and a significant expansion in
resident engagement and leadership at the local level.
In 2011, partners in the Strategy's implementation identified this unique combination of
activities as essential to the development of strong neighbourhoods, and recommended
their enhancement in PNIs and beyond. These activities were subsequently approved by
Council in 2012 as foundational elements of TSNS 2020 under the categories:
Continuous Service Improvement, Targeted Investments, Networks and Service
Partnerships, and Resident Engagement.
Planning for implementation of these Strategy elements at the local level will begin
immediately in all neighbourhoods designated as NIAs by Council. This planning will
include an assessment of neighbourhood assets (such as community leadership, existing
programs and facilities, community organizations, and networks and partnerships) that
will provide an important foundation for equity-building work within the five key areas
according to local priorities: Economic Opportunities, Social Development, Healthy
Lives, Participation in Decision-Making and Physical Surroundings. Because the goals of
TSNS 2020 are much broader that those of the 2005 version, this transitional work will
also take place in neighbourhoods that are already NIAs.
Implementation in neighbourhoods that are not NIAs:
Because the goal of TSNS 2020 is to advance equitable outcomes across all
neighbourhoods, the Strategy's implementation must also positively impact the wellbeing
of neighbourhoods that are not Council-designated NIAs. There are no Toronto
neighbourhoods that meet the targets recommended by the Urban HEART@Toronto
project for all measures of neighbourhood equity, and many Toronto neighbourhoods
have Neighbourhood Equity Scores only minimally above the Neighbourhood Equity
Benchmark.
A total of eight previously-designated neighbourhoods have Scores above Benchmark
and are not recommended in the next generation of NIAs. Over the past year, efforts
have been underway in these and other designated neighbourhoods to advance the
community's leadership of neighbourhood improvement work. These efforts will help to
solidify the gains that have been made in neighbourhood wellbeing over the last eight
years, and ensure that these neighbourhood's Equity Scores remain above Benchmark.
TSNS 2020 is not a redistribution strategy; the goal is not to remove resources from some
neighbourhoods in order to strengthen others. The research underpinning the 2005
Strategy indicated that redistribution simply destabilizes other neighbourhoods elsewhere
Staff report for action on the Toronto Strong Neighbourhoods Strategy 2020 13
in the city and the goal of the Toronto Strong Neighbourhoods Strategy is to strengthen
all of the city's neighbourhoods by targeted actions and investments to bring those facing
the most inequities above benchmark.
During the 2014 Operating Budget process, Council designated an additional $300,000 in
Community Funding to support emerging needs in underserved areas. These funds will
be allocated during 2014 and 2015 to support the eight neighbourhoods that are
transitioning from the NIA portfolio. These funds will be used to help ensure that
support exists within these transitioning neighbourhoods to convene continued local
improvement planning and delivery efforts.
To advance the Strategy in other neighbourhoods that are not designated as NIAs, Social
Development, Finance and Administration has already begun working with other City
Divisions, Agencies and Corporations to identify the ways in which their strategic
priorities align with those of TSNS. The purpose of this work is to ensure that all of the
City's strategic initiatives are implemented in a way that strengthens neighbourhoods.
Although TSNS is a place-based strategy, its implementation will be coordinated with
other City population and service priorities both in neighbourhoods that are NIAs and
beyond. For example:
• Toronto Employment and Social Services' initiatives to improve rates of
employment and income levels among residents could be coordinated and piloted
across neighbourhoods that face inequities in Economic Opportunities;
• Programs designed to improve the health of racialized groups could be piloted in
neighbourhoods facing inequities in the area of Healthy Lives to determine
whether the impact of racism on the health of Toronto's ethno-racial communities
can be reduced; and
• Programs designed to address the mental health needs of communities
experiencing high rates of violence could be piloted across neighbourhoods to
help build community resilience, whether or not they are designated as NIAs.
Opportunities to pilot these kinds of population and service-focused initiatives in both
NIAs and other Toronto neighbourhoods will be explored with partners during the second
and third quarters of 2014 as a part of implementation planning and priority setting.
Systemic Change to Improve Equity Across All Neighbourhoods:
The majority of the equity issues faced by Toronto neighbourhoods do not have their root
causes in the neighbourhoods themselves. Instead, broader economic, social, health and
environmental policy decisions create inequities that are concentrated spatially in cities,
and result in the patterns of inequity evident across Toronto's neighbourhoods.
Staff report for action on the Toronto Strong Neighbourhoods Strategy 2020 14
For example, low income residents do not experience poverty because of the
neighbourhoods they live in. They live in poverty in part because of policies that have
established the Minimum Wage at rates that do not pull full-time workers above the Low
Income Measure, the low level of financial support provided by Ontario Works and the
Ontario Disability Support Program, and barriers that prevent them from accessing the
Employment Insurance Program. They also have low incomes because of a lack of well-
paying quality jobs and other economic and labour market trends not attributable to any
single policy decision.
Low income residents live in the neighbourhoods they do largely because of their low
incomes and because of the nature of the housing market. As Hulchanski noted in his
report The Three Cities Within Toronto:
The price of housing is a key determinant of neighbourhood stability or
change in societies where the real estate market largely governs access to
housing. Higher-income households can always outbid lower-income
households for housing quality and preferred locations. If a lower-income
neighbourhood has characteristics that a higher-income group finds
desirable, gentrification occurs and the original residents are displaced.
The opposite also occurs. Some neighbourhoods, once popular among
middle- or higher income households, fall out of favour and property
values fail to keep up with other neighbourhoods. Over time, lower-
income households replace middle- and higher-income households.
Because of the central role that systemic issues and policies play in shaping equity across
neighbourhoods, all place-based approaches are necessarily limited in what they can
accomplish with location-specific efforts. At the local level, their true strength and
effectiveness lie in their ability to develop collective assets such as community facilities,
programs and services, and community leadership that can create significant
improvements in the quality of residents' lives.
TSNS 2020 explicitly recognizes the need to develop collective assets at the local level
with its first objective: "to ensure every Toronto neighbourhood has the public, private
and community infrastructure required for equitable resident opportunities." The need to
complement this place-specific work with efforts to affect broader systems is reflected in
its second objective: "to ensure broader municipal, regional, provincial and national
policies, programs and funding priorities are informed by a neighbourhoods perspective."
To support this second objective, a new tool has been developed to complement the
Strategy's neighbourhood-focused work: a Neighbourhood Lens. The purpose of the
Lens is to bring important characteristics about neighbourhoods into focus for those who
do not work directly in neighbourhoods. The Lens allows decision-makers to better
assess the intended and unintended neighbourhood-level impacts of broader policies,
programs and funding priorities.
As a part of this implementation of the Strategy, the Lens will be piloted by SDFA and
other divisions to help identify how City policies, programs and funding priorities could
Staff report for action on the Toronto Strong Neighbourhoods Strategy 2020 15
better advance equity at the neighbourhood level while furthering equity for diverse
population groups. Its use will be complemented by an enhanced population-focused
Equity Lens currently under development by the Equity, Diversity and Human Rights
Office.
The Lens will also be an important offering as part of a plan to engage a wide array of
private, public and community funders in advancing equity across Toronto
neighbourhoods. This funder engagement plan will be developed in collaboration with
United Way Toronto with the goal of ensuring that the federal, provincial, and regional
policies, programs and funding priorities that have an impact on the advancement of
equitable neighbourhood outcomes and the provision of equitable resident opportunities
are informed by a neighbourhoods perspective.
Strategy Monitoring, Evaluation and Data Development:
The successes of the 2005 Strategy in building equity for residents in PNIs has been well
documented. Over a period of eight years, more than 50,000 youth and 38,000 other
residents were reached under the Strategy by:
• the more than 1,200 engagement, education, skill development, justice and
community and family initiatives that took place; and
• the 52 new or enhanced community facilities that were developed, including 10
multi-service community hubs, 20 youth programming spaces, 2 community
programming rooms, 11 playgrounds and recreation facilities, 2 community
centres, and 7 parks and outdoor gathering spaces.
The 2005 Strategy increased community infrastructure and increased program and service
opportunities for residents in 23 social planning neighbourhoods across the city. The
impact of these initiatives and facilities will support resident wellbeing in
neighbourhoods for years to come.
Although the concrete products that emerged from the Strategy are well documented, the
impact that the Strategy could have on longer-term outcomes, such as community safety
and economic prosperity, are not known. To better understand the Strategy's impact both
on neighbourhoods and on system-level outcomes, a monitoring and evaluation plan will
be developed with internal and external partners during 2014.
The plan will include the development of important neighbourhood equity measures that
are not currently available. Indicator development will focus on the areas of safety,
housing, transit, racism, participation in decision-making and the community service
system – areas identified as critical to neighbourhood wellbeing by participants in the
Strategy's consultations on neighbourhood equity.
A wide range of partners, including City Divisions, Agencies and Corporations, academic
and research institutions, and community agencies are already working to develop
measures of equity relevant to Toronto neighbourhoods. For example, Toronto Police
Staff report for action on the Toronto Strong Neighbourhoods Strategy 2020 16
Service has expressed its interest in working with SDFA and others to develop measures
of community safety at the neighbourhood level; Shelter, Support and Housing
Administration has indicated its willingness to assist in the development of a housing
equity indicator at the neighbourhood level; Toronto Public Health has committed to
working with SDFA and other partners on the development of a transit equity indicator;
and community agencies are keen to engage with SDFA on the development of measures
of equity for the community service system. Priorities for the development of these and
other measures of neighbourhood equity will be established with the Strategy's
implementation partners as a part of the implementation planning that will take place
beginning in the second quarter of 2014.
CONTACT
Denise Andrea Campbell Sarah Rix
Director, Community Resources Policy Development Officer
Social Development, Social Development,
Finance & Administration Finance & Administration
T: 416-392-8608 T: 416-392-8944
E: [email protected] E: [email protected]
SIGNATURE
_______________________________________
Chris Brillinger
Executive Director
Social Development, Finance & Administration
ATTACHMENTS
Appendix A – TSNS 2020 Neighbourhood Equity Index - Methodological
Documentation
Appendix B – Neighbourhood Equity Scores for Toronto Neighbourhoods and
Recommended Neighbourhood Improvement Areas
Appendix C – Public Consultation Results – Summary and Complete Notes


