Download - STATISTICAL INTERPRETATION AND GROUNDWATER …

www.wjpps.com Vol 3, Issue 6, 2014.
1376
Jayalakshmi et al. World Journal of Pharmacy and Pharmaceutical Sciences
STATISTICAL INTERPRETATION AND GROUNDWATER
MANAGEMENT PLAN AT THE EXTREME ENDS OF PAMBAN
BRIDGE, TAMIL NADU, INDIA
B. Jayalakshmi*1, T. Ramachandramoorthy2, A. Paulraj3, S.Rajathi1,
S. Amala Fatima Rani4
*1Syed Ammal Engineering College, Ramanathapuram-623 502, Tamil Nadu, India. 2Bishop Heber College (Autonomous), Tiruchirappalli-620 017, Tamil Nadu, India.
3St.Joseph’s College (Autonomous), Tiruchirappalli-620 002, Tamil Nadu, India. 4Holy Cross College (Autonomous), Tiruchirappalli-620 002, Tamil Nadu, India.
ABSTRACT
Pamban bridge is a cantilever bridge that connect an island
(Rameswaram) to the mainland (Mandapam) in Tamil Nadu, India.
The objective of the present study is to examine the water quality
parameters namely pH, electrical conductivity (EC), total dissolved
solids (TDS), salinity (SAL), total alkalinity (TA), calcium hardness
(CH), magnesium hardness (MH), total hardness (TH), chloride (Cl),
and fluoride (F) at the extreme ends of the Pamban bridge for the year
2014. The Langelier Saturation Index (LSI) values confirm the
corrosion tendency in most of the groundwater samples. The Water
Quality Index (WQI) value proves the groundwater with potable nature
though the area is seashore. The Principal Component Analysis (PCA) identifies the
seawater intrusion by loading factors. The scatter diagram confirms the correlation of Cl with
CH and TDS.
KEY WORDS: Pamban, Water quality, LSI, WQI, PCA.
INTRODUCTION
Groundwater is used for domestic and industrial water supply and irrigation all over the
world. In the last few decades, there has been an increase in the demand for freshwater
because of rapid growth of population and the hastened pace of industrialization1. With rapid
increase in population and growth of industrialization, groundwater quality is being
WWOORRLLDD JJOOUURRNNAALL OOFF PPHHAARRMMAACCYY AANNDD PPHHAARRMMAACCEEUUTTIICCAALL SSCCIIEENNCCEESS SSJJIIFF IImmppaacctt FFaaccttoorr 22..778866
VVoolluummee 33,, IIssssuuee 66,, 11337766--11339900.. RReesseeaarrcchh AArrttiiccllee IISSSSNN 2278 – 4357
Article Received on 25 March 2014, Revised on 20 April 2014, Accepted on 15 May 2014
*Correspondence for Author
B. Jayalakshmi
Syed Ammal Engineering
College, Ramanathapuram-623
502, Tamil Nadu, India.
www.wjpps.com Vol 3, Issue 6, 2014.
1377
Jayalakshmi et al. World Journal of Pharmacy and Pharmaceutical Sciences
increasingly threatened by agricultural, chemicals and disposal of urban and industrial
wastes. In many coastal towns or cities, groundwater is the only source of freshwater to meet
domestic, agricultural and industrial needs. But groundwater is under constant threat of salty
water intrusion, which has become a worldwide concern2. Salinization is the most widespread
form of groundwater contamination, especially in coastal aquifers and is represented by the
increase of total dissolved solids (TDS)3. The major problems in the groundwater of coastal
areas are the ever-increasing freshwater demands, declining sustainability of tube wells and
salinity ingress in coastal aquifers4. Groundwater quality were assessed by multivariate
analysis and have been reported by various authors5-16. The present study has an objective to
characterize the quality of groundwater samples for their potable status at the extreme ends of
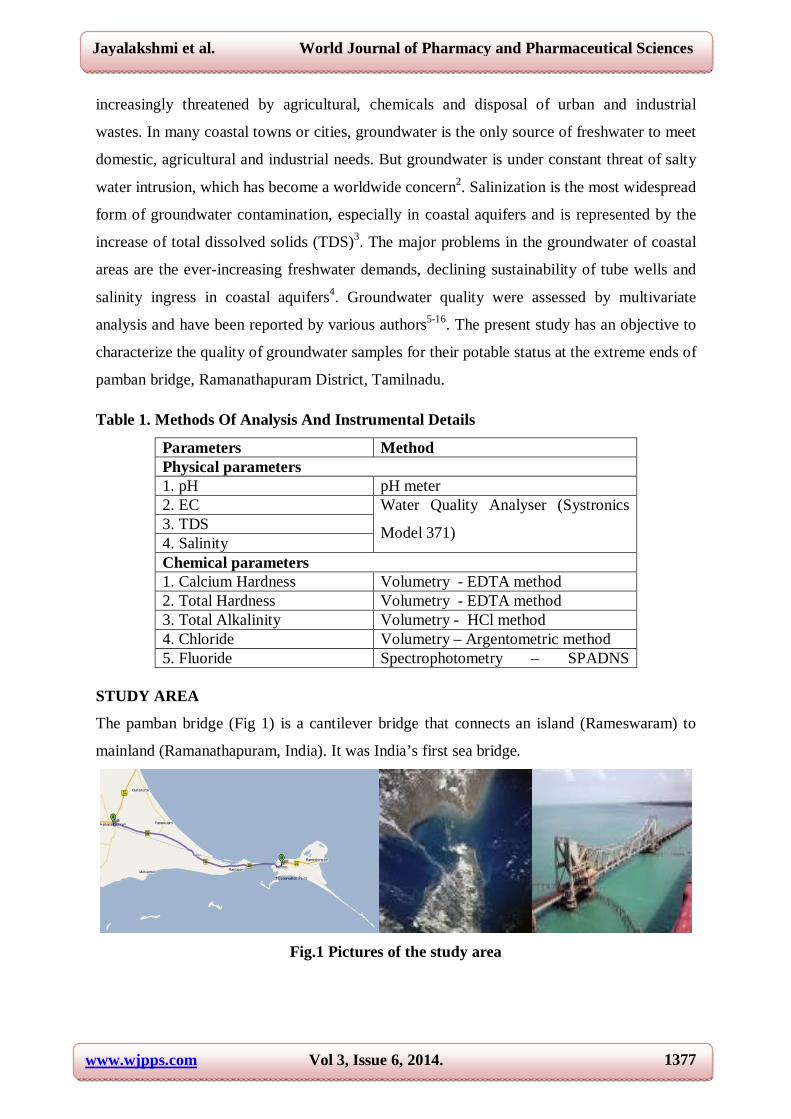
pamban bridge, Ramanathapuram District, Tamilnadu. Table 1. Methods Of Analysis And Instrumental Details
Parameters Method Physical parameters 1. pH pH meter 2. EC Water Quality Analyser (Systronics
Model 371) 3. TDS 4. Salinity Chemical parameters 1. Calcium Hardness Volumetry - EDTA method 2. Total Hardness Volumetry - EDTA method 3. Total Alkalinity Volumetry - HCl method 4. Chloride Volumetry – Argentometric method 5. Fluoride Spectrophotometry – SPADNS
STUDY AREA
The pamban bridge (Fig 1) is a cantilever bridge that connects an island (Rameswaram) to
mainland (Ramanathapuram, India). It was India’s first sea bridge.
Fig.1 Pictures of the study area

www.wjpps.com Vol 3, Issue 6, 2014.
1378
Jayalakshmi et al. World Journal of Pharmacy and Pharmaceutical Sciences
MATERIALS AND METHODS
109 groundwater samples were collected during February 2014 at the extreme ends of
Pamban Bridge Bridge (49 km from Pamban bridge west end (PBWE) and 60 km from
Pamban bridge east end (PBEE)) and examined for water quality profile. Water samples were
collected from open wells, bore wells, hand pumps and ponds. All the samples were analyzed
by following the standard guidelines17.
WATER QUALITY INDEX
Water quality index18 expresses overall water quality based on several water quality
parameters. To determine the suitability of the ground water for drinking purpose, Water
Quality Index is calculated with the following formula
WQI = Antilog [SWnn=1 log 10qn]
where, Wn , Weightage = K/Sn and K, constant = 1/ (Sn, n=1 1 /Si)
Sn and Si correspond to the WHO / ICMR standard value of the parameters.
Quality rating (Q) is calculated as
Qni= [(Vactual – V ideal)/ (Vstandard - V ideal)] x 100
Where Qni = quality rating of ith parameter for ‘n’ water samples
Vactual = value of the water quality parameter obtained from the laboratory analysis
Vstandard = value of the water quality parameter obtained from the standard Tables
V ideal for pH =7 and for the other parameters it is equivalent to zero.
Langelier Saturation Index
The Langelier Saturation Index (LSI; also called Langelier Stability Index) is a calculated
number used to predict the calcium carbonate stability of water; that is, whether water will
precipitate, dissolve, or be in equilibrium with calcium carbonate. Usually, the LSI value
ranges from -3 to +3. The LSI is expressed as the difference between the pH and the
saturation pH.
LSI = pH - pHs
pHs = (9.3 + a + b) - (c + d)
Where pH = -log[H+],
a = (log10 [TDS] - 1) / 10
b = -13.12 x log10 (T + 273) + 34.55
c = log10 [Ca+2 as CaCO3] - 0.4
d = log10 [alkalinity as CaCO3]
www.wjpps.com Vol 3, Issue 6, 2014.
1379
Jayalakshmi et al. World Journal of Pharmacy and Pharmaceutical Sciences
pHs = pH for a saturated solution of CaCO3,
T= Temperature in ˚C.
If the pH of the water is below the calculated saturation pH, the LSI is negative, which makes
the CaCO3 dissolve in water and the water has a limited scaling potential. If the pH exceeds
pHs, the LSI is positive and it is being supersaturated with CaCO3 and the water has a
tendency to form a scale. At increasing positive index values, the scaling potential increases.
According to Langelier, the corrosive action of water is mainly because of the presence of
excess of free CO2 and carbonates of calcium and magnesium. The interaction of free CO2
with calcium and magnesium carbonates affects the carbonate equilibrium that leads to
corrosion. The lower the pH with high free carbon dioxide, the higher the potential level of
corrosion compared with the higher pH with low free CO2 19.
Data Processing
Data obtained from the laboratory analysis were used as variable inputs for Factor Analysis
(FA) and was performed using the SPSS package version 20.
Factor Analysis can be considered as data reduction technique because it reduces a large no,
of variables that often overlap to a smaller number of factors. Usually, the minor pcs can be
eliminated to simplify the analysis because of their poor interpretation of the data structures.
Though the significant PCs are fewer, they can still provide information on the most
meaningful parameters which describes a whole data set affording data reduction with
minimum loss of original information.
In this study, the Eigen value one criterion was used to determine the numbers of PCs based
on the assumption that only Eigen values greater than one were considered important and the
higher Eigen values are more significant. Varimax normalization was then applied as the
rotation method in the analysis on the PCs for better interpretation of results. Varimax factor
loadings of 0.75 were considered strong, although the terms ‘strong’, ‘moderate’ and ‘weak’
as applied to loadings, refer to absolute loading values of >0.75, 0.75-0.50 and 0.50-0.30,
respectively.
www.wjpps.com Vol 3, Issue 6, 2014.
1380
Jayalakshmi et al. World Journal of Pharmacy and Pharmaceutical Sciences
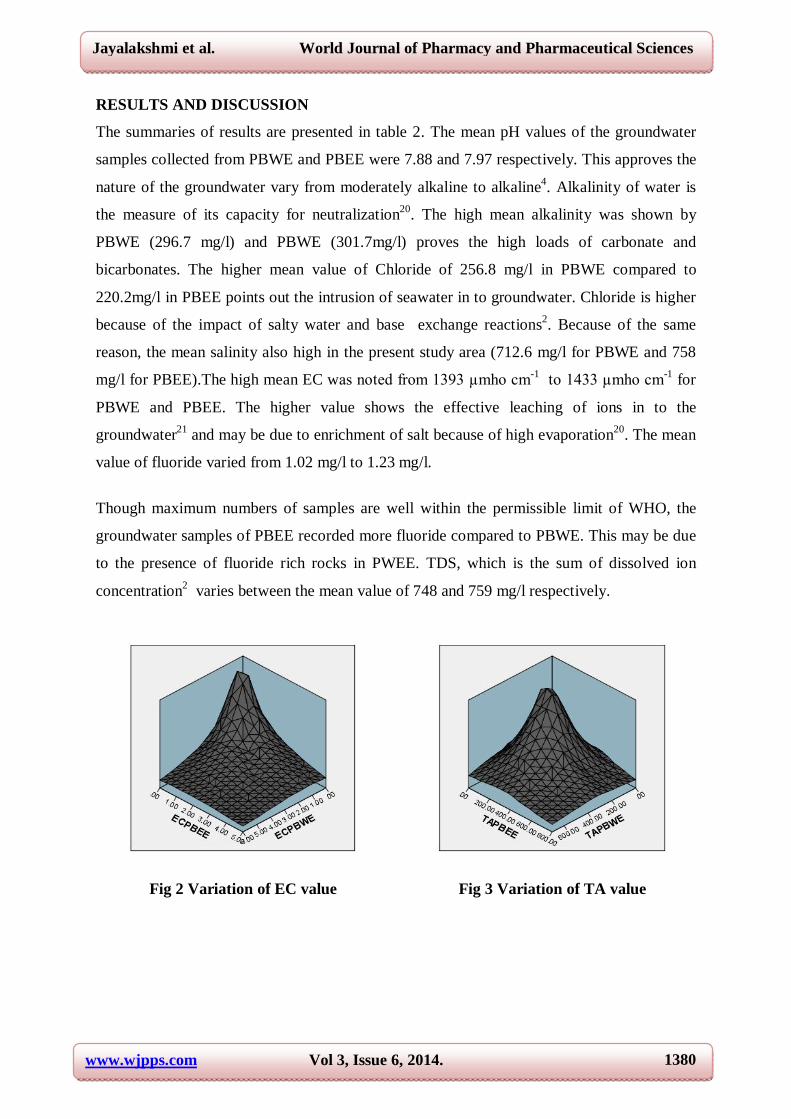
RESULTS AND DISCUSSION
The summaries of results are presented in table 2. The mean pH values of the groundwater
samples collected from PBWE and PBEE were 7.88 and 7.97 respectively. This approves the
nature of the groundwater vary from moderately alkaline to alkaline4. Alkalinity of water is
the measure of its capacity for neutralization20. The high mean alkalinity was shown by
PBWE (296.7 mg/l) and PBWE (301.7mg/l) proves the high loads of carbonate and
bicarbonates. The higher mean value of Chloride of 256.8 mg/l in PBWE compared to
220.2mg/l in PBEE points out the intrusion of seawater in to groundwater. Chloride is higher
because of the impact of salty water and base exchange reactions2. Because of the same
reason, the mean salinity also high in the present study area (712.6 mg/l for PBWE and 758
mg/l for PBEE).The high mean EC was noted from 1393 µmho cm-1 to 1433 µmho cm-1 for
PBWE and PBEE. The higher value shows the effective leaching of ions in to the
groundwater21 and may be due to enrichment of salt because of high evaporation20. The mean
value of fluoride varied from 1.02 mg/l to 1.23 mg/l.
Though maximum numbers of samples are well within the permissible limit of WHO, the
groundwater samples of PBEE recorded more fluoride compared to PBWE. This may be due
to the presence of fluoride rich rocks in PWEE. TDS, which is the sum of dissolved ion
concentration2 varies between the mean value of 748 and 759 mg/l respectively.
Fig 2 Variation of EC value Fig 3 Variation of TA value

www.wjpps.com Vol 3, Issue 6, 2014.
1381
Jayalakshmi et al. World Journal of Pharmacy and Pharmaceutical Sciences
Fig 4 Variation of TH value Fig 5 Variation of TDS value
The high TDS content may be deduced due to the possibility of seawater percolation into the
groundwater through small pockets of waterlogged areas as reported earlier22. Again the
value of EC may be an approximate index of the total content of dissolved substance in
water. The mean value of total hardness for PBWE and PBEE varies from 328 to 314 mg/l
respectively. The hardness of the water is due to the presence of alkaline earth such as
calcium and magnesium23. Calcium and magnesium are the most abundant elements in the
natural surface and groundwater and exists mainly as bicarbonate and chloride. The higher
mean value of calcium in PBWE (313 mg/l) and PBEE (348 mg/l) may be due to dissolution
of calcium from soil (coral) during infiltration. The mean value of magnesium hardness
seems to be 28.8 mg/l in PBWE and 28.9 mg/l in PBEE. Though both the mean values are
below the permissible level of WHO, some of the groundwater samples have high
magnesium hardness that may be due to the dissolution of magnesium rich minerals,
especially leaching of clays. The 3D density graphs that describe the variation of EC, TA,
TH, TDS, F, Cl & Sal were given from Fig 2 to Fig 8.
Fig 6 Variation of F value Fig 7 Variation of Cl value

www.wjpps.com Vol 3, Issue 6, 2014.
1382
Jayalakshmi et al. World Journal of Pharmacy and Pharmaceutical Sciences
Fig 8 Variation of Sal value
Fig 9 Variation of noncarbonate hardness at the extreme ends of Pamban Bridge
Table 2. Summary of chemical composition of groundwater samples at the extreme ends
of Pamban Bridge
Quality Parameters
PBWE (N=49) PBEE (N=60)
Minimum Maximum Mean Std. Deviation Minimum Maximum Mean Std.
Deviation
pH 6.85 8.82 7.87 0.45 6.97 8.86 7.96 0.40
TA 25 788 296 135 99.00 616 301 118
Sal 90 2580 712 569.43 140 2720 758 555
EC 0.16 4.87 1.39 1.07 0.28 5.18 1.43 1.05
TDS 83.9 2580 748 580 163 2740 759 554
CH 0 785 313 171 10.10 831 295 171
MH 0.5 191 28.86 35.75 1.30 226 28.95 33.64
TH 39.9 802 328 166 60.00 901 314 172
Cl 15 1115 256 251 10.40 852 220 179
F 0.06 2.5 1.02 0.58 0.03 2.96 1.23 0.65

www.wjpps.com Vol 3, Issue 6, 2014.
1383
Jayalakshmi et al. World Journal of Pharmacy and Pharmaceutical Sciences
Table 3. Distribution of the groundwater samples of PBWE and PBEE according to
water quality index
WQI PBWE
(N=49)
PBEE (N= 60)
Excellent 8 4 Good 9 7 Poor 15 23 Very Poor 13 13 Unfit 9 13
Fig.10 Pie chart representing the percentage distribution of groundwater samples based
on WQI
The domination of noncarbonate hardness (TH>TA) is higher in PBEE compared to
PBWE24,25. This may be due to the increased concentration of sulphate, chloride etc.,
suggesting the extensive evaporation of the aquifers in PBEE (Fig 9).
About the water quality index (WQI), 33.6 % in PBWE and 18 % in PBEE comes under
excellent and good category. Similarly 36.7% in PBWE and 60 % in PBEE falls under poor
and very poor category. Around 44.9 % in PBWE and 43.3 % in PBEE are unfit (Fig 10).
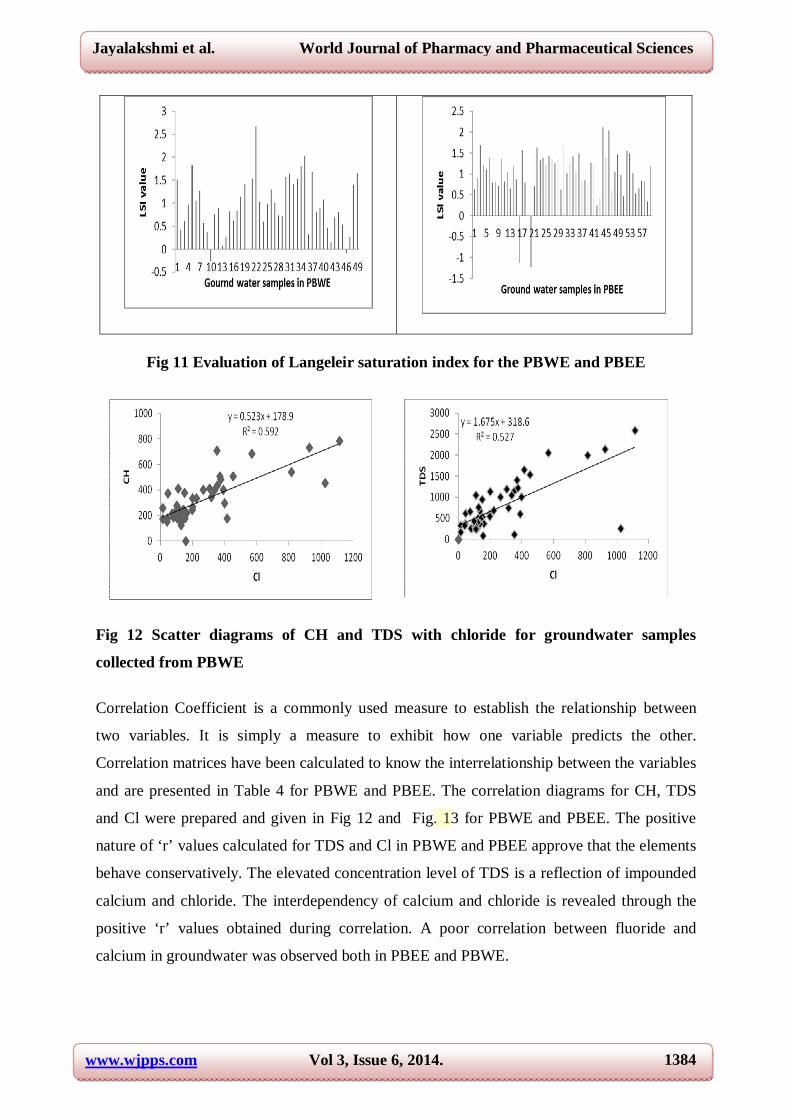
Langeleir Saturation Index (LSI) determines the corrosive or incrusting ability of the water
sample. Most of the groundwater samples in PBWE and PBEE have positive LSI value (Fig
11). The positive LSI value is attributed to heavy deposition of CaCO3 resulting in the
formation of sludges and then scales. The positive LSI value evidences the dissolution of salt
contents.
www.wjpps.com Vol 3, Issue 6, 2014.
1384
Jayalakshmi et al. World Journal of Pharmacy and Pharmaceutical Sciences
Fig 11 Evaluation of Langeleir saturation index for the PBWE and PBEE
Fig 12 Scatter diagrams of CH and TDS with chloride for groundwater samples
collected from PBWE
Correlation Coefficient is a commonly used measure to establish the relationship between
two variables. It is simply a measure to exhibit how one variable predicts the other.
Correlation matrices have been calculated to know the interrelationship between the variables
and are presented in Table 4 for PBWE and PBEE. The correlation diagrams for CH, TDS
and Cl were prepared and given in Fig 12 and Fig. 13 for PBWE and PBEE. The positive
nature of ‘r’ values calculated for TDS and Cl in PBWE and PBEE approve that the elements
behave conservatively. The elevated concentration level of TDS is a reflection of impounded
calcium and chloride. The interdependency of calcium and chloride is revealed through the
positive ‘r’ values obtained during correlation. A poor correlation between fluoride and
calcium in groundwater was observed both in PBEE and PBWE.

www.wjpps.com Vol 3, Issue 6, 2014.
1385
Jayalakshmi et al. World Journal of Pharmacy and Pharmaceutical Sciences
Fig 13 Scatter diagrams of CH and TDS with chloride for groundwater samples
collected from PBEE
Factor analysis[table 6], a multivariate statistical method, yields the general relationship
between measured chemical variables by showing multivariate patterns that may be help to
classify the original data3. Three factors are extracted to statistically represent the
contributions influencing chemical composition of ground water for both PBWE & PBEE.
The results of factor analysis based on the three most significant factors indicate that three
factors explain about 82 % for PBWE and 77 % for PBEE of total sample variance. The
PBWE shows the percentage variance explanation of 50% for factor 1, 20 % for factor 2 and
11 % for factor 3. Similarly the PBEE shows the percentage variance explanation of 49 % for
factor 1, 16 % for factor 2 and 11 % for factor 3.
Each variable has high communality that shows variation in common with others and are
clarified for its inclusion in the analysis, In order to make the interpretation easier, varimax
rotation is carried out to distinguish the PCs which come under same range of loadings. Most
significant variables in the components represented by loadings higher that 0.6, are taken in
to consideration for the interpretation. An interpretation of the rotated three principal
components was made by examining the component loadings noting the relationship to the
original variables for the samples in PBWE and PBEE. The high loadings of Sal, EC, TDS,
CH, TH and Cl show the salt water signature in PBWE and PBEE. Also the loading in the
second component for fluoride proves the possibility of fluoride bearing minerals in PBWE
and PBEE.

www.wjpps.com Vol 3, Issue 6, 2014.
1386
Jayalakshmi et al. World Journal of Pharmacy and Pharmaceutical Sciences
Table 4. Karl pearson correlation matrix for groundwater samples at the extreme ends of pamban bridge (PBWE & PBEE)
PBEE
PBW
E
pH TA Sal EC TDS CH MH TH Cl F
Ph 1 -0.094 -0.054 -0.057 -0.059 -0.145 -0.076 -0.072 -0.11 0.09
TA 0.532 1 .432** .430** .428** 0.161 -0.13 .296* 0.116 .479**
Sal 0.035 0.331 1 1.000** 1.000** .309* -0.096 .633** .710** 0.178
EC 0.05 0.391 0.964 1 1.000** .309* -0.096 .632** .708** 0.175
TDS 0.031 0.368 0.961 0.996 1 .309* -0.093 .629** .706** 0.171
CH 0.087 0.425 0.709 0.736 0.732 1 -0.016 .395** .263* 0.001
MH -0.153 -0.204 -0.104 -0.127 -0.121 -0.1 1 0.19 0.123 -0.144
TH -0.096 0.209 0.792 0.818 0.814 0.822 0.165 1 .766** 0.123
Cl 0.169 0.251 0.715 0.727 0.726 0.77 -0.073 0.748 1 0.173
F 0.468 0.49 0.172 0.216 0.203 0.289 -0.036 0.135 0.182 1
Table 5. Distribution of ground water samples (%) exceeding the drinking water
standards.
Chemical Consitituents, mg/l
WHO No. of ground water samples
exceeding the permissible limit (%) PBWE PBEE
pH 6.5-8.5 12 6 TA 300 78 80 Sal 200 94 95 EC 300 96 98 TDS 500 55 72 CH 75 98 95 MH 30 29 38 TH 100 59 75 Cl 200 41 51 F 1.5 18 23
MANAGEMENT PLAN FOR SUSTAINABLE DEVELOPMENT
People in the study area should be given awareness about the problems such as high
blood pressure, kidney stones etc., caused due to high hardness.
As the aquifers are enriched mainly with hardness imparting calcium species, hence
treatment techniques such as water softening or desalination may be employed.
Monitoring should be regular as the water sources are regularly consumed by the people
for domestic as well as internal consume purposes.
Defluoridation techniques have to be employed in the sources where the fluoride level
crosses the permissible level of WHO26.

www.wjpps.com Vol 3, Issue 6, 2014.
1387
Jayalakshmi et al. World Journal of Pharmacy and Pharmaceutical Sciences
Table 6. Factor analysis of the water quality parameters of the groundwater samples at
the extreme ends of Pamban Bridge.
Principal components
PBWE PBEE
PC-1 PC-2 PC-3 Communality
PC-1 PC-2 PC-3 Communality
Principal component loadings Principal component loadings
pH 0.157 0.83 0.106 .724 -0.091 0.237 -0.729 .596 TA 0.481 0.688 0.016 .705 0.491 0.592 0.411 .761 Sal 0.929 -0.152 -0.095 .894 0.957 0.031 -0.128 .932 EC 0.955 -0.11 -0.094 .933 0.956 0.028 -0.128 .931 TDS 0.95 -0.131 -0.097 .928 0.954 0.025 -0.128 .928 CH 0.874 -0.01 0.043 .766 0.933 -0.086 -0.05 .881 MH -0.11 -0.329 0.912 .953 -0.037 -0.633 0.408 .568 TH 0.875 -0.316 0.209 .908 0.811 -0.285 0.095 .748 Cl 0.838 -0.075 0.017 .709 0.805 -0.298 -0.002 .737 F 0.326 0.678 0.342 .683 0.262 0.684 0.322 .640 Eigen value 5.282 1.887 1.034
5.236 1.455 1.031
Per. var 50.578 20.426 11.027 49.6 16.122 11.495 Cum. per. var
50.578 71.004 82.031 49.6 65.722 77.217 Rotated component matrix
pH -0.063 0.84 -0.121
-0.022 -0.191 -0.748
TA 0.289 0.765 -0.189 0.283 0.823 0.055 Sal 0.938 0.068 -0.1 0.937 0.214 -0.099 EC 0.953 0.113 -0.111 0.936 0.212 -0.098 TDS 0.953 0.091 -0.108 0.935 0.208 -0.096 CH 0.847 0.222 -0.001 0.926 0.149 0.027 MH -0.038 -0.093 0.971 0.033 -0.33 0.677 TH 0.923 -0.018 0.239 0.827 0.025 0.252 Cl 0.829 0.146 -0.007 0.84 -0.035 0.176 F 0.135 0.804 0.136 0.057 0.794 -0.075
CONCLUSION
The groundwater samples at the extreme ends of the pamban bridge have been found with
more Sal, TDS, CH, TA and Cl in majority of the samples and beyond the drinking level
standards of WHO 2006 [table 5 ]. The higher noncarbonate hardness in PBEE compared to
PBWE witnessed the greater input of chloride in the groundwater samples of PBEE and
proves the seawater intrusion. LSI inferred that scale forming tendency dominate at both the
ends of pamban bridge which may cause severe corrosion. The principal component analysis
indorses the seawater intrusion and the presence of fluoride bearing minerals in the study
area. The WQI revealed that the groundwater samples at PBWE shows 33% and PBEE show
18 % of found to have good quality though the study area is seashore. It seems that maximum

www.wjpps.com Vol 3, Issue 6, 2014.
1388
Jayalakshmi et al. World Journal of Pharmacy and Pharmaceutical Sciences
number of samples in PBWE and PBEE recorded below permissible value for fluoride hence
there is very less risk for dental fluorosis, skeletal fluorosis etc., Very Higher standard
deviation of quality parameters in PBWE compared to PBEE suggests local variations in
point sources, soil type and multiple aquifer system.
ACKNOWLEDGEMENT
Authors thank the Principals and Managements of Bishop Heber College, Tiruchirappalli,
St.Joseph’s College,Tiruchirappalli and Syed Ammal Engineering College, Ramanathapuram
for their encouragement and support.
REFERENCES
1. Amadi A.N, Olasehinde P.I, YisaJ . Characterization of Groundwater Chemistry in the
Coastal plain-sand Aquifer of Owerri using Factor Analysis. Int. J. Phys. Sci, 2010 ; 5(8):
1306-1314.
2. Chidambaram S, Karmegam U , Prasanna M.V , Sasidhar P , Vasanthavigar M. A study on
hydrochemical elucidation of coastal groundwater in and around Kalpakkam region,
Southern India. Environ Earth Sci, 2011 ; 64 : 1419–1431.DOI 10.1007/s12665-011-0966-
3.
3. Md. Mezbaul Bahar , Md. Salim Reza. Hydrochemical characteristics and quality
assessment of shallow groundwater in a coastal area of Southwest Bangladesh. Environ
Earth Sci , 2010 ; 61 : 1065–1073. doi: 10.1007/s12665-009-0427-4.
4. Ramachandramoorthy T, Sivasankar V, Subramanian V. A seasonal quality assessment
along the Rameswaram–Dhanushkodi coastal tract, India. Environmental Monitoring and
Assessment, 2009 ; 159: 511–520.
5. Cattel R. B. Factor analysis: introduction to essentials. Biometrics, 1965 ; 21: 190–215.
doi:10.2307/2528364.
6. Helena B, Pardo R, Vega M, Barrado E, Fernandez J. M, Fernandez L. Temporal
evolution of groundwater composition in an alluvial (Pisuerga river, Spain) by principal
component analysis. Water Research, 2000 ; 34 : 807–816. doi:10.1016/S0043-
1354(99)00225-0.
7. Anazawa K, Ohmori H. Chemistry of surface water at a volcanic summit area, Norikura,
Central Japan: multivariate statistical approach. Chemosphere, 2001 ; 45 : 807–
816.doi:10.1016/S0045-6535 (01)00104-7.

www.wjpps.com Vol 3, Issue 6, 2014.
1389
Jayalakshmi et al. World Journal of Pharmacy and Pharmaceutical Sciences
8. Kuppusamy M. R, Giridhar V. V. Factor analysis of water quality characteristics
including trace metal speciation in the coastal environmental system of Chennai, Ennore.
Environment International, 2006 ; 32 : 174–179.doi:10.1016/j.envint.2005.08.008.
9. Panda U. C, Sundaray S. K, Rath P, Nayak B. B, Bhatta D. Application of factor and
cluster analysis for characterization of river and estuarine water systems—a case
study:Mahanadi River (India). Journal of Hydrology (Amsterdam), 2006 ; 331: 434–445.
doi:10.1016/j.jhydrol.2006.05.029.
10. Laluraj C. M, Gopinath G, Dineshkumar P. K. Groundwater chemistry of shallow
aquifers in the coastal zones of Cochin, India. Applied Ecology and Environmental
Research, 2005 ; 3 : 133–139.
11. Praus P. Water quality assessment using SDV based principal component analysis of
hydrological data. Water South Africa, 2005 ; 31(4) : 417–422.
12. Petalas C, Lambrakis N, Zaggana E. Hydrogeochemistry of waters of volcanic rocks: The
case of the volcano sedimentary rocks of Thrace, Greece. Water, Air and Soil Pollution,
2006 ; 169 : 375–394.
13. Pujari P. R, Soni A. K. Seawater intrusion studies near kovaya limestone mine, Saurashtra
coast, India. Environmental Monitoring and Assessment, 2008 ; 154 : 93–
109.doi:10.1007/s10661-008-03809.
14. Nayak A. K, Chinchmalatpure A. R, Gururaja Rao G, Jha S.K, Khandelwal M. K. An
assessment of fluoride in the coastal aquifer of the Bara tract in Bharuch District,Gujarat
(India). Environmental Monitoring and Assessment, 2009 ; 158 : 315–317.
doi:10.1007/s10661-008-0585-y.
15. Sivasankar V, Ramachandramoorthy T. An Investigation on the Pollution Status of
Holywater samples of Ramanathasamy temple, Rameswaram, India. Environmental
Monitoring and Assessment, 2009 ; 156 : 307–315.
16. Krishna kumar S, Chandrasekar N, Seralathan P, Godson P.S, Magesh N. S.
Hydrochemical study of shallow carbonate aquifers, Rameswaram Island,
India.Environmental Monitoring and Assessment ,2011; doi:10.1007/s10661-011-2249-6.
17. APHA. (2005). Standard methods for examination of water andwastewater (21st ed.).
Washington DC: American PublicHealth Association. information (2nd edition). Geneva
18. Tiwari T. N. Mishra M. A preliminary assessment of water quality Index of major Indian
rivers. Indian Journal of Environmental Protection, 1985 ; 5 : 276–279.
19. Langeleir W. F. Chemical equilibria in water treatment. Journal of American Water Works
Association, 1946 ; 38: 169.
www.wjpps.com Vol 3, Issue 6, 2014.
1390
Jayalakshmi et al. World Journal of Pharmacy and Pharmaceutical Sciences
20. Manish Kumar, Kalpana Kumari , AL. Ramanathan , Rajinder Saxena. A comparative
evaluation of groundwater suitability for irrigation and drinking purposes in two
intensively cultivated districts of Punjab. India Environ Geol ; 2007 : 53,553–574. doi
:10.1007/s00254-007-0672-3.
21. Srinivasamoorthy K, Chidambaram S, Prasanna MV, Vasanthavihar M, Peter J, Anandhan
P. Identification of major sources controlling groundwater chemistry from a hard rock
terrain—a case study from Mettur taluk, Salem district, Tamil Nadu, India. J Earth Sys
Sci, 2008 ; 117: 49–58.
22. Palanivelu K, Nisha Priya M, Muthamil Selvan A, Natesan U. Water quality assessment
in the tsunami-affected coastal areas of Chennai. Current Science, 2006 ;91: 583–584.
23. Sarath Prasanth SV, Magesh NS, Jitheshlal KV, Chandrasekar N, Gangadhar K.
Evaluation of groundwater quality and its suitability for drinking and agricultural use in
the coastal stretch of Alappuzha District, Kerala, India. Appl Water Sci, 2012 ; 2: 165–
175.
24. Rengaraj S, Elampooranan T, Elango L, Ramalingam V. Groundwater quality in the
Suburban regions of Madras City, India. Pollution Research, 1996 ;15 : 325–328.
25. Shanmugam P, Neelamani S, Ahn Yu-Hwan Philip L, Hong Gi-Hoon. Assessment of the
levels of coastal marine pollution of Chennai city, Southern India. Water Resource
Management, 2007 ; 21: 1187–1206.
26. World Health Organisation (2006). Guidelines for Drinking Water Quality Health Criteria
and other supporting information.


