Status of MAPS Geometry Simulation
Yoshinari MikamiUniversity of Birmingham
17th MAY 2006
MAPS Meeting at Rutherford Appleton Laboratory
Outline● Cell size dependence
– Mokka-06-00 and LCIO-v01-07 are used. (Two cellIDs are available.)
– m xm ~ 100m xm cell size variation.● Incoming Single Electron Energy dependence
– Default geometry, MAPS thickness and MAPS geometry ● Single muon test
– Comparison between default and MAPS thickness
– Comparison with other energy deposit distribution.
Cell size dependence
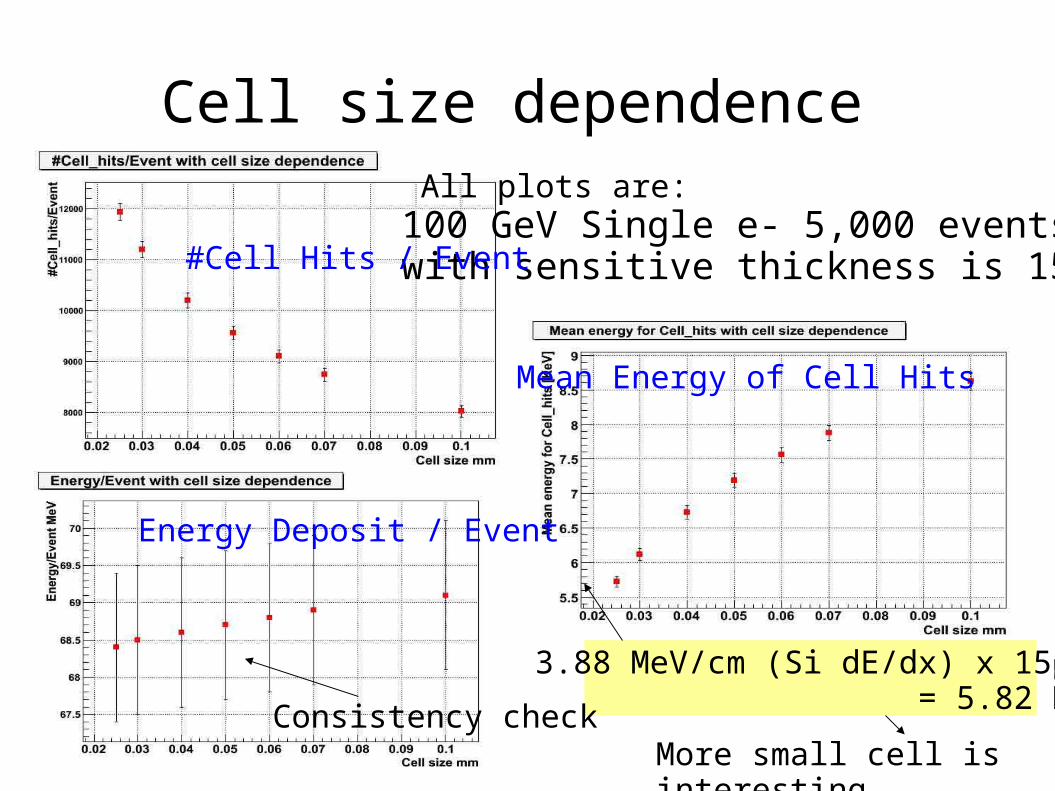
All plots are:100 GeV Single e- 5,000 eventswith sensitive thickness is 15m.#Cell Hits / Event
Mean Energy of Cell Hits
Energy Deposit / Event
Consistency check
3.88 MeV/cm (Si dE/dx) x 15m= 5.82 KeV
More small cell is interesting.
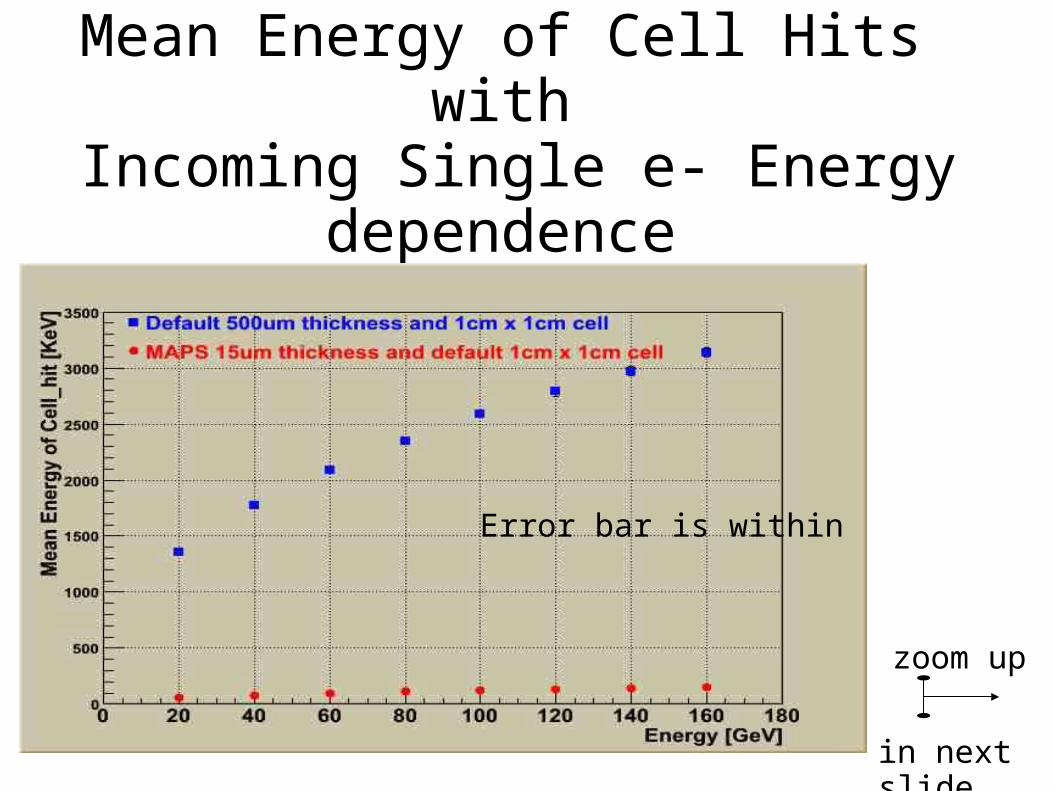
Mean Energy of Cell Hits with
Incoming Single e- Energy dependence
Error bar is within
in next slide
zoom up
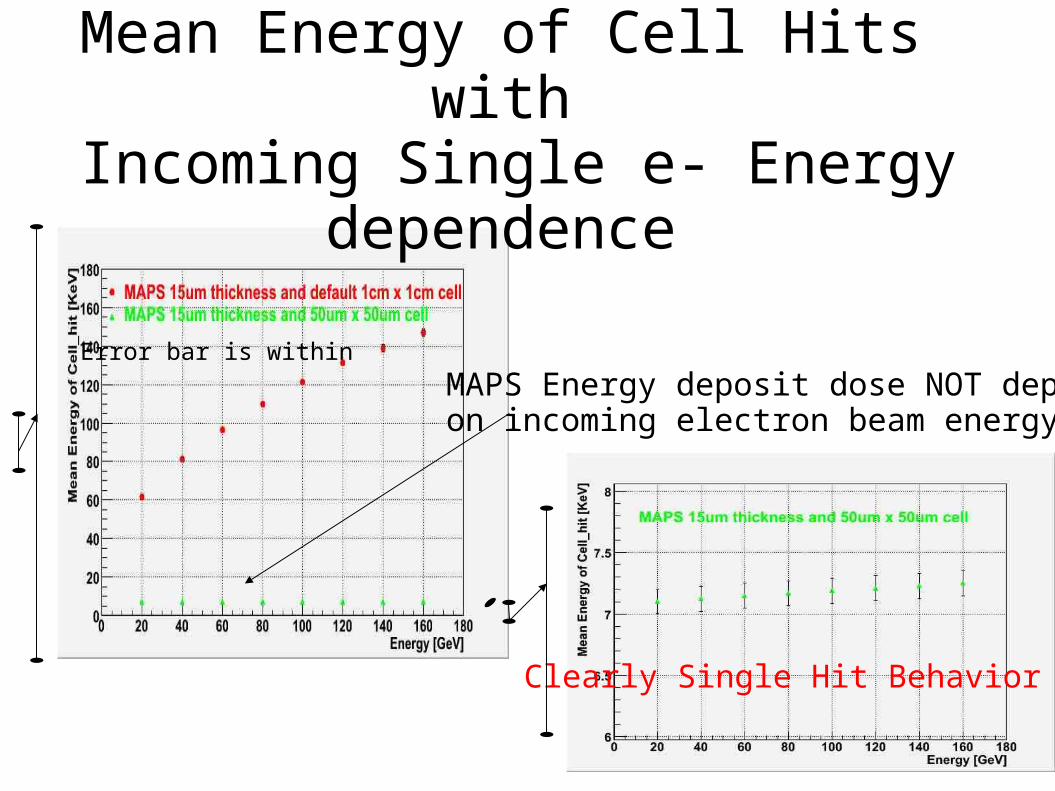
Mean Energy of Cell Hits with
Incoming Single e- Energy dependence
MAPS Energy deposit dose NOT depend on incoming electron beam energy !
Clearly Single Hit Behavior !
Error bar is within
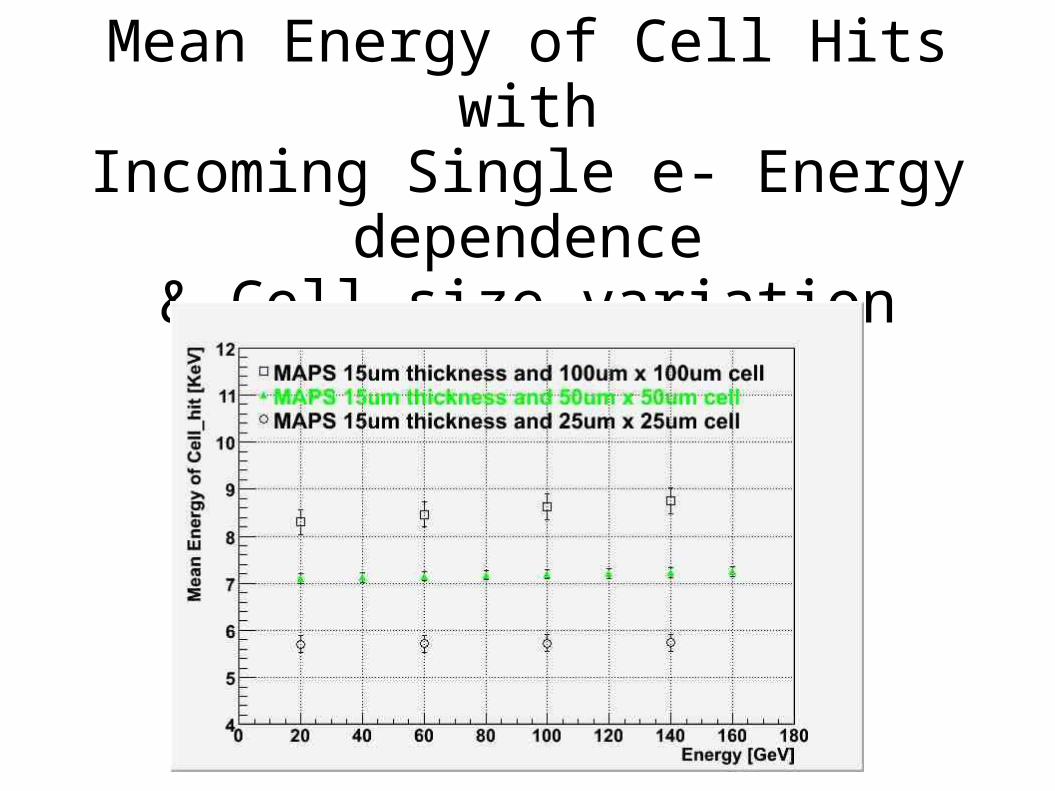
Mean Energy of Cell Hitswith
Incoming Single e- Energy dependence& Cell size variation
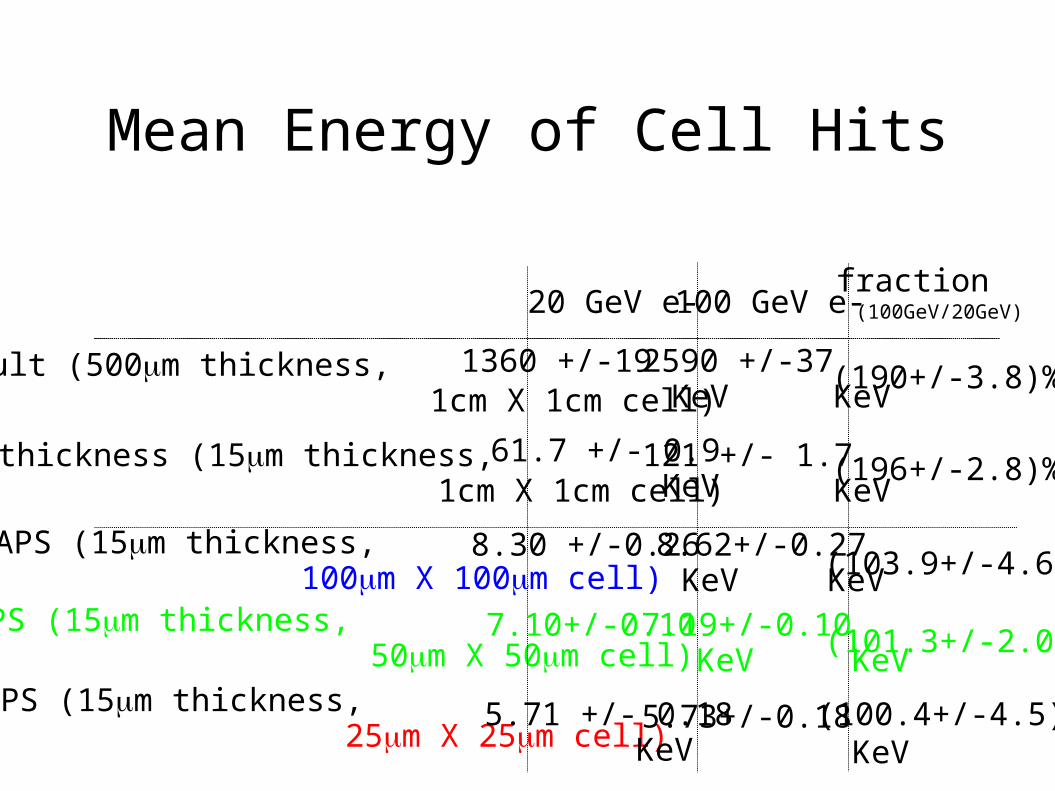
Mean Energy of Cell Hits
Default (500m thickness, 1cm X 1cm cell)
MAPS thickness (15m thickness, 1cm X 1cm cell)
MAPS (15m thickness, 50m X 50m cell)
20 GeV e- 100 GeV e-fraction
1360 +/-19 KeV
61.7 +/- 0.9 KeV
7.10+/-0.10 KeV
2590 +/-37 KeV
121 +/- 1.7 KeV
7.19+/-0.10 KeV
(190+/-3.8)%
(196+/-2.8)%
(101.3+/-2.0)%
(100GeV/20GeV)
MAPS (15m thickness, 100m X 100m cell)
8.30 +/-0.26 KeV
8.62+/-0.27 KeV (103.9+/-4.6)%
MAPS (15m thickness, 25m X 25m cell)
5.71 +/- 0.18KeV
5.73+/-0.18 KeV
(100.4+/-4.5)%
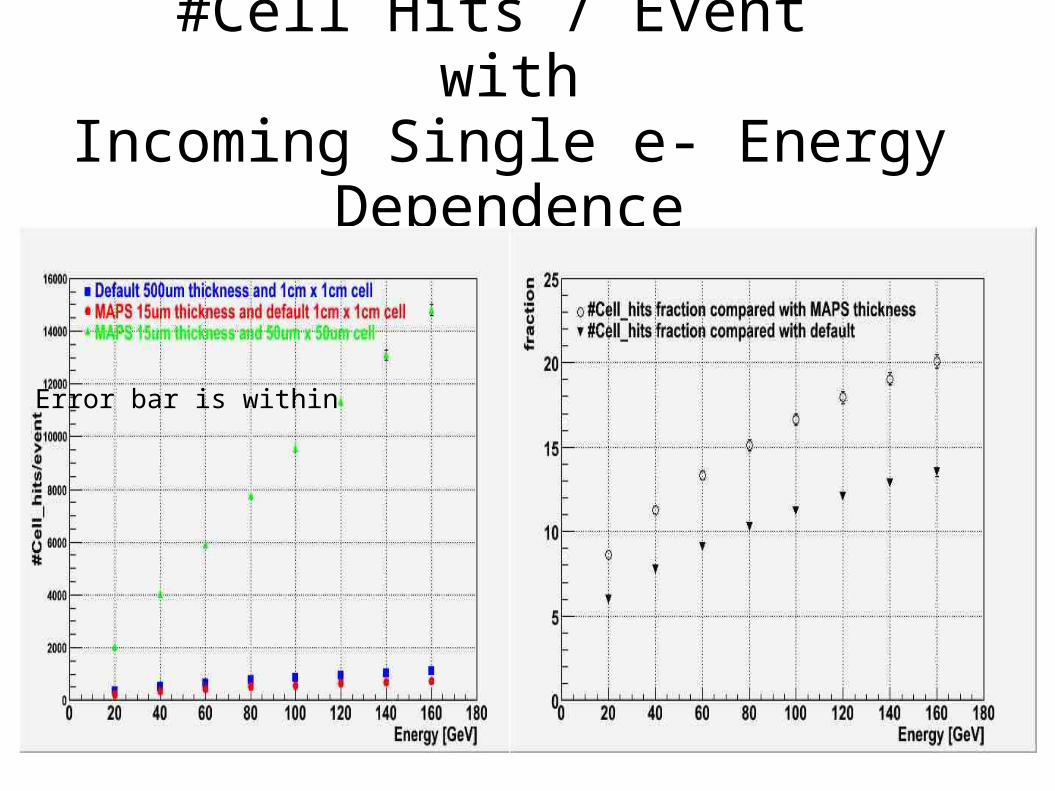
#Cell Hits / Event with
Incoming Single e- Energy Dependence
Error bar is within
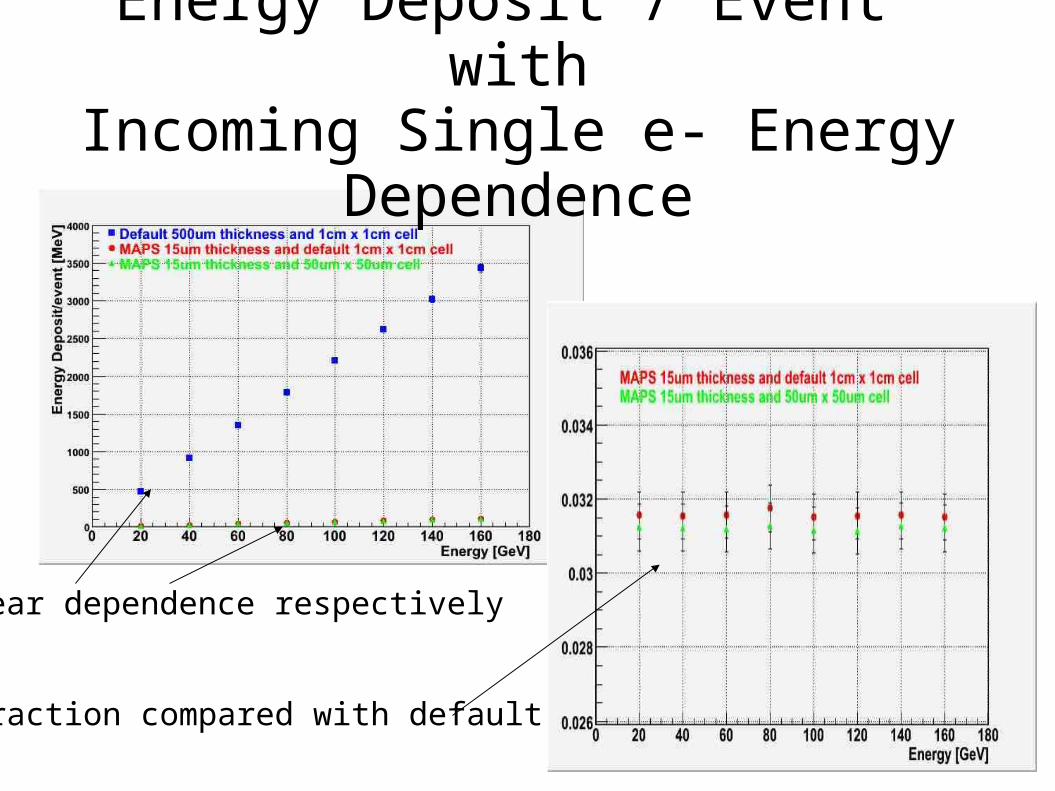
Energy Deposit / Event with
Incoming Single e- Energy Dependence
Linear dependence respectively
Fraction compared with default

20 GeV mu-500m thickness1cm X 1cm cell(5,000 events)
Single Muon Energy Deposit (Under study)
20 GeV mu-15m thickness1cm X 1cm cell(5,000 events)
- #Cell_hits / event = 78.7+/- 1.1 (stat)
- Mean E of Cell_hits = 100 +/- 1.4 KeV
- E deposit / event = 7.87 +/- 0.11 MeVMAPS/Default ratio for mean energy of Cell_hits = (3.72 +/- 0.07) %
MAPS/Default ratio for energy deposit per event = (3.68 +/- 0.07) %
#Cell_hits / event = 77.8 +/- 1.1 (stat)
E deposit / event = 289.8 +/- 4.1 KeV
Mean E of Cell_hits = 3.72 +/- 0.05 KeV
40 layers means #Cell_hits / layer ~ 2 ----> Mean E / layer ~ 7.4 KeV in 15m.
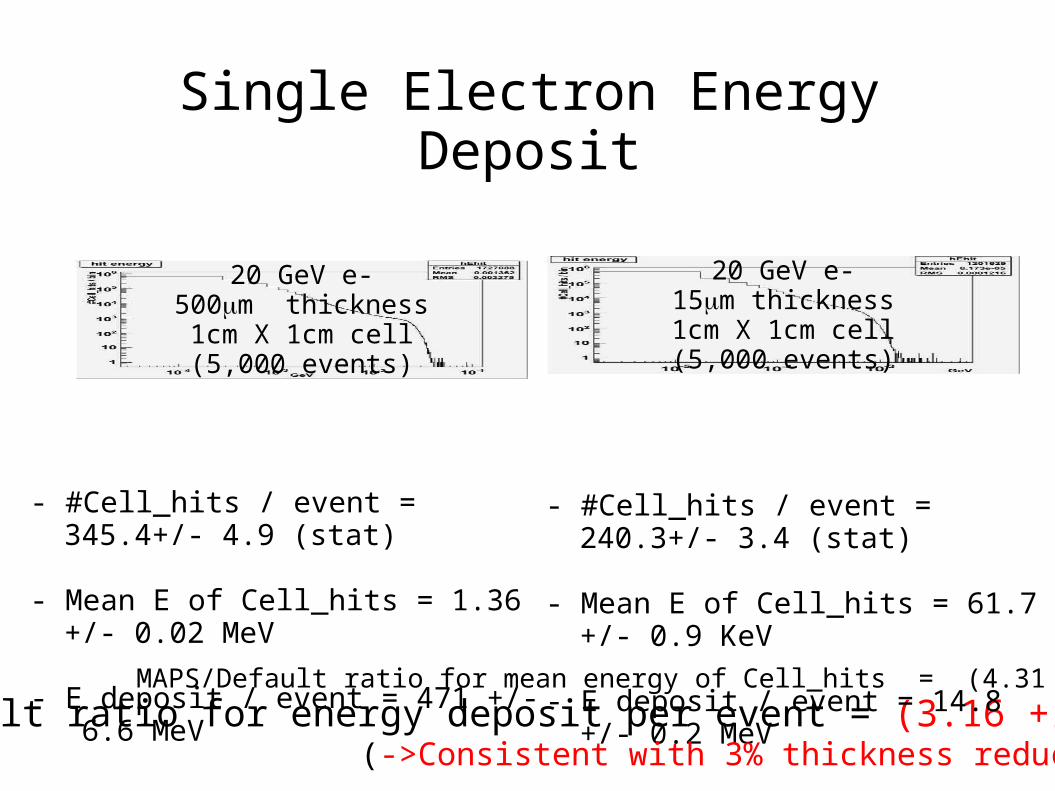
Single Electron Energy Deposit
MAPS/Default ratio for energy deposit per event = (3.16 +/- 0.06) %
20 GeV e-15m thickness1cm X 1cm cell(5,000 events)
MAPS/Default ratio for mean energy of Cell_hits = (4.31 +/- 0.09) %
20 GeV e-500m thickness1cm X 1cm cell(5,000 events)
- #Cell_hits / event = 345.4+/- 4.9 (stat)
- Mean E of Cell_hits = 1.36 +/- 0.02 MeV
- E deposit / event = 471 +/- 6.6 MeV
- #Cell_hits / event = 240.3+/- 3.4 (stat)
- Mean E of Cell_hits = 61.7 +/- 0.9 KeV
- E deposit / event = 14.8 +/- 0.2 MeV
(->Consistent with 3% thickness reduction)
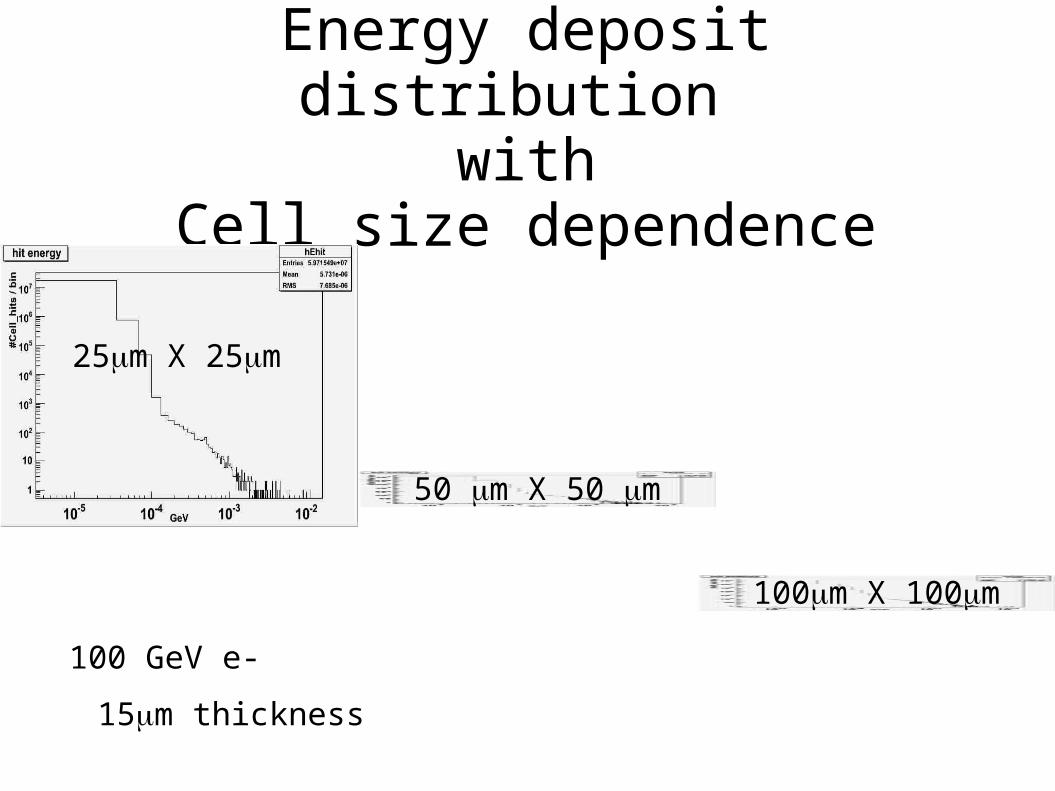
Energy deposit distribution with
Cell size dependence
50 m X 50 m
100m X 100m
100 GeV e-
15m thickness
25m X 25m
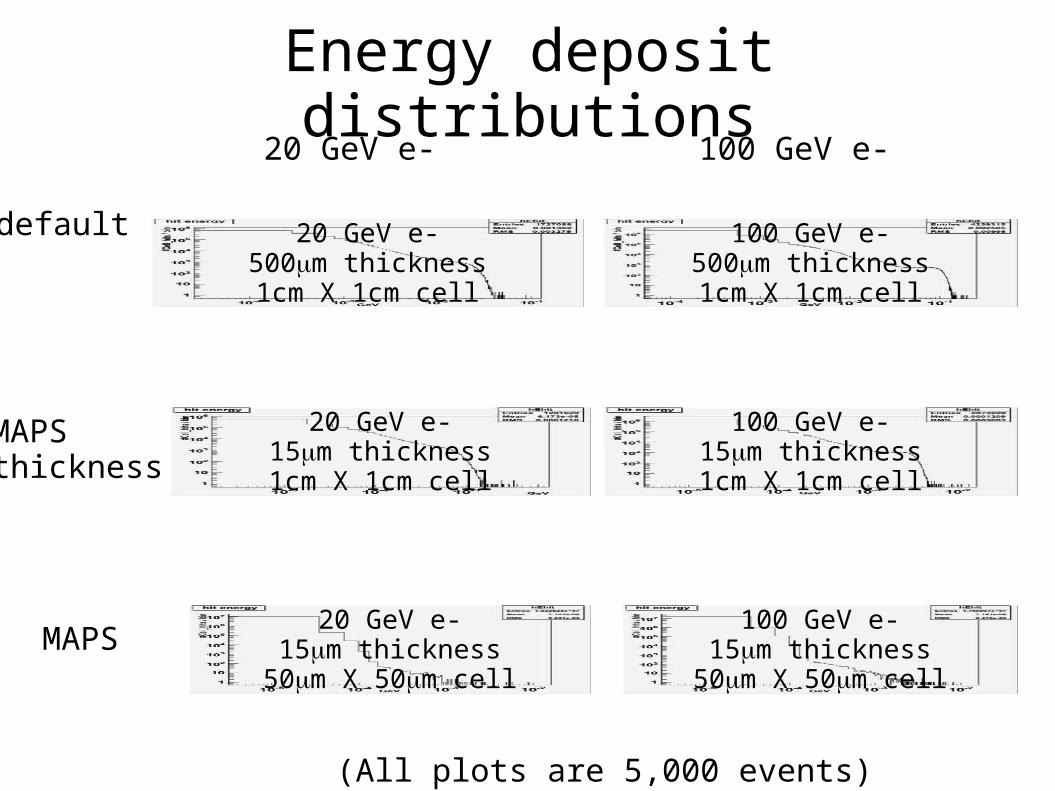
Energy deposit distributions
20 GeV e-500m thickness1cm X 1cm cell
20 GeV e-15m thickness1cm X 1cm cell
100 GeV e-15m thickness1cm X 1cm cell
20 GeV e-15m thickness
50m X 50m cell
100 GeV e-15m thickness
50m X 50m cell
default
MAPSthickness
MAPS
20 GeV e- 100 GeV e-
(All plots are 5,000 events)
100 GeV e-500m thickness1cm X 1cm cell
● Status
– MAPS Geometry (15m thickness x 50m x 50m cell size) clearly show single hit energy deposit.
– 5m x 5m cell size is under study. (It need modification for bits assignments. <-- We can use provision bit.)
● Next steps
– MC study for #MIP hits / cell.– Muon test with small cell size.– Cross-talk/Multi-particle studies with physics events.– Disk/CPU consumption estimate with physics events.
● Future Prospect
– Position/Energy resolutions.
Status and Future Prospects


