STIMULI-RESPONSIVE POLYMERS
IN SOLUTION AND ON GRAFTED SURFACES
A Dissertation
by
HUI FU
Submitted to the Office of Graduate Studies of Texas A&M University
in partial fulfillment of the requirements for the degree of
DOCTOR OF PHILOSOPHY
May 2010
Major Subject: Chemistry

STIMULI-RESPONSIVE POLYMERS
IN SOLUTION AND ON GRAFTED SURFACES
A Dissertation
by
HUI FU
Submitted to the Office of Graduate Studies of Texas A&M University
in partial fulfillment of the requirements for the degree of
DOCTOR OF PHILOSOPHY
Approved by:
Chair of Committee, David E. Bergbreiter Committee Members, Daniel A. Singleton James D. Batteas Melissa A. Grunlan Head of Department, David H. Russell
May 2010
Major Subject: Chemistry

iii
ABSTRACT
Stimuli-responsive Polymers in Solution and on Grafted Surfaces. (May 2010)
Hui Fu, B.S., Sichuan University; M.S., Tsinghua University; M.S., University of
Southern California
Chair of Advisory Committee: Dr. David E. Bergbreiter
Thermoresponsive polymers such as poly(N-isopropylacrylamide) (PNIPAM)
have lower critical solution temperature (LCST) in aqueous solutions. Below the LCST,
these polymers are hydrophilic with an extended coil conformation. Above the LCST,
they undergo a sharp phase transition to form a collapsed hydrophobic conformation.
The LCSTs are also affected by cosolutes and the effects of anions on LCSTs follow the
Hofmeister series.
We successfully used a simple digital melting point apparatus to study the effects
of heating rates, solvent compositions, cosolutes, and redox state, on the LCSTs of
thermoresponsive polymers. Moreover, the temperature range of the apparatus allowed
for analyses at much higher temperatures and provides a simple way to examine
irregular clouding behavior in more complex systems.
Meanwhile, stimuli-responsive surfaces grafted with thermoresponsive polymers
can switch from hydrophilic to hydrophobic thermally. As the LCST can be
subsequently changed with the addition of salts, the salt effects on the wettability of
these thermoresponsive surfaces will dramatically impact the surface performance. In

iv
this dissertation, I prepared PNIPAM/SiO2 nanocomposite surfaces by a covalent layer-
by-layer assembly procedure and such surfaces were then used in studies of salts effects
on surface wettability.
Both the effects of anions and cations on the changes of advancing angles (ΔΘa)
of the PNIPAM/SiO2 nanocomposite surfaces were significant (ΔΘa up to 90°). The
anion effects on the surface wettability followed the Hofmeister effect as expected.
Parallel studies on solution showed that variation of cations had a large effect on the
LCST of PNIPAM too. Moreover, analyses of the Θa and LCST data using activity
instead of using concentration showed different orders for the cation effects which were
readily grouped by the cation charge numbers. No difference was seen for the anion
effects in similar studies. AFM studies showed that surface morphology changes were
correlated with the ΔΘa.

v
DEDICATION
To my husband, Yiqin for his encouragement, his unconditional support, and for
his strong belief in my capability. To my children, Farrah and Andrew for bringing
happiness and hope into my daily life, and for their understanding and support.

vi
ACKNOWLEDGEMENTS
I would like to thank Dr. David Bergbreiter for giving me the opportunity to
work in his lab as a research associate when I moved in College Station in 2005. This
work experience turned out to be a smooth transition for my return to graduate school to
finish my Ph.D. I would also like to thank him for being a great mentor, for his guidance,
and for his support, during my graduate study.
I would like to express my gratitude to the members of Bergbreiter’s group for
giving me suggestions in the preparation of my student seminar, my preliminary
presentation, and my final defense. I am glad to have had the chance to know and to
work with all the former and current group members, especially Jianhua, Shawn, Film,
Su, Chris, and Jeff.
I would also like to thank Dr. James Batteas, Mr. Albert Wan and Dr. Xiaoting
Hong, for their collaborations and discussions on most of my research projects. I would
like to thank Dr. Singleton, Dr. Batteas, Dr. Grunlan, and Dr. Connell for serving as my
committee members. My gratitude also goes to Jill for helping everyone in the lab
dealing with trivial business issues.
Finally, I would like to thank all the undergraduates I had worked with - David
Darmon and Danielle Policarpio, who were sponsored by National Science Foundation
(NSF) Research Experiences for Undergraduates (REU) program, for letting me guide
them on their research projects; Alex Mijalis, for letting me teach him about chemistry,
and for teaching me English in return.

vii
TABLE OF CONTENTS
Page
ABSTRACT ..................................................................................................................... iii
DEDICATION ................................................................................................................... v
ACKNOWLEDGEMENTS .............................................................................................. vi
TABLE OF CONTENTS ................................................................................................. vii
LIST OF SCHEMES .......................................................................................................... x
LIST OF FIGURES ........................................................................................................... xi
LIST OF TABLES .......................................................................................................... xvi
CHAPTER
I INTRODUCTION .............................................................................................. 1
Stimuli-responsive Polymers .......................................................................... 1 Analyses of Stimuli-responsive Behavior ....................................................... 4 Additive Effects on the Responsiveness of Thermoresponsive Polymers .......................................................................................................... 9 Design of Stimuli-responsive Polymers ........................................................ 17 Grafting Stimuli-responsive Polymers on Solid Surfaces ............................. 22
II THERMODYNAMIC CLOUD POINT ASSAYS ........................................... 33
Introduction ................................................................................................... 33 Melting Point Apparatus and LCS Measurements ........................................ 35 Studies of LCSTs by an Automatic Melting Point Apparatus ...................... 36 Conclusion .................................................................................................... 52

viii
CHAPTER Page
III DESIGNING SURFACES WITH WETTABILITY THAT VARIED IN RESPONSE TO SOLUTE IDENTITY AND CONCENTRATION ................ 53
Introduction ................................................................................................... 53 Preparing the Solute-responsive PE/(PNIPAM/SiO2)6/PNIPAM Nanocomposite Surfaces by Covalent Layer-by-layer Self-assembly Method .......................................................................................................... 55 Studies of the Solute-Responsive Wettability ............................................... 58 Atomic Force Microscopy Studies ................................................................ 63 Conclusion .................................................................................................... 64
IV PARALLEL EFFECTS OF CATIONS ON PNIPAM GRAFT WETTABILITY AND PNIPAM SOLUBILITY ............................................. 66
Introduction ................................................................................................... 66 Studies of Cation Effects on PE/(PNIPAM/SiO2)6/PNIPAM Nanocomposite Surfaces ............................................................................... 68 Atomic Force Microscopy Studies ................................................................ 76 Studies of Cation Effects on LCST of PNIPAM Solution ............................ 78 Conclusion .................................................................................................... 82
V COVALENT LAYER-BY-LAYER ASSEMBLY OF SOLUTE-RESPONSIVE SURFACES ON SILICON WAFER ....................................... 84
Introduction ................................................................................................... 84 Preparing the PNIPAM/SiO2 Nanocomposite on Silicon Wafer Surfaces by Covalent Layer-by-layer Self-assembly Method ...................... 85 Studies of the Solute-responsive Wettability on the Surfaces of SW/(PNIPAM/SiO2)6/ PNIPAM Nanocomposite Grafts .............................. 90 Conclusion .................................................................................................... 95
VI PNIPAM-BASED FUNCTIONAL RESPONSIVE POLYMERS ................... 96
Introduction ................................................................................................... 96 Poly(N-isopropylacrylamide)-c-poly(4-(N,N-diallylamino)pyridine) (PNIPAM-c-PDAAP) – a PNIPAM-supported Organocatalyst ................... 98 Poly(N-isopropylacrylamide)-c-poly(2,2,6,6-tetramethylpiperidineoxylacrylamide) (PNIPAM-c-PTEMPOAM) – a Temperature and Redox Responsive Polymer ............................................ 105 Poly(N-isopropylacrylamide)-c-poly((N-benzo-15-crown-5)acrylamide) (PNIPAM-c-PB15C5AM) – an Cation Selective Copolymer for Synthesis of Responsive Surfaces ...................................... 114 Conclusion .................................................................................................. 120

ix
CHAPTER Page
VII SUMMARY AND EXPERIMENTAL SECTION ......................................... 122
Summary ..................................................................................................... 122 Experimental Section .................................................................................. 124
REFERENCES ............................................................................................................... 138
VITA .............................................................................................................................. 150

x
LIST OF SCHEMES
SCHEME Page
1 Examples of temperature-responsive polymers. ................................................. 3
2 Schematic drawing of a temperature gradient microfluidics device equipped with dark-field microscope. ................................................................ 7
3 A digital melting point apparatus that can be used to study LCSTs. .................. 8
4 A multi-stimuli sensitive amphiphilic block copolymer. ................................. 20
5 The structure of a IR light sensitive amphiphilic polymer and the
chemical reaction of the 2-diazo-1,2-naphthoquinone triggered by IR radiation. ........................................................................................................... 21
6 A spiropyran-containing polymer that can respond to mechanical stress. ....... 21
7 PNIPAM chains grow from Fe2O3 nanoparticles by surface-initiated
nitroxide-meditated control polymerization. .................................................... 26
8 The grafting of PNIPAM to a gold surface by allowing isocyanate containing PNIPAM copolymer to reacted with surface hydroxyl group. ....... 28
9 The grafting procedure of covalent LbL assembly of PEI/Gantrez on
oxidized PE substrates. ..................................................................................... 30
10 Covalent layer-by-layer assembly of a (PNIPAM/SiO2)n/PNIPAM nanocomposite graft on a PEI modified PE film.. ............................................ 56
11 Syntheses of random PNIPAM copolymers. .................................................... 97
12 Syntheses of PDAAP 12 and PNIPAM-c-PDAAP 13. .................................. 100
13 Redox behavior of TEMPO. ........................................................................... 106
14 Synthesis of redox-active PNIPAM copolymers. ........................................... 107
15 Covalent layer-by-layer assembly of a SW/(PNIPAM-c-
PB15C5AM/SiO2)n/PNIPAM-c-PB15C5AM nanocomposite graft.. ............. 116

xi
LIST OF FIGURES
FIGURE Page
1 Scattering curves showing the percentage of light scattered versus temperature for a 10 mg/mL solution of poly(N-isopropylacrylamide) in water as a function of heating rate: red color (0.1 °C/min); magenta color (0.2 °C/min); green color (0.5 °C/min); blue color (1.0 °C/min); pink color (2.0 °C/min); (○) (5.0 °C/min).. .............................................................. 37
2 The temperature LCSTobsd for a particular scattering intensity plotted
versus the square root of the heating rate, r1/2, at various scattering intensities for a sample of 10 mg/mL of PNIPAM in water. ............................ 40
3 Scattering curves showing clouding of a 10 mg/mL solution of PNIPAM
in mixtures of H2O and D2O measured at a heating ramp rate of 0.1 °C/min: (a) pure H2O (lowest temperature curve); (b) 50/50 (v/v) H2O/D2O (intermediate temperature curve); (c) pure D2O (highest temperature curve).. .......................................................................................... 43
4 Scattering curves showing clouding of a) a 1 wt % solution of PEO (300
kDa) in mixtures of H2O and D2O and b) a 1 wt % solution of Pluronic® 10R5 (7) in mixtures of H2O and D2O.. ............................................................ 45
5 Scattering curves showing clouding of a 10 mg/mL solution of poly(N-
isopropylacrylamide) measured by the OptiMelt melting point apparatus at a heating ramp rate of 0.1 °C/min (solid Line) and by the temperature gradient apparatus (dotted line) ........................................................................ 46
6 Scattering curves showing clouding of a 10 mg/mL solution of poly(N-
isopropylacrylamide) in 0.4 M NaCl as a function of heating rate: red dots (0.1 °C/min); purple dots (0.2 °C/min); green dots (0.5 °C/min); blue dots (1.0 °C/min); pink dots (2.0 °C/min); dark red dots (5.0 °C/min).. ........................................................................................................... 47
7 Scattering curves showing clouding of a 1 wt % solution of 7 (Pluronic®
10R5) in water in the presence of various concentrations of Na2SO4. ............. 50
8 Scattering curves showing clouding of a 1 wt % solution of 7 (Pluronic® 10R5) in water in the presence of various concentrations of NaCl.. ................ 50

xii
FIGURE Page
9 Effects of anions on the LCST of 1wt% Pluronic® 10R5 aqueous solution ............................................................................................................. 51
10 Scattering curves showing clouding of three different Pluronic®
copolymer surfactants in water (1 wt %) at 2 °C/min: (a) 7 (initial clouding at 63 °C); (b) 8 (initial clouding at 76 °C); and (c) 9 (initial clouding at 83 °C). ............................................................................................ 52
11 ATR-IR spectra of (a) oxidized PE and PE/(PNIPAM/SiO2)n/PNIPAM
surfaces with (b) n=2; (c)=4; (d)=6. ................................................................. 58
12 Tapping mode AFM topographic image of a covalent layer-by-layer assembled PE/(PNIPAM/SiO2)n/PNIPAM nanocomposite surface with an rms roughness of ~ 287 nm. ......................................................................... 58
13 Static contact angles for various sodium salt solutions at 1.2 M measured
on a PE/(PNIPAM/SiO2)6/PNIPAM nanocomposite surface 3 minutes after a 10 µL droplet of corresponding solutions was placed on this surface. .............................................................................................................. 59
14 Static contact angles for sodium citrate aqueous solutions with varied
concentrations on the same PE/(PNIPAM/SiO2)6/PNIPAM nanocomposite surface 3 minutes after a 10 µL droplet of corresponding solutions was placed on this surface. ................................................................ 60
15 Static contact angles of a series of Na2SO4 solution with different
concentrations on a PE/(PNIPAM/SiO2)6/PNIPAM nanocomposite surface measured as a function of time. ............................................................ 61
16 Changes in advancing contact angle (Θa) of a
PE/PNIPAM/SiO2)6/PNIPAM nanocomposite surface measured with solutions of various salts as a function of salt concentration.. .......................... 62
17 Tapping mode AFM images of PE/(PNIPAM/SiO2)6/PNIPAM obtained
in (a) air, (b) water, (c) 1.4 M Na2SO4, and (d) 1.2 M NaSCN. ....................... 64
18 Cation effects on wettability of a PNIPAM/SiO2 grafted nanocomposite surface: a) The advancing contact angles of various cation sulfate salts versus salt concentration; b) The advancing contact angles of various cation sulfate salts versus salt solution activity. ............................................... 73
xiii
FIGURE Page
19 Cation effects on wettability of PNIPAM grafted nanocomposite surface. This figure was plotted over the advancing contact angles of various cation sulfate salts versus concentration of the sulfate ion. .............................. 74
20 Cation effects on wettability of PNIPAM grafted nanocomposite surface.
This figure was plotted over the advancing contact angles of various cation sulfate salts versus ionic strength of the salt solutions. ......................... 74
21 Anion effects on wettability of PNIPAM grafted nanocomposite surface:
a) The advancing contact angles of various sodium salts versus salt concentration; b) The advancing contact angles of various sodium salts versus salt solution activity. .............................................................................. 75
22 Tapping mode AFM images of PE/PEI/(PNIPAM/SiO2) 6/PNIPAM
obtained in (a) air, (b) water, (c) 0.2 M ZnSO4, (d) 0.8 M ZnSO4 and (e) 1.2 M ZnSO4.. ................................................................................................... 77
23 Cation effects on the LCSTs (based on the temperatures at which 50%
clouding were observed) of PNIPAM in aqueous solution: a) The LCSTs of PNIPAM in various cation sulfate salt solutions versus salt concentration (M); b) The LCSTs of PNIPAM in various cation sulfate salt solutions versus salt activity.. ..................................................................... 80
24 Cation effects on the LCSTs (based on the temperatures at which 10%
clouding were observed) of PNIPAM in aqueous solution: a) The LCSTs of PNIPAM in various cation sulfate salt solutions versus salt concentration (M); b) The LCSTs of PNIPAM in various cation sulfate salt solutions versus salt activity. ...................................................................... 81
25 Tapping mode AFM topographic images of surfaces of (a) APTES
treated silicon wafer, b) one PNASI/PEI bilayer primed silicon wafer, c) two PNASI/PEI bilayers primed silicon wafer.. ............................................... 88
26 Tapping mode AFM topographic image of a
SW/(PNIPAM/SiO2)6/PNIPAM nanocomposite surface with a rms roughness of 287 ± 53 nm.. .............................................................................. 89
27 Changes in advancing contact angle (Θa) of a
SW/(PNIPAM/SiO2)6/PNIPAM nanocomposite surface measured with solutions of various salts as a function of salt concentration. ........................... 91
xiv
FIGURE Page
28 Changes in advancing contact angle (filled diamonds) and static contact angle (filled triangles) of a SW/(PNIPAM/SiO2)6/PNIPAM nanocomposite surface measured with aqueous solutions of poly(sodium p-styrene sulfonate) in different concentrations ............................................... 93
29 Advancing contact angles measured with solutions of mixed NaOAc and
NaSCN on the SW/(PNIPAM/SiO2)6/PNIPAM nanocomposite surface. ........ 94
30 UV spectra collected during the hydrolysis of p-nitrophenyl octanoate catalyzed by PDAAP. ..................................................................................... 101
31 Hydrolysis of 4-nitrophenyl octanoate in pH 8 tris buffer at 20 °C by
different 4-N,N-(dialkylamino)pyridine catalysts. .......................................... 102
32 Hydrolysis of 4-nitrophenyl octanoate in pH 9 tris buffer at 20 °C by different 4-N,N-(dialkylamino)pyridine catalysts. .......................................... 103
33 Instrumentation characterization of copolymer 15: (a) Cyclic
voltammogram of 15 in aqueous solution measured with a glassy carbon electrode and a Pt wire electrode at 0 °C. The sweep rate is 10 mV/s and the supporting electrolyte was 0.1 M KCl; (b) Electron spin resonance spectrum of polymer 15 in THF at room temperature. ................................... 108
34 Clouding curves for a 10 mg/mL sample of polymer 15 with 0.1 M
Na2SO4 in solutions that contain increasing amounts of ascorbic acid. ......... 110
35 Clouding curves for a 10 mg/mL sample of polymer 15 with 19.6 mM ascorbic acid and 0.1 M Na2SO4 in solutions that contain increasing amounts of K3[Fe(CN)6]. The K3[Fe(CN)6] concentrations vary from right to left with concentrations of 0, 4, 12, 20, 24, 28, 32, 40, and 48 mM. ................................................................................................................. 110
36 Clouding curves of a 10 mg/mL PNIPAM in the control experiments
with ascorbic acid and K3[Fe(CN)6]: (a) control experiments without addition of 0.1 M Na2SO4, (b)control experiments with addition of 0.1 M Na2SO4. ........................................................................................................... 111
37 Clouding curves for a 10 mg/mL sample of polymer 15 in solutions that
contain increasing amounts of bleach.. ........................................................... 112
xv
FIGURE Page
38 Clouding curves of 10 mg/mL PNIPAM in the control experiments with varied amounts of bleach. ............................................................................... 113
39 Clouding curves of copolymer 15 with different i-PrNH2/TEMPO ratios:
solid line, a 90/10 i-PrNH2/TEMPO ratio; dashed line, an 85/15 i-PrNH2/TEMPO ratio. ...................................................................................... 113
40 Advancing contact angles of SW/[PNIPAM-c-
PB15C5AM/SiO2]6/PNIPAM-c-PB15C5AM nanocomposite surface measured with different alkali metal chlorides at varied concentrations. ...... 118
41 Advancing contact angles of SW/[PNIPAM/SiO2]6/PNIPAM
nanocomposite surface measured with different alkali metal chlorides at varied concentrations. ..................................................................................... 119

xvi
LIST OF TABLES
TABLE Page
1 Effect of varying concentrations of polyethylene glycol (PEG) and bovine serum albumin (BSA) on the cloud point temperature of PNIPAM samples with different degree of polymerization.. ........................... 16
2 LCSTactual Obtained from the Linear Regression Analyses of LCSTobsd
Versus r1/2 at Various Levels of Scattering in the Cloud Point Curves for PNIPAM in H2O or D2O. .................................................................................. 41
3 Slopes for Plots of LCSTobsd Versus r1/2 at Various Levels of Scattering
in the Cloud Point Curves for PNIPAM in H2O or D2O. ................................. 42

1
CHAPTER I
INTRODUCTION
Stimuli-responsive Polymers
Since the first synthetic polymer – Bakelite was made a century ago, numerous
synthetic polymers have been made and used as materials. Stimuli-responsive polymers
are but a small subset of these materials. They have nonetheless attracted a vast amount
of attention due to their special properties and the applications of these properties in
various areas. Stimuli-responsive polymers are often called smart polymers or intelligent
polymers. Such polymers respond to external stimuli such as temperature, pH, ionic
strength and solvent composition by undergoing some sort of property changes. More
recently, subtler changes including changes in ambient electrical1 and magnetic fields,2
photochemical changes,3 changes in a polymer’s redox state,4,5 and changes due to
mechanical stress6,7 have also been be used as external stimuli to usefully affect a
responsive polymer’s properties.
Thermoresponsive polymers probably are the most studied stimuli-responsive
polymers and their temperature responsiveness can be further fine tuned by varying
polymer composition and polymer stereochemistry.8 Common examples of
thermoresponsive polymers are polymers that undergo fast, reversible phase transitions
such that the unfavorable entropy of solvation of a polymer leads them to change from a
hydrophilic state to a hydrophobic state. These changes are apparent at the macroscopic
____________ This dissertation follows the style of the Journal of the American Chemical Society.

2
level by visual inspection as the polymer solution changes from clear to cloudy at the
polymer’s lower critical solution temperature (LCST), the temperature at which the
solvation entropy and solvation enthalpy terms of the Gibbs equation become equal.
During the phase transition, the polymer molecules change from an extended coil
conformation to a globular conformation. These conformational changes are directly
analogous to protein cold denaturation. In prior work by the Bergbreiter and Cremer
groups, this property of temperature responsive polymers has been used to model the
processes that occur in protein cold denaturation. In these studies, poly(N-
isopropylacrylamide) (PNIPAM) has proven to be an especially useful model
macromolecule for studying protein conformational changes.9,10
PNIPAM is one of the most well known and intensively studied
thermoresponsive polymers in aqueous solution because its LCST of ~32 °C is close to
the physiological temperature. Thus, it has potential applications in drug delivery as well
as being generally useful in studies of ‘smart’ stimuli-responsive solubility. Other N-
alkyl poly(acrylamide)s such as poly(N,N-dimethylacrylamide) and poly(N-
propylacrylamide) also exhibit LCST properties.11 In general, it is believed that an
appropriate proportion of hydrophobicity and hydrophilicity in the polymer molecular
structure is necessary for the phase transition that underlies an LCST to occur.12 In
addition to poly(N-alkylacrylamide)s, poly(N-vinyl alkylamide)s,13 poly(vinyl ether)s,
poly(alkene oxide)s and cellulose ethers14,15 also exhibit temperature-induced phase
transitions. Some examples of those polymers are shown in Scheme 1.

3
Scheme 1. Examples of temperature-responsive polymers.
Stimuli-responsive polymers have attracted great interest in bio-related
applications such as drug delivery, bioseparations,16 chromatography,17-19 and cell
culture. These polymers are used in those applications in three general ways. The first is
to use a designed stimuli-responsive polymer in solution as a homopolymer, copolymer,
or block polymer. For example, copolymers can be prepared such that they incorporate
other functional groups into thermoresponsive polymers and the LCST can be altered
depending on the nature of the added functional groups. An LCST study of the aqueous
solutions of such copolymers is a useful method to test the effect of such substitutions
and such LCST studies have also been used in attempts to understand macromolecule
solvation. Block copolymers that consist of a thermoresponsive polymer segment and
another functional polymer segment can self-assemble to form micelles in water. The
resulting polymeric micelles can then encapsulate guest molecules under appropriate
conditions. When a certain external stimulus is applied, the micelle structure can
disassemble. This disassembly releases the guest molecules. Polymers that do not

4
contain thermoresponsive polymer segments can also be designed to respond to changes
in pH, photochemical process,3 electrical/magnetic fields, or mechanical stress. Such
changes often lead to chemical changes of the polymer’s functional groups, which in
turn changes the physical properties of the polymer.
A second common way to use responsive polymers is to prepare cross-linked
versions of these polymers in the form of gel that can swell or shrink in response to some
external stimulus.20-24 Stimuli-responsive hydrogels have been used in both drug loading
and release formats. Such gels’ release characteristics can be tailored to a range of target
environments.
A final way to use stimuli-responsive polymers is to graft them onto a surface. If
a polymer graft reversibly swells or collapses, the phase changes of the graft can change
a surface from hydrophilic to hydrophobic or oleophilic to oleophobic25 Stimuli-
responsive polymer grafted surfaces can be used as separation media, tissue supports, in
microfludic devices, and in biosensors.
My research is broadly focused on studying the behavior of stimuli-responsive
polymers. As discussed below, it has included the development of new ways to study
LCST events, ways to study and prepare new stimuli-responsive soluble polymers as
well as studies where stimuli-responsive polymers are used to prepare nanocomposite
grafts on organic and inorganic surfaces.
Analyses of Stimuli-responsive Behavior
Various instruments have been used to study LCST phenomena and the effects of
external stimuli on the LCSTs. Different aspects of the phase transition process have

5
been probed by various instruments. Laser light scattering including dynamic and static
laser light scattering spectrometers are used to detect the hydrodynamic radius changes
of the thermoresponsive polymers that occur during the phase transition. A subtle radius
change is often observed before and after the sample reaching its LCST. Wu observed
the thermodynamically stable, collapsed single-chain globules of a linear PNIPAM
sample for the first time by using a combination of static and dynamic laser light
scattering.26 In this study, a PNIPAM sample with high molar mass (Mw > 107 g/mol)
and low dispersity (Mw/Mn < 1.05) was used and the phase transition behavior of
individual polymer chains was carefully examined by measuring changes of the gyration
(Rg) and hydrodynamic (Rh) radii. Before the phase transition happened, the ratio of
Rg/Rh was a constant (~ 1.52) indicating a flexible coil in a good solvent. The ratio of
Rg/Rh decreased with increasing of temperature during the phase transition and reached a
plateau value of 0.63 suggesting that the globular form of this PNIPAM sample was a
uniform sphere. At the collapsing limit, the single-chain globule still contained 80% of
water in its hydrodynamic volume.
Laser light scattering is also a useful method in studying the responsiveness of
stimuli-responsive micelles and vesicles. Zhang and coworkers studied the
conformational changes of PNIPAM blocks in the corona of micelles and vesicles
prepared from narrowly distributed polystyrene-b-poly(N-isopropylacrylamide) diblock
copolymers in water by a combination of static and dynamic laser light scattering.27
Their results revealed that brushes formed by PNIPAM chains in the corona of the
micelles underwent a continuous collapse transition. PNIPAM brushes in the corona of
6
the vesicles exhibited a broad transition from 28 to 36 °C, shrinking in the range of 20 to
28 °C. The shrinking at a low temperature was attributed to interchain overlapping of the
dense brushes on the concave surface of the vesicle.
As mentioned earlier, an aqueous solution of a thermoresponsive polymer turns
cloudy at temperatures higher than its LCST, which leads to the light transmittance and
light scattering changes in the sample. UV-Visible spectroscopy is a common tool used
to study LCSTs by measuring the changes of amount of light that are transmitted by the
sample. This method is often referred to as turbidimetry analysis. However, this method
in general has low-throughput capabilities and requires relatively large amounts of
polymer for analysis. Recently, other instrumental methods to study light scattering
changes have been developed by using a digital camera equipped with a digital image
processor to record the scattering intensity changes. For example, the Bergbreiter and
Cremer groups used a dark-field microscope equipped with a DCC camera as a detector
to measure the changes of light scattering intensity of PNIPAM samples undergoing
phase separation. This detector setup was coupled with a temperature gradient device
(Scheme 2) which applied a temperature gradient along the long axis of a capillary tube
containing aqueous solution of a sample. The temperature of the sample inside the tube
at different positions differed depending on the distance from a hot or cold thermal sink.
This apparatus was especially useful as it provided high-throughput analytical procedure.
Six samples can be analyzed simultaneously with each sample simultaneously
experiencing a wide range of temperature. By using this apparatus, effects of end group
polarity, effects of altered molecular weight, effects of polymer structure, and the effects

7
of changes in solution composition on the LCST of PNIPAM and other polymers were
investigated. The results were published in several papers.28-33
Scheme 2. Schematic drawing of a temperature gradient microfluidics device equipped with dark-field microscope.
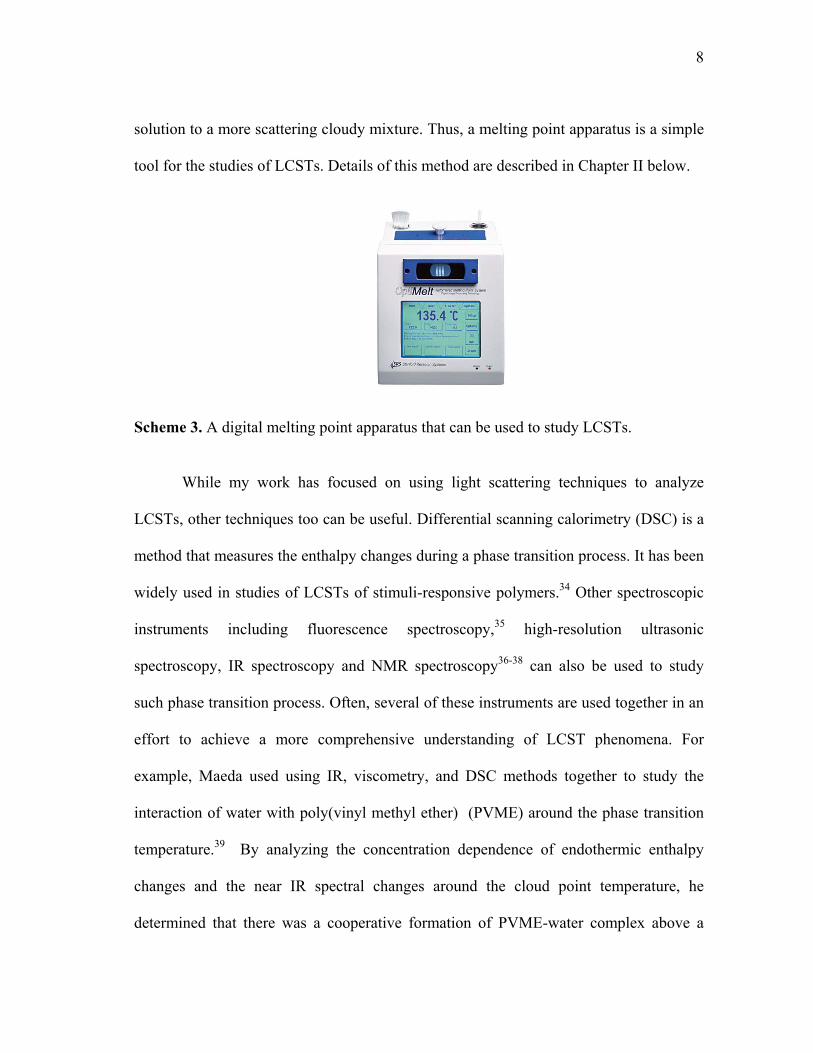
Recently, we developed a second high-throughput cloud point assay. This
procedure used a commercially available automatic melting point apparatus as the
analytical instrument (Scheme 3). A melting point apparatus is usually used to measure
the melting point of solid samples by detecting the light scattering changes that occur
while the sample changes phase from being a strongly scattering solid to becoming a less
scattering liquid. In this automatic melting point apparatus, a digital camera is used to
record the scattering for up to three samples while the samples are being heated up under
a precisely controlled heating ramp rate. A computerized digital image processor is then
used to analyze the light scattering intensity changes on each image. This produces
melting curves of scattering intensity vs. temperature for each sample. Since the changes
of light scattering behavior of the aqueous solutions of a temperature responsive polymer
are in a sense the reverse of melting, this same apparatus can be used to monitor the
scattering intensity changes as an aqueous solution changes from a less scattering
8
solution to a more scattering cloudy mixture. Thus, a melting point apparatus is a simple
tool for the studies of LCSTs. Details of this method are described in Chapter II below.
Scheme 3. A digital melting point apparatus that can be used to study LCSTs.
While my work has focused on using light scattering techniques to analyze
LCSTs, other techniques too can be useful. Differential scanning calorimetry (DSC) is a
method that measures the enthalpy changes during a phase transition process. It has been
widely used in studies of LCSTs of stimuli-responsive polymers.34 Other spectroscopic
instruments including fluorescence spectroscopy,35 high-resolution ultrasonic
spectroscopy, IR spectroscopy and NMR spectroscopy36-38 can also be used to study
such phase transition process. Often, several of these instruments are used together in an
effort to achieve a more comprehensive understanding of LCST phenomena. For
example, Maeda used using IR, viscometry, and DSC methods together to study the
interaction of water with poly(vinyl methyl ether) (PVME) around the phase transition
temperature.39 By analyzing the concentration dependence of endothermic enthalpy
changes and the near IR spectral changes around the cloud point temperature, he
determined that there was a cooperative formation of PVME-water complex above a

9
critical concentration of PVME. He was also able to show that there was a temperature-
induced cooperative destruction of this same complex around 36 °C, resulting in the
aggregation of the polymer chains due to the exposure of their hydrophobic groups.
Additive Effects on the Responsiveness of Thermoresponsive Polymers
The phase transition temperature of an aqueous solution of a stimuli-responsive
polymer is known to be influenced by the addition of other substances such as
cosolutes,40-42 cosolvent,43 surfactants44 and other macromolecules.45 The effects of such
additives can alter the LCST so that it becomes higher or lower. The changes in the
LCST depend on the interactions among the polymer, water and the additive. Salt and
other cosolute effects are the most studied of the additive effects. This is in part a result
of the fact that the changes in the LCST of a stimuli-responsive polymer in response to
salts are paralleled by salt effects on the protein cold denaturation and enzyme activity.
The studies of salt effects began over 100 years ago in the late 1880 – when
Franz Hofmeister, a pharmacologist, discovered that salts had different effectiveness in
precipitating protein suspensions. Their effectiveness could be arranged in a sequence –
that is now called a Hofmeister series. These effects have later been shown to be broadly
applicable to many sorts of macromolecules. While the original Hofmeister series ranked
anions or cations in their relative ability to precipitate a mixture of hen egg white
proteins, later works showed that salt identity and concentration affected enzyme
activity, protein stability and protein crystallization in the same fashion. Recent work has
even shown Hofmeister effects for salts on bacterial growth. A 1985 comprehensive
review of the Hofmeister effect includes nearly 1000 references and concludes that the
10
Hofmeister effect has the following characteristics: 1) it becomes important in the
concentration range of 0.01-1.0 M; 2) different measurements of the Hofmeister series
typically give similar ranking order; 3) there is usually a sign inversion at about NaCl;
4) anion effects are dominant; and 5) mixture of different salts have an effect that is
approximately additive.46 Typically, the Hofmeister anion series in terms of stabilizing
proteins has the following order:
CO32- > SO4
2- > S2O32- > H2PO4
- > F- > Cl- > Br- ≈ NO3- > I- > ClO4
- > SCN-.
The anions on the left side of Cl- are historically called kosmotropic (water structure
making) and the ones to the right are called chaotropic (water structure breaking).
Whether the influence of anions on the macromolecular properties is caused at least in
part by ‘making’ or ‘breaking’ bulk water structure has been debated over the past three
decades. With the emergence of advanced experimental techniques, new data and
evidence has suggested alternative explanations for such effect. Freitag and Garret-
Flaudy had studied the effects of six potassium salts and two series of cations (five
alkali-metal hydroxides and chlorides, respectively) on the cloud point temperature of
PNIPAM oligomers. They found that all salts, with the exception of low concentrations
(<0.5 M) of KI, lowered the cloud point temperature. Also, the relationship between the
cloud point temperature and the concentrations of the added salt tended to be linear. The
intensity of the anion effects corresponded to their position in the Hofmeister series.
They interpreted the salt effect on PNIPAM oligomers based on the structure
making/structure breaking potential of the involved ions as well as on the solvophobic
theory which took into account the contribution of both electrostatic and hydrophobic

11
interactions.47 The Bergbreiter and Cremer group also examined the salt effect of eleven
sodium salts on the LCST of PNIPAM by using the temperature gradient microfluidics
apparatus mentioned earlier. From these studies, they found that the ability of anions to
lower the LCST followed the Hofmeister series. The effect of the anions was explained
based on three direct interactions of the anions with the macromolecule and its
immediately adjacent hydration shell. First, the anions could modulate the surface
tension of the polymer/water interface. Second, anions (especially the kosmotrophic
anions) polarized solvation water molecules that were directly hydrogen bonded with the
amide moieties of PNIPAM. Last, certain chaotropic anions had an apparent binding
constant for PNIPAM that created a ‘salting-in’ effect.29
Even though there is not a united theory to explain the anion effect, the ranking
order of anions on LCST is widely accepted. The effects of cations on LCST are more
complicated in terms of their ranking order and their overall importance relative to
anions. As mentioned in Collin and Washabaugh’s review, the Hofmeister effect is
dominated by anions and the effects of cations are more modest. Freitag and Garret-
Flaudy also investigated the effects of two series of cations (five alkali-metal hydroxides
and chlorides, respectively) on the cloud point temperature of PNIPAM oligomers. Their
results showed that variation of alkali cations, with the exception of Li+, had little
difference in depressing PNIPAM’s LCST. In the experiment conducted by Hofmeister
in 1888, the relative effectiveness of the cations of metal sulfate salts in salting-out of
euglobulins from aqueous solution was ranked: Li+ > Na+ ≈ K+ > NH4+ > Mg2+.48 The
only divalent cation that he examined was magnesium (II) and it was less effective in

12
salting-out protein than monovalent cations. In the study of the effects of salts on helix
↔ coil transition in fibrous protein collagen, von Hippel and Wong49 found that the
effectiveness of the cations on stabilizing the native helical structure of the collagen
followed the order:
(CH3)4N+ > NH4+ > Cs+, Na+, K+, Rb+ > Li+ > Mg2+ > Ca2+ > Ba2+.
This ranking was somehow correlated with cation charge density in such way that the
cation with less charge density had a larger effect on stabilizing the helical form of
collagen. Warren et al.50,51 studied the salt effect on the activity of highly charged and
uncharged enzymes and found that the ability of the cations of metal chlorides to
maintain the enzyme activity followed:
(CH3)4N+ > Cs+ > K+ > Na+ > Rb+ > Li+.
Only monovalent cations were examined in this study and the ranking order of cations
was similar to that of von Hippel and Wong. However, in the studies of the salt effect on
the stabilization of halophilic malate dehydrogenase, Ebel et al. found that anions and
cations were independently important in affecting the protein stability.52 The order of
cation efficiency depended on the salt concentration. At low salt concentration, the order
of cations in stabilizing the folded protein form was:
Ca2+ ~ Mg2+ > Li+, NH4+, Na+ > K+ > Rb+ > Cs+.
While at high salt concentration, the order reversed to
NH4+, Na+, K+, Cs+ > Li+ > Mg2+ > Ca2+.
Divalent cations were most efficient in stabilizing protein only at the lower salt
concentrations and tended to denature the protein at higher salt concentrations. The
13
anion effect however followed the Hofmeister series as SO42- ~ OAc- > F- > Cl- > Br- > I-
both at low and high concentrations.
The aforementioned examples suggested that the effects of cations on
macromolecule solubility are complicated. The effectiveness of the cations seems to
depend on the structure of the macromolecules used to probe the cation effects and on
the nature of the counter ions. Most studies of cation effects have also been focused on
monovalent cations, only a few divalent or higher valent cations have been investigated.
In the research discussed in this dissertation, effects of cations such as Al3+, Zn2+, Mg2+,
Cu2+ and Ni2+ on PNIPAM solubility in solution and on wettability of PNIPAM-grafted
nanocomposite surfaces have been studied. The details will be discussed in Chapter IV.
These studies showed significant cation effects both on solution LCSTs and on graft
surface wettability with sulfate ion as a common counter ion. Furthermore, if the salt
activity was taken into account, the cation effect was correlated with the cation charge
numbers in a way that their effectiveness follows order of trivalent > divalent >
monovalent.
A recent report from Guo and Friedman also suggested that cation effects are
charge density dependent.53 They used Gadolinium (Gd3+) vibronic sideband
luminescence spectroscopy (GVSBLS) as a probe to study cation effects on the changes
of OH stretching frequency derived from first-shell waters of aqueous Gd3+ and of Gd3+
coordinated to other molecules. Typically, the frequency of vibronic sideband (VSB) of
this OH stretching mode was inversely correlated with the strength of the hydrogen
bonding of Gd3+ coordinated water molecules to their neighboring waters. They found

14
out that the addition of cation chloride or acetate salts to aqueous solution of EDTA,
structured peptides, or a calcium-binding protein increased the VSB in a cation identity
and concentration dependent fashion. The cation effects on increasing VSB frequency
were determined by the charge density of the cations. They also found out that the cation
effects were modulated by the specific anion used. They concluded that high charge
density cations sequestered waters in a configuration that precluded strong hydrogen
bonding to neighboring waters. Anion effects emerged as anions competed for
hydrogen-bonding sites with the remaining free waters on the surface of the hydration
shell.
Several groups have studied the effects of surfactants (anionic, cationic and
nonionic) on the phase transition of PNIPAM solutions or PNIPAM gels.54-56 In solution,
anionic surfactants such as sodium dodecyl sulfate (SDS) usually increase PNIPAM’s
LCST with increasing surfactant concentrations. At higher concentrations, the addition
of SDS can even lead to the disappearance of this clouding phenomenon. Cationic
surfactants only cause slight LCST increase while nonionic surfactants have almost no
effect on the LCST.57,58 Schild and Tirrell had systematically studied the interaction of
PNIPAM with sodium n-alkyl sulfates in experiments where they varied the alkyl chain
lengths to include alkyl groups that had 1-16 carbons.55 Surfactants with chain lengths ≤
4 depressed the LCST of PNIPAM and exhibited no evidence of enhanced aggregation
in PNIPAM solutions. Surfactants with intermediate chain lengths of 5-10 carbons
depressed the LCST at low surfactant concentrations but increased the LCST at
concentrations that exceed the critical aggregation concentrations. Sodium n-dodecyl

15
sulfate elevated the LCST even at low concentrations and formed aggregates in
PNIPAAM solutions at a concentration 10-fold lower than its critical micelle
concentration. They concluded that PNIPAM promoted the surfactant aggregation and
formed complexes with the so- formed surfactant micelles. This effect became most
apparent with longer surfactant alkyl groups and was not seen for surfactants containingt
chain lengths of four carbons or less. Elevation of the LCST with longer chain sodium
n-alkyl sulfates was a result of electrostatic repulsion between charged polymer-micelle
complexes, which prevent polymer collapse and aggregation.
An anionic biological surfactant, sodium cholate has also been applied to
PNIPAM solution to understand the biocompatibility of PNIPAM’s biomedical
applications.59 DSC studies showed that the presence of sodium cholate broadened the
phase transition endotherm of PNIPAM solution and shifted the PNIPAM LCST to
lower temperature. The effect of the sodium cholate on the LCST of PNIPAM was in
contrast to the effect of conventional anionic surfactants that generally shifted the LCST
to higher values.
As mentioned earlier, stimuli-responsive polymers, especially PNIPAM have
received attention for their biomedical applications in drug delivery and in biosensors.
Given the presence of biological macromolecules in aqueous solutions, various studies
have been reported that examine the influence of macromolecular species on the phase
transition temperatures of PNIPAM. Housni and Narain examined the influence of
macromolecular species, polyethylene glycol (PEG with Mn of 3400 Da) and ionic
bovine serum albumin (BSA with Mn of 63000 Da), on the LCSTs of PNIPAM prepared
16
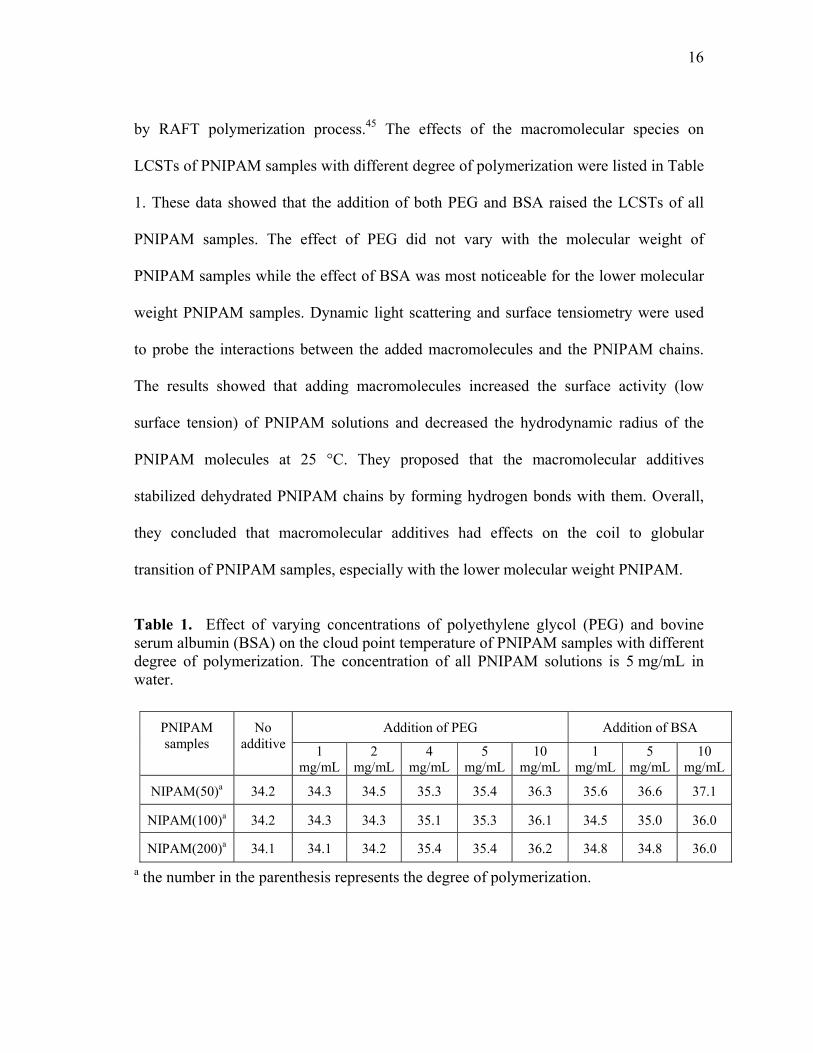
by RAFT polymerization process.45 The effects of the macromolecular species on
LCSTs of PNIPAM samples with different degree of polymerization were listed in Table
1. These data showed that the addition of both PEG and BSA raised the LCSTs of all
PNIPAM samples. The effect of PEG did not vary with the molecular weight of
PNIPAM samples while the effect of BSA was most noticeable for the lower molecular
weight PNIPAM samples. Dynamic light scattering and surface tensiometry were used
to probe the interactions between the added macromolecules and the PNIPAM chains.
The results showed that adding macromolecules increased the surface activity (low
surface tension) of PNIPAM solutions and decreased the hydrodynamic radius of the
PNIPAM molecules at 25 °C. They proposed that the macromolecular additives
stabilized dehydrated PNIPAM chains by forming hydrogen bonds with them. Overall,
they concluded that macromolecular additives had effects on the coil to globular
transition of PNIPAM samples, especially with the lower molecular weight PNIPAM.
Table 1. Effect of varying concentrations of polyethylene glycol (PEG) and bovine serum albumin (BSA) on the cloud point temperature of PNIPAM samples with different degree of polymerization. The concentration of all PNIPAM solutions is 5 mg/mL in water.
a the number in the parenthesis represents the degree of polymerization.
PNIPAM samples
No additive
Addition of PEG Addition of BSA
1 mg/mL
2 mg/mL
4 mg/mL
5 mg/mL
10 mg/mL
1 mg/mL
5 mg/mL
10 mg/mL
NIPAM(50)a 34.2 34.3 34.5 35.3 35.4 36.3 35.6 36.6 37.1
NIPAM(100)a 34.2 34.3 34.3 35.1 35.3 36.1 34.5 35.0 36.0
NIPAM(200)a 34.1 34.1 34.2 35.4 35.4 36.2 34.8 34.8 36.0

17
Tjerneld et al. investigated the effects of sugars on the cloud points of aqueous
poly(ethy1ene glycol) (PEG 20000) solutions with sugars like glucose, maltose,
cellobiose, isomaltose, maltotriose, isomaltotriose, and p-cyclodextrin. All of these
glucose-based sugars, except p-cyclodextrin, were found to decrease the cloud points of
PEG solution.60 The 1,6-linked linear oligosaccharides were found to be much more
effective in depressing the cloud points of PEG than the 1,4-linked linear
oligosaccharides that had the same number of glucose units. The differences between the
sugars in their ability to decrease the cloud points in aqueous PEG solutions were
explained by their differences in forming intramolecular hydrogen bonds. Studies of the
effects of sugars on the LCSTs of PNIPAM aqueous solutions were also carried out by
Livney et al. in an effect to understand sugar effects on protein stabilization.61 Their
results showed no significant binding of sugars to the polymer occurred and that the
LCST of PNIPAM decreased with increasing carbohydrate concentrations. They found a
good correlation between a sugar’s hydration numbers and its effect on PNIPAM’s
LCST. The carbohydrates that formed larger and denser hydrated cluster had stronger
effect on lowering the coil-to-globule transition temperature.
Design of Stimuli-responsive Polymers
Polymer microstructures will affect the responsive properties of a stimuli-
responsive polymer. The design of ‘smart’ polymers for applications in controlled
release or targeted delivery often includes addition of other functional groups or
segments to a well-studied thermoresponsive polymer. Responsive random
copolymers,62,63 amphiphilic polymers, grafted copolymer64-66 and block polymers67,68

18
with different functionalities, shapes and sizes have all been studied in this regard.
Generally, incorporation of hydrophobic groups into a thermoresponsive polymer will
lower its LCST while the addition of hydrophilic groups will increase its LCST. For
example, Kakuchi et al. studied the effect of varying the structures of a series of block
copolymers consisting of PNIPAM and poly(N-hydroxyethylacrylamide) (PHEAA) on
the thermoresponsive behaviors of these polymers.69 Their syntheses used atom transfer
radical polymerization (ATRP) to prepare well-defined diblock and triblock copolymers
consisting of different fractions of PNIPAM and PHEAA. The number-average
molecular weight and mole fraction of each segment were controlled by adjusting the
monomer/initiator ratio in feed. The LCSTs of block copolymers with different
compositions were then examined by turbidimetry. Their studies showed that the
copolymers with lower mole fractions of HEAA units exhibited phase transition
phenomenon, in which the LCSTs depended on the mole fractions of HEAA in the
copolymer. On the other hand, no LCST was observed for the copolymers with higher
mole fractions of HEAA. 1H NMR spectroscopy showed that the disappearance of the
LCSTs was due to the formation of the water-soluble micelles. Their studies also
showed that structural factors such as position, length and sequence of each block in the
copolymers significantly affected the polymers’ thermoresponsiveness.
Copolymers that contain functional groups such as acid or base sensitive groups
can exhibit dual responsiveness, namely pH and temperature responsiveness.22 Block
copolymers that form core-shell micelles70,71 or core-shell-corona complex micelles,72,73
and ABC miktoarm star terpolymer74 have been studied for their applications on

19
controlled drug release that can respond both to pH and to temperature changes.
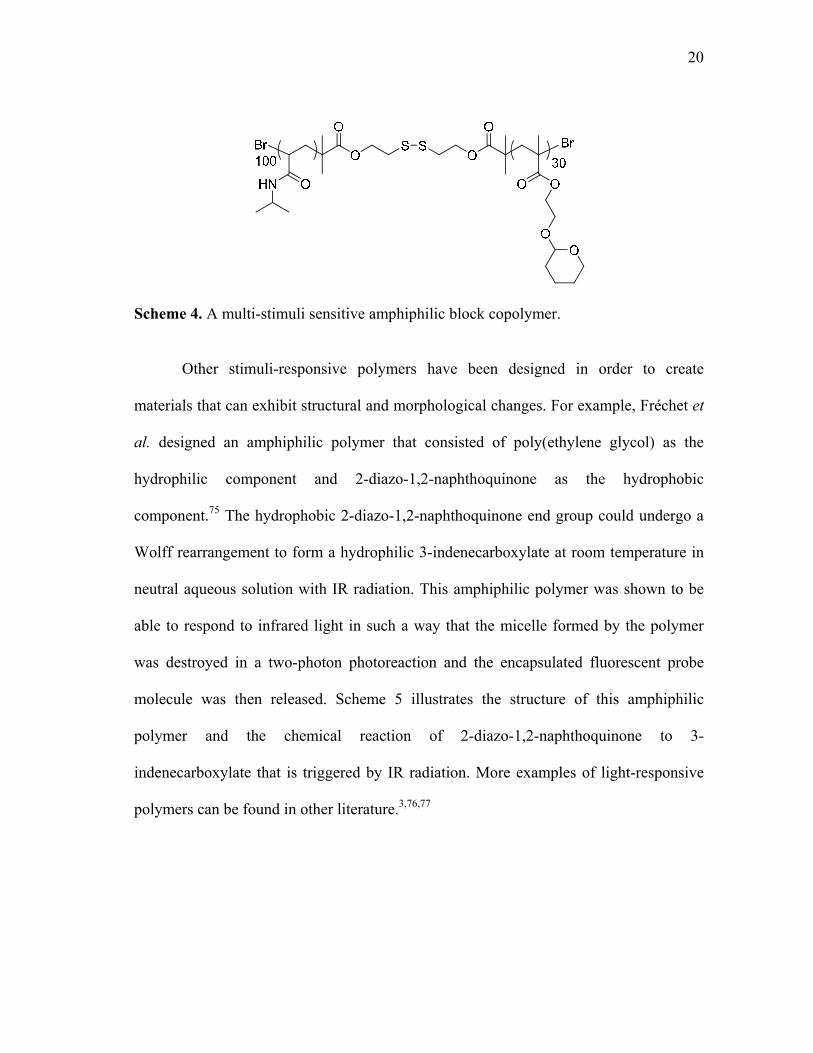
Thayumanavan et al. designed an amphiphilic block copolymer, which consisted of a
hydrophobic tetrahydropyran (THP)-protected 2-hydroxyethyl methacrylate (HEMA)
segment and a hydrophilic PNIPAM segment with an intervening disulfide bond
(Scheme 4). This block copolymer can self-assemble to form micelles and encapsulate
guest molecules inside the micelles at room temperature in water. However, the
hydrophobic THP-protected HEMA block is acid sensitive. Under acidic conditions, the
THP protection groups can be removed by hydrolysis and the HEMA segment became
hydrophilic. The hydrophilic PNIPAM block is temperature responsive and can become
hydrophobic when the temperature is above its LCST. Changing of pH or temperature
will thus affect the self-assembly of these micelles by changing the hydrophobicity of
one of the segments on this block copolymer. Guest molecules in the micelles can then
be released by a pH or temperature change. Furthermore, this amphiphilic block
copolymer is also redox responsive since the disulfide bond can break under reduction
conditions to disassemble the micelle structure. Further experiments also showed that
this amphiphilic block copolymer was responsive not just to one single stimulus, but to
multiple stimuli.
20
Scheme 4. A multi-stimuli sensitive amphiphilic block copolymer.
Other stimuli-responsive polymers have been designed in order to create
materials that can exhibit structural and morphological changes. For example, Fréchet et
al. designed an amphiphilic polymer that consisted of poly(ethylene glycol) as the
hydrophilic component and 2-diazo-1,2-naphthoquinone as the hydrophobic
component.75 The hydrophobic 2-diazo-1,2-naphthoquinone end group could undergo a
Wolff rearrangement to form a hydrophilic 3-indenecarboxylate at room temperature in
neutral aqueous solution with IR radiation. This amphiphilic polymer was shown to be
able to respond to infrared light in such a way that the micelle formed by the polymer
was destroyed in a two-photon photoreaction and the encapsulated fluorescent probe
molecule was then released. Scheme 5 illustrates the structure of this amphiphilic
polymer and the chemical reaction of 2-diazo-1,2-naphthoquinone to 3-
indenecarboxylate that is triggered by IR radiation. More examples of light-responsive
polymers can be found in other literature.3,76,77

IR
Schrea
col
ma
is t
rea
we
suc
vis
Sch
rea
HNSO2 O
O
11
light sensitive a
heme 5. Theaction of the
Spiropy
lorimetric re
aterials, a rev
the key react
action. When
ere attached
ch as stretch
sible color ch
heme 6. A s
As sho
actions can b
OO
N2
17
amphiphilic po
e structure of2-diazo-1,2-
yran-contain
esponse have
versible elec
tion in this d
n polymers
to the 5’ an
hing and co
hanges.
spiropyran-c
own in Sche
be incorpora
lymer
2-diazo
f a IR light s-naphthoqui
ning polymer
e been prepa
ctrocyclic rin
design and th
such as pol
nd 8 position
mpression c
containing po
emes 4–6, f
ated into poly
O
o-1,2-naphthoq
hydrophobic
sensitive ampnone trigger
rs that respo
ared by Mo
ng-opening r
he color cha
ly(methyl ac
ns of spirop
can induce t
olymer that
functional gr
ymers and s
N2 hv, H2O
Wolff rea
quinone
phiphilic pored by IR rad
ond to mech
ore and Sot
reaction of s
anges observ
crylate) or p
yran, applic
the ring-ope
can respond
roups that u
uch function
O, pH 7.4
rrangment
3-in
lymer and thdiation.
hanical stress
ttos (Scheme
spiropyran t
ved are assoc
poly(methyl
cation of me
ening reactio
d to mechanic
undergo spe
nality can al
OO
ndenecarboxyl
hydrophilic
he chemical
s and exhibi
e 6).78 In the
o merocyan
ciated with t
l methacryla
echanical str
on and lead
cal stress.
ecific chemi
lter the produ
21
ate
it a
ese
ine
this
ate)
ess
d to
ical
uct

22
polymer’s physical properties in various ways. Given the wide range of chemical
reactions available, the possibilities of designing new smart polymers are endless. A
broader spectrum of stimuli-responsive polymers that include not just thermoresponsive
polymers but also electric-, magnetic- and mechano-responsive polymers can be
anticipated. Part of my research involved incorporating new functional groups into
PNIPAM to instigate specific responsiveness on this well-studied thermoresponsive
polymer and to alter the LCST in a controlled manner. The details will be discussed in
Chapter VI.
Grafting Stimuli-responsive Polymers on Solid Surfaces
Stimuli-responsive polymers have also been grafted on solid substrates to create
functional surfaces based on the same sorts of responsiveness observed in aqueous
solutions. When grafted onto a surface, the thermoresponsive polymer chains will exist
in an expanded conformation at low temperatures. Such hydrophilic grafts lead to
hydrophilic surfaces. If at higher temperatures, a thermoresponsive polymer undergoes
hydrophobic collapse, the surface can become hydrophobic. Just as PNIPAM is the most
commonly studied stimuli-responsive polymers in solution, it is the most studied at
surfaces too. Several experimental studies have showed that PNIPAM chains on grafted
surfaces undergo coil-to-globule phase transition at temperatures that are close to its
LCST.79-81 These PNIPAM grafts have been used in drug delivery systems, in
permeation-controlled filters, and in temperature-controlled actuators. PNIPAM grafts
have also been used in liquid chromatography systems and recently temperature-

23
controlled cell culture dishes where the stimuli-induced hydrophobicity changes of
PNIPAM are used to change surface hydrophobicity.
Various surface grafting methods including electrostatic self-assembly, hydrogen
bond self-assembly, physical absorption and covalent grafting have been used to prepare
responsive surface grafts. These methods can be used on glass, silicon wafers, metals,
and even plastics. Our group is interested in the chemical grafting methods especially in
covalent layer-by-layer self-assembly. This introduction will discuss different strategies
for chemical grafting.
A common chemical grafting strategy is to ‘grow’ polymer chains from the
surface. This method has been referred as the ‘graft-from’ method since the
polymerization is initiated from the surfaces. By using this method, surfaces with long
chains and high densities of polymer grafts can be prepared. In order to carry out this
graft-from method, the substrate surfaces are first chemically modified to attach active
groups. These groups can include initiators, transfer agents, or monomers. Conventional
radical polymerizations or living radical polymerizations are most commonly used in the
surface initiated polymerizations. Atom transfer radical polymerization (ATRP) is the
most common procedure among these methods for the controlled synthesis of polymers
on surfaces as it is applicable to different monomers and reaction media (aqueous or
organic). Another advantage of using ATRP is that the end of the polymer chains is
capped with an active functional group. Such groups can be used to form block
copolymer brushes by the addition of fresh catalyst and a new monomer.

24
For example, NIPAM was grafted onto mixed self-assembled monolayers
(SAMs) on gold by ATRP using a CuBr and Me4Cyclam (1,4,8,11-tetramethyl 1,4,8,11-
azacyclotetradecane) catalyst system at room temperature.82 The thermally induced
hydration transition of these PNIPAM brushes was then studied by surface plasmon
resonance spectroscopy (SPR) and contact angle measurements. SPR measurements
showed that the PNIPAM brush collapsed over a temperature range of ~10−40 °C. The
contact angle measurements, however, indicated a sharp wettability transition at a
temperature of ~32 °C with advancing water contact angles changing from ~65° to 78°.
The results showed that polymer segments in the outermost region of the brush remained
highly solvated until the solution lower critical solution temperature ( 32°), while
densely packed, less solvated segments within the brush layer underwent dehydration
and collapse over a broader range of temperatures.
PNIPAM brushes have also been prepared on quartz crystals by ATRP. The
PNIPAM grafted crystals were then used to determine the effect of salts on the volume
phase transition of thermoresponsive polymer brushes by using quartz crystal
microbalance with dissipation monitoring (QCM-D) analyses.83 Changes in mass and
viscoelasticity of PNIPAM brushes were measured as a function of temperature, upon
contact with NaCl solutions. The phase-transition temperatures of PNIPAM brushes
derived from QCM-D measurement were found to decrease as the concentrations of
NaCl increased. This observation paralleled the inverse relationship between the
concentration of salt and the LCST of PNIPAM in aqueous solution. However, in
contrast to the linear decrease in LCST upon increasing salt concentrations observed for

25
PNIPAM solutions, the trend in phase-transition temperature for PNIPAM brushes was
non-linear. Specifically, at low salt concentrations, the phase-transition temperature
decreased more rapidly and tended to level off at elevated concentrations. This
phenomenon was explained by the tendency of salt ions to affect the water structure
around PNIPAM chains.
Surface-initiated aqueous ATRP using PMDETA/CuCl and HMTETA/CuCl
catalysts has also been used to synthesize PNIPAM brushes on polystyrene latex
particles.84 First, functionalized anionic polystyrene latex particles with ATRP initiators
were synthesized by surfactant-free shell-growth emulsion polymerization of styrene and
2-(2'-chloropropionato)ethyl acrylate. NIPAM was then polymerized from these particles
by ATRP in water. The molecular weight of the PNIPAM chains, grafting density, and
hydrodynamic thickness of the grafted polymer layer were then measured. The Mn and
grafting density of the grafted PNIPAM chains increased with increases in the monomer
concentration and decreased with addition of copper (II) complex and external initiator.
Molecular weights from about 50 kDa to 800 kDa with low polydispersities (between
1.25 and 1.4), were achieved. A further polymerization of N,N-dimethylacrylamide onto
a PNIPAM-grafted latex established that the original PNIPAM chains were terminated
with a reactive end group. The hydrodynamic thickness (HT) values for PNIPAM
brushes were sensitive to temperature and salt concentration. The hydrodynamic
thickness of the brushes decreased from ~ 580 nm to 100 nm when the temperature was
increased from 22-36 °C suggesting a broad transition region. The HT values of
PNIPAM grafted PS particles were also measured in NaCl and Na2SO4 with varied salt

26
concentrations. The HT decreased with increases in salt concentrations in both cases.
Na2SO4 induced a HT transition at around 0.2 M while NaCl effects were only seen at ~
1.0 M. These results showed that effects of salts on the HT of PNIPAM brushes were
similar to the effects of those salts on the LCST of PNIPAM solution.
Nitroxide-mediated controlled polymerization (NMP) was also used by
Wolfgang et al. to grow PNIPAM directly from iron oxide nanoparticles. This lead to
the formation of magnetic iron oxide core/shell nanoparticles with a defined PNIPAM
shell around the nanoparticles (Scheme 7).85 In this chemistry, a 1,2-diol functionalized
NMP initiator was attached to the Fe2O3 nanoparticles by ligand exchange with an
octylamine stabilized Fe2O3 nanoparticle. The resulting nanoparticles (NP1) were then
used to initiate the controlled polymerization of NIPAM in DMF at 150 °C to form
Fe2O3 nanoparticles coated with a thermoresponsive organic shell (NP2).
Scheme 7. PNIPAM chains grow from Fe2O3 nanoparticles by surface-initiated nitroxide-meditated control polymerization.

27
Other polymerization techniques such as plasma polymerization,86 electron
beams irradiation,87 and electrochemically induced free-radical polymerization88 have
also been used to graft thermoresponsive polymers on surfaces. For example, PNIPAM
deposited onto silicon wafers and capillary glass tubes from a plasma glow discharge of
NIPAM both have a phase transition temperature of about 29 °C. Plasma polymerization
of NIPAM as described in this study is a one-step, solvent-free, vapor-phase coating
technique that can be applied to fabricate thermally responsive coatings on a variety of
biomaterials, avoiding the need for specially prepared substrates and functionalized
polymers.
Alternatively, chemical grafting can be achieved by allowing functionalized
surfaces to react with stimuli-responsive polymers that bear reactive group(s). This
method is also called ‘graft-to’ method since the polymer is premade before grafting it to
the surface. The advantage of this method is that the to-be-grafted polymer can be
characterized beforehand. The reactive groups can be incorporated into the polymers as
terminal groups, pendant groups or in the main chain of the polymer. Different chemical
reactions can be used for grafting. For example, Iwata et al. demonstrated the
preparation of ultrathin thermo-sensitive layers on substrate surfaces by allowing a
PNIPAM copolymer that contained < 2% isocyanate units to react with a hydroxyl-
functionalized gold surface (Scheme 8).89 Ye et al. synthesized PNIPAM protected CdS
quantum dot by using terminal thiolated PNIPAM to react with CaS particles directly.90
Thiol-terminated polymers have been frequently used in the ‘graft-to’ method because

28
such polymers with narrow molar mass could be conveniently prepared by RAFT
polymerization process followed by the reduction of the dithioester end groups.91
Scheme 8. The grafting of PNIPAM to a gold surface by allowing isocyanate containing PNIPAM copolymer to reacted with surface hydroxyl group.
Condensation reactions of nucleophiles and carbonyl derivatives that result in
stable bonds can also be used to graft functional polymers to the substrate surfaces.
Either the nucleophiles or the carbonyl derivatives can be incorporated into the to-be-
grafted polymers as terminal groups, in backbones, in pendant groups, or as side chains.
Such polyvalent polymers can be grafted to surfaces sequentially via a covalent layer-
by-layer (LbL) assembly method. Our group has successfully used this chemistry to graft
polyfunctional polymers to surfaces like silica nanoparticles, silicon wafers, metals,
polyethylene films, and multiwall carbon nanotubes.
This chemistry typically uses polyvalent electrophiles and nucleophiles to build a
polymer network on substrate surfaces. For example, commercially available
poly(maleic anhydride)-c-poly(methylvinyl ether) (Gantrez, 1) is a polyvalent
electrophile that can be used with nucleophilic amine-terminate generation five (G5)
poly(amidoamine) dendrimers (2) to form a polymer graft. By alternately treating the
activated surface with 1 or 2, ultrathin multilayer grafts were assembled successfully on
Au, Al, Si, or polyethylene. Furthermore, the amic acids generated during the grafting

29
process could be imidized by mild heating to form impermeable monolithic films. If a
hydrophobic octadecyl layer were attached as a top layer at the end of this covalent LbL
assembly, the imidized monolithic film could serve as a protective layer for a substrate
like Al. The passivation of Al against corrosion in alkaline solution or from pitting in
neutral chloride-containing solution was demonstrated.92
The experimental procedure for covalent LbL assembly of PEI (3)/Gantrez (1) on
oxidized PE substrates by this method is shown in Scheme 9. In this chemistry, the first
step is oxidation of the PE substrates with chromic acid to generate carboxylic acid
groups at the surfaces. The so formed carboxylic acid groups are subsequently activated
to form electrophilic mixed anhydride groups by treatment with ethyl chloroformate.
The nucleophilic polyvalent polymer, PEI, is then attached to the activated PE surface by
reaction with the anhydrides to form amide bonds. The newly formed surface is rich in
nucleophilic amine groups. Those groups are then allowed to react with electrophilic
Gantrez. Repetition of this amine-anhydride condensation reaction yields a surface graft
covered with a network of PEI and Gantrez.

30
Scheme 9. The grafting procedure of covalent LbL assembly of PEI/Gantrez on oxidized PE substrates.
The progress of this synthetic process on surfaces can be analyzed by ATR-IR
spectroscopy that shows the disappearance of a small carboxylic acid peak of oxidized
PE at 1710 cm-1 and the appearance of an amide peak at 1650 cm-1. The subsequent
treatment by Gantrez leads to the appearance of anhydride peaks at 1790 and 1730 cm-1.
The reaction of Gantrez and PEI and the presence of ammonium carboxylate groups can
be confirmed by observing the disappearance of anhydride peaks and the appearance of
amide and carboxylate peaks at 1650 and 1560 cm-1 respectively. Fluorescence analysis
can also be used to monitor surface growth by covalently tagging a small percentage of a
=NH
HN
N
H2N
NH2
NH2
=OO
O
H3CO
OHO
H3CO
ONH=
PEI
Gantrez
OEt
OEt
OEt

31
fluorophore, dansyl amine to the surface during the process when the surface is treated
with PEI. For example, a graft with six (PEI+ dansyl amine)/Gantrez bilayers were
assembled on oxidized PE and the fluorescence was measured after each of the bilayer
assembly. Except for the first bilayer assembly, the fluorescence analyses showed linear
fluorescence intensity increase between the second bilayer and the sixth bilayer
assembly.
This dansyl amine-tagged (PEI/Gantrez)6 graft was also alternately treated with
acid (1.0 M HCl) and base (1.0 M NaOH) to test the stability of such surface grafts
prepared by covalent LbL assembly method. These acid/base conditions are known to
lead to delamination of electrostatic assembled LbL grafts. The results showed that the
fluorescence intensity dropped significantly after acid treatment because protonation of
the tertiary amine group on the dansyl group diminished the fluorescence. However, the
fluorescence did not completely disappear suggesting that not all the dansyl groups
reacted with HCl. The fluorescence intensity increased to almost the original value after
subsequently treatment of NaOH due to the deprotonation of the tertiary amine salts. The
reversible changes in fluorescence intensity through repeated HCl/NaOH treatments
showed that this covalent surface graft was stable to such acid/base treatments.
This covalent LbL assembly method can also use functionalized inorganic
materials as a reagent. For example, we successfully prepared a nanocomposite thin film
on functionalized PE films by covalently assembling PEI functionalized multiwall
carbon nanotubes (MWNT-NH-PEI) (4) and Gantrez. The surface consisting of five
MWNT-NH-PEI/Gantrez bilayers was modified to be superhydrophobic by treating with

32
ethyl chloroformate and octadecanoic acid. The resulting octadecylated surface had a
water contact angle of 165° and a sliding angle of less than 5°. These surfaces also
exhibited a nanoscopic roughness based on AFM studies.
In this dissertation, the same covalent LbL self-assembly procedure has been
used to graft PNIPAM/SiO2 nanocomposites on either organic or inorganic surfaces. In
these syntheses, an active ester-containing PNIPAM copolymer 5 and aminated silica
nanoparticles 6 are used as polyvalent electrophiles and nucleophiles respectively. These
PNIPAM/SiO2 nanocomposite surfaces show significant solute-induced wettability
changes that depend on the solute identity and solute concentration. For example, a
(PNIPAM/SiO2)6/PNIPAM nanocomposite grafted PE film had an advancing contact
angle (θα) of 76° in water while in 1.0 M Na2SO4 the θα was 144°. In 1.2 M NaSCN, the
θα was 72°. These large differences in advancing contact angles enabled us to study the
effects of salts on the wettability of surfaces. This has included studies of both anions
and cations. Details of these results will be discussed separately in the later chapters.

33
CHAPTER II
THERMODYNAMIC CLOUD POINT ASSAYS*
Introduction
Cloud points and clouding behavior are widely used as visual probes of phase
separation in macromolecular systems.12,93 We and others have used measurements of
clouding to study lower critical solution temperature (LCST) behavior for a variety of
materials including polymers like poly(N-isopropylacrylamide) and poly(alkene
oxide)s.69,94 This work most commonly requires several milliliters of a solution and most
often the phase separation process is followed by observing changes in transmittance of
a sample using a visible spectrometer. Apparati that use smaller volumes (e.g., 20 µL of
sample) have also been described.95 More recently our analyses of these phenomena
were greatly facilitated by the application of a new microscale temperature gradient
apparatus developed by the Cremer group.29 This simple instrument setup has the
advantage of only requiring 10 µL of solution in a capillary tube and affords
significantly greater precision than prior assays that monitor transmittance changes. The
advantage of assaying as many as 6 or 7 samples at once without the delays associated
with waiting for an apparatus to heat from below the LCST to above the LCST make this
method a high throughput method for analysis of samples with LCSTs in the 20-50 °C
*Part of the data reported in this chapter is reprinted with permission from “Thermodynamic Clouding Assays” by D. E. Bergbreiter and H. Fu, J. Polym. Sci., Part A: Polym. Chem., 2007, 46, 186, Copyright [2007] by Wiley Periodicals, Inc., A Wiley Company.

34
range. Several other techniques have also been used to study such phase separation
processes. These include dynamic light scattering,96 differential scanning calorimetry,97
NMR spectroscopy,98-100 dynamic rheology,101 IR spectroscopy,102 solvatochromatic
effects,103 and fluorescence spectroscopy.104,105 Nonetheless, while all of these
techniques have been used from time to time, simple assays of clouding behavior remain
the most common approach to studying these sorts of phase separation processes that are
important in a variety of applications of thermally responsive polymers.68,106-112
Here we describe another approach to assay clouding behavior for polymer
solutions exhibiting LCST behavior. This microscale assay of LCSTs uses 10 µL or less
of a sample solution and a commercially available automated melting point apparatus to
measure and record LCST clouding curves at temperatures from ambient to over 250 °C.
Although this apparatus sacrifices some of the high throughput features of Cremer's
temperature gradient apparatus,113 it can still assay up to three samples at once at
temperatures that are defined by a calibrated instrument. As a bulk assay, it
advantageously monitors phase changes of these stimuli-responsive materials in a
fashion that exposes these materials to temperature changes like they would encounter in
typical applications. The apparatus uses samples that can be sealed in capillary melting
point tubes so samples can be easily saved and reanalyzed. Moreover, since the
instrument is computer controlled and automatically saves the experimental data to a
computer, it is experimentally practical to use different temperature rates to assay and
record the change in clouding behavior. This can reveal very complex sorts of phase
behavior. As discussed later, manipulation of the data also allows one to determine what

35
the clouding process would look like with an infinitely slow heating rate and to obtain a
corrected clouding temperature that is a more accurate thermodynamic measure of the
entire phase separation process. These assays use the same methodology used to
determine ‘corrected’ melting points in analysis of pharmaceuticals to obtain ‘corrected’
clouding curves.114
Melting Point Apparatus and LCS Measurements
An OptiMelt apparatus from Stanford Research Systems was used for analyses of
LCST in this study.114 This apparatus uses a digital image processor to detect the light
scattering that occurs as a sample changes from a scattering solid to a liquid. Since an
aqueous solution of PNIPAM during an LCST process exhibits analogous changes in its
optical characteristics, this same melting point apparatus can determine an LCST and a
clouding curve. Other features of this apparatus include linear temperature ramping and
accurate temperature readings with 0.1 °C resolution. In a typical experiment, 10 µL of a
polymer solution was introduced to a regular capillary melting point tube (Kimble 1.5-
1.8 X 90-mm) using a microsyringe and the tube was sealed before placing it into the
sample holder. Three sealed sample tubes were placed into the sample holders for
simultaneous measurements of their clouding curves at the desired heating rate. During
the heating process, the thermosensitive polymers underwent phase transitions that
changed the optical characteristics of the sample. The reproducibility of phase transition
behavior was monitored by carrying out a second clouding curve assay. The second
sample could be obtained either by removing the tube from the apparatus and letting the
polymer redissolve or by preparing a fresh sample. Repetition of the LCST measurement

36
the same day or after several days using the same heating rate gave curves that were
identical to the original curves. This is illustrated in the figures below. The digital image
processing on board the melting point apparatus analyzed the intensity changes and
produced a graph of the percent light scattering versus temperature. The resulting usually
sigmoidal curve of the extent of clouding versus temperature and the data for specific
scattering percentages were then used in our LCST studies. The supplied MeltView
software transferred and stored the real-time images of the samples to a computer during
the analysis. The software bundles all sample images together as a single package file
and the file can be recalled at anytime to play back the phase transition process frame-
by-frame or as a continuous movie. Such movies provide a visual record of the phase
changes and allow qualitative differentiation of the phase separation process in milieu as
similar as H2O, 50/50 (v/v) H2O/D2O, and in pure D2O (see supplementary material).
Studies of LCSTs by an Automatic Melting Point Apparatus
The utility of a digital melting point apparatus for the analysis of clouding curves
is illustrated by the results in Figure 1. This figure displays a series of raw data
measuring scattering of a 10 mg/mL sample of PNIPAM (Mw = 322 kDa, PDI = 1.06 by
GPC) in water as a function of heating rate as capillary tubes containing about 10 µL of
this aqueous polymer solution were heated from 30 to 34 °C. The analyses used heating
rates of 0.1, 0.2, 0.5, 1.0, 2.0, and 5.0 °C/min. Just as true in a melting point
determination, higher heating rates produce different clouding behavior with the curves
progressively moving to higher temperature as the heating rate increases.

37
Figure 1. Scattering curves showing the percentage of light scattered versus temperature for a 10 mg/mL solution of poly(N-isopropylacrylamide) in water as a function of heating rate: red color (0.1 °C/min); magenta color (0.2 °C/min); green color (0.5 °C/min); blue color (1.0 °C/min); pink color (2.0 °C/min); (○) (5.0 °C/min). The solid gray line is the ‘corrected’ clouding curve (see text).
The observation in Figure 1 that the observed LCST value depends on the
heating rate is not unexpected. Such effects are seen in most methods that assay a
polymer's LCST. As is true in melting point analyses, a ‘corrected’ clouding curve
would be one that would be measured at an infinitely low heating rate. That of course
poses an experimental problem akin to that faced in measuring specific viscosity for an
infinitely dilute polymer solution. We addressed this problem reasoning that the changes
in the observed clouding curve associated with varied heating rates could arise because
of the inefficiency of the heat transfer between the sample and the heating stand at least
in some cases. In analogy to the reasoning used to obtain corrected melting points,
‘corrected’ thermodynamic cloud point temperatures (LCSTactual) could be measured at
varying extents of clouding. Such data when plotted would then produce a ‘corrected’

38
cloud point curve which would correspond to the thermodynamic LCST clouding curve
that would be obtained at an infinitely slow heating rate. Such data and such a curve
should be calculable if the light scattering because of the phase transition is proportional
to the square root of the ramp rate as is the case in a melting point assay.
Using the same reasoning used to calculate a thermodynamic melting point,114
the amount of heat (dQ(t)) transferred from the block to the sample by a melting point
apparatus during an LCST analysis in a given time dt is given by eq 1.
dQ(t) = α (Tobsd – Tactual) dt (1)
This amount of heat depends on a constant α that reflects heat transfer properties of the
apparatus and sample, the time, and the temperature difference between the block and
the stand (Tobsd - Tactual). If the phase separation process acts like a first order phase
transition, the sample temperature will be essentially constant during the period the
block is being heated. The temperature ramping rate of the instrument r is equal to dT/dt,
so eq 1 can be rewritten as shown in eq 2.
dQ(t) = α (Tobsd – Tactual)(dT/r) (2)
Integration of this expression over the observed temperature range for the visible
clouding phase transition gives eq 3 where the integral term can be related to the
thermodynamics of the phase transition (the term designated ΔGLCST in eq 3).
ΔGLCST = thermo dLCSTobsdLCSTactual
(3)
ΔGLCST = (α/2r) · (LCSTobsd – LCSTactual)2 (4)
LCSTactual = LCSTobsd - (2ΔGLCST/α)1/2 r1/2 (5)

39
Solving this integral term then leads to eq 4 which can be rearranged to the form of a
linear equation (eq 5) where the difference in the clouding temperature that is correlated
with the LCST, LCSTobsd, and the LCSTactual will be directly related to the square root of
the temperature ramp rate with a slope that is determined by the thermodynamics for the
transition and the aforementioned constant that reflects the heat transfer properties of
the apparatus and sample.
Application of eq 5 to various points in a clouding transition for PNIPAM does
indeed show that there is a linear relationship between the square root of temperature
ramp rate and the LCSTobsd for various levels of clouding in several phase transitions
(Figure 2). When these linear correlations are extrapolated to the intercept on the
ordinate of the graph, they generated a set of data (LCSTactual) that are in effect cloud
point measurements at an infinitely slow heating rate - data that when plotted produce a
thermodynamic clouding curve. The representative LCSTactual values for the clouding
temperature studies of PNIPAM in H2O and D2O are listed in Table 2. The standard
errors for each of the LCSTactual values at 95% confidence are also listed in the same
table. As shown in Table 2, the standard errors for the LCSTactual are generally between
0.01-0.03 °C for 5-80% level of scattering. Compared to the clouding temperature ranges
of PNIPAM in either H2O or D2O (~ 1.5 °C), the uncertainty for the values of LCSTactual
resulted from this linear regression approach is less than 2% and should not affect the
outcome of the corrected clouding curve. This approach has thus been used to generate
the corrected clouding curves shown on Figures 1 and 2 (gray line) and in some of the
other figures in this chapter.

40
Figure 2. The temperature LCSTobsd for a particular scattering intensity plotted versus the square root of the heating rate, r1/2, at various scattering intensities for a sample of 10 mg/mL of PNIPAM in water. The lines shown for a linear regression analysis for these data at the various percentages of clouding lead to extrapolated LCST values for a particular percentage of clouding or light scattering (•) that would in principle be obtained with an infinitely small heating rate. A resulting ‘clouding curve’ generated based on these extrapolated points is shown in Figure 1 above.
In the correlations shown in Figure 2, good linear correlations were observed for
1-80% levels of scattering. The values of the best fitted slopes and the standard errors of
each slopes obtained from the linear regression analyses for a series of scattering
intensity are listed in Table 3. The slopes are consistent with an endothermic phase
transition. There are about 5-10 % uncertainty for the values of the best fitted slopes
between 5 -80 % scattering intensity as seen in Table 3. It is somehow difficult to assess
how parallel these linear regression lines are. But as the values of each of the best fitted
slopes are in a close range, we can still use the average values of the slopes to estimate
the solvent isotope effect for PNIPAM’s phase transition process as described later. The

41
correlation works well for levels of scattering (clouding) below 90% and for ramp rates
below 5 °C/min. Linear plots of scattering > 90% versus r1/2 in our experience had larger
errors and were usually not used in determining the slope of the correlation. The
clouding curves for ramp rate larger than 5 °C/min had too few data points to be
included in these linear plots.
Table 2. LCSTactual Obtained from the Linear Regression Analyses of LCSTobsd Versus r1/2 at Various Levels of Scattering in the Cloud Point Curves for PNIPAM in H2O or D2O.
PNIPAM in H2O PNIPAM in D2O Scattering
(%) LCSTactual
(°C) Standard
error Scattering
(%) LCSTactual
(°C) Standard
error
1 31.43 0.033 2 32.41 0.022 5 31.66 0.015 9 32.64 0.025 10 31.75 0.021 21 32.78 0.016 17 31.85 0.025 41 32.94 0.016 26 31.96 0.014 60 33.09 0.018 37 32.04 0.019 78 33.27 0.022 49 32.12 0.023 89 33.44 0.015 60 32.19 0.026 70 32.29 0.023 80 32.40 0.030 90 32.60 0.054

42
Table 3. Slopes for Plots of LCSTobsd Versus r1/2 at Various Levels of Scattering in the Cloud Point Curves for PNIPAM in H2O or D2O.
PNIPAM in H2O PNIPAM in D2O Scattering
(%) Slope Standard
error Scattering
(%) Slope Standard
error
1 0.310 0.038 2 0.378 0.025 5 0.298 0.017 9 0.351 0.028 10 0.313 0.024 21 0.365 0.019 17 0.297 0.029 41 0.366 0.018 26 0.280 0.016 60 0.358 0.021 37 0.296 0.022 78 0.335 0.025 49 0.302 0.026 89 0.312 0.017 60 0.322 0.041 70 0.309 0.033 80 0.308 0.031 90 0.29 0.062
Average 0.302 0.352 This new procedure for assay of cloud points has quite high precision. This is
illustrated by the very modest scatter in the data in Figure 1 for the individual points in
the 0.1 and 0.2 °C/min heating rate clouding curves shown. These assays are also
sensitive enough to probe the same sort of subtle effects of solution components on
PNIPAM LCSTs that we have probed previously using a temperature gradient apparatus.
Figure 3 illustrates this for PNIPAM in H2O, 50/50 (v/v) H2O/D2O, and pure D2O at
ramp rates of 0.1 °C/min. Comparison of the results for the three solvent mixtures shows
that the solvent isotope effects on the LCST of PNIPAM are nearly linearly dependent
on the mole fraction of deuterated solvent as we noted earlier. However, while the earlier
analyses only compared the onset of the LCST process to show a roughly linear
dependence of the LCST with the mole percent D2O, the results obtained in this new

43
procedure show that solvent isotope composition effects on LCSTs are essentially the
same for all points on the clouding curve. Figure 3 also includes both a corrected LCST
curve obtained for PNIPAM in pure H2O and pure D2O, showing that in D2O as in H2O
that there only a modest difference between the 0.1 °C/min curve and the ‘corrected’
curve.
Figure 3. Scattering curves showing clouding of a 10 mg/mL solution of PNIPAM in mixtures of H2O and D2O measured at a heating ramp rate of 0.1 °C/min: (a) pure H2O (lowest temperature curve); (b) 50/50 (v/v) H2O/D2O (intermediate temperature curve); (c) pure D2O (highest temperature curve). The gray lines for the lowest and the highest temperature clouding curve are the ‘corrected’ clouding curves for H2O and D2O, respectively with the points showing the calculated LCSTactual at various scattering values.
The plots of LCSTobsd versus r1/2 measured in the D2O case can be compared
with similar plots measured in H2O to determine the solvent isotope effect. This
comparison shows that the slope, (ΔGLCST/α)1/2, is greater in D2O than in H2O as would
Temperature (οC)31.5 32.0 32.5 33.0 33.5 34.0
Sca
tterin
g In
tens
ity (%
)
0
20
40
60
80
100
120
a b c

44
be expected since the reported LCST of PNIPAM is higher in D2O than H2O. The
difference in the LCSTD2O versus the LCSTH2O in the present work is about 1 °C over
most of the clouding curve. Our earlier work had estimated this difference to be 0.7 °C.30
The Winnik group observed a difference of about 2 °C in measurements based on
pressure perturbation calorimetry.115 The Winnik group also determined the difference in
heat capacity for the LCST process in D2O versus H2O and found that the Δcp(D2O) was
twice as large as the Δcp(H2O). In our case we can also calculate a solvent isotope effect
for the LCST process. The slopes of the curves that correlate the LCSTactual with the
LCSTobsd in the H2O and D2O experiments are equal to the ratio of a thermodynamic
term for the LCST process and a term for the heat constant for the apparatus and sample
that will cancel out when the slope in H2O correlations of LCST with r1/2 is divided by
the slope measured in D2O experiments. Thus, we can use our data to calculate a
composite solvent isotope effect on the ratio ΔGD2O/ΔGH2Ofor the PNIPAM phase
separation in H2O versus D2O. This value is 1.36 and is similar to the twofold difference
in Δcp previously noted by the Winnik group.115
While PNIPAM has a higher LCST in D2O versus H2O, the effect of isotopic
substitution in the solvent on LCSTs can vary. The use of a melting point apparatus to
determine LCSTs in such cases has the advantage of being useful over a broad
temperature range. Moreover sealed samples can be used. Thus we were able to study
the effect of D2O versus H2O on the LCST of a poly(ethylene oxide) (PEO). Using a
PEO sample with an average molecular weight of 300 kDa the onset of the LCSTH2O was
about 99 °C. The onset of the LCSTD2O for this same sample was about 94 °C. Thus,

45
PEG's LCST has a solvent isotope effect that is opposite with that of PNIPAM (Figure
4a). The solvent isotope effect for a triblock poly(alkene oxide) polymer Pluronic® 10R5
(7) was also analyzed. This polymer too had a lower LCST in D2O than H2O (Figure
4b).
Temperature (οC)60 70 80 90 100
Sca
tterin
g In
tens
ity (%
)
0.0
0.2
0.4
0.6
0.8
1.0
H2O 50/50 H2O/D2OD2O
b
Figure 4. Scattering curves showing clouding of a) a 1 wt % solution of PEO (300 kDa) in mixtures of H2O and D2O and b) a 1 wt % solution of Pluronic® 10R5 (7) in mixtures of H2O and D2O. All the clouding curves were obtained at a heating ramp rate of 2 °C/min.
The concentration of sample necessary to measure cloud points with this
automated melting point apparatus varied depending on the sample. Although most of
the analyses in the case of PNIPAM used 10 mg of PNIPAM/mL of solution, we were
able to analyze cloud point curves for PNIPAM samples with as little as 1 mg of
PNIPAM/mL of solution. As the concentration of polymer in solution decreased, the
precision of the analyses decreased because the scatter intensity of the sample decreased.
Temperature (οC)95 100 105 110
Sca
tterin
g In
tens
ity (%
)
0.0
0.2
0.4
0.6
0.8
1.0
H2O50/50 H2O/D2OD2O
a

46
However, ‘corrected’ clouding curves could still be obtained even with the 1 mg of
PNIPAM/mL sample. The data obtained using our apparatus were compared with data
obtained from clouding curves measured using Cremer's temperature gradient apparatus.
The two clouding curves are shown in Figure 5 and are nearly identical.
The Hofmeister effect of salts on phase separation and solvation phenomena is an
effect that is ubiquitous in many solutions or suspensions of synthetic and biological
macromolecules. As expected, addition of NaCl to PNIPAM lowered the phase
transition temperature and LCST process. Just as was true in pure water, the clouding
curve depends on the heating rate of the analyses in a regular fashion. We were also able
to calculate a corrected clouding curve in this system (Figure 6) for PNIPAM in the
presence of 0.4 N NaCl. Thus the same procedures used above to determine a clouding
curve at an infinitely slow heating rate in pure H2O and D2O can be used successfully
with salt solutions too.
Temperature (οC)31.5 32.0 32.5 33.0 33.5
Scat
terin
g In
tens
ity
(arb
itrar
y un
its)
0.0
0.2
0.4
0.6
0.8
1.0
1.2
Figure 5. Scattering curves showing clouding of a 10 mg/mL solution of poly(N-isopropylacrylamide) measured by the OptiMelt melting point apparatus at a heating ramp rate of 0.1 °C/min (solid Line) and by the temperature gradient apparatus (dotted line).
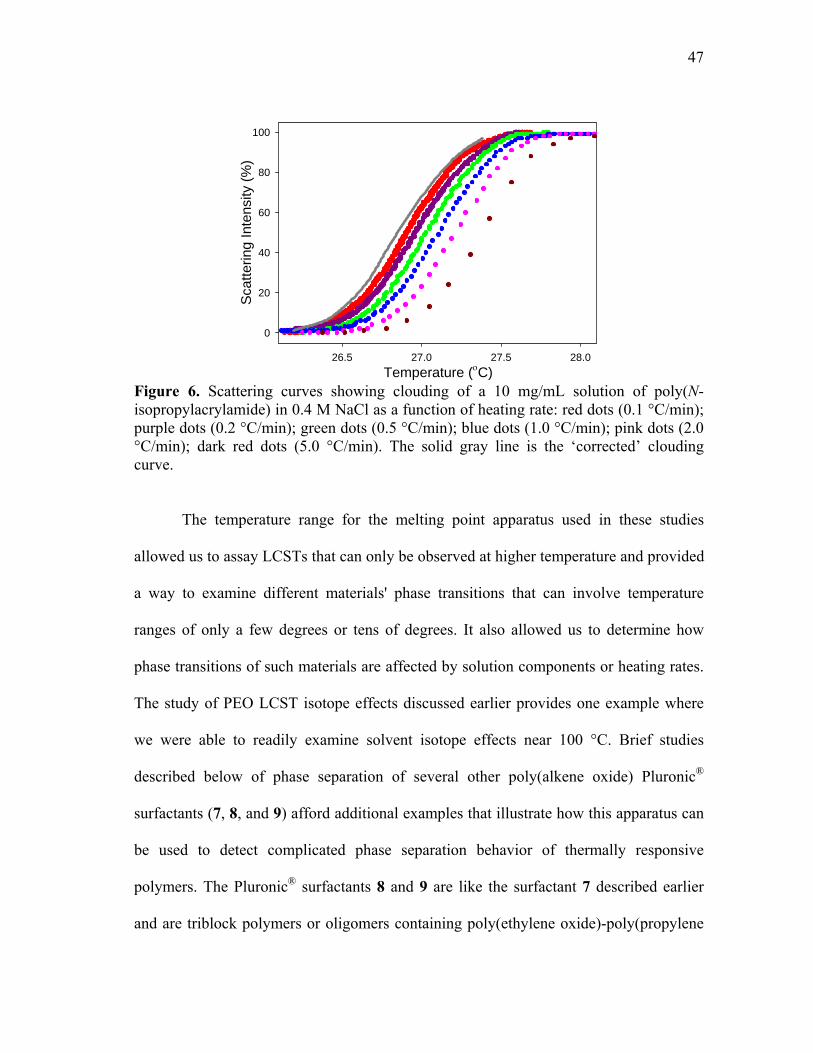
47
Temperature (οC)26.5 27.0 27.5 28.0
Scat
terin
g In
tens
ity (%
)
0
20
40
60
80
100
Figure 6. Scattering curves showing clouding of a 10 mg/mL solution of poly(N-isopropylacrylamide) in 0.4 M NaCl as a function of heating rate: red dots (0.1 °C/min); purple dots (0.2 °C/min); green dots (0.5 °C/min); blue dots (1.0 °C/min); pink dots (2.0 °C/min); dark red dots (5.0 °C/min). The solid gray line is the ‘corrected’ clouding curve.
The temperature range for the melting point apparatus used in these studies
allowed us to assay LCSTs that can only be observed at higher temperature and provided
a way to examine different materials' phase transitions that can involve temperature
ranges of only a few degrees or tens of degrees. It also allowed us to determine how
phase transitions of such materials are affected by solution components or heating rates.
The study of PEO LCST isotope effects discussed earlier provides one example where
we were able to readily examine solvent isotope effects near 100 °C. Brief studies
described below of phase separation of several other poly(alkene oxide) Pluronic®
surfactants (7, 8, and 9) afford additional examples that illustrate how this apparatus can
be used to detect complicated phase separation behavior of thermally responsive
polymers. The Pluronic® surfactants 8 and 9 are like the surfactant 7 described earlier
and are triblock polymers or oligomers containing poly(ethylene oxide)-poly(propylene

48
oxide)-poly(ethylene oxide) blocks where the length of the hydrophilic poly (ethylene
oxide) and hydrophobic poly(propylene oxide) blocks varies. They differ from 7 also in
that they are terminated by primary hydroxyl groups.
HOO O O
Hn m n
8 (n = 17, M = 60) Pluronic P1039 (n = 27, M = 61) Pluronic P104
The complicated phase transition behaviors that can be seen with these Pluronic®
materials are illustrated by the clouding curves in Figures 7 and 8. Figure 7 illustrates
this with studies that assay the phase behavior of a 1 wt % solution of Pluronic® 10R5
(7) in water in the presence of Na2SO4 - a kosmotropic salt known to affect LCSTs and
phase transitions. In these examples, assays of a 1 wt % aqueous solution of 7 in various
Na2SO4 concentrations were carried out using a 2 °C/min heating rate. As would be
expected, these experiments yielded a series of clouding curves which progressively
moved to the lower temperature with increasing salt concentration. This is consistent
with the Hofmeister effect. However, while the onset of the phase separation
consistently moves to lower and lower temperatures, irregular clouding behavior was
seen at higher salt concentrations. At these higher salt concentrations, 7 clouded
normally in the 30-40 °C range but exhibited complex solubility behavior on heating
further above 50 °C. Assays of LCSTs that depend solely on measuring the initial
clouding temperature do not detect these more complicated phase behaviors. Such
effects are a result of both the presence of the salt and are altered by the heating rate. For
example, in this case, lower heating rates of 0.1 °C/min led to the formation of a

49
liquid/liquid biphasic system where the clouding and the resultant light scattering does
not uniformly increase as the temperature is increased. Clouding curves observed for 7
in the presence of different concentrations of NaCl likewise shifted to lower
temperatures as the NaCl concentration was increased (Figure 8). In these cases too, 7
exhibited complex clouding behaviors at high NaCl concentration (above 2.14 M NaCl)
at higher temperature after an initial phase separation event.
Together with Cremer’s group, we had studied the anion effects on the LCST of
PNIPAM by using the temperature gradient apparatus and the results showed that the
anion effects followed the Hofmeister series. Figure 7 and 8 show that additions of
Na2SO4 or NaCl progressively shift the clouding curves of Pluronic® 10R5 (7) to lower
temperature with increasing salt concentrations and Na2SO4 has larger effect on lowing
the clouding temperature than NaCl. These observations promoted us to study the effects
of other sodium salts on the LCST of 7 using this melting point apparatus to see if the
Hofmeister effects are also applied on the LCST of this triblock copolymer. The results
are presented in Figure 9 and the effects of salts follow the Hofmeister series in a order
of citrate3- > SO42- > H2PO4- > Cl- > Br- >> SCN-. The chaotropic NaSCN shows distinct
‘salting-in’ effect and addition of NaSCN increased the LCST of 7 about 10 °C even at
concentration of 3 M.

50
Figure 7. Scattering curves showing clouding of a 1 wt % solution of 7 (Pluronic® 10R5) in water in the presence of various concentrations of Na2SO4. The plots from right to left have the following concentrations: ( - ) 0.033 M; (---) 0.067 M; ( - ) 0.133 M; (---) 0.200 M; ( - ) 0.267 M; (---) 0.333 M; ( - ) 0.476 M; and (---) 0.714 M. These analyses were carried out at a heating rate of 2°C/min. A clouding curve of this polymeric surfactant in the absence of Na2SO4 is indistinguishable from the curve for the 0.033 M Na2SO4 solution.
Figure 8. Scattering curves showing clouding of a 1 wt % solution of 7 (Pluronic® 10R5) in water in the presence of various concentrations of NaCl. The plots from right to left have the following concentrations: ( - ) 0.1 M; (---) 0.2 M; ( - ) 0.4 M; (---) 0.6 M; ( - ) 0.8 M; (---) 1.0 M; ( - ) 1.43 M; (---) 2.14 M; and ( - ) 2.86 M These analyses were carried out at a heating rate of 2°C/min. A clouding curve of this polymeric surfactant in the absence of NaCl is indistinguishable from the curve for the 0.1 M NaCl solution.
Temperature (οC)40 60 80 100
Sca
tterin
g In
tens
ity (%
)
0.0
0.2
0.4
0.6
0.8
1.0
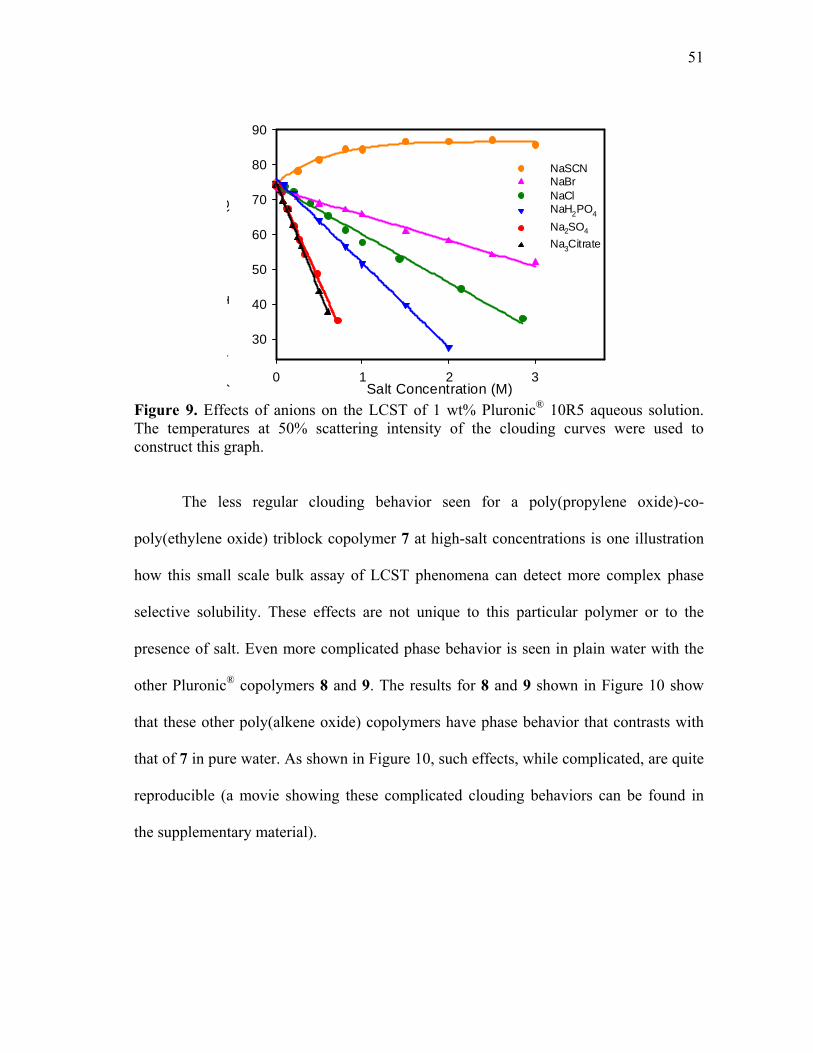
51
Figure 9. Effects of anions on the LCST of 1 wt% Pluronic® 10R5 aqueous solution. The temperatures at 50% scattering intensity of the clouding curves were used to construct this graph.
The less regular clouding behavior seen for a poly(propylene oxide)-co-
poly(ethylene oxide) triblock copolymer 7 at high-salt concentrations is one illustration
how this small scale bulk assay of LCST phenomena can detect more complex phase
selective solubility. These effects are not unique to this particular polymer or to the
presence of salt. Even more complicated phase behavior is seen in plain water with the
other Pluronic® copolymers 8 and 9. The results for 8 and 9 shown in Figure 10 show
that these other poly(alkene oxide) copolymers have phase behavior that contrasts with
that of 7 in pure water. As shown in Figure 10, such effects, while complicated, are quite
reproducible (a movie showing these complicated clouding behaviors can be found in
the supplementary material).
Salt Concentration (M)0 1 2 3
Tt
(C
)
30
40
50
60
70
80
90
NaSCN NaBr NaCl NaH2PO4 Na2SO4
Na3Citrate

52
Figure 10. Scattering curves showing clouding of three different Pluronic® copolymer surfactants in water (1 wt %) at 2 °C/min: (a) 7 (initial clouding at 63 °C); (b) 8 (initial clouding at 76 °C); and (c) 9 (initial clouding at 83 °C). The reproducibility of these complex clouding curves was measured by analysis of a freshly prepared second sample. A repetition of the initial experiment (a second clouding curve measured for each of the three samples) is shown for the sake of clarity as a gray dashed line that is offset from the corresponding original curve by 3 °C. Conclusion
The results shown above show the broad utility of a simple digital melting point
apparatus for analysis of phase separations that generate clouding curves. In cases where
the clouding simply shifts as a function of the heating rate of the analysis, it is possible
to use the data from these analyses to generate ‘corrected’ clouding point curves that
approximate the phase separation at an infinitely slow heating rate. The temperature
range of the apparatus also allows for analyses at much higher temperatures and provides
a simple way to examine irregular clouding behavior in more complex systems.

53
CHAPTER III
DESIGNING SURFACES WITH WETTABILITY THAT VARIED IN
RESPONSE TO SOLUTE IDENTITY AND CONCENTRATION*
Introduction
‘Smart’ surfaces116,117 that respond to external stimuli such as pH, temperature, or
solvent are of interest in many applications. Surfaces with stimuli-responsive wetting
properties have been used in applications such as self-cleaning coatings, microfluidics
devices, and cell culture dishes. Surfaces grafted with thermoresponsive polymers such
as poly(N-isopropylacrylamide) (PNIPAM) can exhibit tunable wettability changes upon
changing temperature and pH value.92,118-120 These wettability changes derive from the
fact that at their lower critical solution temperature (LCST), thermoresponsive polymers
like PNIPAM undergo phase transition leading the polymer chains to change from a
hydrophilic coil conformation to a hydrophobic globular conformation. When these
polymers are grafted on textured substrates, large wettability changes can be obtained by
changing temperature and pH value.121,122 Similar responsive behavior can also been
seen with polyelectrolytes which change solubility depending on the protonation state of
pendant acidic or basic groups. Just as PNIPAM grafts can change wettability with
temperature changes, polyelectrolyte grafts too can have pH responsive wettability.
*Part of the data reported in this chapter is reprinted with permission from “Designing
Surfaces with Wettability That Varies in Response to Solute Identity and Concentration ” by K. Liao, H. Fu, A. Wan, J. D. Batteas and D. E. Bergbreiter, Langmuir, 2009, 25, 26-28, Copyright [2008] by American Chemical Society.

54
However, while responsive surfaces that exhibit changes in surface wetting due to
temperature and pH changes are known, surfaces that change their wetting behavior
without undergoing a chemical reaction solely in response to the solute identity in a
given solvent or to varied concentrations of the same solute have not been reported.
While solute or salt induced changes in surface wettability are not known, the
effects of salts on the solubility of polymers like PNIPAM are well known. Indeed,
Hofmeister effects of salts on the LCSTs of thermoresponsive polymers such as
PNIPAM have been extensively studied both by our group and others.31,32,48,123 Given
the sharp and visually obvious phase transitions seen for PNIPAM at its LCST and the
varied effects of salts on this LCST value, we envisioned that PNIPAM-grafted surfaces
with proper constructed nanostructure could exhibit significant Hofmeister-like anion-
responsive wetting properties. In this chapter, we describe PNIPAM nanocomposite
grafts prepared by covalent layer-by-layer assembly that exhibit striking changes in
surface wetting in response to changes in solute identity or concentration, changes in
wetting that follow a Hofmeister series.
We prepared these responsive nanocomposite surfaces by covalent layer-by-layer
grafting chemistry. These syntheses drew inspiration from our prior work on the
assembly of superhydrophobic surfaces.124,125 In that work, we had shown first that
condensation of an electrophilic anhydride-containing polymer with polyvalent
nucleophilic polymers or aminated MWNTs (multiwall carbon nanotubes) led to
covalent grafts that exhibited significant pH-responsive wettability. We had also shown
that nanocomposite grafts formed with polydisperse MWNTs were topologically

55
complex and that these grafts when chemically modified could be either
superhydrophobic or superhydrophilic depending on whether the grafts were modified
with hydrophobic or hydrophilic reagents.126 We reasoned that similar nanocomposite
grafts whose hydrophobic or hydrophilic character changes in response to solute
concentration could also be prepared without chemical derivatization if they were
prepared with a responsive polymer. This proved to be the case, and we saw responsive
solute dependent wettability for grafts formed by covalent layer-by-layer assembly of a
copolymer of NIPAM and N-acryloxysuccinimide (NASI) (PNIPAM-c-PNASI) with an
aminated silica nanoparticle mixture. Silica nanoparticles are used in this synthesis as
building blocks to create a desired nanoscale roughness on the surfaces.
Preparing the Solute-responsive PE/(PNIPAM/SiO2)6/PNIPAM Nanocomposite
Surfaces by Covalent Layer-by-layer Self-assembly Method
Our synthesis of these responsive nanocomposite grafts involved assembling a
covalent graft using the copolymer of PNIPAM-c-PNASI (Mn = 30,000 Da) and an
admixture of aminated 10 and 100 nm fused silica particles as polyvalent electrophilic
and nucleophilic reagents, respectively. The assembly process is illustrated in Scheme
10. In the first step of this process, the NASI groups in the PNIPAM-c-PNASI
copolymer are allowed to react with the amine groups of an aminated surface derived
from the reaction of an activated, oxidized polyethylene with polyethyleneimine (PEI).
This leads to covalent binding of PNIPAM-c-PNASI copolymer to this surface via
amide bonds. However, spatial constraints preclude complete consumption of all of the
NASI groups of PNIPAM-c-PNASI. This results in a surface having unreacted

56
electrophilic NASI groups that can react with amine groups of amine-functionalized 10
and 100 nm diameter silica nanoparticles in a second step. As shown in Scheme 10, this
second step produces a nucleophilic amine-rich surface. While this surface could be used
as is for further grafting, we treated this surface with excess i-PrNH2. This quantitatively
converts any unreacted NASI groups into NIPAM groups. The covalent layer-by-layer
assembly then continues with further stages of PNIPAM-c-PNASI/10 and 100 nm
aminated silica nanoparticle/i-PrNH2 treatments.
Scheme 10. Covalent layer-by-layer assembly of a (PNIPAM/SiO2)n/PNIPAM nanocomposite graft on a PEI modified PE film. The final structure is not drawn to scale.

57
At the sixth stage, a similar procedure is carried on except that this time, only the
10 nm aminated silica nanoparticles are used instead of using the mixture of 10 an 100
nm aminated silica nanoparticles. Once the sixth stage is assembled, the surface is
capped with PNIPAM-c-PNASI. A final treatment with excess i-PrNH2 ensures that the
outmost layer of this graft is covered with PNIPAM. We denote this nanocomposite
surface as PE/(PNIPAM/SiO2)6/PNIPAM.
This PE/(PNIPAM/SiO2)6/PNIPAM nanocomposite surface contains
carboxamides based on the observation of absorption peaks at 1670 and 1640 cm−1 in the
attenuated total reflection infrared (ATR-IR) spectrum (Figure 11). In addition, a large
Si-O absorption peak at around 1100 cm−1 is seen in Figure 11 for the silica
nanoparticles. The absorption intensity of both the carboxamide and Si-O peaks relative
to the C-H absorption peaks at ~2900 cm-1 increases as the numbers of deposition
bilayers increase. This surface was further characterized by atomic force microscopy
(AFM) (Figure 12) and it had an average surface roughness of ~ 287 nm in air based on
analysis of a random series of 2.5 μm × 2.5 μm regions. The 100 nm nanoparticles are
discernable at the surface of the film and define the local surface roughness. These
PE/(PNIPAM/SiO2)6/PNIPAM nanocomposite surfaces combine the property of
responsive polymer and surface roughness. The surface roughness is expected to
enhance the responsiveness of the surface leading large changes in surface wettability
upon the changing of external stimuli, in our case, the changing of salt concentrations or
salt identity.

Figsur
Figassof ~ Stu
pre
gure 11. ATrfaces with (b
gure 12. Tsembled PE/~ 287 nm.
udies of the
The ch
epared PE/(P
R-IR spectrab) n=2; (c)=
Tapping mod(PNIPAM/S
Solute-resp
hanges in w
PNIPAM/SiO
a of (a) oxid=4; (d)=6.
de AFM toSiO2)6/PNIPA
ponsive Wet
wettability as
O2)6/PNIPAM
dized PE and
opographic AM nanocom
ttability
s a function
M nanocomp
d PE/(PNIPA
image of mposite surf
of solute io
posite surfac
AM/SiO2)n /P
a covalent face with an
on and conc
ce are illustr
PNIPAM
layer-by-layrms roughn
centration on
rated in Figu
58
yer ess
n a
ures

13
min
dis
PE
hyd
ind
giv
sol
in w
larg
doz
exa
Figa Pof c
and 14. In th
nutes on th
stinctly diffe
E/(PNIPAM/
drophobic de
duced wettab
ven solute w
lutions of a s
wettability f
ge, they are
zens of diff
amination w
gure 13. StaPE/(PNIPAMcorrespondin
hese figures
he same P
ferent static
SiO2)6/PNIP
epending on
bility change
with significa
solute such a
for this PE/(P
e also revers
ferent solute
with water.
atic contact aM/SiO2)6/PNng solutions
, drops of w
PE/(PNIPAM
contact an
PAM nanoco
n the identity
es are also
ant differenc
as sodium ci
PNIPAM/Si
sible and rep
solutions b
angles for vaNIPAM nano
was placed
ater or salt s
M/SiO2)6/PN
ngles (Θ).
omposite sur
y of the solut
found to be
ces in conta
itrate (Figure
O2)6/PNIPA
producible. T
but still has
arious sodiumcomposite son this surfa
solutions tha
NIPAM nano
As shown
rface is rever
te in the wat
e sensitive to
act angle (Θ
e 14). These
AM nanocom
The same su
similar wet
m salt solutiurface 3 minace.
at are allowed
ocomposite
in Figure
rsibly either
er. Moreove
o the conce
Θ) for even
e visually app
mposite surfa
urface can b
ttability on
ions at 1.2 Mnutes after a
d to stand fo
surface ha
13, the sa
hydrophilic
er, these solu
ntration of t
dilute aqueo
parent chang
ace are not on
be treated w
subsequent
M measured a 10 µL drop
59
or 3
ave
me
c or
ute-
the
ous
ges
nly
with
re-
on plet

60
Figure 14. Static contact angles for sodium citrate aqueous solutions with varied concentrations on the same PE/(PNIPAM/SiO2)6/PNIPAM nanocomposite surface 3 minutes after a 10 µL droplet of corresponding solutions was placed on this surface.
While the visually different wettabilities in Figures 13 and 14 illustrate the
responsiveness of this PE/(PNIPAM/SiO2)6/PNIPAM nanocomposite surface, these
static contact angles are time dependent. Figure 15 shows how static contact angle
changes with time when droplets of a series Na2SO4 solutions with different
concentrations are placed on a PE/(PNIPAM/SiO2)6/PNIPAM nanocomposite surface.
Such changes are expected to be dependent not only on time as shown here but on other
factors like ambient temperature or relative humidity. In Figure 15, the Θ values
decrease sharply for all solutions at the first 20 seconds which are largely due to the
surface reorganization. Later, the Θ values decrease more slowly with time and the
changes in Θ after the first 60 seconds are due in part to evaporation of the water drops
at the surface. Advancing contact angle (Θa) measures the largest contact angle possible
without increasing a sessile drop’s solid/liquid interfacial area by adding volume of
liquid dynamically. The Θa value is a property of the measured surface and does not
change with time. Thus, to avoid any time dependent or experimentally dependent
changes in contact angle, wettability is discussed using measurements of advancing
contact angle for the various solute ions throughout the rest of this chapter.

Figcona fu
cha
Na
wa
sol
PE
ΔΘ
nan
we
of
gure 15. Sncentrations
function of ti
Most i
anges. With
a2SO4 (a Hof
ater versus 1
lutions on gl
EI/Gantrez gr
Θa values of
The lar
nocomposite
ettability cha
several sodi
Static contacon a PE/(PN
me.
nterestingly
pure water,
fmeister kos
.4 M Na2SO
ass grafted w
raft on PE t
14°, 0°, 8°, a
rge solute re
e surfaces
anges with so
ium salt solu
ct angles oNIPAM/SiO
, this surfa
, the advanc
motrope) th
O4 (ΔΘa) was
with PNIPAM
that was gra
and 25°, resp
esponsive w
allowed us
olute anions
utions with v
of a series O2)6/PNIPAM
ace exhibited
cing contact
he Θa was 14
s much large
M brushes, u
afted with P
pectively.
wettability of
to examin
s. We measu
varied conce
of Na2SOM nanocomp
d large sol
angle Θa w
44°. This 68°
er than the Δ
unfunctional
PNIPAM. T
f these PE/(
ne the conc
ured the adva
entrations an
4 solution posite surfac
ute depende
was 76°, whi
° difference
ΔΘa seen us
lized PE, ox
hose surface
(PNIPAM/Si
centration d
ancing water
nd the result
with differce measured
ent wettabil
ile with 1.4
in Θa betwe
ing these sam
xidized PE, o
es had smal
iO2)6/PNIPA
dependence
r contact an
ts are shown
61
rent d as
lity
M
een
me
or a
ller
AM
of
gle
n in

62
Figure 16. For the kosmotropic anions, the results generally show a gradual increase in
Θa values with increased salt concentration until a certain critical concentration of salt is
reached. This is illustrated by the results for sodium citrate, Na2SO4, NaH2PO4, and
NaCl, where the increase in Θa with increased salt concentration exhibited sigmoidal
behavior with inflection points that varied from around 0.6 M (sodium citrate) to 1.2 M
(NaCl). In the case of chaotropic anions such as thiocyanate, salting-in behavior similar
to that seen in the LCST behavior of PNIPAM, hydroxymethylcellulose,40 and other
macromolecules occurred. Salt-enhanced wetting is also seen for NaI, though the
changes in Θa in this case are close to the error in contact angle measurements. All these
surfaces had Θr values of <10°.
Salt Concentration (M)0 1 2 3 4
Adv
anci
ng C
onta
ct A
ngle
(deg
)
60
80
100
120
140
160Na3Citrate Na2SO4 NaH2PO4NaCl NaBrNaClO4NaINaSCN
Figure 16. Changes in advancing contact angle (Θa) of a PE/PNIPAM/SiO2)6/PNIPAM nanocomposite surface measured with solutions of various salts as a function of salt concentration. Each data point is the average of three individual measurements and has an error of ±2°.

63
Atomic Force Microscopy Studies
The AFM Studies of the PE/(PNIPAM/SiO2)6/PNIPAM nanocomposite surfaces
were done by Mr. Albert Wan from Batteas’s group. The results from AFM
measurements show visible changes in surface texture when changing from one solute to
the next (Figure 17). In air, the surfaces are rough and the larger silica particles (ca. 100
nm) dominate the surface morphology. Upon immersion in water, the film swells and the
surface roughness decreases from ~287 nm rms to ~170 nm rms. Replacement of water
by 1.4 M Na2SO4 results in an increase in roughness (ca. 232 nm rms) along with the
ΔΘa of 68°. In 1.2 M NaSCN, the surface roughness decreased to ~145 nm rms and the
Θa changed to 72° (ΔΘa of −4°). These changes show that these surfaces reconstruct in
response to different solutes and suggest that the changes in water contact angle are
likely due to a combination of changes in surface roughness induced by solute dependent
swelling or chain collapse that alters the hydrophobicity of the PNIPAM. Hence, the
swelling of the polymer on the textured surface follows the expected Hofmeister series
which predictably alters the surface roughness and the associated wetting and dewetting
of the surface.
The wettability changes and hydration changes seen in AFM are reversible.
When a film prepared as shown in Scheme 10 had its Θa analyzed using 1.4 M Na2SO4,
the Θa value was 144°. Washing this film with distilled water and tetrahydrofuran
(THF), drying, and reanalysis showed it had a Θa of 76° with water, the same Θa as it
had before it was ever exposed to Na2SO4. After a month of treatment with various salt
solutions, surfaces did exhibit minor changes. After 100 cycles using various salt

64
solutions, THF, and water, the ΔΘa values (1.4 M Na2SO4 versus H2O) gradually
decreased from 68° to 50° though the trends of Figure 15 were still seen.
Figure 17. Tapping mode AFM images of PE/(PNIPAM/SiO2)6/PNIPAM obtained in (a) air, (b) water, (c) 1.4 M Na2SO4, and (d) 1.2 M NaSCN. Returning the sample to water yields a surface similar to (b). The average rms roughness of the surface in each environment taken from a random series of 2.5 μm × 2.5 μm regions is listed below each figure. Conclusion
As noted above, changes in Θa values with salts are modest with other surfaces.
This may explain why studies of the effect of solute concentration or solute identity on
surface wettability are not known, as the errors inherent in studying water contact angles
and these modest changes seen in Θa values for other surfaces with changes in solute
preclude definitive studies of wettability changes. Further improvement in our synthetic
procedures to form surfaces with even larger solute responsive ΔΘa values and further
work to study other solutes and to characterize other possible consequences of the solute

65
responsive morphological changes in these smart surfaces such as modulation of
adhesion or changes in surface mechanical properties are continuing. This facile
approach to surface modification allows such films to be prepared on virtually any
surface and should be a general route to materials with solute responsive wettability.

66
CHAPTER IV
PARALLEL EFFECTS OF CATIONS ON PNIPAM GRAFT WETTABILITY
AND PNIPAM SOLUBILITY*
Introduction
Stimuli-responsive surfaces or switchable surfaces that change their physical or
chemical properties in response to external stimuli have been of considerable research
interest recently.127-129 In particular, surfaces that can undergo reversible wettability
changes under external stimuli are attractive to applications in microfluidic devices,
chromatographic separations, self-cleaning and anti-fog surfaces, and sensor devices.130
Changes of surface wetting are also used to alter interactions of the stimuli-responsive
surfaces with aqueous solutions of biomolecules and biomaterials, which are important
in a variety of biological and medical applications of responsive surfaces in biofouling,
cell culture, and tissue engineering.131
Surfaces grafted with thermoresponsive polymers, such as poly(N-
isopropylacrylamide) (PNIPAM), elastin-like polypeptides (ELP) are known to
reversibly switch between hydrophilic and hydrophobic states in response to temperature
changes.132-136 Such thermoresponsive surfaces have been used in biomedical related
applications such as in the controlled capture or release of proteins and cells.137,138
*Reprinted with permission from “Parallel Effects of Cations on PNIPAM Graft Wettability and PNIPAM Solubility” by H. Fu, X. Hong, A. Wan, J. D. Batteas and D. E. Bergbreiter, ACS Appl. Mater. Interfaces, 2010, 2, 452–458, Copyright [2010] by American Chemical Society.

67
Their temperature responsiveness of surfaces in these applications derives from the fact
that thermoresponsive polymers exhibit lower critical solution temperature (LCSTs).
Below the LCST, these polymers are soluble and hydrophilic with an extended coil
conformation. Above the LCST, these polymers undergo a sharp phase transition to form
a collapsed hydrophobic conformation.93,139,140 It’s well known that the LCST of a
thermoresponsive polymer changes upon the addition of salt cosolutes to its aqueous
solution29,31,123 and effects of salts on LCSTs follow the Hofmeister series which ranks
various ions towards their ability to affect protein hydration.141,142 While temperature
induced wettability changes of a responsive surface can be sufficient for a particular
application, additional triggers such as changes in ionic strength sometimes can enhance
the utility of a stimuli-responsive surfaces. For example, ionic strength-induced
hydrophilic–hydrophobic phase transitions of ELP have been demonstrated using in
reversible capture and release of an ELP fusion protein from an ELP-functionalized
surface.143
While extensive studies have been done on the effects of salts on the LCSTs of
thermoresponsive polymers in aqueous solutions, these studies have largely focused on
the effects of anions. Cations are thought to play a minor role. However, few systematic
studies have been carried out to study the salt effects on the wettability of
thermoresponsive surfaces. In Chapter III, I discussed our studies of salt induced phase
transitions of responsive polymers on PNIPAM/SiO2 nanocomposite grafts on
polyethylene (PE) films.144 These studies showed that changing the anion identity and
concentration of various sodium salts had a significant impact on water contact angles,

68
an effect similar to that seen in studies of temperature effects on the wettability of
PNIPAM grafts on nanostructured surfaces. These anion effects on the wettability of
PEoxid-(PNIPAM/SiO2)6-PNIPAM nanocomposite grafts paralleled the Hofmeister-like
effects of these same alkali metal anion salts on PNIPAM LCSTs. We have now
investigated how changing cation identity, specifically changing from monovalent
cations to divalent metal cations to a trivalent cation like Al(III) affects surface
wettability of these PNIPAM-containing nanocomposite grafts. These wettability
studies show that the effects of varying cation identity and concentration on a graft
surface's wettability can be as large as the effects of anions. In addition, studies of the
effects of these cation sulfate salt solutions on LCSTs show that LCST effects and
surface wettability effects are comparable. A correlation between cation valence and the
cation’s effect on both LCSTs and surface wettability is seen when solution activity
instead of concentration is examined. Using activities, the intensity of the cation effect
on wettability follows the order: trivalent > divalent > monovalent. Similar analyses of
LCSTs show that at similar activities, trivalent and divalent aqueous solutions of metal
sulfates induce more salting out than aqueous solutions of monovalent sulfates.
Studies of Cation Effects on PE/(PNIPAM/SiO2)6/PNIPAM Nanocomposite
Surfaces
We recently showed that it was possible to use covalent layer-by-layer assembly
of nanoparticles and functional polymers to prepare surfaces that have wettability that
changes dramatically based on whether the surface is functionally hydrophilic or
hydrophobic.144,145 Such materials are analogous to thermally responsive grafts of

69
PNIPAM and related polymers on nanostructured surfaces.146,147 Notably, these
wettability changes for a surface could be reversibly induced without the need for
covalent modification with a hydrophobic or hydrophilic group. Likewise, the assembly
of these nanocomposite grafts with silica nanoparticles avoided the need for physical
patterning of the underlying substrate to create a topologically complex surface. Since
the polymer matrix of these grafts used PNIPAM, the grafted surfaces changed from
hydrophilic to hydrophobic much like PNIPAM's solubility in water changed as one
varied the identity and concentration of a sodium anion solute. The large anion effect
seen for PNIPAM/SiO2 nanocomposite grafts on PE films and the effects of changing the
identity of the anions on LCSTs of PNIPAM prompted us to study how varying cation
identity could affect surface wettability. Since surface wettability was particularly
sensitive to the concentration of a solution of a kosmotropic salt like sodium sulfate, we
focused out attention on various cation salts of this common anion to determine if other
cation salts would be more or less effective at altering surface wettability. The results
showed that changing cations could affect surface wettability in an equally dramatic
fashion. Moreover, the analyses of the effects of various sulfate salts on wettability
using activity instead of concentration provided a contrasting picture of the effect of
these various metal sulfate salts.
The nanocomposite grafts used in this study are prepared on polyethylene films
the same way as described in Chapter III by following the procedure shown in Scheme
10. Studies of the effects of aqueous solutions of trivalent, divalent and monovalent
cations on wettability of the prepared PE/(PNIPAM/SiO2)6/PNIPAM nanocomposite

70
surfaces were then carried out. In these studies, we opted to investigate cation salts of a
common anion. These studies are more complicated in some ways than studies that use
simpler sodium salts because the divalent and trivalent metal cations have relatively
more complex and concentration-dependent structures in aqueous solution.148,149 For
example, the identity of the metal cationic species in aqueous solutions in the 0.1-1.0 M
regime is complicated with a trivalent salt like Al2(SO4)3. While Al3+ species like
Al(H2O)63+ can be present, changes in pH or the presence of additives can lead to
formation of a variety of other species.150,151 The situation with divalent metal salts is
somewhat less complex as these species are more likely also to be present in many
forms, often as hexahydrates.152 Moreover, depending on the cation and anion, varying
amounts and varying types of ion pairs are present. The complexity of such solutions
over the concentration range of 0.05-1.0 M is seen in studies of divalent sulfates where
both contact and solvent separated ion pairs are present.153-155 Similar complexity is seen
in NMR studies where metal cationic species form various types of contact and solvent
separated ion pairs with anions that range from halides to sulfates.156-158 The solvated
cationic species that are likely present at a solid/solution interface are certainly no less
complex.53 Given that such complications affect studies of the effect of an aqueous
solution of any trivalent and divalent metal salt,159 we opted to focus on a common anion
that has a large effect on wettability. Since the kosmotropic sulfate anion was found to
have a large effect on surface wettability in our prior studies of sodium salts, we
examined the effect of varying the identity and concentration of the cation in sulfate salts
on wettability.

71
To avoid any time dependent changes in contact angle as we discussed in
Chapter III, these studies measured advancing water contact angles (Θa) as a function of
the concentration of the various sulfate salt solutions. The results shown in Figure 18a
show that changing the identity of the cation in aqueous solutions of sulfate salts did
indeed have a large effect on surface wettability. The effects were seen in comparing
trivalent, divalent and monovalent as well as in comparing monovalent sulfate salts
alone. These effects were also reversible. For example, a PE/PNIPAM/SiO2)6/PNIPAM
nanocomposite surfaces analyzed with a 1.0 M Al2(SO4)3 solution had a Θa of 145°.
Washing this surface first with water and then with THF yielded a film was then dried
and reanalyzed with water. That analysis showed that the film had a Θa of 76°, a value
that was identical to that of the Θa for water on the film before the original analysis with
Al2(SO4)3. Similar reversible wettability was seen in reanalysis with all of the other
cation salts. This sort of reversible behavior was also seen in Chapter III for the effects
of anions on surface wettability.
While the effect of changing cation identity in Figure 18a was significant, the
results in Figure 18a suggested that the changes in wettability were not correlated with
the cation valence. Specifically Na2SO4, (NH4)2SO4, and Li2SO4 had a greater effect on
surface wettability than MgSO4, CuSO4 or NiSO4. ZnSO4 was however very much like
the monovalent sulfate salts in its effect on wettability. The wettability of these grafts
was most sensitive to the concentration in Al2(SO4)3 solutions. Plots of advancing water
contact angle (Θa) versus SO42- concentration (Figure 19) also showed the effects of
divalent salts and monovalent salts on surface wettability are intermingled. We also

72
plotted advancing water contact angle versus ionic strength (Figure 20) and the plots
showed that mono-, di-, trivalent cations' effects on wettability increase with solution
ionic strength though Zn2+ is nearly indistinguishable from NH4+. Given the complexity
of cation species in these solutions, we thus also looked at the variation in Θa for various
cation sulfates versus salt solution activity. The activity coefficients for the various
sulfate salts were obtained either directly from the literature160-162 or were calculated by
using Pitzer’s method (which was used mainly for salt concentrations lower than 0.1 M
for which the activity coefficients were not listed).163,164
The resulting plot of Θa versus activity shown in Figure 18b differed from the
analogous plot of Θa versus concentration in that the divalent cations and monovalent
cations were both slightly distinguishable from one another but also were present in
distinct groupings. The single trivalent cation examined exhibited similarly distinct
behavior. The differences seen for plots using concentration (Figure 18a) or activity
(Figure 18b) were not observed in similar studies of various sodium salts. Plots of Θa vs.
concentration and Θa vs. activity in Figures 21a and 21b showed only modest
differences. In these cases, the activity coefficients of the various sodium salts did not
change appreciably as the concentration of the anion changes from 0.1 - 1.0 M. Since
the changes in activity over this concentration range paralleled the changes in anion
concentration, the shape and sequential order of the curves in the activity plot are
generally similar to what is seen in plots of Θa versus concentration.

73
Salt Concentration (M)
0 1 2 3 4
Adva
ncin
g C
onta
ct A
ngle
(deg
)
80
100
120
140
160
Al2(SO4)3 Na2SO4ZnSO4Li2SO4 (NH4)2SO4 CuSO4MgSO4NiSO4
a
c
Figure 18. Cation effects on wettability of a PNIPAM/SiO2 grafted nanocomposite surface: a) The advancing contact angles of various cation sulfate salts versus salt concentration; b) The advancing contact angles of various cation sulfate salts versus salt solution activity.
Salt Solution Activity
0.0 0.1 0.2 0.3 0.4 0.5
Adva
ncin
g C
onta
ct A
ngle
(deg
)
80
100
120
140
160
Al2(SO4)3
ZnSO4
CuSO4
MgSO4
NiSO4
Na2SO4(NH4)2SO4
Li2SO4
b

74
[SO42-] (M)
0 1 2 3 4
Adva
ncin
g C
onta
ct A
ngle
(deg
)
80
100
120
140
Na2SO4 ZnSO4Li2SO4(NH4)2SO4CuSO4MgSO4Al2(SO4)3
NiSO4
Figure 19. Cation effects on wettability of PNIPAM grafted nanocomposite surface. This figure was plotted over the advancing contact angles of various cation sulfate salts versus concentration of the sulfate ion.
Figure 20. Cation effects on wettability of PNIPAM grafted nanocomposite surface. This figure was plotted over the advancing contact angles of various cation sulfate salts versus ionic strength of the salt solutions.
Ionic Strength (M)
0 5 10 15 20
Adva
ncin
g C
onta
ct A
ngle
(deg
)
80
100
120
140
160
Na2SO4
Li2SO4
(NH4)2SO4
ZnSO4
CuSO4
MgSO4
NiSO4
Al2(SO4)3

75
Salt Concentration (M)0 1 2 3 4
Adva
ncin
g C
onta
ct A
ngle
(Deg
)
60
80
100
120
140
160Na3Citrate Na2SO4 NaH2PO4NaCl NaBrNaClO4NaINaSCN
a
Salt Solution Activity 0 1 2 3 4
60
80
100
120
140
160Na3CitrateNa2SO4
NaH2PO4
NaClNaBrNaClO4
NaINaSCN
Adv
anci
ng C
onta
ct A
ngle
(Deg
)
b
Figure 21. Anion effects on wettability of PNIPAM grafted nanocomposite surface: a) The advancing contact angles of various sodium salts versus salt concentration; b) The advancing contact angles of various sodium salts versus salt solution activity.

76
As was true for our earlier studies where anion identity and concentration were
varied, the change of Θα with salt activity or concentration produced a curve similar to a
titration curve with an inflection point that was significantly different with different
salts. This effect was most striking in a plot of Θα for different cations on the wettability
of these PNIPAM nanocomposite grafts and was greatest in comparison of groups of
cations of different valence. For example, in Figure 18b, the inflection point for
wettability change of the trivalent Al(III) was about 0.01 while the average inflection
points for the di- and monovalent sulfate salts were 0.05 and 0.19 respectively. It was
also notable that significant differences could be found for cations that have the same
valence. For example, the wettability curves in Figure 18b for Na2SO4, (NH4)2SO4 and
Li2SO4 had inflection points at solution activities of 0.17, 0.18 and 0.23 respectively.
Atomic Force Microscopy Studies
Our prior studies of the effect of varying anion identity and concentration in
reversibly changing wettability of PNIPAM/SiO2 nanocomposite grafts showed that the
wettability changes were correlated with changes in surface roughness presumably due
to solvation/desolvation of the PNIPAM matrix. A similar correlation between surface
roughness and surface wettability with different cation sulfate solutions was also found
by AFM on the PE/(PNIPAM/SiO2)6/PNIPAM surfaces here (Figure 22). As shown in
Figure 22a, this PNIPAM/SiO2 nanocomposite surface inherently had both macro- and
nanoscale roughness like the samples we prepared previously in air (224 nm compares to
287 nm rms). This 224 nm rms roughness changed when the surface was exposed to
water, dropping to a value of ~157 nm rms. This 157 nm rms roughness did not change

77
significantly in the presence of 0.2 M aqueous ZnSO4 (134 nm rms). However,
treatment with a 0.8 M ZnSO4 solution increased rms roughness to ~257 nm rms which
further increases to ~307 nm in the presence of 1.2 M ZnSO4. As described above, these
changes in roughness likely corresponded to changes in solvation of the nanocomposite
graft. Akin to the changes in surface morphology seen in our earlier work, they
paralleled changes in wettability induced by the solute responsive swelling or chain
collapse that altered the hydrophobicity of the PNIPAM component of the
nanocomposite graft.165-167
Figure 22. Tapping mode AFM images of PE/PEI/(PNIPAM/SiO2)6/PNIPAM obtained in (a) air, (b) water, (c) 0.2 M ZnSO4, (d) 0.8 M ZnSO4 and (e) 1.2 M ZnSO4. The average rms roughness of the surface in each environment was taken from six random 2.5 μm × 2.5 μm regions and the data was listed below each image(scale bar: 2 μm).

78
Studies of Cation Effects on LCST of PNIPAM Solution
Since our earlier studies of the effects of changing the identity and concentration
of anions on wettability of responsive grafts were based on prior studies of LCSTs of
PNIPAM in sodium salt solutions, we chose to also study the effect of varying the
identity and concentration of these sulfate salts on PNIPAM LCSTs. These studies
employed the same automated melting point apparatus and procedures we used
previously to study clouding curves for solutions of these and other thermoresponsive
polymers.168 As was true in our prior work, we used a fractionated sample of atactic
PNIPAM with a Mn of 322 kDa (PDI = 1.06) as the polymer substrate. This PNIPAM
was made by conventional radical polymerization and was purified by solvent
precipitation. The sample solutions were prepared as mentioned in the experimental
section and each sample had a constant PNIPAM concentration of 10 mg/mL. Plots of
the LCST versus sulfate salt concentration and activity are shown in Figures 23a and
23b, respectively. The LCSTs in these curves were based on the temperature at which
50% clouding was observed. Plots of the LCST versus sulfate salt concentration or
activity based on the 10% value for clouding were roughly similar (Figure 24). In either
case, distinguishable cation effects were also seen on the phase transition temperature of
PNIPAM solutions when we plotted the LCSTs versus salt concentrations (Figure 23a
and 24a). Just as was true in studies of surface wettability, plots of the LCST versus salt
concentration did not distinguish between divalent and monovalent sulfates, e.g. Na2SO4
and ZnSO4 are quite similar. NiSO4, MgSO4, and CuSO4 in contrast, behaved like
'salting in' cations in accord with conventional Hofmeister effects.142 Plots of salt

79
concentration versus LCST with Al2(SO4)3 showed this salt is the most kosmotropic.
However, just as seen earlier for the cation effect on advancing contact angle, a plot of
LCST versus salt solution activity showed distinctly different behavior for monovalent,
divalent and trivalent sulfate salts (Figure 23b and 24b). Because the activity coefficient
of the tri- and divalent cations was less than that of the monovalent cations, the intensity
of the effects of different cations followed the order: trivalent > divalent > monovalent.
More linear plots though were obtained when sulfate solution concentrations were
plotted versus LCSTs.
While it is possible to speculate about the origin of these differences (e.g. Al3+
bears the most positive charge, Al2(SO4)3 has the highest ionic strength,40 and Al2(SO4)3
produces the most ions when it dissociates), this speculation is likely to have to be
oversimplified given the complexity of species present in aqueous solutions of these tri-,
di- and monovalent sulfate solutions. Given this complexity, a simplified picture where
cation hydrates of whatever structure affect the ability of water to hydrate the
macromolecules seems to be a reasonable way to try to understand the different effects
seen here.169

80
Salt Concentration (M)0.00 0.05 0.10 0.15 0.20
LCST
(ο C)
24
26
28
30
32
34Al2(SO4)3ZnSO4Na2SO4Li2SO4(NH4)2SO4MgSO4NiSO4CuSO4
a
Salt Solution Activity 0.00 0.02 0.04 0.06 0.08
LCST
(ο C)
24
26
28
30
32
34Al2(SO4)3ZnSO4MgSO4NiSO4CuSO4Na2SO4(NH4)2SO4Li2SO4
b
Figure 23. Cation effects on the LCSTs (based on the temperatures at which 50% clouding were observed) of PNIPAM in aqueous solution: a) The LCSTs of PNIPAM in various cation sulfate salt solutions versus salt concentration (M); b) The LCSTs of PNIPAM in various cation sulfate salt solutions versus salt activity. The concentration of PNIPAM was fixed to 10 mg/mL for all samples.

81
Figure 24. Cation effects on the LCSTs (based on the temperatures at which 10% clouding were observed) of PNIPAM in aqueous solution: a) The LCSTs of PNIPAM in various cation sulfate salt solutions versus salt concentration (M); b) The LCSTs of PNIPAM in various cation sulfate salt solutions versus salt activity. The concentration of PNIPAM was fixed to 10 mg/mL for all samples.
Salt Concentration (M)0.00 0.05 0.10 0.15 0.20 0.25
LCS
T (ο C
)
22
24
26
28
30
32
34Al2(SO4)3
ZnSO4
Na2SO4
Li2SO4
MgSO4
NiSO4
(NH4)2SO4
CuSO4
a
Salt Solution Activity0.00 0.02 0.04 0.06 0.08
LCS
T (o C
)
22
24
26
28
30
32
34Al2(SO4)3
ZnSO4
MgSO4
CuSO4
NiSO4
Na2SO4
(NH4)2SO4
Li2SO4
b

82
A similar interpretation of cation effects was advanced by Guo and Friedman in a
recent report.53 From their Gadolinium (Gd3+) vibronic sideband luminescence
spectroscopy (GVSBLS) experiments, they concluded that the effect of a cation on an
macromolecule hydration was charge density-dependent and that high charge density
cations change water configuration which in term weaken its hydrogen bonds to
neighboring waters. However, the specific interactions will obviously vary depending on
the relative concentrations of the various species present in these complexsolutions.
Moreover, these solutions' components' relative concentrations vary in a concentration
dependent manner. Thus, the effects are not likely to be linear with concentration, a
result that is apparent in plots that use activity but not in those that only look at
concentration.
Conclusion
These studies show that cations have large effects on phase separation of
PNIPAM solutions and surface wettability of PNIPAM nanocomposite grafts. These
effects on surface wettability are correlated with changing solvation/swelling and
changing surface roughness of these nanocomposite grafts. Overall, the effects of
varying the identity and concentration of cations are as marked as those seen with
anions. This suggests that the design of solute responsive interfaces will need to
consider cation identity and concentration in addition to anion identity and
concentration. As was true in the case of our studies of wettability effects of solute
anions, the effect of varying cation identity and concentration seen in wettability are
paralleled in studies of changes in LCST for PNIPAM solutions. However, plots of the

83
physical changes of either the wettability or the LCST of these responsive polymer
systems with varying cation concentration and identity vary significantly from plots
where activity is used in place of concentration. Such marked differences are not seen
for plots of wettability or LCST for less complex solutions where the identity of an anion
is varied with a constant cation (Na+). Generally speaking, the activity coefficients take
into account both the dissociation of the electrolytes and the electrostatic forces between
the dissociated ions. Thus, it might be more appropriate to use activity than
concentration to analyze data especially when complicated electrolytes are under
consideration or to at least consider activity as an alternative to concentration in
analyses.

84
CHAPTER V
COVALENT LAYER-BY-LAYER ASSEMBLY OF SOLUTE-RESPONSIVE
SURFACES ON SILICON WAFER
Introduction
As described in Chapter III and IV, we have been able to successfully graft
PNIPAM/SiO2 nanocomposites onto the surfaces of polyethylene (PE) films using
covalent layer-by-layer assembly method. PE films have inherent roughness and their
surfaces can be easily functionalized by oxidation using CrO3/H2SO4.170 Thus, I have in
this chapter described how this method can be extended to covalently assemble layer-by-
layer grafts on other types of materials, such as smooth or porous materials. Polished
silicon wafers, which have hard and smooth surfaces, have been widely used as
substrates for fabrication of microelectronics and solar cells. Two dimensional silicon
wafers are also useful substrates when surface grafts are to be characterized by
techniques like such as ellipsometry and atomic force microscopy.171 Polished silicon
wafers usually contain a native oxide on their surface and can be functionalized with
primary amines by treatment with silanization reagents such as 3-
aminopropyltriethoxysilane (APTES).172,173 Aminated silicon wafers have long been
used as substrates to prepare functional surfaces using ionic layer-by-layer self-assembly
processes. In this chemistry, the aminated silicon wafers can self-assemble with an acid-
containing polymeric reagent.174,175 Subsequent steps with cationic and anionic polymers
then produce a layer-by-layer graft. The chemistry in our covalent layer-by-layer
85
assembly involves the reaction of a nucleophile with an activated carbonyl derivative
and is conceptually similar to the ionic process used by others.145 For example, we have
used the reaction of primary amines with active ester-containing copolymer, PNIPAM-c-
PNASI to prepare the solute-responsive surfaces described in Chapter III and IV. In both
cases, stable covalent amide bonds were formed at ambient temperature in less than 30
minutes. We envisioned that we could use the same condensation chemistry to
covalently assemble grafts on surfaces of aminated silicon wafers. In this chapter, I will
describe the syntheses of PNIPAM/SiO2 nanocomposite grafts on polished silicon
wafers using this covalent layer-by-layer assembly process. The same grafting materials,
PNIPAM-c-PNASI copolymer and the 10- and 100-nm diameter aminated silica
nanoparticles used in Chapter III and IV were used in this study and the solute-
responsive wettability changes of the so-formed surfaces were studied by means of
advancing contact angle measurements.
Preparing the PNIPAM/SiO2 Nanocomposite on Silicon Wafer Surfaces by
Covalent Layer-by-layer Self-assembly Method
Functionalization of silicon wafers (SW). A single-side polished silicon wafer
(100) (1 x 1.5 cm) was sonicated for 2 minutes successively in hexane, tetrahydrofuran
and ethanol to remove any contaminants. The washed silicon wafer was then blow-dried
with nitrogen stream and then treated with 7:3 (vol/vol) concentrated sulfuric acid and
30% H2O2 for 1 h (caution: the piranha solution is highly corrosive and extremely
reactive with organic substances). The cleaned silicon wafer was then rinsed with a
copious amount of water and ethanol before being immersed into a 5 mM 3-

86
aminopropyltriethoxysilane (APTES) ethanol solution. The wafer/APTES solution
mixture was shaken by a shaker at moderate speed overnight. The APTES treated wafers
were then removed from this solution and washed with ethanol and dried in a vacuum
oven at 120 °C for 2 h. The resulting amine-functionalized wafer had a hydrophilic
surface with an advancing water contact angle of less than 15°. The thickness of the
APTES layer was 2 nm as determined by ellipsometry measurement. The ellipsometic
data was measured by a Nanofilm EP3 imaging ellipsometer at 660 nm wavelength with
an incidence angle of 75 deg. The film thickness was calculated by fitting the
ellipsometric data using the supplied EP3View software. An AFM image of this ATPES-
treated silicon wafer (Figure 25a) was obtained by Mr. Albert Wan in the Batteas group.
This image shows a featureless surface with a measured rms roughness of 0.7 ± 0.3 nm.
The smooth surface indicated that a monolayer of APTES was attached to the silicon
wafer surface.
Covalent layer-by-layer self-assembly of PNIPAM/SiO2 nanocomposites on
silicon wafers. Prior to the PNIPAM/SiO2 nanocomposite grafting, the APTES-treated
silicon substrate was primed by covalently attaching two PNASI/PEI bilayers to its
surface. his process was assumed to increase the number of surface amine groups. This
priming step was accomplished by allowing the APTES-treated silicon wafer to react
first with the electrophilic poly(N-acryloxysuccinimide) (PNASI) for 30 minutes. The
active ester of NASI was readily converted to an amide upon reacting with an amine.
This condensation reaction coupled the polyvalent electrophilic polymers to the
originally aminated wafer surface and the remaining unreacted NASI groups could react

87
further with subsequently introduced nucleophilic polyethyleneimine (PEI) in a similar
amide-forming condensation reaction. The surface was amine-rich after one PNASI/PEI
bilayer treatment. While the surface could be used directly for a second PNASI/PEI
bilayer treatment, we treated this surface with i-PrNH2 to quantitatively convert any
unreacted NASI groups into NIPAM groups. A second PNASI/PEI bilayer treatment
was carried out after the i-PrNH2 treatment and the wafer surface by now was covered
with a sufficient amount of amine groups. AFM analysis by Mr. Albert Wan showed that
small but evenly scattered clusters that were about 4 nm in height appeared on the
surface after being primed with one PNASI/PEI bilayer (Figure 25b). AFM analysis
also showed that this silicon wafer surface had an rsm roughness of about 1.3 ± 0.3 nm
and a thickness of about 6 nm. After the surface was primed with the second PNASI/PEI
bilayers, the new surface had a similar rms roughness of 1.2 ± 0.3 nm but an increased
thickness of 14 nm (Figure 25c). These results indicated that we were able to increase
the amount of surface functional groups without changing the surface roughness. The
‘primed’ surface is presumed to help to enhance the following covalent layer-by-layer
assembly steps.

88
Figure 25. Tapping mode AFM topographic images of surfaces of (a) APTES treated silicon wafer, b) one PNASI/PEI bilayer primed silicon wafer, c) two PNASI/PEI bilayers primed silicon wafer. The numbers under each image are the rms roughness for the corresponding surfaces.
The same covalent layer-by-layer assembly process illustrated in Scheme 10 was
then carried out on this ‘primed’ silicon wafer. As illustrated in Scheme 10, a
nucleophilic copolymer, PNIPAM-c-PNASI (Mn = 30,000 Da), and electrophilic
aminated 10- and 100-nm silica nanoparticles were used in this synthesis. After each
PNIPAM-c-PNASI/SiO2 bilayer assembly, excess i-PrNH2 was used to convert any
unreacted NASI groups into NIPAM groups which led to the formation of a
PNIPAM/SiO2 network on the surface. In most cases, five PNIPAM-c-PNASI/10 and
100 nm aminated silica nanoparticles/i-PrNH2 treatments were carried out before the
surface was treated with one PNIPAM-c-PNASI/10 nm aminated silica nanoparticles/i-
PrNH2 treatment. Finally the surface was treated with PNIPAM-c-PNASI and then i-
PrNH2 to make a nanocomposite graft with PNIPAM on the top layer. The so-formed
PNIPAM/SiO2 nanocomposite grafted silicon wafers were denoted as
a b c
0.7 ± 0.3 nm 1.3 ± 0.3 nm 1.2 ± 0.3 nm

89
SW/(PNIPAM/SiO2)6/PNIPAM just as PE/(PNIPAM/SiO2)6/PNIPAM was used to name
the similar nanocomposite graft on a PE film. An AFM image of this
SW/(PNIPAM/SiO2)6/PNIPAM nanocomposite is shown in Figure 26. This image
obtained by Mr. Albert Wan reveals the same type of surface texture seen for the
PE/(PNIPAM/SiO2)6/PNIPAM nanocomposite (Figure 12). This
SW/(PNIPAM/SiO2)6/PNIPAM nanocomposite graft has a rms roughness of 287 ± 53
nm which is essentially the same value for the rms roughness of
PE/(PNIPAM/SiO2)6/PNIPAM graft (287 nm).
Figure 26. Tapping mode AFM topographic image of a SW/(PNIPAM/SiO2)6/PNIPAM nanocomposite surface with a rms roughness of 287 ± 53 nm. The bottom graph is the cross-section trace along the white line drawn on the AFM image.
-550-350-150
50250450650850
0 2 4 6 8 10
Hei
ght(
nm)
Distance (µm)
90
Studies of the Solute-responsive Wettability on the Surfaces of
SW/(PNIPAM/SiO2)6/ PNIPAM Nanocomposite Grafts
In Chapters III and IV, I showed that PNIPAM /SiO2 nanocomposite grafts
prepared on PE films showed distinct responsive wettability for various salt solutions or
solutions of one salt with different concentrations. By changing the identity or
concentration of a sodium anion salt or a cation sulfate salt, such surfaces can be tuned
in such a way that they are alternately and reversibly hydrophilic or very hydrophobic.
The propensity of different anions to change the surface wettability paralleled the effects
of these anions on LCSTs of soluble PNIPAM and is essentially a Hofmeister effect of
salts on wettability. Since this SW/(PNIPAM /SiO2)6/PNIPAM nanocomposite graft was
assembled in the same manner as used for the PE/(PNIPAM /SiO2)6/PNIPAM graft, we
expected that it had similar surface properties as the PE/(PNIPAM /SiO2)6/PNIPAM
graft seen in Chapter III and IV. A series of sodium salt solutions were applied to the
newly prepared SW/(PNIPAM /SiO2)6/PNIPAM nanocomposite graft. As shown in
Figure 27, the same sorts of anion effects are observed on this surface. The kosmotropic
salts such as sodium citrate and sodium sulfate have greater ability to change the surface
wettability than chaotropic salts such as sodium iodide and sodium thiocyanate. Also,
larger differences in advancing contact angles (ΔΘa) were seen on this surface with
varying solution concentrations. The largest ΔΘα on surface of this nanocomposite
grafted silicon wafer was as high as ~90°. This ΔΘα is ~20° higher than the largest ΔΘa
(~70°) seen with the PE/(PNIPAM /SiO2)6/PNIPAM nanocomposite grafts. More
interestingly, the surface of SW/(PNIPAM/SiO2)6/PNIPAM nanocomposite graft

91
became superhydrophobic with 1.4 M sodium citrate and sodium sulfate. For example,
when a 10 µL droplet of 1.4M sodium citrate was applied onto this surface, the droplet
would roll on the surface with a sliding angle less than 15°. The same superhydrophobic
wettability could also be observed with sodium chloride at higher concentrations (3 M).
Just as true for the PNIPAM/SiO2 nanocomposite grafted PE films, the PNIPAM/SiO2
nanocomposite grafted silicon wafers showed reversible and repeatable wettability
changes in response to changes of salt solution concentrations or solute identity.
Figure 27. Changes in advancing contact angle (Θa) of a SW/(PNIPAM/SiO2)6/PNIPAM nanocomposite surface measured with solutions of various salts as a function of salt concentration. Each data point was the average of three individual measurements and had an error of ±2°.
Salt Concentration (M)0 1 2 3 4
Adv
anci
ng C
onta
ct A
ngle
(deg
)
60
80
100
120
140
160
180Na3CitrateNa2SO4
NaOAcNaCH3SO3
NaClNaBrNaINaSCN

92
We further tested the solute-responsive wettability of the
SW/(PNIPAM/SiO2)6/PNIPAM nanocomposite graft with two organic salts (sodium
acetate and sodium methanesulfonate) and a polymeric salt (poly(sodium p-styrene
sulfonate)). Sodium acetate (NaOAc) and sodium methanesulfonate (NaCH3SO3) both
acted as kosmotropic salts and induced a ΔΘa of ~ 90° while increasing the solution
concentrations (Figure 27). The effect of anions on this solute-responsive
SW/(PNIPAM/SiO2)6/PNIPAM nanocomposite surface follows the order: C6H5O73-
(citrate) > SO42- > CH3CO2
- > CH3SO3- > Cl- > Br- > I- ~ SCN-, which agree with
Hofmeister series.
The poly(sodium p-styrene sulfonate) (PPS) (Mw = 70 kDa) behaved a little
differently and it seemed like having a ‘salting-in’ effect at lower concentrations. Figure
28 showed the changes in advancing contact angle and static contact angle of a
SW/(PNIPAM/SiO2)6/PNIPAM nanocomposite surface measured with aqueous PPS
solutions at different concentrations. The droplets of each solution were allowed to
equilibrate with the surface for 2 minutes before measuring the advancing and static
contact angles. Both the advancing and static contact angle data showed that the surface
became more hydrophilic with 0.2 to 0.6 M PPS than with water. This might be due to
the interactions between the polymer chains of PNIPAM and the added PSS. Those
interactions helped stabilize the coil conformation of PNIPAM chains on the surface and
led to a more hydrophilic surface. Similar effects had been reported on the LCSTs of
PNIPAM in aqueous solutions with the addition of polyethylene glycol and bovine

93
serum albumin.45 As seen in Table 1 in Chapter I, higher LCSTs for PNIPAM solutions
were observed with the addition of these macromolecular species.
Figure 28. Changes in advancing contact angle (filled diamonds) and static contact angle (filled triangles) of a SW/(PNIPAM/SiO2)6/PNIPAM nanocomposite surface measured with aqueous solutions of poly(sodium p-styrene sulfonate) in different concentrations. The static contact angles were measured at 2 minutes after each droplet was placed on the surface.
We were also interested in the effect of mixed salts on wettability of this solute-
responsive surface. Prior work has suggested mixed salts have an addictive effect on
PNIPAM LCSTs.47 Freitag’s group had measured cloud point temperatures of PNIPAM
solutions that contained equal amounts of KF/KCl or equal amounts of KF/KI as
cosolutes. They found out that either with two salting-out salts (KF/KCl) or with a
combination of a salting-out salt (KF) and a salting-in salt (KI), the effect of the two
Salt Concentration (M)0.0 0.2 0.4 0.6 0.8 1.0 1.2 1.4
Con
tact
Ang
le (d
eg)
40
50
60
70
80
90
100
110
120

94
salt species on the cloud point temperature of PNIPAM solution is additive. In this
study, I chose two mixed salt series to test wettability effects of salt mixtures on the
SW/(PNIPAM/SiO2)6/PNIPAM nanocomposite graft: one had a fixed concentration of
NaOAc (0.8 M) and a varied concentration of NaSCN; the other had a fixed
concentration of NaSCN (0.8 M) and a varied concentration of NaOAc. I chose these
two salts because NaOAc and NaSCN had salting-out and salting-in effects respectively
as shown in Figure 27. The mixed salt results are shown in Figure 29, which reveals that
mixed salts also have an additive effect on the wettability of
SW/(PNIPAM/SiO2)6/PNIPAM nanocomposite grafts.
Figure 29. Advancing contact angles measured with solutions of mixed NaOAc and NaSCN on the SW/(PNIPAM/SiO2)6/PNIPAM nanocomposite surface. The blue circles represent the advancing contact angles obtained using solutions with fixed [NaSCN] (0.8 M) and varied [NaOAc]. The pink triangles represent the advancing contact angles obtained using solutions with fixed [NaOAc] (0.8 M) and varied [NaSCN].
Salt Concentration (M)0.0 0.5 1.0 1.5 2.0 2.5
Adva
ncin
g C
onta
ct A
ngle
(deg
)
80
100
120
140
160 0.8 M NaSCN + varied NaOAc0.8 M NaOAc + varied NaSCN

95
Conclusion
Previously, we have successfully prepared PNIPAM/SiO2 nanocomposite grafts
on soft and rough polyethylene films by a covalent layer-by-layer assembly method.
The product PE/(PNIPAM/SiO2)6/PNIPAM graft showed distinct solute-responsive
wettability. In this chapter, we demonstrated that the same covalent layer-by-layer
assembly method can be extended to make PNIPAM/SiO2 nanocomposite grafts on hard
and smooth substrates such as silicon wafer. SW/(PNIPAM/SiO2)6/PNIPAM
nanocomposite grafts were successfully grafted on polished silicon wafers and the
surfaces of these grafts showed good solute-responsiveness on wettability. When a series
of sodium salt solutions were applied to the SW/(PNIPAM/SiO2)6/PNIPAM
nanocomposite surfaces, the same anion effects on wettability were observed as had
been seen for PE grafted nanocomposite surfaces. Furthermore, when we applied
solutions of mixed sodium acetate (salting-out salt) and sodium thiocyanate (salting-in
salt) to a SW/(PNIPAM/SiO2)6/PNIPAM nanocomposite surface, the mixed salt effects
on wettability are additive, which agrees with the additivity of salt on LCST observed in
studies of PNIPAM solutions. The ability of grafting a PNIPAM/SiO2 nanocomposite
surface on silicon wafers using the covalent layer-by-layer assembly will also enable us
to study the surface growth mechanisms by means of AFM analysis. The thickness and
roughness of the grafted surface at different grafting stages can both be measured by
AFM. Detailed AFM studies of this covalent layer-by-layer assembly have been carried
out with the Batteas group. These results are consistent with an assembly process like
that shown in Scheme 10.

96
CHAPTER VI
PNIPAM-BASED FUNCTIONAL RESPONSIVE POLYMERS
Introduction
Temperature responsive polymers have a lower critical solution temperature
(LCST) and are soluble in a cold solution but become insoluble on heating. At their
LCSTs, they exhibit reversible coil-to-globule conformational changes and undergo
subsequent phase separation in solution. Among all the thermoresponsive polymers,
poly(N-isopropylacrylamide) (PNIPAM) has been studied in the greatest detail.
PNIPAM forms random coils in water at low temperatures and collapses to form solid
globules with a sharp phase transition temperature around 32°C. PNIPAM’s temperature
dependent behavior has been studied in solution, in gels and on surfaces under the
influence of various additives and solvents. While this LCST behavior is also affected by
the polymer microstructure and polymer stereochemistry, incorporation of modest
amounts of other functional groups into the PNIPAM chain allows one to make
responsive recyclable polymeric analogs of various functional groups. This allows one to
use PNIPAM copolymers in a variety of applications. In this chapter, examples of
PNIPAM copolymers with different targeted applications are discussed.
Random PNIPAM copolymers can be easily prepared by two general synthetic
approaches (Scheme 11). The first scheme is based on copolymerization of N-
isopropylacrylamide (NIPAM) with an appropriately functionalized acrylamide or
acrylate starting with a desired ratio of two comonomers. Varying the monomer feed

97
ratios can generate PNIPAM copolymers with different LCSTs which depend on the
mole fraction and the nature of substituent R1 in Scheme 11 a. The second scheme
involves the use of an active ester-containing polymer, usually an N-succinimidyl-
containing polymer (Schemes 11 b and c).176 Poly(N-acryloxysuccinimide) (PNASI)
homopolymer or PNIPAM-c-PNASI copolymer can both be used to synthesize of
functional PNIPAM copolymers.177 They also have been used as polyvalent electrophiles
in our covalent layer-by-layer self assembly procedure for grafting functional
nanocomposite surfaces. Both synthetic approaches shown in Scheme 11 are used in the
discussions below.
Scheme 11. Syntheses of random PNIPAM copolymers.

98
Poly(N-isopropylacrylamide)-c-poly(4-(N,N-diallylamino)pyridine) (PNIPAM-c-
PDAAP) – a PNIPAM-supported Organocatalyst
4-N,N-(Dialkylamino)pyridine derivatives such as 4-(dimethylamino)pyridine
(DMAP) and 4-pyrrolidinopyridine (4-PPY) are widely applied as organocatalysts for a
variety of nucleophilic addition reactions, such as acylations and silylations of tertiary
and hindered hydroxyls, Baylis-Hillman reactions and ester transesterfication or
hydrolysis.178 In order to allow facile recovery and reuse of these catalysts, several
approaches for immobilization of 4-N,N-(dialkylamino)pyridine catalysts on various
organic and inorganic solid supports such as polymer beads and silica-based materials,
have been reported in the literature.179,180 Homogeneous polymer-supported 4-N,N-
(dialkylamino)pyridine catalysts using polymers such as linear soluble polymers,
dendrimers, and multiarm star copolymers, have also been studied.181-183
Previously, our group had made a soluble polymer-bound version of DMAP
using poly(N-isopropylacrylamide) (PNIPAM) or poly(4-tert-butylstyrene) (PtBS) as a
soluble polymer supports. Both the PNIPAM-supported DMAP (10) and PtBS-
supported DMAP catalysts (11) showed activity like that seen for DMAP. The catalyst
10 was successfully recovered and recycled by solvent precipitation or using a
liquid/liquid thermomorphic solvent system. The selective solubility of PtBS in heptane

99
enabled catalyst 11 to be recycled 20 times in a heptanes/EtOH latent biphasic solvent
system.
NHO O NH(CH2)5
NO NNN
N N10 11
O NH N
N N
N
12 13
4-Pyrrolindinopyridine (4-PPY) has the highest activity among all the 4-N,N-
(dialkylamino)pyridine catalysts and polymeric versions like poly(4-N,N-
diallylaminopyridine) (PDAAP) 12 have been shown to be more effective in hydrolysis
of p-nitrophenyl carboxylate in aqueous buffer solutions than 4-PPY. In this section, I
describe the synthesis and the kinetic studies of another PNIPAM supported 4-PPY
catalyst 13. The successful recycling of this catalyst with different methods is also
discussed.
Using the synthetic route shown in Scheme 12, I first prepared the 4-N,N-
diallylaminopyridine monomer and then copolymerized it with NIPAM in HCl aqueous
solution using 2,2’-azobis(2-methylpropionamidine) dihydrochloride (V-50) as initiator
to form the poly(N-isopropylacrylamide)-c-poly(4-(N,N-diallylamino)pyridine)
(PNIPAM-c-PDAAP) copolymer 13.184 Three PNIPAM-c-PDAAP copolymers with
NIPAM/DAAP ratios of 5:2, 14:1 and 20:1 were prepared. The mole fractions of
comonomers in the product copolymers were determined by 1H NMR spectroscopy. A
homopolymer poly(4-N,N-diallylaminopyridine) (PDAAP) 12 was also prepared by the

100
same radical polymerization procedure. GPC analyses (Viscotek multidetector GPC
system) showed that the 5:2, 14:1 and 20:1 PNIPAM-c-PDAAP copolymers had a Mw of
43 kDa, 40 kDa and 42 kDa respectively. The PDAAP homopolymer had a Mw of 35
kDa.
Scheme 12. Syntheses of PDAAP 12 and PNIPAM-c-PDAAP 13.
The catalytic activities of 12 and 13 were studied using hydrolysis reaction of p-
nitrophenyl octanoate (eq 6).185 In kinetic studies, the UV absorbance of the hydrolysis
product, p-nitrophenylate anion, at 400 nm was measured as a function of time using a
Varian Carry 100 ultraviolet-visible spectrometer equipped with a temperature controller
and a magnetic stirrer. All the catalysts were dissolved in methanol to make stock
solutions that had a concentration of 1.5x10⁻³ M. The p-nitrophenyl octanoate was
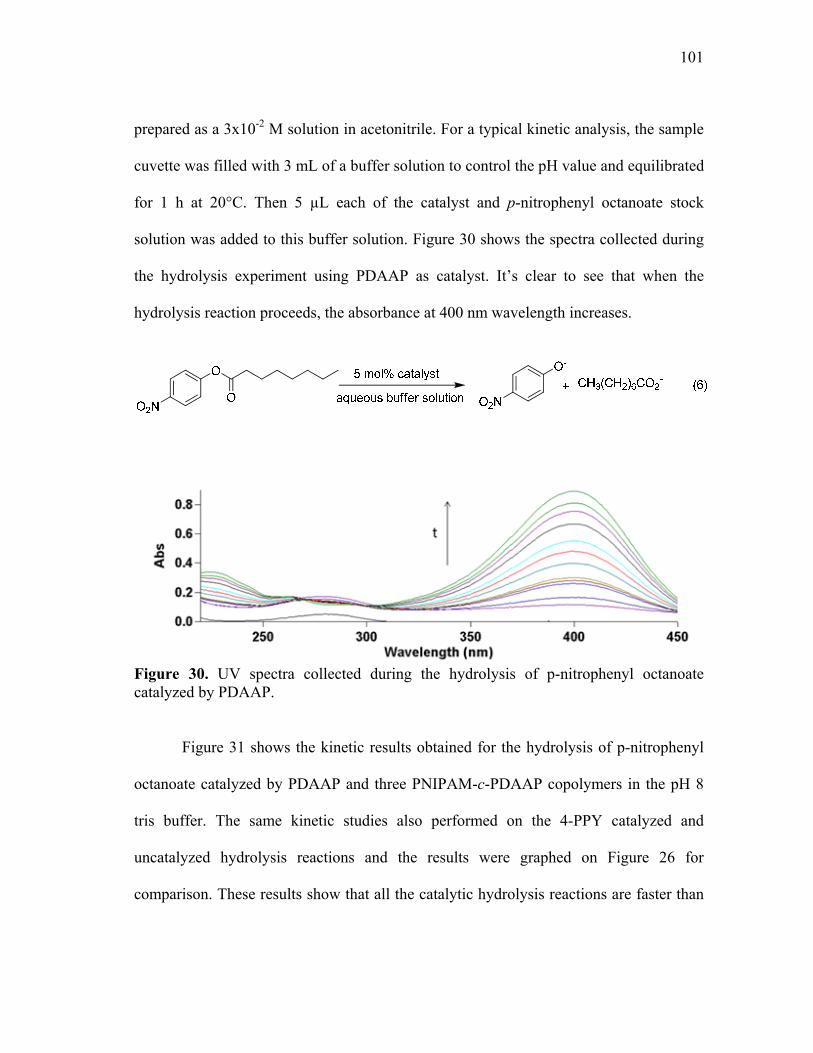
101
prepared as a 3x10⁻² M solution in acetonitrile. For a typical kinetic analysis, the sample
cuvette was filled with 3 mL of a buffer solution to control the pH value and equilibrated
for 1 h at 20°C. Then 5 µL each of the catalyst and p-nitrophenyl octanoate stock
solution was added to this buffer solution. Figure 30 shows the spectra collected during
the hydrolysis experiment using PDAAP as catalyst. It’s clear to see that when the
hydrolysis reaction proceeds, the absorbance at 400 nm wavelength increases.
Figure 30. UV spectra collected during the hydrolysis of p-nitrophenyl octanoate catalyzed by PDAAP.
Figure 31 shows the kinetic results obtained for the hydrolysis of p-nitrophenyl
octanoate catalyzed by PDAAP and three PNIPAM-c-PDAAP copolymers in the pH 8
tris buffer. The same kinetic studies also performed on the 4-PPY catalyzed and
uncatalyzed hydrolysis reactions and the results were graphed on Figure 26 for
comparison. These results show that all the catalytic hydrolysis reactions are faster than

102
the uncatalyzed reaction. PDAAP and PNIPAM-c-PDAAP copolymers catalyzed
reactions are significantly faster than that catalyzed by 4-PPY. This is attributed to the
decreased pKa of macromolecular DAAPs. Of the polymeric catalysts, the homopolymer
PDAAP has the fastest rate. The PNIPAM-c-PDAAP copolymers’ activity decreases as
the mole fraction of DAAP in the copolymers decreases.
Time (min)0 10 20 30 40 50 60
Con
vers
ion
0.0
0.1
0.2
0.3PDAAP 5:2 copolymer 14:1 copolymer 20:1 copolymer 4-PYY control
Figure 31. Hydrolysis of 4-nitrophenyl octanoate in pH 8 tris buffer at 20 °C by different 4-N,N-(dialkylamino)pyridine catalysts.
Kinetic studies were also carried out in a pH 9 tris buffer to determine how pH
affects these catalysts’ efficiency. Figure 32 shows that all the hydrolysis reactions are
accelerated at pH 9. PDAAP and PNIPAM-c-PDAAP copolymers catalyzed reactions
however are still significantly faster than a reaction using 4-PPY. However, at pH 9, the

103
14:1 and 20:1 PNIPAM-c-PDAAP copolymers have activity that is comparable that of
PDAAP and the 5:2 PNIPAM-c-PDAAP copolymer.
Time (min)0 10 20 30 40 50 60
Con
vers
ion
0.0
0.1
0.2
0.3
0.4
0.5
PDPPA 5:2 copolymer14:1 copolymer20:1 copolymer4-PPY control
Figure 32. Hydrolysis of 4-nitrophenyl octanoate in pH 9 tris buffer at 20 °C by different 4-N,N-(dialkylamino)pyridine catalysts.
Both Figures 31 and 32 shows that the PNIPAM supported 4-PPY catalysts 13
have an enhanced catalytic activity compared to the low molecular weight catalyst 4-
PPY even with low catalyst loading (20:1). These PNIPAM supported 4-PPY catalysts
are also recyclable as shown by using 14:1 PNIPAM-c-PDAAP copolymer in the
acylation reaction of 2,6-di-tert-butylphenol shown (eq 7).

104
In this recycling experiment, PNIPAM’s solubility properties were used to
recover the PNIPAM supported catalyst 13. PNIPAM has good solubility in most of
organic solvents but is insoluble in nonpolar solvents like hexane and ethyl ether. In our
previous studies, we had used solvent precipitation to fractionate PNIPAM samples for
studies of solute effects on LCSTs. Such techniques also serve to separate and isolate a
PNIPAM-supported DMAP catalyst. After we carried out the reaction showed in eq 7
with CH2Cl2 as solvent, simple pouring the reaction mixture into hexane served to
precipitate the PNIPAM-supported catalyst 13. This catalyst could be isolated by
filtration and then redissolved in CH2Cl2 and used again as catalyst. We recycled the
14:1 PNIPAM-c-PDAAP catalyst five times by this solvent precipitation method with no
loss in activity. GC analyses at 1 h reaction time showed that the product yields of 2,6-
diisopropylphenyl carbonate in each cycle were greater than 95%.
Liquid/liquid thermomorphic separation can also be used to recycle the catalyst
13. A liquid/liquid thermomorphic separation uses two solvents that are immiscible at
room temperature but are miscible at elevated temperature. Examples of the
thermomorphic solvent systems include N,N-dimethylformamide (DMF)/heptanes and
DMSO/cyclohexane. Previous studies carried out by our group had demonstrated that a

105
dye-labeled PNIPAM-supported catalyst like 10 dissolved selectively in polar DMF-rich
phase when it was placed in a liquid/liquid biphasic mixture of DMF and heptane at 25
°C. However, 10 was soluble in the homogeneous solvent mixture of DMF/heptanes that
formed on heating this solvent mixture to 70 °C. 10 was successfully used to catalyze the
reaction showed in eq. 7 at 70 °C in DMF/heptanes. On cooling of this thermomorphic
mixture back to 25 °C, catalyst 10 stayed in the DMF-rich phase while the relatively
nonpolar 2,6-diisopropylphenyl carbonate product was enriched in the heptane-rich
phase. After a simple separation of the heptanes-rich phase, addition of fresh heptanes
and substrates with a second heating and cooling cycle allowed for a simple recycling
strategy. The same heating and cooling cycle also worked with the PNIPAM-supported
PNIPAM-c-PDAAP catalyst 12 (14:1 NIPAM: DAAP). Using 12 on the same acylation
reaction showed in eq. 7 in DMF/heptane was successful over four cycles affording 2,6-
diisopropylphenyl carbonate product after 40 min in > 95% yield. Physical loss of the
catalyst during the separation process was the only recycling problem seen in small scale
reaction.
Poly(N-isopropylacrylamide)-c-poly(2,2,6,6-tetramethylpiperidineoxylacrylamide)
(PNIPAM-c-PTEMPOAM) – a Temperature and Redox Responsive Polymer
Our earlier studies showed that subtle changes in polymer microstructure can
significantly affect PNIPAM solubility. The studies described in this section show that
structural it is also possible to design polymers whose solubility can be controlled by
reversible oxidation/reduction chemistry. This was accomplished by incorporating
nitroxyl groups as redox-sensitive copolymers into a PNIPAM polymer. A nitroxyl

106
group like 2,2,6,6-tetramethylpiperidinoxyl (TEMPO) can readily be reversibly oxidized
to a oxoammonium salt or reduced to a hydroxyl amine under mild conditions (Scheme
13). The reversible oxidation process where a oxoammonium salt is reversibly reduced
to a hydroxyl amine is the basis of the chemistry of TEMPO oxidation organocatalysts
often used in organic synthesis.186 This chemistry (shown for TEMPO in Scheme 13) has
also been used by Nishide in the design of polymers that are useful as new battery
materials.187 Polymeric versions of the TEMPO species like those shown in Scheme 13
can be used both as recyclable redox catalysts and as materials for rechargeable
batteries. This suggests that nitroxyl-containing copolymers are promising targets for
the synthesis of copolymers with reversible oxidation/reduction solubility.
Scheme 13. Redox behavior of TEMPO.
Since the paramagnetic nitroxyl-containing monomers would affect a radical
polymerization, we opted to prepare the radical-containing PNIPAM-c-PTEMPOAM
copolymers (15) by using chemistry illustrated in Scheme 11 c. We have used this
synthetic approach earlier to prepare libraries of poly(N-alkylacrylamide)s to probe the
effects of N-alkyl group size on poly(N-alkylacrylamide) phase selective solubility.188
This chemistry (Scheme 14) involved the initial synthesis of poly(N-
acryloxysuccinimide) (PNASI) through AIBN initiated radical polymerization. This
PNASI (14) was then allowed to react with a mixture of isopropylamine and 4-amino-

107
TEMPO to form nitroxyl-containing copolymer 15. While the resulting paramagnetic
copolymer 15 could not be analyzed by 1H NMR spectroscopy, a second reaction with
the same sample of PNASI could be used to form polymer 16 using the same ratio of
isopropyl-amine and 4-amino-2,2,6,6-tetramethylpiperidine. We had earlier shown that
the electrophilic active esters in polymers like 14 preferentially react with less hindered
amines,6 so both the 4-amino-TEMPO and 4-amino-2,2,6,6-tetramethylpiperidine were
expected to react via their primary amine group to form amides. While the product
copolymer 15 of interest in our studies of redox-sensitive LCST behavior cannot be
readily analyzed by 1H NMR because it is paramagnetic, the product copolymer 16 was
amenable to 1H NMR analysis which showed the ratio of isopropyl/piperidyl groups was
90:10. Copolymer 15 should have a nearly identical 90:10 ratio of isopropyl/TEMPO
groups.
Scheme 14. Synthesis of redox-active PNIPAM copolymers.
GPC analysis of the copolymers 15 and 16 showed that they had a Mn of 179 kDa
with a PDI of 1.76. The polymer 15 was also analyzed by cyclic voltammetry and had
redox behavior identical to that reported for a low molecular weight TMPO (0.63 V vs.

108
Ag/AgCl) with potential of 0.66 V vs. Ag/AgCl (Figure 33a).189-191 Polymer 11 was also
characterized by ESR spectroscopy and exhibited the characteristic 3-line spectrum of a
nitroxyl group (Figure 33b).192
Potential (V vs. Ag/AgCl)0.20.40.60.81.01.2
Cur
rent
(μA)
-10
-8
-6
-4
-2
0
2
4
6
8
a
Magnetic Field (G)3320 3340 3360 3380 3400 3420
b
Figure 33. Instrumentation characterization of copolymer 15: (a) Cyclic voltammogram of 15 in aqueous solution measured with a glassy carbon electrode and a Pt wire electrode at 0 °C. The sweep rate is 10 mV/s and the supporting electrolyte was 0.1 M KCl; (b) Electron spin resonance spectrum of polymer 15 in THF at room temperature.
The LCSTs of the copolymers 15 and 16 were then analyzed using a digital
melting point apparatus described in Chapter II. A 10 mg/mL aqueous solution of 15
had a LCST of 23.1 °C at 10% clouding while solution of 16 with the same
concentration did not show cloudiness even at boiling temperature. When a kosmotropic
salt, in this case, Na2SO4 was added to solution of 16, cloudiness was observed and the
clouding temperatures decreased as Na2SO4 concentrations increased. On the other
hand, when 10 µL 0.8 M ascorbic acid was added to 1 mL 10 mg/mL solution of radical
copolymer 15, only very faint cloudiness was observed. The change of the clouding
behavior of 15 suggests that the nitroxyl groups in copolymer 15 have been reduced to

109
more hydrophilic hydroxylamine groups. In order to observe the effect of reducing agent
to the LCST of copolymer 15, 0.1 M Na2SO4 was added to the solution of 15 to enhance
the cloudiness, which lowered the LCST of 15 from 23.1 to 18.3 °C. Subsequent
analyses of clouding behavior of 15 with the addition of ascorbic acid and then
K3[Fe(CN)6] were all carried out in the presence of this small amount of Na2SO4.
Separate LCST analyses using a PNIPAM sample (Mn =322 kDa, PDI=1.06 by GPC)
showed that addition of this low concentration of Na2SO4 perturbed the clouding curve
of PNIPAM by 4.3 °C but did not alter the effect of ascorbic acid or K3[Fe(CN)6] to the
LCSTs of PNIPAM. The control experiments will be discussed in detail later.
Reduction of the nitroxyl-containing polymer 15 with ascorbic acid forms the
hydroxylamine-containing polymer 17 and oxidation of it will form the oxidation
product 18. As expected, this redox chemistry affects the LCST of solutions that initially
contained 10 mg/mL of 15. This is illustrated in Figure 34 that shows a 14 °C change in
the solution's LCST behavior as increasing amounts of ascorbic acid are added to 15 to
form polymer 17. Reoxidation of the hydroxylamine-containing polymer 17 by
K3[Fe(CN)6] largely reverses the changes of the LCST seen on reduction (Figure 35).

110
Addition of 48 mM of K3[Fe(CN)6] to solution presumably containing 17 made a 10 °C
decrease of the solution’s LCST.
Figure 34. Clouding curves for a 10 mg/mL sample of polymer 15 with 0.1 M Na2SO4 in solutions that contain increasing amounts of ascorbic acid. The ascorbic acid concentrations vary from left to right with concentrations of 0, 1.6, 3.2, 6.4, 9.6, 14.4, and 19.2 mM. Na2SO4 is used to enhance the samples’ cloudiness.
Figure 35. Clouding curves for a 10 mg/mL sample of polymer 15 with 19.6 mM ascorbic acid and 0.1 M Na2SO4 in solutions that contain increasing amounts of K3[Fe(CN)6]. The K3[Fe(CN)6] concentrations vary from right to left with concentrations of 0, 4, 12, 20, 24, 28, 32, 40, and 48 mM.
Temperature (οC)20 25 30 35 40
Sca
tterin
g In
tens
ity (%
)
0.0
0.2
0.4
0.6
0.8
1.0
0 mM1.6 mM3.2 mM6.4 mM9.6 mM14.4 mM19.2 mM
Temperature (οC)20 25 30 35 40
Sca
tterin
g In
tens
ity (%
)
0.0
0.2
0.4
0.6
0.8
1.0
0 mM4 mM12 mM20 mM24 mM28 mM32 mM40 mM48 mM
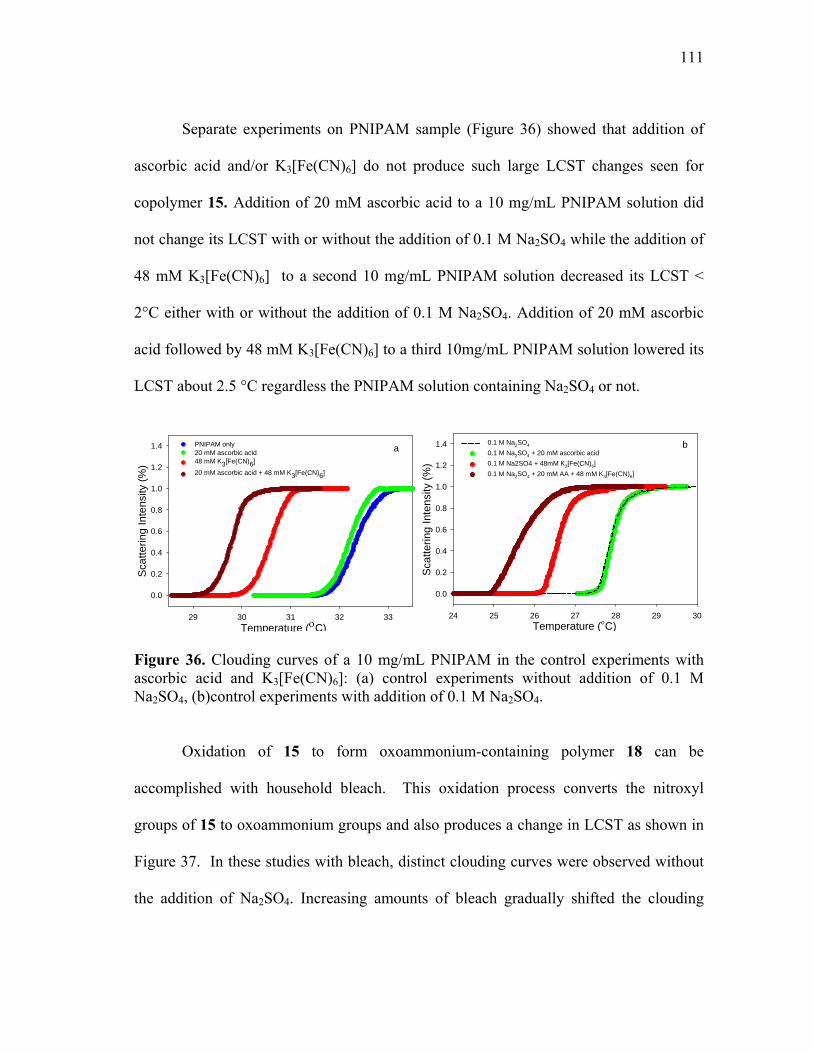
111
Separate experiments on PNIPAM sample (Figure 36) showed that addition of
ascorbic acid and/or K3[Fe(CN)6] do not produce such large LCST changes seen for
copolymer 15. Addition of 20 mM ascorbic acid to a 10 mg/mL PNIPAM solution did
not change its LCST with or without the addition of 0.1 M Na2SO4 while the addition of
48 mM K3[Fe(CN)6] to a second 10 mg/mL PNIPAM solution decreased its LCST <
2°C either with or without the addition of 0.1 M Na2SO4. Addition of 20 mM ascorbic
acid followed by 48 mM K3[Fe(CN)6] to a third 10mg/mL PNIPAM solution lowered its
LCST about 2.5 °C regardless the PNIPAM solution containing Na2SO4 or not.
Figure 36. Clouding curves of a 10 mg/mL PNIPAM in the control experiments with ascorbic acid and K3[Fe(CN)6]: (a) control experiments without addition of 0.1 M Na2SO4, (b)control experiments with addition of 0.1 M Na2SO4.
Oxidation of 15 to form oxoammonium-containing polymer 18 can be
accomplished with household bleach. This oxidation process converts the nitroxyl
groups of 15 to oxoammonium groups and also produces a change in LCST as shown in
Figure 37. In these studies with bleach, distinct clouding curves were observed without
the addition of Na2SO4. Increasing amounts of bleach gradually shifted the clouding
Temperature (οC)29 30 31 32 33
Sca
tterin
g In
tens
ity (%
)
0.0
0.2
0.4
0.6
0.8
1.0
1.2
1.4 PNIPAM only20 mM ascorbic acid48 mM K3[Fe(CN)6]
20 mM ascorbic acid + 48 mM K3[Fe(CN)6]
a
Temperature (οC)24 25 26 27 28 29 30
Sca
tterin
g In
tens
ity (%
)
0.0
0.2
0.4
0.6
0.8
1.0
1.2
1.4 0.1 M Na2SO4
0.1 M Na2SO4 + 20 mM ascorbic acid0.1 M Na2SO4 + 48mM K3[Fe(CN)6]0.1 M Na2SO4 + 20 mM AA + 48 mM K3[Fe(CN)6]
b

112
curves to higher temperatures. With the addition of 30 µL household bleach straight out
of bottle, the clouding temperature at 10 % clouding intensity increased from 23.1 to
39.3 °C. However, reversal of this oxidation process was not successful, perhaps because
the NaOCl solution irreversibly modifies the secondary amides present in polymer 15.
Or perhaps reduction of 18 back to 15 will not just stop at 15 but go further to form 17 as
well. Separate bleach experiments with PNIPAM solution showed that addition of
bleach actually decreased the LCST of PNIPAM solution (Figure 38).
Figure 37. Clouding curves for a 10 mg/mL sample of polymer 15 in solutions that contain increasing amounts of bleach. The amount of bleach varies from left to right with volume of 0, 5, 10, 15, 20, 25, and 30 µL.
Temperature (οC)20 25 30 35 40 45
Sca
tterin
g In
tens
ity (%
)
0.0
0.2
0.4
0.6
0.8
1.0
0 μL5 μL10 μL 15 μL20 μL25 μL30 μL
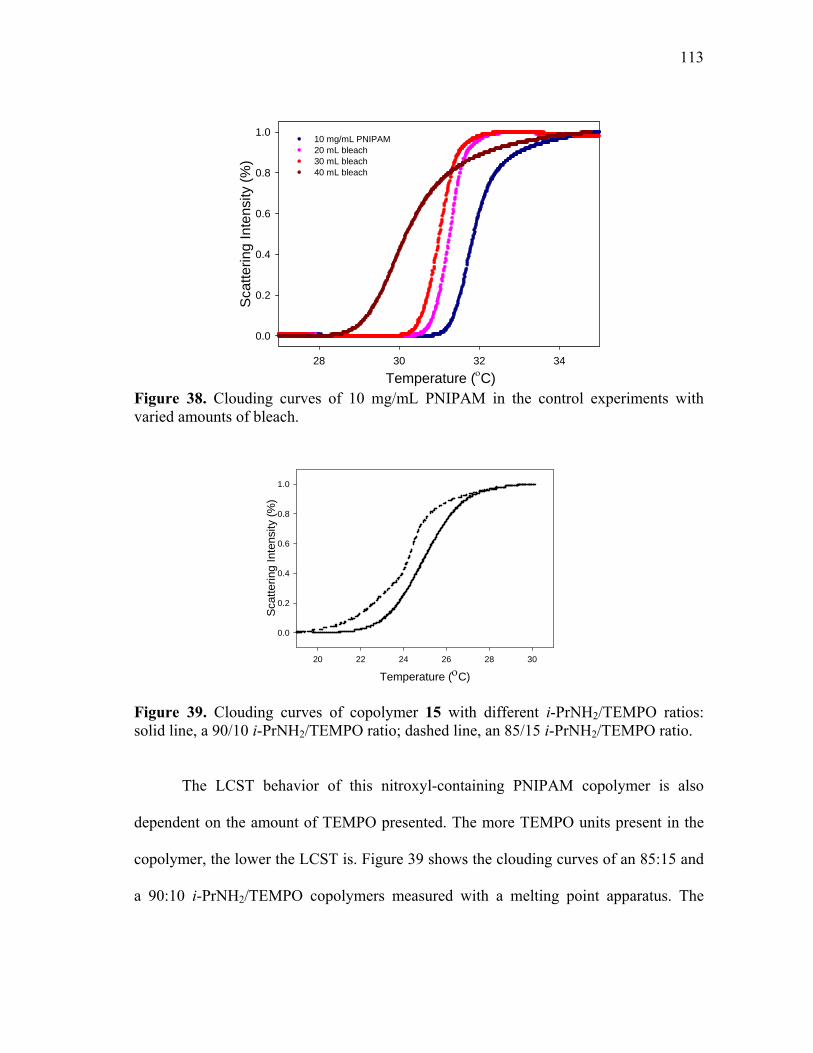
113
Figure 38. Clouding curves of 10 mg/mL PNIPAM in the control experiments with varied amounts of bleach.
Temperature (οC)20 22 24 26 28 30
Sca
tterin
g In
tens
ity (%
)
0.0
0.2
0.4
0.6
0.8
1.0
Figure 39. Clouding curves of copolymer 15 with different i-PrNH2/TEMPO ratios: solid line, a 90/10 i-PrNH2/TEMPO ratio; dashed line, an 85/15 i-PrNH2/TEMPO ratio.
The LCST behavior of this nitroxyl-containing PNIPAM copolymer is also
dependent on the amount of TEMPO presented. The more TEMPO units present in the
copolymer, the lower the LCST is. Figure 39 shows the clouding curves of an 85:15 and
a 90:10 i-PrNH2/TEMPO copolymers measured with a melting point apparatus. The
Temperature (οC)28 30 32 34
Sca
tterin
g In
tens
ity (%
)
0.0
0.2
0.4
0.6
0.8
1.010 mg/mL PNIPAM20 mL bleach30 mL bleach40 mL bleach

114
shifting of the clouding curves to a lower temperature with a slight increase of the
TEMPO amount in the copolymer suggests that the LCST of this nitroxyl-containing
PNIPAM copolymer do depend on the polymer composition and the melting point
apparatus used in this research is sensitive to detect these differences.
Poly(N-isopropylacrylamide)-c-poly((N-benzo-15-crown-5)acrylamide) (PNIPAM-
c-PB15C5AM) – an Cation Selective Copolymer for Synthesis of Responsive
Surfaces
PNIPAM alone exhibits excellent stimuli-responsiveness to the changes of
temperature, cosolutes and solvent compositions. Addition of other kinds of functional
groups onto PNIPAM chain as in the copolymer 15 shown above can broaden this
chemistry. We also thought it would be of interest to explore molecular recognition
based responsiveness. In this section, a crown ether-containing PNIPAM copolymer,
poly(N-isopropylacrylamide)-c-poly((N-benzo-15-crown-5)acrylamide) (PNIPAM-c-
PB15C5AM) 19 was used to prepare nanocomposite graft surfaces using the covalent
layer-by-later assembly method describe in earlier chapters. Since crown ethers have
been shown that they differentially form complexes with different alkali cations because
of the binding constant differences,193-195 we expected that the nanocomposite surfaces
prepared using 15-crown-5 ether-containing PNIPAM might also show some sort of ion-
specific responsiveness.

115
The covalent layer-by-layer assembly procedure used in this section to prepare
PNIPAM-c-PB15C5AM/SiO2 nanocomposite surfaces is illustrated in Scheme 15.
Scheme 15 is different from Scheme 10 in Chapter III in that instead of using i-PrNH2
after each PNIPAM-c-PNASI/SiO2 bilayer treatment to convert unreacted NASI to
NIPAM, 4-amino-benzo-15-crown-5 was used to form the N-benzo-15-crown-5-
acrylamide (B15C5AM). Silicon wafers were also used as substrates in this section for
surface grafting. The same functionalization procedure for silicon wafer was followed as
described in Chapter V. Also, the same 9:1 NIPAM/NASI PNIPAM-c-PNASI (Mw = 30
kDa) copolymer and aminated silica nanoparticles (10- and 100-nm diameter) used
earlier for nanocomposite surface grafting were also used in this covalent assembly as
electrophiles and nucleophiles respectively. The nanocomposite graft that we prepared
for this study is denoted as SW/[PNIPAM-c-PB15C5AM/SiO2]6/PNIPAM-c-
PB15C5AM. This nomenclature indicates that six polymer/SiO2 bilayers are grafted and
that the functional polymer in this graft is PNIPAM-c-PB15C5AM copolymer.

116
Scheme 15. Covalent layer-by-layer assembly of a SW/(PNIPAM-c-PB15C5AM/SiO2)n/PNIPAM-c-PB15C5AM nanocomposite graft. The final structure is not drawn to scale.
I expected that the PNIPAM-c-PB15C5AM copolymer that have pendent crown
ether groups that would serve as sensors binding differently to different cations and that
the NIPAM groups will serve as actuators to provide visible macroscopic changes.196
Prior work by Niu and coworkers had earlier shown that PNIPAM-c-PB15C5AM
copolymer had cation-responsiveness in aqueous solution.193 They found out that this
copolymer’s LCST decreased with the addition of alkali metal nitrate salts and the
effects of the cations was correlated to strength of the metal/crown ether binding. The
order of significance of the effect of alkali metal ions to decrease the PNIPAM-c-
PB15C5AM LCST was K+ >> Cs+ > Na+ > Li+. The greater the binding is, the more
significant the cation is in lowering the LCST. Other groups had also used crown ether-

117
containing PNIPAM copolymer to fabricate a molecular recognition ion gating
membrane.197,198 For example, poly(N-isopropylacrylamide)-c-poly(benzo-18-crown-6-
acrylamide) functionalized porous polyethylene films responded selectively to K+ or
Ba2+. To study how a PNIPAM-c-PB15C5AM/SiO2 nanocomposite surface would
respond to different alkali metal ions, we measured the advancing contact angles (Θα) of
this surface with series solutions of alkali metal chloride salts. As discussed in previous
chapters, the roughness enhanced PNIPAM/SiO2 nanocomposite grafts prepared by our
covalent layer-by-layer assembly method can change from hydrophilic to very
hydrophobic by varying salt solution concentrations or salt identity. Since changes in
crown ether/alkali metal cation binding can change the PNIPAM-c-PB15C5AM
copolymer’s LCST, I expected that the SW/[PNIPAM-c-PB15C5AM/SiO2]6/PNIPAM-
c-PB15C5AM nanocomposite surface would also show different wetting behavior in
response to the treatment of different alkali metal salt solutions. The results of alkali
metal chlorides on the wettability of SW/[PNIPAM-c-PB15C5AM/SiO2]6/PNIPAM-c-
PB15C5AM nanocomposite surface are shown in Figure 40. The advancing contact
angles were measured three times for each concentration of the alkali chlorides on
random spots of the same SW/[PNIPAM-c-PB15C5AM/SiO2]6/PNIPAM-c-PB15C5AM
nanocomposite surface. The as prepared crown ether-containing nanocomposite surface
had a advancing contact angles (Θa) of 68° with water which was about 8° smaller than
the Θa of water (~ 76°) in a PNIPAM nanocomposite surface. This ΔΘa indicate that
incorporating the 15-crown-5 ether onto the PNIPAM graft make the PNIPAM/SiO2
nanocomposite surface more hydrophilic. Figure 40 shows that all four alkali chloride

118
salts increased the advancing contact angles when increasing salt concentrations on this
PNIPAM-c-PB15C5AM functionalized nanocomposite surface. However, no difference
was seen between Na+ and K+ in their ability to change the wettability of a PNIPAM-c-
PB15C5AM functionalized nanocomposite surface. But Li+ and Cs+ had noticeable
smaller effects on changing the surface wettability than Na+ and K+.
Salt Concentration (M)0.6 1 1.4 2 3
Adva
ncin
g C
onta
ct A
ngle
(deg
)
0
20
40
60
80
100
120
140
160
180
LiCl NaCl KCl CsCl
Figure 40. Advancing contact angles of SW/[PNIPAM-c-PB15C5AM/SiO2]6/PNIPAM-c-PB15C5AM nanocomposite surface measured with different alkali metal chlorides at varied concentrations.
Control experiments using a PNIPAM functionalized nanocomposite graft –
SW/[PNIPAM/SiO2]6/PNIPAM – were also carried out with the same alkali metal
chlorides. The results (Figure 41) show that Na+, K+ and Cs+ halid solutions are similar
in their ability to change the wettability of the SW/[PNIPAM/SiO2]6/PNIPAM
nanocomposite surface. Only Li+ has a significantly different cation effect which is
smaller than the effects of Na+, K+ and Cs+ on the wettability of

119
SW/[PNIPAM/SiO2]6/PNIPAM nanocomposite surface. The cation effects of the alkali
metal ions on wettability of this SW/[PNIPAM/SiO2]6/PNIPAM nanocomposite surface
are like the alkali cation effects on the LCST of PNIPAM solution reported by Freitag et
al. They investigated the effects of five alkali metal hydroxides and five alkali metal
chlorides on the cloud point temperature of PNIPAM oligomers. These authors noted
that variation of alkali cations, with the exception of Li+, had little difference in
depressing PNIPAM’s LCST.
Figure 41. Advancing contact angles of SW/[PNIPAM/SiO2]6/PNIPAM nanocomposite surface measured with different alkali metal chlorides at varied concentrations.
However, CsCl shows measurable smaller cation effect on the wettability of the
SW/[PNIPAM-c-PB15C5AM/SiO2]6/PNIPAM-c-PB15C5AM nanocomposite surface
than NaCl and KCl do in Figure 40. The difference seen for CsCl on the wettability of
the SW/[PNIPAM-c-PB15C5AM/SiO2]6/PNIPAM-c-PB15C5AM nanocomposite
Salt Concentration (M)1 1.4 2
Adva
ncin
g C
onta
ct A
ngle
(deg
)
0
20
40
60
80
100
120
140
160
180LiCl NaCl KCl CsCl

120
surface (Figure 40) and the SW/[PNIPAM/SiO2]6/PNIPAM nanocomposite surface
(Figure 41) might be due to the smaller binding of 15-crown-5 ether to Cs+. This
speculation was drawn based on the observation that in solution the formation of 15-
crown-5 ether/metal ions complexes shifted the PNIPAM-c-PB15C5AM’s LCST to
lower temperature as mentioned earlier.193 This is only preliminary result for using 15-
crown-5 ether-containing PNIPAM to construct a cation-selective responsive surface.
The numbers of incorporated 15-crown-5 ethers to the PNIPAM chains are difficult to
quantify by using the assembly procedure shown in Scheme 14. An alternative assembly
procedure can use polymer 20 shown below as the electrophile for the covalent layer-by-
layer assembly procedure. Since polymer 20 can be characterized before using it for the
grafting, we can make the SW/[PNIPAM-c-PB15C5AM/SiO2]6/PNIPAM-c-PB15C5AM
nanocomposite surface with a controllable amount of 15-crown-5 ethers on the grafted
surface. More researches need be carried out in the future.
Conclusion
In this chapter, I have shown examples of PNIPAM copolymers with different
functional groups and shown how incorporating functional groups into PNIPAM can be

121
used to advantage. By attaching an appropriate functional group to the PNIPAM chain,
different applications based on PNIPAM’s property can be realized. Specially, the
poly(N-isopropylacrylamide)-c-poly(4-(N,N-diallylamino)pyridine) copolymer were
shown to be useful as recyclable organocatalysts. I also showed that these catalysts are
recyclable by solvent precipitation or by using a thermomorphic solvent system. The
poly(N-isopropylacrylamide)-c-poly(2,2,6,6-tetramethylpiperidineoxylacrylamide) is a
radical-containing redox sensitive copolymer. Its LCST can be tune higher or lower
depending on its redox state. Finally, poly(N-isopropylacrylamide)-c-poly((N-benzo-15-
crown-5)acrylamide) was used in an attempt to prepare cation-selective responsive
nanocomposite surface. The advancing contact angle measurement showed that the Cs+
had some sort of cation-selective responsiveness on the wettability of PNIPAM-c-
PB15C5AM grafted nanocomposite surface but more studies are need to get a true
conclusion.
122
CHAPTER VII
SUMMARY AND EXPERIMENTAL SECTION
Summary
In this dissertation, I described the development of a clouding point assay by
using a simple digital melting point apparatus for analysis of phase separations that
generate clouding curves. I had shown that in cases where the clouding simply shifts as a
function of the heating rate of the analysis, it is possible to use the data from these
analyses to generate ‘corrected’ clouding point curves that approximate the phase
separation at an infinitely slow heating rate. The temperature range of the apparatus also
allows for analyses at much higher temperatures and provides a simple way to examine
irregular clouding behavior in more complex systems. This clouding point assay was
further used in the studies of LCSTs of thermoresponsive polymers. The effects of
various sodium anion salts on the LCST of the triblock copolymer Pluronic® 10R5
followed the Hofmeister series, which is in accordance with our previous results
showing that the anion salt effects on PNIPAM solution is essential a Hofmeister effect.
The less studied cation effects on the LCST of thermoresponsive polymers were also
carried out by addition of sulfate cation salts to PNIPAM solutions. The results showed
that cations also have distinct and comparable effects on the LCST of PNIPAM. When
the salt activity was under consideration, the cation effects were determined by the
cation charge density and the ability of cation in lowing the LCST followed the order of
trivalent > divalent > monovalent.

123
A radical-containing PNIPAM copolymer, PNIPAM-c-PTEMPOAM was
synthesized and the effects of redox state on the LCST of this copolymer were studied.
The shifting of the clouding curves with the addition of oxidizing or reducing reagents
was analyzed by using the automatic melting point apparatus. The results showed that
incorporation of redox-active TEMPO moiety in the PNIPAM chain leaded to a material
that had reversible redox-sensitive LCST behavior. The observed LCSTs of the
TEMPO-containing PNIPAM copolymers at different oxidation states varied from 18 to
40 °C. This large temperature variation could be useful in design of redox-sensitive
materials for drug delivery application in vivo and in synthesis of surfaces with redox-
mediated wettability.
PNIPAM had also been grafted on surface by using covalent layer-by-layer
assembly method. The nanocomposite surface prepared with PNIPAM and silica
nanoparticles combined both the surface roughness and responsiveness. As mentioned
before, PNIPAM’s solubility can be affected by the addition of salts and the salt effects
on its solubility followed the Hofmeister effect. The wettability of a PNIPAM grafted
surface is expected to be affected by applying different salts on this surface. Our results
discussed in Chapter III and IV showed that the wettability of the PNIPAM/SiO2
nanocomposite surfaces responded to the salt identity and salt concentration. In general,
the higher the concentration of the solution of a chosen salt applied to the nanocomposite
surface, the more hydrophobic the surface became. The effectiveness of the salts in
changing the surface wettability is depended on the identity of the salts. For anion salts
with sodium as common cation, the anion effects followed the Hofmeister series. For
124
cation salts with sulfate as common anion in our studies, the results showed that effects
of varying the cation were comparable with the anion effects. When the salt solution
activity was under consideration, the cation effects were determined by the cation’s
charge number and the order of the effect of cations in increasing the surface wettability
followed trivalent > divalent > monovalent. The parallel studies of the cation effects on
the solubility of PNIPAM solutions were also carried out. The LCSTs of PNIPAM
solution with different cation salts were analyzed by using the automatic digital melting
point apparatus as described in Chapter II. The cation effects in PNIPAM solution
parallel the cation effects on PNIPAM grafted nanocomposite surfaces.
Experimental Section
Synthesis and fractionation of PNIPAM. A solution of 10 g (89 mmol) of
recrystalized N-isopropylacrylamide and 50 mg (0.3 mmol) of 2,2’-
azobisisobutyronitrile (AIBN) in 200 mL of tert-butylalcohol was degassed three times
and heated to70 °C under positive pressure of N2. After 18 h the tert-butylalcohol was
removed under reduced pressure and the crude polymer product was dried under
vacuum. The crude product was reprecipitated from 100 mL THF into 1 L of hexanes to
remove any unreacted monomers or oligomers and the yield of the pure polymer was >
95%. 1H NMR (CDCl3) δ 1.18 (bs, 6H), 1.40-2.25 (bm, 3H), 4.00 (bs, 1H).
The product polymer was fractionated into several samples with different
molecular weights by selective solvent precipitation as described previously.30 One of
the fractions was used in the studies described in Chapter II and was characterized by
GPC and laser light scattering. It had a Mw of 322 kDa by GPC analysis and a Mw of

125
395 kDa by laser light scattering analysis. The PDI of this fractionated PNIPAM sample
was 1.06 calculated from GPC analysis.
Molecular weight measurement of PNIPAM by laser light scattering. Laser
light scattering experiments were performed with a Brookhaven Instruments BI-200SM
goniometer equipped with a Melles Griot HeNe laser. The samples were dissolved in
HPLC grade THF one day before the light scattering measurements. Generally, five THF
solutions with different concentrations were prepared for each polymer sample. Each
sample solution was filtered by a 0.2 µm PTFE filter before adding it to the sample cell
for the analysis. Data of laser light scattering intensity was collected at a series of
scattering angles ranged from 30 to 150 deg with a 15 deg increment. The Mw was
calculated from the Zimm plots using the instrument’s software.
Gel permeation chromatography (GPC) analysis of polymer molecular
weight. GPC analyses for all the polymers I made in this dissertation were carried out on
a Viscotek GPC instrument with a Viscotek I-MBMMW-3078 mixed bed column in
THF. In a typical analysis, 15.0 mg of the polymer was dissolved in 5.0 mL of degassed
THF 24 h before the analysis. 100 µL of this sample solution was then injected into the
sample loop after filtering through a PTFE filter (0.45 µm in pore size). Triple detectors
included a viscometer, a refractometer and a low angle laser light scattering were used
together to obtain data which was then used by the OmniSEC software to calculate the
polymer molecular weight. The GPC was calibrated with a polystyrene standard
periodically.

126
Melting point apparatus and LCST measurements. An OptiMelt automatic
melting point apparatus from Stanford Research Systems was used for all the LCST
analyses in this dissertation.17 This apparatus uses a digital image processor to detect the
light scattering that occurs as a sample changes from a scattering solid to a liquid. Since
an aqueous solution of PNIPAM during an LCST process exhibits analogous changes in
its optical characteristics, this same melting point apparatus can determine an LCST and
produce a clouding curve. Other features of this apparatus include linear temperature
ramping and accurate temperature readings with 0.1 °C resolution. In a typical
experiment, 8 uL of a polymer solution was introduced to a regular capillary melting
point tube (Kimble 1.5-1.8 x 90-mm) using a microsyringe and the tube was sealed
before placing it into the sample holder. Three sealed sample tubes were placed into the
sample holders for simultaneous measurements of their clouding curves at the desired
heating rate. During the heating process, the thermoresponsive polymers underwent
phase transitions that changed the optical characteristics of the samples. The digital
image processing on board the melting point apparatus analyzed the intensity changes
and produced a graph of the percent light scattering versus temperature. The resulting
usually sigmoidal curve of the extent of clouding and the data for specific scattering
percentages was then used in our LCST studies. The supplied MeltView software
transferred and stored the real-time images of the samples to a computer during the
analysis. The software bundles all sample images together as a single package file and
the file can be recalled at anytime to play back the phase transition process, frame-by-
frame or as continuous movies. Such movies can provide a visual record of the phase

127
changes and allow qualitative differentiation of the phase separation process in milieu as
similar as H2O, 50/50 (v/v) H2O/D2O, and in pure D2O. The reproducibility of phase
transition behavior was monitored either by removing the tube from the apparatus and
letting the polymer redissolve or by preparing a fresh sample. Repetition of the LCST
measurement the same day or after several days using the same heating rate gave curves
that were identical to the original curves.
Synthesis of N-acryloxysuccinimide monomer. This monomer was prepared
from acrolyl chloride and N-hydroxysuccinimide following a literature procedure.1 At 0
°C, acryloyl chloride (7.5 mL) was added dropwise to a stirred solution of N-
hydroxysuccinimide (10 g) and triethylamine (12 mL) in dichloromethane (125 mL) by
an addition funnel under nitrogen. The reaction was carried out at 0 °C for about 20 min
and then allowed to reach room temperature and stirred for another hour. The reaction
mixture was filtrated and washed with cold water (5 mL) and dichloromethane (10 mL)
mixture. The filtrate was then washed with cold water (80 mL x 2) and cold brine (80
mL x 2) in a separatory funnel. The organic layer was dried with magnesium sulfate and
the solvent was removed by rotary evaporation until about 20 mL left. The resulting
solution was cooled to 0˚C and precipitated by adding 25 mL hexane/ethyl acetate mix
(6:1). The solids were filtrated, washed with more hexane and then dried in oven under
vacuum overnight. The resulting product yield was > 95%.
Synthesis of poly(N-acryloxysuccinimide) (PNASI) via free radical
polymerization. A solution of N-acryloxysuccinimide (8.0 g, 47 mmol) and 2,2’-
azobisisobutyronitrile (40 mg, 0.24 mmol) in 200 mL of benzene was degassed three
128
times by flushing with nitrogen for 20 min and then putting under vacuum for ~15 sec.
Then the solution was heated to 70° and stirred for 24 h under positive N2 pressure. The
resulting mixture was allowed to cool to room temperature. The white precipitate of
polymer product formed was collected by filtration, washed with benzene and THF and
then dried under vacuum to yield 7.8 g (99 %) of the desired polymer. 1H NMR (d-
DMSO): δ 2.05 (bs, 2H), 2.80 (bs, 4H), 3.13 (bs, 1H). ATR-IR (powder): 1813, 1782,
1734, 1204, 1068, 648 cm-1.
Synthesis of poly(N-isopropylacrylamide)-c-poly(N-acryloxysuccinimide)
from PNASI. A solution of isopropylamine (1.8 mL, 21.5 mmol) in 10 mL of DMF was
added to a solution of poly(N-acryloxysuccinimide) (4.0 g, 24 meq of NASI) in 80 mL
of DMF. The resulting solution was stirred at room temperature for 18 h during which
time some precipitate formed. The mixture was filtered to remove the precipitate. Then
the 90 mL of the supernatant solution was added dropwise to 2 L of ethyl ether at room
temperature to precipitate the copolymer. The precipitate of the desired copolymer was
then isolated by filtration and redissolved in 100 mL of THF and again reprecipitated in
2 L of hexanes. This process was repeated 2 times, yielding 2.6 g (92 %) of the
copolymer. The mole fraction of NIPAM and NASI groups in the copolymer was
analyzed by 1H NMR spectroscopy. Based on the ratio of the integrals for the broad
singlet at δ 4.02 ppm (1 H, NIPAM –NHCH–) groups) and the peak at δ 2.61 ppm (4 H,
NASI –C(=O)CH2–), this ratio of NIPAM/NASI was 9:1. The polymer had a Mw of 30
kDa as analyzed by GPC in THF.

129
Syntheses of aminated silica nanoparticles (10 nm or 100 nm in diameter).
These materials were prepared following a literature procedure.199 In a typical procedure,
5 g of silica nanoparticles (10 nm or 100 nm in diameter) were first cleaned by placing
them in 100 mL of 5 % hydrochloric acid at room temperature overnight. The silica
nanoparticles were then recovered by filtration, washed with water, and dried under
vacuum. The dried silica nanoparticles were then added to a 10 % solution of 3-
aminopropyltriethoxysilane in 100 mL toluene. This mixture was heated to reflux
overnight. The product aminated silica nanoparticles were isolated by filtration, washed
with THF and MeOH then dried under vacuum. Titrimetric analysis of the aminated
silica nanoparticles was carried out by first suspending a weighed amount of aminated
silica nanoparticles in a 0.01 M HCl solution and shaking the mixture for 1 h. An aliquot
of the resulting HCl solution was titrated with a 0.01 M NaOH solution to a pH 9
endpoint. In this way, the amount of HCl consumed by basic groups on the aminated
silica nanoparticles could then be determined. These aminated silica nanoparticles had
amine loadings of 0.74 mmol (10 nm) and 0.19 mmol (100 nm) of base/g, respectively.
Covalent layer-by-layer self-assembly of PNIPAM-c-PNASI with aminated
silica nanoparticles on PE films. Following a literature procedure,170 an oxidized PE
film was first activated by treatment with a mixture of ethyl chloroformate and N-
methylmorpholine in DMF for 15 min. The activated PE film was removed from the
solution of excess ethyl chloroformate and then rinsed with DMF. The activated PE film
was then placed into a DMF solution of PEI (2.5 wt %) and this mixture was shaken for
30 min at room temperature. The product aminated PE film was removed from the PEI
130
solution and washed with DMF. This PEI-treated PE film was placed into a DMF
solution of PNIPAM-c-PNASI (20 wt %) for 30 min, removed from the polymer
solution and washed with DMF. The polymer treated PE film was placed in a 20 mL
DMF suspension of aminated silica nanoparticles (10 and 100 nm particles, 0.5 wt %
each and 0.5 vol % of triethylamine) and shaken for 30 min. The aminated silica treated
PE film was again removed from the aminated silica nanoparticles suspension, washed
with DMF, and placed into a DMF solution of isopropylamine (10 vol %) and shaken for
30 min. This step was designed to convert any unreacted NASI groups to NIPAM. This
isopropylamine-treated PE film was again removed from the isopropylamine solution
and then washed with DMF. This isopropylamine treated PE film could then be placed
into the PNIPAM-c-PNASI solution again for a second run of the assembly process.
This cycle of aminated silica nanoparticles treatment followed by PNIPAM-c-PNASI
treatment was repeated 5 times to obtain the PE/(PNIPAM/SiO2)5. The resulting polymer
treated PE films were treated with one more cycle of PNIPAM-c-PNASI and aminated
silica nanoparticles (10 nm particles only, 1.0 wt % and 0.5 vol % of triethylamine),
followed by isopropylamine treatment to yield the final PE/(PNIPAMP/SiO2)6/PNIPAM
nanocomposite surface.
Contact angle measurements. Static contact angles (Θ) were measured on a
KSV CAM 200 optical goniometer with an automatic single liquid dispenser at ambient
temperature. A 10 µL aqueous solution droplet size was placed on a random spot on the
surface. Photographs were taken until the droplet was no longer spreading (usually
within 2-3 min), at which point the contact angles were measured by the CAM 200

131
software. Dynamic advancing contact angles (Θa) were recorded as aqueous solution was
continuously added to a 10 µL droplet which was allowed to equilibrate with the surface
for 2 minutes before the measurement. The aqueous solution was added at a rate of 1
µL/s and the images were taken at a rate of 400 ms/frame.
Atomic force microscopy studies. All the AFM measurements were done by
Mr. Albert Wan or Dr. Xiaotong Hong from Batteas’s group. The PNIPAM/SiO2
nanocomposite surfaces grafted either on PE films or silicon wafers were characterized
by atomic force microscopy in tapping mode using a commercial AFM (Alpha300 S,
WITec, Germany). Images were collected using ultrasharp silicon AFM tips (VISTA
probes, NanoScience Instruments, Phoenix, Arizona) with nominal tip radii of < 10 nm,
a lever resonance frequency of ~ 300 kHz and a force constant of ~ 40 N/m. The tip was
modified with octadecyltrichlorosilane (OTS) prior to the measurement to minimize the
adhesion between the tip and the polymer surface. To coat the tips, they were immersed
in a NH4OH/H2O2/H2O solution (vol. ratio: 1:1:4) for 1 minute, rinsed with water,
acetone and dried with N2 flow. The tips were then immersed in a solution of 1 µm OTS/
10 ml hexane for 30 seconds, rinsed with hexane, ethanol, water, acetone, and dried with
N2 flow. To follow changes in morphology under varying solute conditions, the samples
were scanned in the following order: ambient air, high purity water, various salt
solutions, and then again in high purity water. Between each solute condition the
samples were rinsed with water, THF, and dried with N2 flow. In each condition the
representative root-mean-square (rms) roughness of the surface was determined from the
average of a series of 2.5 µm x 2.5 µm regions at random positions.

132
Functionalization of silicon wafers (SW). A single-side polished silicon wafer
(100) (1 x 1.5 cm) was sonicated for 2 minutes successively in hexane, tetrahydrofuran
and ethanol to remove any contaminants. The washed silicon wafer was then blow-dried
with nitrogen stream and then treated with 7:3 (vol/vol) concentrated sulfuric acid and
30% H2O2 for 1 h (caution: the piranha solution is highly corrosive and extremely
reactive with organic substances). The cleaned silicon wafer was then rinsed with a
copious amount of water and ethanol before being immersed into a 5 mM 3-
aminopropyltriethoxysilane (APTES) ethanol solution. The wafer/APTES solution
mixture was shaken by a shaker at moderate speed overnight. The APTES treated wafers
were then removed from this solution and washed with ethanol and dried in a vacuum
oven at 120 °C for 2 h. The resulting amine-functionalized wafer had a hydrophilic
surface with an advancing water contact angle of less than 15°. The thickness of the
APTES layer was 2 nm as determined by ellipsometry measurement. The ellipsometric
data was measured by a Nanofilm EP3 imaging ellipsometer at 660 nm wavelength with
an incidence angle of 75 deg. The film thickness was calculated by fitting the
ellipsometric data using the supplied EP3View software. An AFM image of this ATPES-
treated silicon wafer was obtained by Mr. Albert Wan in the Batteas group. This image
shows a featureless surface with a measured rms roughness of 0.7 ± 0.3 nm. The smooth
surface indicated that a monolayer of APTES was attached to the silicon wafer surface.
Covalent layer-by-layer self-assembly of PNIPAM/SiO2 nanocomposite on
silicon wafers. Prior to the PNIPAM/SiO2 nanocomposite grafting, the APTES-
functionalized silicon wafer was primed by covalently attaching two PNASI/PEI

133
bilayers to its surface to increase the numbers of surface amine groups. This was
accomplished by allowing the APTES-treated silicon wafer to react first with the
electrophilic poly(N-acryloxysuccinimide) (PNASI) for 30 minutes. The active ester of
NASI was readily converted to an amide upon reacting with an amine. This
condensation reaction coupled the polyvalent electrophilic polymers to the originally
aminated wafer surface and the remaining unreacted NASI groups could react further
with subsequently introduced nucleophilic polyethyleneimine (PEI) by the same
condensation reaction. The surface was amine-rich after one PNASI/PEI bilayer
treatment. While the surface could be used directly for a second PNASI/PEI bilayer
treatment, we treated this surface with i-PrNH2 to quantitatively convert any unreacted
NASI groups into NIPAM groups. A second PNASI/PEI bilayer treatment was carried
out after the i-PrNH2 treatment and the wafer surface by now presumablely was covered
with a sufficient amount of amine groups. The same covalent layer-by-layer assembly
process that mentioned earlier to covalently assemble PNIPAM/SiO2 nanocomposite
surfaces on PE films was then carried out on this ‘primed’ silicon wafer to make the
SW/(PNIPAM/SiO2)6/PNIPAM nanocomposite surfaces. The same 9:1 NIPAM/NASI
PNIPAM-c-PNASI (Mw = 30 kDa) copolymer and aminated silica nanoparticles (10- and
100-nm diameter) used earlier for nanocomposite surface grafting were also used in this
covalent assembly as electrophiles and nucleophiles respectively.
Synthesis of 4-N,N-diallylaminopyridine (DAAP).200 8.0 g 4-aminopyridine
(0.083 mol) dissolved in 60 mL dry THF at ambient temperature followed by the
addition of 4.45 g (0.185 mol) clean sodium hydride. The mixture was allowed to react

134
at ambient temperature until all H2 was evolved and then cooled down to 0 °C. A
solution of 13.5 g (0.176 mol) acryloyl chloride and 20 mL dry THF was then added
dropwise to the reaction mixture. The reaction mixture was kept stirring at ambient
temperature overnight and turned to a red color. The reaction mixture was filtrated and
washed with CH2Cl2. All the filtrate was combined and concentrated by rotary
evaporation to yield the crude product as a red-brown viscous liquid. The crude product
was distilled at reduced pressure (0.4 mm Hg) to obtain 9.6 g (65%) yellow color
product at 88-93 °C. 1H NMR (CDCl3, 300 MHz): δ 3.87 (d, 4H); 5.23 (q, 4H); 6.06 (m,
2H); 7.90 (m, 2H); 8.18 (m, 2H).
Synthesis of poly(N-isopropylacrylamide)-c-poly(4-(N,N-
diallylamino)pyridine) (PNIPAM-c-PDAAP). A mixture of 0.32 g (1.8 mmol) of 4-
(N,N-diallylamino)pyridine and 0.83 g (7.4 mmol) of NIPAM was dissolved in 2.5 mL
of 15% HCl aqueous solution at 0 °C under positive N2 pressure. The initiator, 5.0 mg
(0.018 mmol) of 2,2’-azo-bis(2-methylpropionamidine) dihydrochloride (V-50) in 5 ml
of DI-H2O was added to the reaction mixture which was degassed three times. The
reaction mixture was heated to 60 °C under nitrogen for 48 h until a highly viscous
solution was obtained. The crude polymer product precipitated when saturated NaHCO3
was added to the reaction mixture. This polymer precipitate was filtrated, washed with
warm DI-H2O and dried in vacuum oven. The polymer product was further purified by
redissolving in 20 mL chloroform and precipitating into 200 mL hexane. The mole
fraction of the comonomers was determined by 1H NMR and in this example the
NIPAM/DAAP was ~ 14:1. Two other PNIPAM-c-PDAAP copolymers with

135
NIPAM/DAAP mole fraction of 5:2 and 20:1were also prepared followed this procedure
with varied NIPAM and DAAP feed ratio. GPC analyses (Viscotek multidetector GPC
system) showed that the 5:2, 14:1 and 20:1 PNIPAM-c-PDAAP copolymers had a Mw of
43 kDa, 40 kDa and 42 kDa respectively.
Synthesis of poly(4-(N,N-diallylamino)pyridine) (PDAAP). PDAAP was
synthesized followed a literature procedure.200 DAAP (1.0 g, 5.74 mmol) was dissolved
in 2.5 mL of 15% HCl at 0 °C under positive N2 pressure and degassed three times. The
initiator, 15.0 mg (0.018 mmol) of 2,2’-azo-bis(2-methylpropionamidine)
dihydrochloride (V-50) in 5 ml of DI-H2O was added to the reaction mixture. The
polymerization was carried out at 60 °C for 48 h. The crude polymer product
precipitated when saturated NaHCO3 was added to the reaction mixture to make it basic.
This polymer precipitate was filtrated, washed with warm DI-H2O and dried in vacuum
oven. The obtained crude polymer product was further purified by dissolving in 20 mL
methanol and filtering through a 0.2 µm PTFE filter. The filtrate was concentrated by
rotary evaporation to yield the PDAAP product which had a Mw of 35 kDa by GPC
analysis.
Synthesis of poly(N-isopropylacrylamide)-c-poly(2,2,6,6-tetramethyl-
piperidineoxyl-acrylamide) (PNIPAM-c-PTEMPOAM) from PNASI. A DMF
solution of desired mole ratio of isopropylamine and 4-amino-2,2,6,6-tetramethyl-
piperidinoxyl (4-amino-TEMPO) was added to a DMF solution of PNASI dropwise.
Reaction was allowed to stir under positive N2 pressure at ambient temperature
overnight. Rotary evaporation was used to remove DMF. The remaining polymer was

136
re-dissolved in dichloromethane and the solution was precipitated in ethyl ether
anhydrous. The precipitation process was repeated one more time and the polymer
product was filtrated and dried in oven under vacuum overnight.
Synthesis of poly(N-isopropylacrylamide)-c-poly(2,2,6,6-tetramethyl
piperidinyl-acrylamide) (PNIPAM-c-PTEMPAM) analogue from PNASI. A DMF
solution of desired mole ratio of isopropylamine and 4-amino-2,2,6,6-
tetramethylpiperidine (4-amino-TEMP) was added to a DMF solution of PNASI
dropwise. Reaction was allowed to stir under positive N2 pressure at ambient
temperature overnight and then the solvent DMF was removed under reduced pressure.
The remaining polymer was redissolved in dichloromethane and the solution was
precipitated in ethyl ether anhydrous. The precipitation process was repeated one more
time and the polymer product was filtrated and dried in oven under vacuum overnight.
Covalent layer-by-layer self-assembly of poly(N-isopropylacrylamide)-c-
poly((N-benzo-15-crown-5)acrylamide) (PNIPAM-c-PB15C5AM) with aminated
silica nanoparticles on silicon wafers. A silicon wafer was functionalized and primed
with two PNASI/PEI bilayers according to the procedures mentioned earlier. The
covalent layer-by-layer assembly procedure that used for grafting PNIPAM/SiO2
nanocomposite surfaces on silicon wafers earlier was followed with some changes. In
this synthesis, instead of using i-PrNH2 after each PNIPAM-c-PNASI/SiO2 bilayer
treatment to convert unreacted NASI to NIPAM, 4-amino-benzo-15-crown-5 was used
to form the benzo-15-crown-5-acrylamide (B15C5AM). In general, the primed silicon
wafer was treated in DMF solution of PNIPAM-c-PNASI (9:1 mole ratio), DMF

137
suspension of 10- and 100- nm aminated silica nanoparticles, and DMF solution of 4-
amino-benzo-15-crown-5 sequentially. In between each treatment, the silicon wafer was
washed with DMF to remove any unreacted reagents. After five cycles of those
treatments, the surface so formed was treated in DMF solution of PNIPAM-c-PNASI
(9:1 mole ratio), DMF suspension of 10 nm aminated silica nanoparticles, and DMF
solution of 4-amino-benzo-15-crown-5 one time. Finally, the surface was treated with
DMF solution of PNIPAM-c-PNASI (9:1 mole ratio) followed by treatment in DMF
solution of 4-amino-benzo-15-crown-5 to have the outmost surface covered with
functional PNIPAM-c-PB15C5AM copolymer.

138
REFERENCES
(1) Filipcsei, G.; Fehér, J.; Zrínyi, M. J. Mol. Struct. 2000, 554, 109-117.
(2) ZrÃ-nyi, M. Colloid. Polym. Sci. 2000, 278, 98-103.
(3) Jiang, J.; Tong, X.; Zhao, Y. J. Am. Chem. Soc. 2005, 127, 8290-8291.
(4) Ghosh, S.; Irvin, K.; Thayumanavan, S. Langmuir 2007, 23, 7916-7919.
(5) Napoli, A.; Valentini, M.; Tirelli, N.; Muller, M.; Hubbell, J. A. Nat. Mater. 2004, 3, 183-189.
(6) Weder, C. Nature 2009, 459, 45-46.
(7) Lenhardt, J. M.; Black, A. L.; Craig, S. L. J. Am. Chem. Soc. 2009, 131, 10818-10819.
(8) Baltes, T.; Garret-Flaudy, F.; Freitag, R. J. Polym. Sci., Part A: Polym. Chem. 1999, 37, 2977-2989.
(9) Tiktopulo, E. I.; Uversky, V. N.; Lushchik, V. B.; Klenin, S. I.; Bychkova, V. E.; Ptitsyn, O. B. Macromolecules 1995, 28, 7519-7524.
(10) Graziano, G. Int. J. Biol. Macromol. 2000, 27, 89-97.
(11) Inomata, H.; Goto, S.; Saito, S. Macromolecules 2002, 23, 4887-4888.
(12) Barker, I. C.; Cowie, J. M. G.; Huckerby, T. N.; Shaw, D. A.; Soutar, I.; Swanson, L. Macromolecules 2003, 36, 7765-7770.
(13) Suwa, K.; Morishita, K.; Kishida, A.; Akashi, M. J. Polym. Sci., Part A: Polym. Chem. 1997, 35, 3087-3094.
(14) Winnik, F. M.; Tamai, N.; Yonezawa, J.; Nishimura, Y.; Yamazaki, I. J. Phys. Chem. 2002, 96, 1967-1972.
(15) Gao, J.; Haidar, G.; Lu, X. H.; Hu, Z. B. Macromolecules 2001, 34, 2242-2247.
(16) Vasheghani-Farahani, E.; Cooper, D. G.; Vera, J. H.; Weber, M. E. Chem. Eng. Sci. 1992, 47, 31-40.
(17) Zhu, Y.; Ni, C. H.; Shao, D.; Jiang, X. Acta Polym Sin 2007, 765-769.
139
(18) Kanazawa, H.; Yamamoto, K.; Matsushima, Y.; Takai, N.; Kikuchi, A.; Sakurai, Y.; Okano, T. Anal. Chem. 1996, 68, 100-105.
(19) Kanazawa, H.; Sunamoto, T.; Matsushima, Y.; Kikuchi, A.; Okano, T. Anal. Chem. 2000, 72, 5961-5966.
(20) Liu, Y. Y.; Shao, Y. H.; Lu, J. Biomaterials 2006, 27, 4016-4024.
(21) Zha, L. S.; Li, L.; Bao, L. Y. J. Appl. Polym. Sci. 2007, 103, 3893-3898.
(22) Zhang, J.; Chu, L. Y.; Li, Y. K.; Lee, Y. M. Polymer 2007, 48, 1718-1728.
(23) Karg, M.; Pastoriza-Santos, I.; Rodriguez-Gonzalez, B.; von Klitzing, R.; Wellert, S.; Hellweg, T. Langmuir 2008, 24, 6300-6306.
(24) Zhang, S. B.; Chu, L. Y.; Xu, D.; Zhang, J.; Ju, X. J.; Xie, R. Polym. Adv. Technol. 2008, 19, 937-943.
(25) Nuopponen, M.; Tenhu, H. Langmuir 2007, 23, 5352-5357.
(26) Wu, C. Polymer 1998, 39, 4609-4619.
(27) Zhang, W. A.; Zhou, X. C.; Li, H.; Fang, Y.; Zhang, G. Z. Macromolecules 2005, 38, 909-914.
(28) Mao, H. B.; Li, C. M.; Zhang, Y. J.; Furyk, S.; Cremer, P. S.; Bergbreiter, D. E. Macromolecules 2004, 37, 1031-1036.
(29) Zhang, Y. J.; Furyk, S.; Bergbreiter, D. E.; Cremer, P. S. J. Am. Chem. Soc. 2005, 127, 14505-14510.
(30) Furyk, S.; Zhang, Y. J.; Ortiz-Acosta, D.; Cremer, P. S.; Bergbreiter, D. E. J. Polym. Sci., Part A: Polym. Chem. 2006, 44, 1492-1501.
(31) Zhang, Y.; Furyk, S.; Sagle, L. B.; Cho, Y.; Bergbreiter, D. E.; Cremer, P. S. J. Phys. Chem. C 2007, 111, 8916-8924.
(32) Cho, Y. H.; Zhang, Y. J.; Christensen, T.; Sagle, L. B.; Chilkoti, A.; Cremer, P. S. J. Phys. Chem. B 2008, 112, 13765-13771.
(33) Zhang, Y. J.; Trabbic-Carlson, K.; Albertorio, F.; Chilkoti, A.; Cremer, P. S. Biomacromolecules 2006, 7, 2192-2199.
(34) Freitag, R.; Baltes, T.; Eggert, M. J. Polym. Sci., Part A: Polym. Chem. 1994, 32, 3019-3030.

140
(35) Chee, C. K.; Rimmer, S.; Rutkaite, R.; Soutar, I.; Swanson, L. J. Photochem. Photobiol., A 2006, 180, 1-8.
(36) Burba, C. M.; Carter, S. M.; Meyer, K. J.; Rice, C. V. J. Phys. Chem. B 2008, 112, 10399-10404.
(37) Ahmed, Z.; Gooding, E. A.; Pimenov, K. V.; Wang, L. L.; Asher, S. A. J. Phys. Chem. B 2009, 113, 4248-4256.
(38) Andersson, M.; Maunu, S. L. Colloid. Polym. Sci. 2006, 285, 293-303.
(39) Maeda, H. J. Polym. Sci., Part B: Polym. Phys. 1994, 32, 91-97.
(40) Nishio, Y.; Chiba, R.; Miyashita, Y.; Oshima, K.; Miyajima, T.; Kimura, N.; Suzuki, H. Polym. J. 2002, 34, 149-157.
(41) Krasovitski, E.; Cohen, Y.; Bianco-Peled, H. J. Polym. Sci., Part B: Polym. Phys. 2004, 42, 3713-3720.
(42) Chiba, R.; Nishio, Y.; Miyashita, Y. Macromolecules 2003, 36, 1706-1712.
(43) Chen, J. H.; Chen, H. H.; Chang, Y. X.; Chuang, P. Y.; Hong, P. D. J. Appl. Polym. Sci. 2008, 107, 2732-2742.
(44) Zhu, P. W.; Napper, D. H. Langmuir 1996, 12, 5992-5998.
(45) Housni, A.; Narain, R. Eur. Polym. J. 2007, 43, 4344-4354.
(46) Collins, K. D.; Washabaugh, M. W. Q. Rev. Biophys. 1985, 18, 323-422.
(47) Freitag, R.; Garret-Flaudy, F. Langmuir 2002, 18, 3434-3440.
(48) Kunz, W.; Henle, J.; Ninham, B. W. Curr. Opin. Colloid Interface Sci. 2004, 9, 19-37.
(49) Hippel, P. H. V.; Wong, K. Y. Biochemistry 1962, 1, 664-&.
(50) Warren, J. C.; Cheatum, S. G. Biochemistry 1966, 5, 1702-&.
(51) Warren, J. C.; Peterson, D. M. Science 1966, 152, 1245-&.
(52) Ebel, C.; Faou, P.; Kernel, B.; Zaccai, G. Biochemistry 1999, 38, 9039-9047.
(53) Guo, F.; Friedman, J. M. J. Am. Chem. Soc. 2009, 131, 11010-11018.

141
(54) Kokufuta, E.; Zhang, Y. Q.; Tanaka, T.; Mamada, A. Macromolecules 2002, 26, 1053-1059.
(55) Schild, H. G.; Tirrell, D. A. Langmuir 2002, 7, 665-671.
(56) Winnik, F. M.; Ringsdorf, H.; Venzmer, J. Langmuir 1991, 7, 912-917.
(57) Wu, C.; Zhou, S. J. Polym. Sci., Part B: Polym. Phys. 1996, 34, 1597-1604.
(58) Tam, K. C.; Ragaram, S.; Pelton, R. H. Langmuir 2002, 10, 418-422.
(59) Kumar, A. C.; Bohidar, H. B.; Mishra, A. K. Colloids Surf., B 2009, 70, 60-67.
(60) Sjoeberg, A.; Karlstroem, G.; Tjerneld, F. Macromolecules 2002, 22, 4512-4516.
(61) Shpigelman, A.; Portnaya, I.; Ramon, O.; Livney, Y. D. J. Polym. Sci., Part B: Polym. Phys. 2008, 46, 2307-2318.
(62) Roux, E.; Francis, M.; Winnik, F. M.; Leroux, J. C. Int. J. Pharm. 2002, 242, 25-36.
(63) Kim, J. C.; Bae, S. K.; Kim, J. D. J. Biochem. (Tokyo) 1997, 121, 15-19.
(64) Liu, S. X.; Liu, X.; Li, F.; Fang, Y.; Wang, Y. J.; Yu, J. J. Appl. Polym. Sci. 2008, 109, 4036-4042.
(65) He, C. L.; Zhao, C. W.; Guo, X. H.; Guo, Z. J.; Chen, X. S.; Zhuang, X. L.; Liu, S. Y.; Jing, X. B. J. Polym. Sci., Part A: Polym. Chem. 2008, 46, 4140-4150.
(66) Chourdakis, N.; Bokias, G.; Staikos, G. J. Appl. Polym. Sci. 2004, 92, 3466-3470.
(67) Liu, L.; Wu, C. L.; Zhang, J. C.; Zhang, M. M.; Liu, Y. W.; Wang, X. J.; Fu, G. Q. J. Polym. Sci., Part A: Polym. Chem. 2008, 46, 3294-3305.
(68) Nykanen, A.; Nuopponen, M.; Laukkanen, A.; Hirvonen, S. P.; Rytela, M.; Turunen, O.; Tenhu, H.; Mezzenga, R.; Ikkala, O.; Ruokolainen, J. Macromolecules 2007, 40, 5827-5834.
(69) Chen, Y. G.; Sone, M.; Fuchise, K.; Sakai, R.; Kakuchi, R.; Duan, Q.; Sun, J. L.; Narumi, A.; Satoh, T.; Kakuchi, T. React. Funct. Polym. 2009, 69, 463-469.
(70) You, Y. Z.; Zhou, Q. H.; Manickam, D. S.; Wan, L.; Mao, G. Z.; Oupicky, D. Macromolecules 2007, 40, 8617-8624.
(71) Dufresne, M. H.; Le Garrec, D.; Sant, V.; Leroux, J. C.; Ranger, M. Int. J. Pharm. 2004, 277, 81-90.

142
(72) Li, G. Y.; Guo, L.; Ma, S. M.; Liu, J. S. J. Polym. Sci., Part A: Polym. Chem. 2009, 47, 1804-1810.
(73) Wang, H.; An, Y. L.; Huang, N.; Ma, R. J.; Li, J. B.; Shi, L. Q. Macromol. Rapid Commun. 2008, 29, 1410-1414.
(74) Zhang, Y. F.; Hao, L.; Hu, J. M.; Li, C. H.; Liu, S. Y. Macromol. Rapid Commun. 2009, 30, 941-947.
(75) Goodwin, A. P.; Mynar, J. L.; Ma, Y.; Fleming, G. R.; Frechet, J. M. J. J. Am. Chem. Soc. 2005, 127, 9952-9953.
(76) Anderson, V. C.; Thompson, D. H. Biochim. Biophys. Acta 1992, 1109, 33-42.
(77) Nishiyama, N.; Iriyama, A.; Jang, W. D.; Miyata, K.; Itaka, K.; Inoue, Y.; Takahashi, H.; Yanagi, Y.; Tamaki, Y.; Koyama, H.; Kataoka, K. Nat. Mater. 2005, 4, 934-941.
(78) Davis, D. A.; Hamilton, A.; Yang, J. L.; Cremar, L. D.; Van Gough, D.; Potisek, S. L.; Ong, M. T.; Braun, P. V.; Martinez, T. J.; White, S. R.; Moore, J. S.; Sottos, N. R. Nature 2009, 459, 68-72.
(79) Annaka, M.; Yahiro, C.; Nagase, K.; Kikuchi, A.; Okano, T. Polymer 2007, 48, 5713-5720.
(80) Bradley, C.; Jalili, N.; Nett, S. K.; Chu, L. Q.; Forch, R.; Gutmann, J. S.; Berger, R. Macromol. Chem. Phys. 2009, 210, 1339-1345.
(81) Ishida, N.; Biggs, S. Langmuir 2007, 23, 11083-11088.
(82) Balamurugan, S.; Mendez, S.; Balamurugan, S. S.; O'Brie, M. J.; Lopez, G. P. Langmuir 2003, 19, 2545-2549.
(83) Jhon, Y. K.; Bhat, R. R.; Jeong, C.; Rojas, O. J.; Szleifer, I.; Genzer, J. Macromol. Rapid Commun. 2006, 27, 697-701.
(84) Kizhakkedathu, J. N.; Norris-Jones, R.; Brooks, D. E. Macromolecules 2004, 37, 734-743.
(85) Binder, W. H.; Gloger, D.; Weinstabl, H.; Allmaier, G.; Pittenauer, E. Macromolecules 2007, 40, 3097-3107.
(86) Pan, Y. V.; Wesley, R. A.; Luginbuhl, R.; Denton, D. D.; Ratner, B. D. Biomacromolecules 2001, 2, 32-36.
143
(87) Yamada, N.; Okano, T.; Sakai, H.; Karikusa, F.; Sawasaki, Y.; Sakurai, Y. Makromol. Chem. Rapid Commun. 1990, 11, 571-576.
(88) Reuber, J.; Reinhardt, H.; Johannsmann, D. Langmuir 2006, 22, 3362-3367.
(89) Hirata, I.; Okazaki, M.; Iwata, H. Polymer 2004, 45, 5569-5578.
(90) Ye, J.; Hou, Y.; Zhang, G. Z.; Wu, C. Langmuir 2008, 24, 2727-2731.
(91) Shan, J.; Chen, J.; Nuopponen, M.; Tenhu, H. Langmuir 2004, 20, 4671-4676.
(92) Zhao, M. Q.; Liu, Y. L.; Crooks, R. M.; Bergbreiter, D. E. J. Am. Chem. Soc. 1999, 121, 923-930.
(93) Schild, H. G. Progress in Polymer Science 1992, 17, 163-249.
(94) Boutris, C.; Chatzi, E. G.; Kiparissides, C. Polymer 1997, 38, 2567-2570.
(95) Bae, Y. C.; Lambert, S. M.; Soane, D. S.; Prausnitz, J. M. Macromolecules 1991, 24, 4403-4407.
(96) Qiu, X. P.; Li, M.; Kwan, C. M. S.; Wu, C. J. Polym. Sci., Part B: Polym. Phys. 1998, 36, 1501-1506.
(97) Schonhoff, M.; Larsson, A.; Welzel, P. B.; Kuckling, D. J. Phys. Chem. B 2002, 106, 7800-7808.
(98) Larsson, A.; Kuckling, D.; Schonhoff, M. Colloids Surf., A 2001, 190, 185-192.
(99) Zeng, F.; Tong, Z.; Feng, H. Q. Polymer 1997, 38, 5539-5544.
(100) Yushmanov, P. V.; Furo, I.; Iliopoulos, I. Macromol. Chem. Phys. 2006, 207, 1972-1979.
(101) Lessard, D. G.; Ousalem, M.; Zhu, X. X.; Eisenberg, A.; Carreau, P. J. J. Polym. Sci., Part B: Polym. Phys. 2003, 41, 1627-1637.
(102) Wu, Y. Q.; Meersman, F.; Heremans, K.; Ozaki, Y. J. Mol. Struct. 2006, 799, 134-140.
(103) Koopmans, C.; Ritter, H. J. Am. Chem. Soc. 2007, 129, 3502-+.
(104) Kujawa, P.; Tanaka, F.; Winnik, F. M. Macromolecules 2006, 39, 3048-3055.
(105) Chee, C. K.; Rimmer, S.; Soutar, I.; Swanson, L. Polymer 1997, 38, 483-486.

144
(106) Cai, T.; Marquez, M.; Hu, Z. B. Langmuir 2007, 23, 8663-8666.
(107) Zhou, M.; Sivaramakrishnan, A.; Ponnamperuma, K.; Low, W. K.; Li, C. M.; Liu, J. O.; Bergbreiter, D. E.; Romo, D. Org Lett 2006, 8, 5247-5250.
(108) Duan, Q.; Narumi, A.; Miura, Y.; Shen, X. D.; Sato, S. I.; Satoh, T.; Kakuchi, T. Polym. J. 2006, 38, 306-310.
(109) Tsutsui, H.; Akashi, R. J. Polym. Sci., Part A: Polym. Chem. 2006, 44, 4644-4655.
(110) Kim, J.; Nayak, S.; Lyon, L. A. J. Am. Chem. Soc. 2005, 127, 9588-9592.
(111) Reese, C. E.; Mikhonin, A. V.; Kamenjicki, M.; Tikhonov, A.; Asher, S. A. J. Am. Chem. Soc. 2004, 126, 1493-1496.
(112) Kawaguchi, H.; Kisara, K.; Takahashi, T.; Achiha, K.; Yasui, M.; Fujimoto, K. Macromol Symp 2000, 151, 591-598.
(113) Mao, H. B.; Li, C. M.; Zhang, Y. J.; Bergbreiter, D. E.; Cremer, P. S. J. Am. Chem. Soc. 2003, 125, 2850-2851.
(114) The detailed information for the OptiMelt® automatic melting point apparatus can be found from the web site of Stanford Research Systems, InC. http://www.thinksrs.com/downloads/PDFs/Manuals/MPA100m.pdf (accessd on feburary 2, 2010).
(115) Kujawa, P.; Winnik, F. M. Macromolecules 2001, 34, 4130-4135.
(116) Kumar, A.; Srivastava, A.; Galaev, I. Y.; Mattiasson, B. Progress in Polymer Science 2007, 32, 1205-1237.
(117) Luzinov, I.; Minko, S.; Tsukruk, V. V. Soft Matter 2008, 4, 714-725.
(118) Peez, R. F.; Dermody, D. L.; Franchina, J. G.; Jones, S. J.; Bruening, M. L.; Bergbreiter, D. E.; Crooks, R. M. Langmuir 1998, 14, 4232-4237.
(119) Wang, Y.; Wei, G. W.; Zhang, W. Q.; Jiang, X. W.; Zheng, P. W.; Shi, L. Q.; Dong, A. J. J Mol Catal a-Chem 2007, 266, 233-238.
(120) Fulghum, T. M.; Estillore, N. C.; Vo, C. D.; Armes, S. P.; Advincula, R. C. Macromolecules 2008, 41, 429-435.
(121) Xia, F.; Feng, L.; Wang, S.; Sun, T.; Song, W.; Jiang, W.; Jiang, L. Adv Mater 2006, 18, 432-436.

145
(122) Sun, T.; Wang, G.; Feng, L.; Liu, B.; Ma, Y.; Jiang, L.; Zhu, D. Angewandte Chemie International Edition 2004, 43, 357-360.
(123) Van Durme, K.; Rahier, H.; Van Mele, B. Macromolecules 2005, 38, 10155-10163.
(124) Liu, Y. L.; Zhao, M. Q.; Bergbreiter, D. E.; Crooks, R. M. J. Am. Chem. Soc. 1997, 119, 8720-8721.
(125) Bruening, M. L.; Zhou, Y. F.; Aguilar, G.; Agee, R.; Bergbreiter, D. E.; Crooks, R. M. Langmuir 1997, 13, 770-778.
(126) Liao, K. S.; Wan, A.; Batteas, J. D.; Bergbreiter, D. E. Langmuir 2008, 24, 4245-4253.
(127) Cole, M. A.; Voelcker, N. H.; Thissen, H.; Griesser, H. J. Biomaterials 2009, 30, 1827-1850.
(128) Luzinov, I.; Minko, S.; Tsukruk, V. V. Prog. Polym. Sci. 2004, 29, 635-698.
(129) Sun, A.; Lahann, J. Soft Matter 2009, 5, 1555-1561.
(130) Gras, S. L.; Mahmud, T.; Rosengarten, G.; Mitchell, A.; Kalantar-Zadeh, K. Chemphyschem 2007, 8, 2036-2050.
(131) Mendes, P. M. Chem. Soc. Rev. 2008, 37, 2512-2529.
(132) Zhang, T.; Zheng, Z. H.; Ding, X. B.; Peng, Y. X. Macromol. Rapid Commun. 2008, 29, 1716-1720.
(133) Plunkett, K. N.; Zhu, X.; Moore, J. S.; Leckband, D. E. Langmuir 2006, 22, 4259-4266.
(134) Lindqvist, J.; Nystrom, D.; Ostmark, E.; Antoni, P.; Carlmark, A.; Johansson, M.; Hult, A.; Malmstrom, E. Biomacromolecules 2008, 9, 2139-2145.
(135) Yim, H.; Kent, M. S.; Mendez, S.; Lopez, G. P.; Satija, S.; Seo, Y. Macromolecules 2006, 39, 3420-3426.
(136) Meyer, D. E.; Chilkoti, A. Nat. Biotechnol. 1999, 17, 1112-1115.
(137) Uchida, K.; Sakai, K.; Ito, E.; Kwon, O. H.; Kikuchi, A.; Yamato, M.; Okano, T. Biomaterials 2000, 21, 923-929.
(138) Canavan, H. E.; Cheng, X. H.; Graham, D. J.; Ratner, B. D.; Castner, D. G. Langmuir 2005, 21, 1949-1955.

146
(139) Winnik, F. M.; Ottaviani, M. F.; Bossman, S. H.; Pan, W. S.; Garciagaribay, M.; Turro, N. J. J. Phys. Chem. 1993, 97, 12998-13005.
(140) Wu, C.; Zhou, S. Q. Macromolecules 1997, 30, 574-576.
(141) Collins, K. D. Biophys. J. 1997, 72, 65-76.
(142) von Hippel, P. H.; Schleich, T. The effects of neutral salts on the structure and conformational stability of macromolecules in solution. In Structure and stability of biological macromolecules, Timasheff, S. N.; Fasman, G. D. Dekker: New York, 1969.
(143) Hyun, J.; Lee, W. K.; Nath, N.; Chilkoti, A.; Zauscher, S. J. Am. Chem. Soc. 2004, 126, 7330-7335.
(144) Liao, K. S.; Fu, H.; Wan, A.; Batteas, J. D.; Bergbreiter, D. E. Langmuir 2009, 25, 26-28.
(145) Bergbreiter, D. E.; Liao, K. S. Soft Matter 2009, 5, 23-28.
(146) Troll, K.; Kulkarni, A.; Wang, W.; Darko, C.; Koumba, A. M. B.; Laschewsky, A.; Muller-Buschbaum, P.; Papadakis, C. M. Colloid Polym. Sci. 2008, 286, 1079-1092.
(147) Ishida, N. Advanced Powder Technology 2007, 18, 631-642.
(148) Marcus, Y. Chem. Rev. 2009, 109, 1346-1370.
(149) Fennell, C. J.; Bizjak, A.; Vlachy, V.; Dill, K. A. J. Phys. Chem. B 2009, 113, 6782-6791.
(150) Rudolph, W.; Schonherr, S. Z. Phys. Chem. 1991, 172, 31-48.
(151) Petrou, A. L. Coord. Chem. Rev. 2002, 228, 153-162.
(152) Cotton, F. A.; Wilkinson, G.; Murillo, C. A.; Bochmann, M. Advanced inorganic chemistry, 6th ed.; Wiley: New York, 1999.
(153) Atkinson, G.; Petrucci, S. J. Phys. Chem. 1966, 70, 3122-&.
(154) Pitzer, K. S.; Mayorga, G. J. Solution Chem. 1974, 3, 539-546.
(155) Pye, C. C.; Rudolph, W. W. J. Phys. Chem. A 1998, 102, 9933-9943.
(156) Akitt, J. W.; Farnsworth, J. A.; Letellier, P. J. Chem. Soc. Farad. T. 1 1985, 81, 193-205.

147
(157) Maciel, G. E.; Simeral, L.; Ackerman, J. J. H. J. Phys. Chem. 1977, 81, 263-267.
(158) Simeral, L.; Maciel, G. E. J. Phys. Chem. 1976, 80, 552-557.
(159) Mibe, K.; Chou, I. M.; Anderson, A. J.; Mayanovic, R. A.; Bassett, W. A. Chem. Geol. 2009, 259, 48-53.
(160) Robinson, R. A.; Stokes, R. H. Electrolyte solutions, 2nd ed.; Butterworths Scientific Publications: London, 1959.
(161) Goldberg, R. N. J. Phys. Chem. Ref. Data 1981, 10, 671-764.
(162) Lide, D. R. CRC handbook of chemistry and physics, 89th ed.; CRC Press, 2008.
(163) Pitzer, K. S. Activity coefficients in electrolyte solutions, 2nd ed.; CRC Press: Boca Raton, 1991.
(164) Reardon, E. J. J. Phys. Chem. 1988, 92, 6426-6431.
(165) Montagne, F.; Polesel-Maris, J.; Pugin, R.; Heinzelmann, H. Langmuir 2009, 25, 983-991.
(166) Zhu, D. M.; Wu, K.; Wu, B.; Wang, P.; Fang, J. J.; Hou, Y.; Zhang, G. Z. J. Phys. Chem. C 2007, 111, 18679-18686.
(167) Li, X. M.; Reinhoudt, D.; Crego-Calama, M. Chem. Soc. Rev. 2007, 36, 1529-1529.
(168) Bergbreiter, D. E.; Fu, H. J. Polym. Sci., Part A: Polym. Chem. 2008, 46, 186-193.
(169) Sedlak, E.; Stagg, L.; Wittung-Stafshede, P. Arch. Biochem. Biophys. 2008, 474, 128-135.
(170) Kim, Y. S.; Liao, K. S.; Jan, C. J.; Bergbreiter, D. E.; Grunlan, J. C. Chem. Mater. 2006, 18, 2997-3004.
(171) Dejeu, J.; Buisson, L.; Guth, M. C.; Roidor, C.; Membrey, F.; Charraut, D.; Foissy, A. Colloids Surf., A 2006, 288, 26-35.
(172) Haller, I. J. Am. Chem. Soc. 1978, 100, 8050-8055.
(173) Moon, J. H.; Shin, J. W.; Park, J. W. Mol. Cryst. Liq. Cryst. Sci. Technol., Sect. A 1997, 294, 483-486.

148
(174) Bravo, J.; Zhai, L.; Wu, Z. Z.; Cohen, R. E.; Rubner, M. F. Langmuir 2007, 23, 7293-7298.
(175) Rouse, J. H.; Ferguson, G. S. J. Am. Chem. Soc. 2003, 125, 15529-15536.
(176) Winnik, F. M.; Ottaviani, M. F.; Bossmann, S. H.; Garciagaribay, M.; Turro, N. J. Macromolecules 1992, 25, 6007-6017.
(177) Bergbreiter, D. E.; Case, B. L.; Liu, Y. S.; Caraway, J. W. Macromolecules 1998, 31, 6053-6062.
(178) Scriven, E. F. V. Chem. Soc. Rev. 1983, 12, 129-161.
(179) Deratani, A.; Darling, G. D.; Horak, D.; Frechet, J. M. J. Macromolecules 1987, 20, 767-772.
(180) Rubinsztajn, S.; Zeldin, M.; Fife, W. K. Macromolecules 1991, 24, 2682-2688.
(181) Helms, B.; Liang, C. O.; Hawker, C. J.; Frechet, J. M. J. Macromolecules 2005, 38, 5411-5415.
(182) Bergbreiter, D. E.; Li, C. M. Org Lett 2003, 5, 2445-2447.
(183) Helms, B.; Guillaudeu, S. J.; Xie, Y.; McMurdo, M.; Hawker, C. J.; Fréchet, J. M. J. Angewandte Chemie International Edition 2005, 44, 6384-6387.
(184) Huang, J. T.; Sun, J. W.; Liu, Z. H. J. Appl. Polym. Sci. 1995, 56, 1805-1806.
(185) Vaidya, R. A.; Mathias, L. J. J. Am. Chem. Soc. 1986, 108, 5514-5520.
(186) Sheldon, R. A.; Arends, I. W. C. E. Adv. Synth. Catal. 2004, 346, 1051-1071.
(187) Nishide, H.; Oyaizu, K. Science 2008, 319, 737-738.
(188) Bergbreiter, D. E.; Hughes, R.; Besinaiz, J.; Li, C. M.; Osburn, P. L. J. Am. Chem. Soc. 2003, 125, 8244-8249.
(189) Nishide, H.; Iwasa, S.; Pu, Y. J.; Suga, T.; Nakahara, K.; Satoh, M. Electrochim. Acta 2004, 50, 827-831.
(190) Nakahara, K.; Iwasa, S.; Satoh, M.; Morioka, Y.; Iriyama, J.; Suguro, M.; Hasegawa, E. Chemical Physics Letters 2002, 359, 351-354.
(191) Zhang, Z.; Chen, P.; Murakami, T. N.; Zakeeruddin, S. M.; Grätzel, M. Adv. Funct. Mater. 2008, 18, 341-346.
149
(192) Winnik, F. M.; Ottaviani, M. F.; Bossmann, S. H.; Garciagaribay, M.; Turro, N. J. Macromolecules 1992, 25, 6007-6017.
(193) Mi, P.; Chu, L. Y.; Ju, X. J.; Niu, C. H. Macromol. Rapid Commun. 2008, 29, 27-32.
(194) Yagi, K.; Ruiz, J. A.; Sanchez, M. C. Makromol. Chem-Rapid. 1980, 1, 263-268.
(195) Kopolow, S.; Esch, T. E. H.; Smid, J. Macromolecules 1973, 6, 133-142.
(196) Huh, D. S.; Park, S. H.; Kim, Y. J.; Park, D. Y.; Zhao, Y. S.; Ahn, S. H.; Yoshida, R.; Yamaguchi, T. J. Phys. Chem. B 2006, 110, 13405-13409.
(197) Ito, T.; Hioki, T.; Yamaguchi, T.; Shinbo, T.; Nakao, S.; Kimura, S. J. Am. Chem. Soc. 2002, 124, 7840-7846.
(198) Yamaguchi, T.; Ito, T.; Sato, T.; Shinbo, T.; Nakao, S.-i. J. Am. Chem. Soc. 1999, 121, 4078-4079.
(199) Bergbreiter, D. E.; Simanek, E. E.; Owsik, I. J. Polym. Sci., Part A: Polym. Chem. 2005, 43, 4654-4665.
(200) Huang, J.-T.; Wang, Q.; Sun, J.-W. J. Appl. Polym. Sci. 2000, 77, 363-367.

150
VITA
Name: Hui Fu
Address: Department of Chemistry, Texas A&M University P.O. Box 30012, College Station, TX 77842-3012 Email Address: [email protected]
Education: B.A., Chemistry, Sichuang University, China, 1993
M.S., Chemistry, Tsinghua University, China, 1996
M.S., Chemistry, University of Southern California, U.S.A. 2002
Ph.D., Chemistry, Texas A&M University, U.S.A. 2010


