
A Multi-Modal Network for MATSim
Patrick M. Boesch, IVT, ETH Zürich Francesco Ciari, IVT, ETH Zürich
Conference paper STRC 2015
STRC
15 th
Swiss Transport Research Conference
Monte Verità / Ascona, April 15-17, 2015

15th Swiss Transport Research Conference April 15-17, 2015
______________________________________________________________________________________________
I
A Multi-Modal Network for MATSim
Patrick M. Boesch
IVT, ETH Zürich
CH-8093 Zürich
Francesco Ciari
IVT, ETH Zürich
CH-8093 Zürich
Phone: +41 44 633 39 52
Fax: +41 44 633 10 57
Phone: +41 44 633 71 65
Fax: +41 44 633 10 57
April 2015
Abstract
Explicitly multimodal simulation in MATSim exists since several years, but so far separate
networks were usually used to simulate public and private transport. New questions and
challenges in transport planning however, require the simulation of the competition for capacity
between different modes. This paper presents a new software package that can create a MATSim
network that enables public and private transport to share the network and therefore to compete
for slots.
The software package is designed in a modular approach that allows quick and easy exchange of
single functions to provide improvements, new options or abilities. The package creates the
network and the schedule for Switzerland from entirely open data. The network is built from
Open Street Map data and the schedule from the publicly available SBB HAFAS data. The
package uses only MATSim data structures for the communication between modules, thus other
data sources could be integrated easily.
The final package and the network and schedule it produces are tested and analysed to confirm
proper functioning. These analysis reach from visual comparison of the network with previous
standards at IVT to simulations with performance comparisons to other MATSim public transport
solutions. The results of these analysis show that the package produces valid networks and
schedules that can be the basis for new, fully-multimodal simulations in MATSim.
Keywords
MATSim, Multi-Modal, Network, OSM, Mapping

15th Swiss Transport Research Conference April 15-17, 2015
______________________________________________________________________________________________
2
1. Introduction
Economic and population growth cause settlement pressure in Switzerland. In recent decades
this pressure has been addressed mainly by constructing in new areas. In recent years however,
this urban sprawl has led to increasing discontent in society and corresponding political
initiatives. As examples may be mentioned the national referendum Zweitwohnungsinitiative
(NZZ, 2012) or the Kulturlandinitiative in Zurich (Hotz, 2012). The suggested solution is urban
densification. Urban densification means that in already built-up areas old buildings with a low
space utilization are replaced by newer ones with higher utilization. This compression however,
has a direct impact on the traffic load on accessing road network. Higher utilization means more
living space and / or jobs and thus more traffic per area.
These developments, economic and population growth with the accommodating higher demand
for mobility combined with a trend towards urban densification, increase the pressure on urban
road networks. Congestion problems are, where not already being felt, predictable. Today in
Switzerland however, infrastructure measures to increase capacity become more and more
difficult and expensive, especially in urban areas (Axhausen, 2014). Short-term measures to
increase capacity must therefore take the form of improved utilization of the existing
infrastructure.
In this context, the SVI project NetCap was conducted at the IVT, ETH Zurich, together with
the LUTS, EPF Lausanne. The topic of NetCap was the capacity optimization in urban areas.
The capacity was to be maximized by an optimized balance between transport modes. The
modal split in turn has been adjusted indirectly via a modified public transport (PT) offers.
Macroscopic fundamental diagrams (MFDs) (Geroliminis and Daganzo, 2008) were used to
calibrate and control of the effects of traffic flows and modal split adjustments. From the project
was also to emerge in how far MFDs are generally suitable for such applications. Downtown
Zurich was used as the test area.
In NetCap VISSIM and MATSim were used in combination study the effects of the measures
and to apply the MFDs. The IVT group for transport planning was responsible for the generation
of representative traffic demands at different PT service levels using MATSim. The research
question of traffic demand under different PT regimes however, explicitly requires that the
modes in MATSim mutually affect each other and compete for the limited infrastructure
capacity. This is a special request as in previous MATSim scenarios (at IVT) PT and private
transport used entirely separate networks. So far the buses in MATSim did not get stuck in a
traffic jam, and the cars were not slowed down by stopping buses.
Therefore, as part of NetCap, the move to fully-multimodal networks and scenarios for
MATSim was done at IVT. This means that PT and private transport share the same network.
Also part of this development was the step from proprietary data to public data as the data
source for the creation of networks and schedules. The new networks for MATSim should not
15th Swiss Transport Research Conference April 15-17, 2015
______________________________________________________________________________________________
3
only be fully-multimodal, but also based on Open Street Map (OSM) data. The schedules should
be created from the publicly available SBB HAFAS data.
This paper first presents the software package that allows the creation of fully-multimodal
networks and schedules from open data (section 2). In the second part different analysis are
presented which confirm the proper functioning of the package (section 3).
2. Implementation
2.1 Modular Approach
The package for the creation of fully-multimodal networks should be designed for an iterative
process. This would allow even for small changes in the package to review the results and give
feedback. Also, and more importantly, this allows to respond quickly and effectively to possible
future changes in the database or on changing requirements for the package. In the present case
this is particularly important, since, as mentioned in the introduction, the maps derived from
OSM should serve as data base. OSM data can be adjusted and corrected by anyone anytime.
On the one hand, this leads to an ever-improving data base, but on the other hand also to an
ever-changing data base.
The goal of an iterative approach was achieved with a modular approach in the package design.
The various process steps of the overall package are implemented separately, each in an own
module. The modules are connected only via well-defined data interfaces. MATSim data
formats, such as for example the MATSim Network or the MATSim Schedule, are used for
these data interfaces. As long as the interfaces of the modules are met, individual modules can
be replaced independently by newer, enhanced or customized versions, which corresponds to
the iterative procedure.
Figure 1 presents the modular structure of the software package. Four modules provide the data
base, while the fifth module, Mapping, connects the data to the actual product. Two types of
data are generated. On the one hand the infrastructure data, that is the road network and the bus
stops, and on the other hand, the schedule data, that is the route stop sequences and the
timetables for the various PT lines. As an overall package, together the modules create a
network that contains roads and PT links. Where PT lines share the infrastructure with private
transport, PT is mapped on to the shared network. These are above all the bus lines. Also, the
package produces a PT schedule and a definition of the PT vehicles. In combination these three
files constitute a valid, fully-multimodal infrastructure model for MATSim.

15th Swiss Transport Research Conference April 15-17, 2015
______________________________________________________________________________________________
4
Figure 1 Modular design of the program package and interactions between modules.
2.2 Infrastructure Modules
2.2.1 Road Network
The road network module interface requires only that the road network module provides as
output a MATSim network that contains the relevant road network for the scenario. How and
from what data the road network is created is irrelevant from the perspective of the interface.
The road network module may already add PT links to the network, if the data for this is already
available. To fulfil the interface contract however, this is not required.
In its current implementation, the road network module generates the road network from OSM
Street
Network
MATSim-Network
containing in
minimum all street-
links
Transit Stops
MATSim-Schedule
containing
- PT-Stops with
locations
Route
Profiles
MATSim-Schedule
containing
- PT-Stops with
locations
- PT-Route-Profiles
with stop sequences
Departures
MATSim-Schedule
containing
- PT-Stops with
locations
- PT-Route-Profiles
with stop sequences
- Departures
MATSim-Vehicles
Mapping
MATSim-Schedule
containing
- PT-Stops with
locations (and links)
- PT-Route-Profiles
with stop sequences
- Departures
- PT-Routes (link
sequences)
MATSim-Network
containing street-and
PT-links
15th Swiss Transport Research Conference April 15-17, 2015
______________________________________________________________________________________________
5
data. The module is a slightly adapted version of M. Rieser’s MATSim class to convert OSM
data into MATSim networks1.
OSM data is structured in the XML format. It distinguishes between nodes, ways and relations.
OSM nodes and ways cannot be transferred directly to MATSim nodes and links however,
because they represent different concepts. Nodes in MATSim are pure connectors of links,
while in OSM they represent all sorts of geographical points of interest. Links in MATSim
correspond to parts of transport ways and thus to links in the typical transport planning sense.
Ways in OSM however, represent any geographic object that can be represented as a polyline.
Relations in OSM connect nodes and ways to higher structures that represent complex concepts
(for example roads or buildings).
The road network module analyses the OSM data for road network segments and transforms
them into a MATSim network. Street characteristics (capacity, free-flow speed, etc.) are
specified by default settings where they cannot be read from OSM directly.
The current implementation allows to convert only geographical sub-areas of a given OSM map
into a MATSim network. These sub-areas can be specified as geometric shapes (currently
rectangles or ellipses) or with SHP-files. The sub-areas can also be distinguished for different
road categories. This allows, for example, to connect the European highway network with the
fully detailed Swiss road network.
2.2.2 Transit Stops
The transit stop module interface requires that the output of the module is a MATSim schedule,
in which all transit stops are included with identification number and coordinates. How and
from what data this is created is again irrelevant from the perspective of the interface. Explicitly
not required yet, but of course possible if the relevant information is already available, is the
connection of the stops to network links. This link connection defines for each station via which
MATSim-network link this station can be reached by the PT vehicles.
The current version of the transit stop module reads the required information from the file
BFKOORD_GEO of the SBB HAFAS package. This file defines the transit stops with HAFAS
identification numbers, WGS84 coordinates and their common names. From this data the
MATSim stops are generated and added to a MATSim schedule. Additional data needed when
creating MATSim stops, such as for example if a stopping vehicle blocks the road or not, is
provided via default values.
1 The MATSim class org.matsim.core.utils.io.OsmNetworkReader.java written by M.Rieser.

15th Swiss Transport Research Conference April 15-17, 2015
______________________________________________________________________________________________
6
2.3 Schedule Modules
2.3.1 Route Profiles
The route profile module interface requires as input the output of the transit stop module, which
is a schedule file that contains all transit stops. As output, the module has to generate a schedule
file, which contains the transit stops and the PT routes with the stop sequence for each route
(route profiles). These route profiles also include the arrival and departure times for each stop
of any route profile.
The current implementation of the route profile module reads the required data from the file
FPLAN of the SBB HAFAS package. In FPLAN however, the route profiles are directly
coupled with the departure times. For this reason, in the current implementation, the route
profiles are created together with the departures in the departures module, which is described
in the next section.
2.3.2 Departures
The departures module interface requires as input the schedule created by the route profile
module. The schedule should therefore already contain the transit stops and the route profiles.
The output of this module is a schedule too. Compared to the input it contains additionally the
departure times. A second output of this module is a MATSim vehicle file which defines all PT
vehicles needed at the departures. How and from what data the required information is
generated is again irrelevant for the interface.
In its current implementation, the departures module requires as data base the SBB HAFAS
files FPLAN and BITFELD. The file BITFELD defines within the validity period of the
timetable for each route in HAFAS the days on which it operates. The module analyses the
BITFELD file for the busiest Tuesday or Wednesday of the validity period. This day is used as
the reference date and only routes that operated on that day are read from HAFAS.
After the reference date is chosen, the file FPLAN is read. The file FPLAN contains every
departure of every route of the entire Swiss PT network for the full validity period. It contains
for each route the full route profile (stops sequences as well as arrival and departure time at
each stop), the initial departure time and, if it is a clock-face schedule route, the number of
cycles and the departure interval. Also included in FPLAN are the PT vehicle category and, if
existing, the common name of the route. This data is read for each route and, if it operates on
the reference date, a corresponding entry in the MATSim schedule is created including all
departures of that route.
For each departure a vehicle of the specified vehicle type is created. In congestion situations
this may result in excessively many PT vehicles in the simulation (new vehicles start with new
departures while in reality the corresponding vehicle might still be stuck in congestion on the
15th Swiss Transport Research Conference April 15-17, 2015
______________________________________________________________________________________________
7
previous route). It facilitates the scheduling process enormously however, as the distribution of
a limited number of vehicles on all departures on all routes is a very complex problem already
in itself.
In the current version of SBB HAFAS for many routes each departure is defined as a separate
route. If this were directly translated to a MATSim schedule, this would lead to excessively
many routes and thus to very long simulation times (explained in section 4.1). To avoid this,
HAFAS routes with identical route profiles are merged. Routes which have the identical route
profile as any earlier route will be integrated into this earlier route. It must be noted here that
the equality of route profiles is determined based on the stop sequence only. The arrival and
departure times at stops are ignored. This can sometimes lead to deviations in the arrival and
departure times (see section 3.3).
2.4 Mapping
The goal of the mapping module is the mapping of the stops and routes on the infrastructure.
Infrastructure in this context means the road network, on which PT and private transport share
and compete for physical space (e.g. for buses), and the separate PT network (e.g. railways).
Where PT uses a separate network, this must be generated if it is not already included in the
input network (see section 2.2.1).
The mapping module interface requires as input a MATSim schedule and a MATSim network.
The schedule file should be completely defined except for the link connection of the stops and
for the travel routes. Travel route means the link sequence in the MATSim network, which PT
vehicles have to follow on a particular transit route. The schedule file provided by the departure
module satisfies these requirements. The required MATSim network corresponds to the output
of the road network module. The output of the mapping module consists of a complete and valid
MATSim schedule associated with the provided MATSim network. Together with the
MATSim vehicle file from the departure module this output corresponds to the product of the
overall package.
In the current implementation of the mapping module, road-based PT forms (e.g. buses) are
processed first. The transit stops they use are connected to the nearest link. The nearest link is
identified via the nearest end node. If within a defined search radius around the stations’
coordinates no suitable node and thus link can be found, a new node is created for the station.
This node is connected with an artificial link to the end node of the link of the previous stop. If
the current station is the first stop of the stop sequence, a null link is generated to and from the
new node. Subsequently, the station is connected to the link found or created. This approach
allows to generate PT exclusive links to complement the road network. It can however, also
lead to artificial PT links even when the corresponding road link exists, if the link’s end node
is outside the search radius. An analysis of the influence of the search radius on the mapping is

15th Swiss Transport Research Conference April 15-17, 2015
______________________________________________________________________________________________
8
presented in section 3.1. After all transit stops are connected to the network, the travel route is
identified. In the current implementation the travel route is defined as the shortest route from
each stop to the next. A fast-A-Star routing algorithm is used to find this shortest route.
Currently only the free flow travel times are considered for routing.
After the road-based PT forms, a separate network is created for the non-road-based PT forms
(e.g. trains). This is done analogously to the generation of PT exclusive links for road-based PT
forms. As this procedure directly creates the travel routes, no separate routing for non-road-
bound PT forms is required.
After this mapping the various files are provided as output. The schedule is validated by calling
the TransitScheduleValidator2. The result of this check is reported.
3. Analysis
3.1 Mapping Radius
When linking transit stops to the road network, the great challenge is to write an algorithm that
automatically identifies the correct link but also realizes if this link does not exist in the network
yet. In the current implementation of the algorithm (section 2.4) this is achieved with a search
radius. If around a transit stop’s coordinates a suitable link exists within the search radius, the
stop will be connected to this link. If no such link can be found within the radius, artificial links
are created. It is clear that the size of the search radius has a fundamental influence on the
correct mapping of PT lines on the network.
For different search radii (50m, 100m, 150m and 200m) mappings were done for the city of
Zurich. The results are shown in Figure 2. They show that with a 50m radius many unnecessary,
artificial links are created. With a 200m radius however, an over-mapping can be observed.
Unnatural connections are made at places where artificial links are clearly needed, such as for
example ETH Hönggerberg.
2 The MATSim class org.matsim.pt.utils.TransitScheduleValidator.java written by M.Rieser.

15th Swiss Transport Research Conference April 15-17, 2015
______________________________________________________________________________________________
9
Figure 2 Visualization of the mapping results for different search radii (from top left to
bottom right: 50m, 100m, 150m, and 200m). Bus routes were mapped for Zurich. Green links
indicate a successful connection to the road network, orange links show artificially generated
PT-exclusive links.
3.2 Network Visualization
In 2013 a new MATSim network with new MATSim schedules (incl. vehicles) was created at
the IVT. It was based on the UVEK national transport model (ARE, 2010). This full Switzerland
model was generated by A. Stahel (2014). Until then this was the most comprehensive and
detailed model of the Swiss road and PT network available to the IVT. It had two main
deficiencies however. First, the road and the PT network were still modelled completely
separate. Second, PT – particularly in the urban areas – was created with heavily simplifying
assumptions. To show the progress in mapping achieved with the new package and to illustrate
the difference between the new fully-multimodal network and the network of 2013, a visual
comparison of the two Zurich networks is presented in Figure 3.

15th Swiss Transport Research Conference April 15-17, 2015
______________________________________________________________________________________________
10
Figure 3 Above the network based on the 2013 UVEK national transport model, below
the network newly created with the software package presented in this paper. In both
visualizations, the road links are coloured grey, the PT links orange and shared links green.
The train routes, especially for long-distance trains, correspond to a large degree between the
two networks. The urban PT however, is resolved with completely different approaches. In the
2013 model the city districts have only one stop each. These stops are then radially linked. In
the new network the bus lines are mapped on the streets and, even though the tram network is
still on a separate network, at least the tram stops correspond to the real locations.

15th Swiss Transport Research Conference April 15-17, 2015
______________________________________________________________________________________________
11
3.3 Arrival-Offsets
The departures module (section 2.3.2) merges PT routes with identical route profiles. In this
merging process only the route profiles are currently considered as a merging criterion.
Different arrival and departure times at transit stops, which are part of MATSim route profiles,
are neglected. This can lead to time differences when throughout the day routes are served with
identical profiles but varying schedules.
Statistical data on the occurring time differences was collected to quantify and assess these time
differences. For all calculations the absolute values of the differences were used. With the
current implementation a total of 45’208.9 hours of time difference occur on the entire Swiss
PT network. This difference occurs at a total of 587’825 stopping procedures. This results in an
average deviation of 4.61 minutes per affected stopping procedure. If the not-affected stopping
procedures are taken into account too, the time differences occur over a total of 2’282’327
stopping procedures. This results in an overall average deviation of 1.19 minutes per procedure.
Figure 4 shows a histogram of the time differences.
Figure 4 Histogram of the time differences due to route merging.
3.4 Routings
If the MATSim schedule is generated from the SBB HAFAS data for 2015, the BITFELD
analysis identifies the 03.03.2015 as the reference date. To test the schedule, 33 random PT
15th Swiss Transport Research Conference April 15-17, 2015
______________________________________________________________________________________________
12
trips were routed in MATSim, queried on Google Maps3, and the resulting routes subsequently
compared. A PT trip consisted of origin coordinates, destination coordinates and a departure
time.
In MATSim the routing process created 70 stages from the 33 PT trips. These 70 stages were
compared with the respective stages from Google Maps. When querying from Google Maps,
the settings were set so that the "best routes" were searched and that there was no preference
for a particular type of PT. The date was set to the 03.03.2015. The results of the comparison
are presented in Table 1.
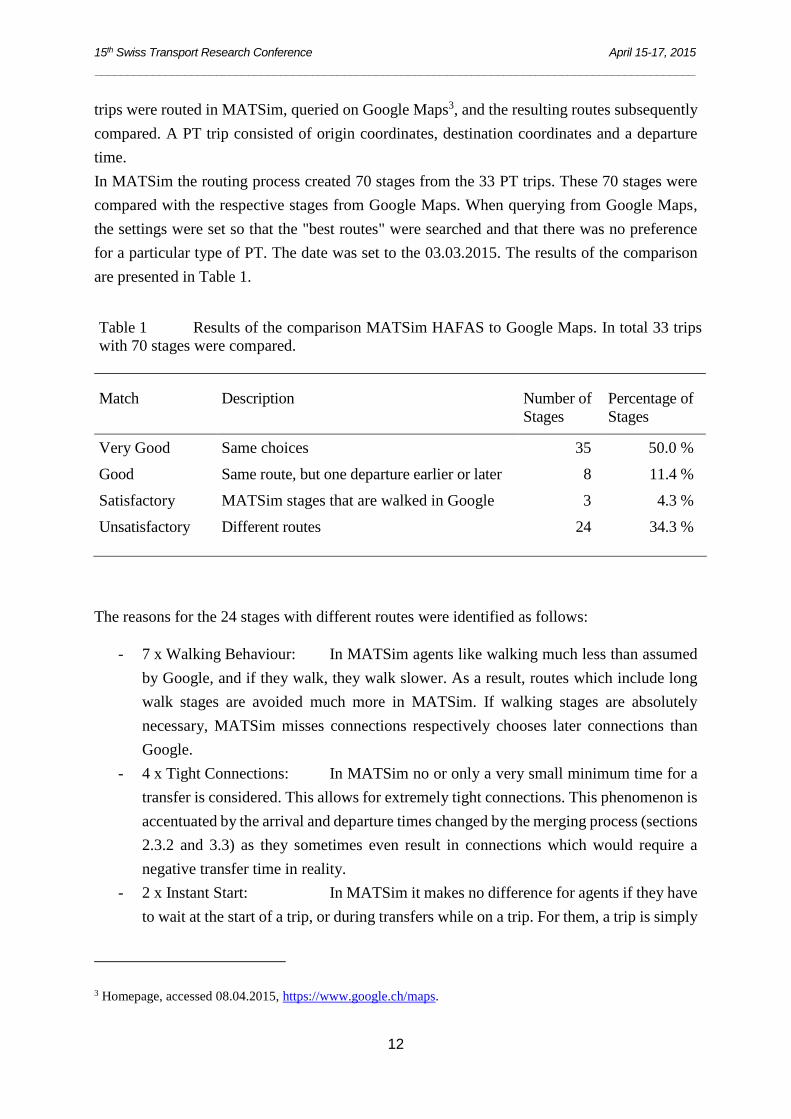
Table 1 Results of the comparison MATSim HAFAS to Google Maps. In total 33 trips
with 70 stages were compared.
Match Description Number of
Stages
Percentage of
Stages
Very Good Same choices 35 50.0 %
Good Same route, but one departure earlier or later 8 11.4 %
Satisfactory MATSim stages that are walked in Google 3 4.3 %
Unsatisfactory Different routes 24 34.3 %
The reasons for the 24 stages with different routes were identified as follows:
- 7 x Walking Behaviour: In MATSim agents like walking much less than assumed
by Google, and if they walk, they walk slower. As a result, routes which include long
walk stages are avoided much more in MATSim. If walking stages are absolutely
necessary, MATSim misses connections respectively chooses later connections than
Google.
- 4 x Tight Connections: In MATSim no or only a very small minimum time for a
transfer is considered. This allows for extremely tight connections. This phenomenon is
accentuated by the arrival and departure times changed by the merging process (sections
2.3.2 and 3.3) as they sometimes even result in connections which would require a
negative transfer time in reality.
- 2 x Instant Start: In MATSim it makes no difference for agents if they have
to wait at the start of a trip, or during transfers while on a trip. For them, a trip is simply
3 Homepage, accessed 08.04.2015, https://www.google.ch/maps.

15th Swiss Transport Research Conference April 15-17, 2015
______________________________________________________________________________________________
13
the complete door-to-door time. Google apparently prefers routes which start later, but
have shorter transfer times. This allows people to start later and to reduce long waiting
times at transfers while still arriving at the same time.
- 11 x Unknown Reason: The route is not suggested in Google. Often even all
proposed alternatives of Google are faster than the MATSim route. The exact reasons
for the differences could not yet be identified for these routes.
3.5 Simulations
An existing and calibrated scenario was used to test the new OSM-based network and SBB
HAFAS based PT schedules in a simulation. The scenario was created and calibrated by T.
Dubernet and is used for education purposes at the IVT (Ciari and Waraich, 2014). In the
simulation test the configuration values of the original scenario were kept wherever possible.
The scenario is a 10% -Zürich scenario, which means that 10% of the population were simulated
for the greater Zurich area for one day (24 hours). The scenario includes also freight traffic and
transit. The presented values are based on the events of the 150th iteration of the simulation,
which corresponds to a well-relaxed state of the system.
The simulation resulted in the following basic outputs:
- Number of Trips per Person and Day: 3.4 (Microcensus (MC) 20104: 5.58)
- Modal Shares:
- PT: 25.3% (MC2010: 19.9%)
- Slow modes: 25.8% (MC2010: 52.2%)
- Car: 48.9% (MC2010: 27.9%)
- Modal share of PT by activity:
- Work: 23.2% (MC2010: 26.7%)
- Leisure: 27.8% (MC2010: 17.6%)
- Shopping: 29.2% (MC2010: 14.2%)
- Education: 32.8% (MC2010: 26.7%)
Figure 5 shows for the simulated day the number of agents that are en route in total (above) and
by PT (below). One can very well recognize the morning and the evening peak representing the
respective rush hours.
4 BFS, Mikrozensus Mobilität und Verkehr 2010, Synthesetabellen 2010 (evaluated for the Zurich region),
accessed 09.04.2015, http://www.bfs.admin.ch/bfs/portal/de/index/news/01.Document.155249.xls.

15th Swiss Transport Research Conference April 15-17, 2015
______________________________________________________________________________________________
14
Figure 5 Leg-Histogram for all legs (above) and only PT legs (below).

15th Swiss Transport Research Conference April 15-17, 2015
______________________________________________________________________________________________
15
3.6 Performance
Increased level of detail means for simulations usually increased computational cost. It is one
of the challenges in modelling to find a balance between these two contradicting requirements.
The influence of the increased accuracy in PT representation on the simulation performance
achieved with the new package was investigated for this paper.
Three different population samples were examined for three different PT representations. The
different population samples are 0.1%, 1% and 10% of the total population. The different
representations are first the fully-multimodal network and schedule (hereinafter "MultiModal")
created with the package presented in this paper, second, the existing standard network and
schedule of IVT, which has separate networks for PT and private transport ("Separated
Networks") presented in section 3.2, and third, the a version where PT users are teleported and
PT is not explicitly simulated ("Teleporting"). All nine scenarios use the same configuration
parameters and the same basic data (the scenario presented in section 3.5) as far as the different
set ups allow. Figure 6 shows the typical simulation and replanning times for one iteration for
these combinations.
Figure 6 Typical simulation and replanning times per iteration for the different scenarios.
The percentage values represent the population share that is simulated. The scenario names
describe the form of PT representation used.

15th Swiss Transport Research Conference April 15-17, 2015
______________________________________________________________________________________________
16
4. Discussion
4.1 Implementation Issues
During the implementation and application of the software package several stumbling blocks
have emerged that could be of interest for potential users. For example, it is important that
throughout the process the same geographical coordinates are used. This reads seemingly self-
evident, but given the number of modules and data sources special care is suggested.
Within reason attention should be paid to generate only a small number of routes in the final
schedule. The current implementation of the MATSim PT router generates between all routes
and stations a separate transit link, if they allow for connections. The more routes, the more
such transit links, and the worse the performance of the simulation.
Last but not least, an SBB HAFAS specific concept deserves a special comment: PT is usually
organized on two levels, lines and routes (Ordonez and Erath, 2011). MATSim follows this
structure. Lines summarize different but very similar routes. In contrast, in HAFAS the two
levels represent management and departures. Management summarizes all departures of one
administrative unit, e.g. PostAuto Schweiz or the Busbetriebe Aarau. If this difference in
concepts is considered however, a transfer from HAFAS management to MATSim lines and
from HAFAS departures to MATSim routes is possible, and also currently implemented in the
software package.
4.2 Analysis Results
As mentioned in section 3.1, in the current implementation of the package, the mapping radius
has a fundamental influence on the quality of the mapping of PT on the road network. It should
therefore be chosen as carefully as possible. Currently, a visual inspection of the mapping is
made for various critical points of the network. Based on these investigations, a search radius
of 150 m was determined as the currently best compromise. Future developments should,
however, allow for a quantitative determination of the optimal radius, unless a fundamentally
different approach is taken and no search radius is needed anymore (section 5.1).
As expected, the – in comparison with alternative models – more complex and detailed
modelling of the PT network and schedule (section 3.2) results in increased simulation time per
iteration (Section 3.6). Surprising are however, the extremely short time replanning times in the
case of the fully-multimodal network. The exact reason for this observation is the subject of
current investigations. Based on other results (sections 3.4 and 3.5) however, a malfunction of
the simulation caused by the network or the schedule can most probably be excluded. The
currently pursued hypothesis is that the small number of lines in the schedule, which for
MATSim is unusually small as here they represent administrative units and not similar routes

15th Swiss Transport Research Conference April 15-17, 2015
______________________________________________________________________________________________
17
(section 4.1), leads to the very short replanning times.
The analysis of the arrival offsets (section 3.3) suggests potential for improvement in the
selection of the departure and arrival times in the route profiles. Currently the arrival and
departure times of the first occurrence of a route profile will be applied to all future occurrences
of the route profile. One could, for example, imagine that an optimal compromise between all
arrival and departure times of a single route profile is selected. This could possibly minimize
the many relatively small time differences. The few large time differences could probably only
be eliminated through the division of the profiles into different routes. This in turn would
however, result in lower simulation performance. A compromise must be found.
The review of individual routing (section 3.4) suggests some potential for improvement too.
This is, especially in the case of the too costly walk mode, supported by the simulation results
(section 3.5). The slow modes, which include bike and walk, have a much too low share of the
modal split in the simulation results.
4.3 Alternative Approaches
The current implementation of the package has focused on the creation of a fully-multimodal
MATSim network covering Switzerland. It should be created from open data only. Therefore it
was assumed that OSM is available for the network creation and the public SBB HAFAS data
for the schedule. At the IVT however, alternative efforts and experiments were made by N.
Rieser to create not only the network, but also the schedule entirely from OSM. This would
allow the creation of fully-multimodal networks and schedules without additional data for cities
and regions other than Switzerland. This approach is not pursued at the moment however, as it
has turned out to be very difficult to implement.
Also, a semi-automatic solution (Ordonez and Erath, 2011) was developed by IVT Singapore
to map the PT routes based on GPS points collected by PT passengers. Because of the different
requirements (open data vs. GPS-points) however, the Singapore package could not be used
without adaptation. A possible solution to bridge the gap and unify the two packages could for
example be to create artificial PT GPS points from OSM data and then map the PT routes to
the OSM network using the Singapore solution.

15th Swiss Transport Research Conference April 15-17, 2015
______________________________________________________________________________________________
18
5. Outlook and Conclusion
5.1 Outlook
Various additions, extensions and refinements are planned for the program package. Some of
them are already in the process of implementation.
• Review and correction of the road routes and stops positions with the information
from OSM: In OSM the passing PT routes are noted for many links. This information
can be used to correct the link sequences in the schedule and for an improved routing
(e.g. that the routing on such links is cheaper than on other links for lines which are
noted on the link). Also many PT stops are more precisely placed in OSM than in
HAFAS. This additional accuracy could be utilized to correct and to improve the linking
of the transit stops.
• Refinement of the identification of the nearest links for transit stops: For example,
every few meters (e.g. ¼ the search radius) of a link a virtual node is to be generated.
These virtual nodes would then be included in the search for the nearest link. This should
allow to identify as nearest links also links that pass very close to the stop but which
have their end nodes far away from the stop (and which are therefore currently not
recognized as "near").
• Automatic adjustment of the free-flow speeds and flow capacities of the links based
on the environment: The idea that should be implemented here is that if for example
more buildings are close to the link, traffic is usually slower on this link. Experience
shows that this is currently not reflected in MATSim. Agents achieve – especially in
urban areas – in tendency too high average speeds.
• Combine linking and routing: If several links are possible candidates for the linking
of a transit stop, the current implementation selects the nearest. If the routing were
combined with the linking of the transit stops however, it could be possible to identify
those links as best that allow for an overall shortest route. They could then, for example,
be selected with a higher probability than those requiring longer routes.
• Ban U-Turns: In the current routing implementation U-turns are allowed for PT
vehicles. In reality, this is hardly realistic. Therefore, it would make sense to ban this
when routing.
Also, the combination of the present solution with the Singapore approach (as indicated in
section 4.3) should be checked.

15th Swiss Transport Research Conference April 15-17, 2015
______________________________________________________________________________________________
19
5.2 Conclusion
The approach presented in this paper enables the generation of fully-multimodal MATSim
networks and schedules from open data. Several tests have shown that this generation can be
applied successfully. Nevertheless, there is still potential for improvement and different ideas
for further development have already been formulated.
Only fully-multimodal networks allow the simulation of competition for road capacity between
PT and private transport. They are therefore a necessary part of transport simulations in a time
when limited road capacity is an issue not only but especially in urban areas. The immense
effort that must be invested in any road capacity expansion today, and which is more and more
difficult to justify given environmental and social trends, exacerbates the problem and makes it
even more relevant.
Projects such as NetCap search for alternative approaches to solve this problem. An
optimization of the PT supply can lead to capacity increase, but it must be implemented with
political sensitivity. The support and review of this optimization with new approaches, such as
MFDs in NetCap, enable new solutions.
6. Acknowledgments
Marcel Rieser5 developed MATSim software classes that are (directly or in slightly modified
form) part of the very core of the software package presented in this paper. He also supported
this work with advice and interesting discussions.
Nadine Rieser6 supported in the initial work on OSM and in the initial ideas for the package.
Milos Balac7 supported this work by providing the routings used for the routing validations, as
well as with advice and ideas.
The scenario used to test and validate the network and schedule was developed and calibrated
by Thibaut Dubernet8.
5 Dr. M. Rieser, Senozon, http://www.senozon.com/about-us.
6 Dr. N. Rieser, Ernst Basler + Partner AG, http://www.ivt.ethz.ch/people/scnadine.
7 M. Balac, IVT, ETH Zurich, http://www.ivt.ethz.ch/people/balacm.
8 T. Dubernet, IVT, ETH Zurich, http://www.ivt.ethz.ch/people/thibautd.
15th Swiss Transport Research Conference April 15-17, 2015
______________________________________________________________________________________________
20
7. References
Axhausen, K.W. (2015) Die Fahrzeit ist entscheidend, TEC21, 7-8, 26-29.
Bundesamt für Raumentwicklung ARE (2010) Nationales Personenverkehrsmodell des UVEK,
Referenzzustand 2030.
Ciari, F. and R. Waraich (2014) ETH-Course Agent-Based Modeling in Transportation, Fall
Semester 2014, ETH Zurich, Zurich.
Geroliminis, N. and C. F. Daganzo (2008) Existence of urban-scale macroscopic fundamental
diagrams: Some experimental findings, Transportation Research Part B -
Methodological, 42 (9), 759-770
Hotz, S. (2012) Kulturlandinitiative angenommen – Baulandreserven werden aufgehoben,
Online Article (accessed 08.04.2015), June 2012,
http://www.nzz.ch/aktuell/zuerich/uebersicht/abstimmung-kanton-zuerich-
kulturlandinitiative-kantonal-1.17242295.
NZZ (2012) Wenn sogar die Gegner den Argumenten der Initianten zustimmen, Online Article
(accessed 08.04.2015), Mai 2012, http://www.nzz.ch/aktuell/startseite/wenn-sogar-die-
gegner-den-argumenten-der-initianten-zustimmen-1.16756425.
Ordonez, S. and A. Erath (2011) Semi-automatic tool for map-matching bus routes on high-
resolution navigation networks, paper presented at the 16th International Conference of
Hong Kong Society for Transportation Studies, Hong Kong, December 2011.
Stahel, A. (2014) MATSim 2030 – Switzerland Scenario, IVT Working Paper, IVT, ETH
Zurich, Zurich.


