1 | P a g e
Stryker Field Service
Throughput Process Improvement
MGMT 6140, June 19, 2012
Toby Moenke
Stacy Burdette
Veronica Humpierres
Greg Skinner
2 | P a g e
I. Executive Summary
Stryker, a global medical technology company, currently outsources the repairs and
maintenance of their Neptune 2 waste management system to various vendors. Currently, the
throughput time between a work order request and payment is longer than reasonably expected.
After studying the process flow chart and meeting with the Stryker team involved, the bottleneck
operation was identified as the invoice quality review process performed by Stryker employees
after an invoice is submitted. The key sign of a bottleneck operation was the amount of backlog
waiting in queues at this point in the process.
The root cause of the problem is a high rejection rate of approximately 50%, which can
occur more than once for a single invoice. Rejected invoices not only have to be reviewed twice
or more but also time must be spent to identify all errors in order to direct the vendors to the
appropriate issues. During a capacity analysis, it was discovered that the Stryker team is
understaffed by an average of four individuals with the current level of rejection rates.
The recommendation is to lower the rejection rate by creating smart forms that would
prevent the vendors from entering data outside an accepted range and adding incentives/penalties
to the vendors’ contracts for a set tier of rejected invoices. In addition, extra steps can be taken
to reduce the time spent on the invoice quality review, such as automating certain calculations
done by the Stryker team like mileage and freight payments.
Unfortunately, several limitations to the study were encountered; the primary constraint
being time. Some of the data took longer to obtain than expected, limiting the amount of
analysis available, in particular a cost analysis.
3 | P a g e
II. Table of Contents
Introduction Pg. 4
Problem Definition, discussion of the process flow chart Pg.7
Measurement of the current process performance Pg. 10
Identification of the Root Causes of the Problem Pg. 14
Recommended Process Improvements Pg. 19
Measurements of the Improved Process performance Pg. 22
Recommended Reengineered Process Pg. 28
Limitations of the Study Pg. 32
Lessons Learned from the Project
Toby Moenke Pg. 35
Veronica Humpierre Pg. 36
Stacy Burdette Pg. 37
Greg Skinner Pg. 38
Feedback from Stryker Pg. 39
Conclusion Pg. 40
Appendix A- Process Flow Chart Pg. 41
Appendix B- Cause and Effect Diagram Pg. 42
4 | P a g e
III. Introduction
Stryker is a global medical technology company, dedicated to the health care industry by
improving patient care and facilitating the performance of healthcare professionals. This
dedication is clearly stated in their mission statement: “We make a difference by caring for the
caregivers, helping them maintain order in their organizations and restore health to their
patients.” The dedication leads to innovation, which has been a key to the history of Stryker.
Their innovative products in medical technology range from reconstructive, medical and
surgical, neurotechnology and spine products.
The company officially started in 1941 with the innovations of Dr. Stryker. Dr. Stryker
received a degree in orthopedic surgery from the University of Michigan and began his own
practice in Kalamazoo, Michigan in 1940. He created his first invention of the turning frame and
walking heel while completing his degree. While in practice, he found that many products in the
market were not meeting his patients’ needs, so he would invent his own. As interest for these
products grew, he hired his first assistant and began producing and selling his inventions under
the Orthopedic Frame Company. World War II created a heavy demand for Dr. Stryker’s
innovative products and by 1958 the company hit record earnings of $1 million. In 1964, Dr.
Stryker retired from his medical practice and changed the name of his company to what it’s
known as today, Stryker Corporation.
Since then, the company has grown exponentially. In 1979, Stryker had both national
and international success: the first international direct sales office was opened in Germany and
the initial public offering of stock was listed on the NASDAQ. Eighteen years later, the
company is listed on the New York Stock Exchange. By 2002, annual sales grew to $3 billion
5 | P a g e
and Stryker is listed in the Fortune 500 for the first time at #493.
Today, Stryker continues to be listed as a Fortune 500 company at #308 in terms of
revenue with annual global sales hitting $8.3 billion. This marks 32 straight years of revenue
growth. In 2012, Stryker received the Gallup Great Workplace Award for the fifth time in the
last six years and was also named by Fortune Magazine among the “World’s Most Admired
Companies” (eleventh consecutive year) and “100 Best Companies to Work For” (second
consecutive year).
Stryker also has a more pronounced presence worldwide with 37% of sales outside the
U.S. Products are sold in over 100 countries with over 21,000 employees worldwide. The
company also participates in several global outreach programs: Cure International, Foundation
for Orthopedic Trauma, Mercy Ships, Operation Smile, Operation Walk, United Way, and SOS
Children’s Villages.
With over 70 years of innovation built into its culture, Stryker has a vast portfolio of
more than 57,000 products. In 2011, the company owned 4,035 patents globally, the result of a
strong dedication to research and development, with 29 manufacturing and R&D locations
worldwide. Since 2000, five to six and a quarter percent of sales have been invested towards
research and development. In 2011, $462 million was spent on research and development, a
17.3% increase in spending, which is well above the industry norm.
With the ever changing healthcare market, Stryker has flourished with its commitment to
financial stability. The company is currently involved in a cash deployment strategy, which
includes acquisitions, dividends, and share buybacks. This approach helps ensure Stryker will
gain access to the growing markets and continue to be a top competitor in the industry. For
example, with this strategy focused on merger and acquisitions, Stryker was able to become a
6 | P a g e
world leader on reprocessing and neurovascular, which are two businesses that were not even in
Stryker’s portfolio two years back.
In 2008, Stryker began a $200 million project focused on quality and compliance, which
would add “quality first” to its culture. As part of this quality approach, Stryker moved from
being a plant within a plant to a more focused company. The reason for this reorganization was
to benefit from the strengths of all its individual divisions and become a more united corporation,
which in turn would improve quality. The company wanted to move away from highly
decentralized and independent networks to a more operationally aligned company.
In its most recent events, Stryker’s President and CEO, Steve MacMillan, resigned due to
family reasons on February 8, 2012. MacMillan had been with the company almost nine years.
For the time being, the Board selected Curt Hartman, the company’s CFO, as Interim CEO.
7 | P a g e
IV. Problem Definition and Discussion of the process flow chart
The Stryker Instruments division has products that they create and sell within the
healthcare community. In particular, we focused on the field service for the Neptune 2. The
Neptune 2 is a waste management system designed to aid in protecting healthcare providers from
harmful fluids and smoke. Part of the customer service from the sale includes providing
technicians who install, provide regular maintenance, and perform repairs on the equipment.
These technicians are outsourced by Stryker to several vendors. After reviewing the entire
process, the focus was narrowed down to the submission and review of the Repair Work Order.
The schedule for these is based on a priority level, usually determined by the type of call. A
repair, for example, is more likely to be serviced in a 24 to 48 hour range from the initial contact
where regular maintenance or installation might be scheduled a week or months in advance.
What they all have in common is the required documentation, regardless of the call type. The
documentation lets Stryker know what might be a serious matter, and it is part of the approval
process before anything is submitted for billing to the hospitals.
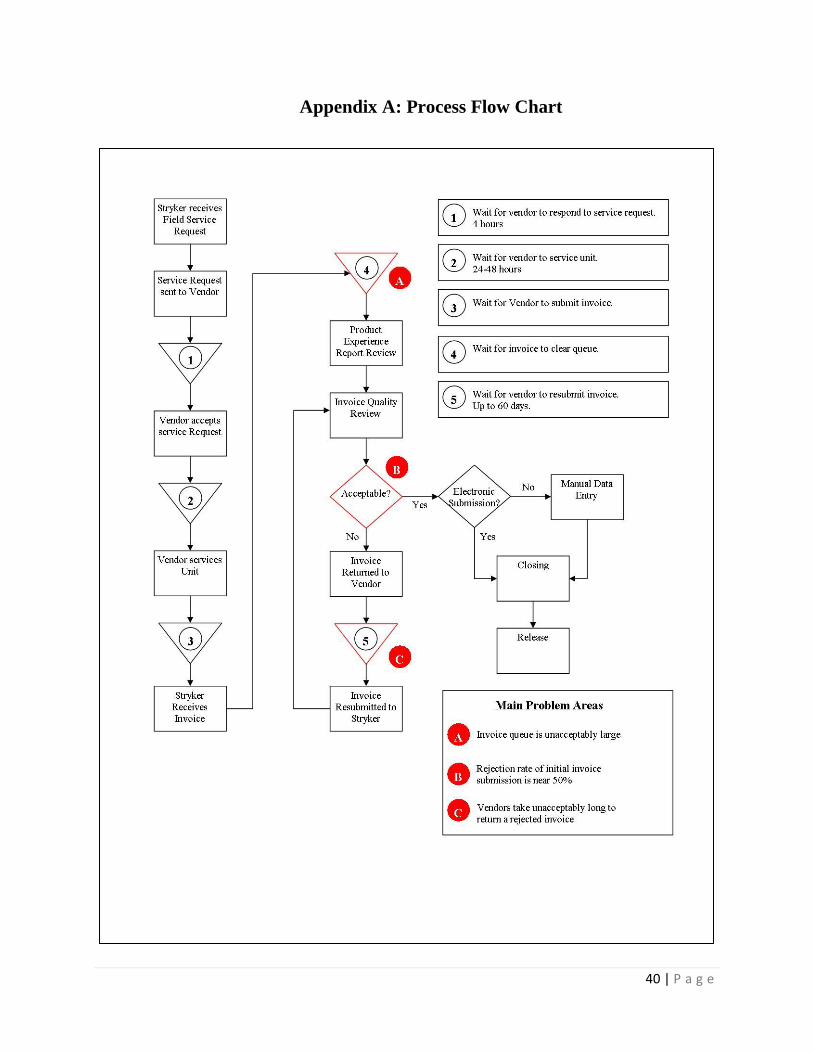
The process flow for a Neptune 2 repair work order begins with Stryker receiving a field
service request. A service request from Stryker is sent to the assigned vendor for the account.
Once the vendor accepts the service request, which takes about four hours, a field service
technician is sent to service the unit. When the service is completed, invoice paperwork is
required to be submitted to Stryker, which begins the Product Experience Report (PER) process.
Although it is a billing invoice, the reason the vendor is not paid automatically is because Stryker
wants to verify the details of the service. It may have been more serious, or not as serious, as
stated in the original request call. This information is determined during the PER process,

8 | P a g e
allowing the company to decide if there is more to do beyond the service call, such as FDA
notification.
The next step involves the invoice quality review, which begins with a scan of what is
filled out in the invoice, whether electronic or manual paperwork. The reviewer is responsible
for deciding if it is acceptable or not. When the answer is yes, and it is an electronic submission,
then it can be easily closed and released for payment. A couple of companies do not submit
electronically and the information is manually data entered before the call is closed and released.
When the invoice is not acceptable, the paperwork is returned to the vendor or specific vendor’s
queues if electronic, along with notes of what errors were found. Generally, multiple items have
errors. Rejection rate of initial invoice submissions is near 50%. Some companies are good
about resubmitting the invoice within the same day; others, it could take weeks, especially if they
have multiple errors to correct. Invoices with multiple errors have a higher probability of getting
rejected a second time by the reviewer.
When an invoice is received by the reviewers and has already been rejected, the process
is slightly longer. The reviewer compares what was originally submitted to the newest
paperwork. Depending on the type of errors, this takes at least twenty minutes for the reviewer,
compared to about five minutes when everything is correct the first time. It is this section of the
process that has created a backlog of paperwork since November of 2011, making the field
service coordinators behind a month.
Although it was not perfect before, the technicians were used to a system that changed
approximately six months ago. During the implementation of a new Customer Relationship
Management (CRM) submission system, the technicians were trained by outside trainers.
Currently, any new technician is trained by the Stryker field service coordinators, who are the
9 | P a g e
same employees reviewing the paperwork. With the implementation of a new system, a learning
curve is typically expected; at this point, the learning curve has not changed the amount of errors
for most of the field service technicians, plus new types of errors are still occurring. A second
factor with the CRM system is that it shares information with the AS400. It is refreshed
overnight with updates from the current day. Sometimes there are issues with processing from
the AS400, which can hold up the invoice process as well.
The amount of paperwork rejected in the system can hold up payments for months until it
is resubmitted and approved. Sometimes this happens multiple times for the same
documentation. A cycle has been created where the reviewers are spending extra time because
of the number of documents they reject and the backlog it has created from the extra
submissions. With the consideration of the backlog, the invoice quality review has been
identified as the bottleneck operation.

10 | P a g e
V. Measurement of current process performance
The current process for measuring the performance of the field service throughput is a
manual process controlled by a field service coordinator. The information that is gathered is sent
to the field service manager for review every day. This is information is evaluated and reviewed
to show the status of how the overall process is working.
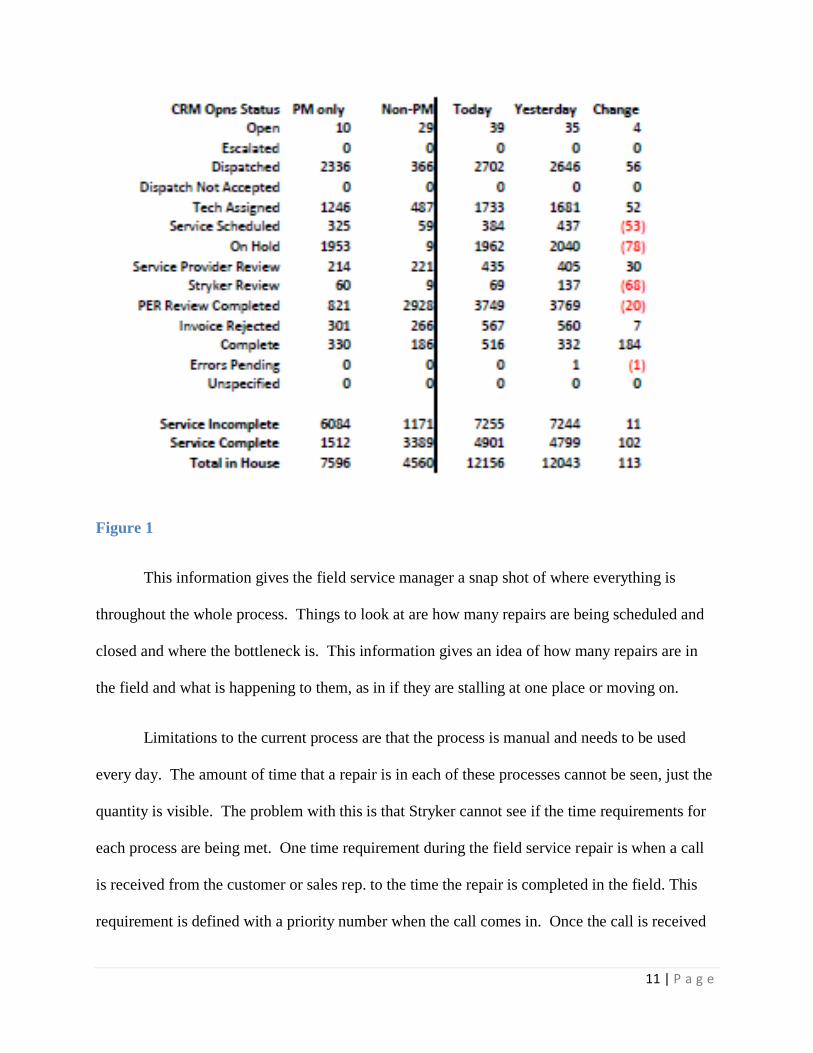
Information gathered includes each of the major processes during a field service repair:
how many work orders were opened, escalated, dispatched, not accepted, have a technician
assigned, have service scheduled, are on hold, have a service provider review, have had a Stryker
review, that the PER review is completed, have invoices rejected, have completed work orders,
have errors pending and an unspecified section. All of this information is taken from the CRM
system and inputted into an Excel spreadsheet for evaluation. In the spreadsheet, the progress
from the previous day’s work is logged and tracked. (Figure 1)
11 | P a g e
Figure 1
This information gives the field service manager a snap shot of where everything is
throughout the whole process. Things to look at are how many repairs are being scheduled and
closed and where the bottleneck is. This information gives an idea of how many repairs are in
the field and what is happening to them, as in if they are stalling at one place or moving on.
Limitations to the current process are that the process is manual and needs to be used
every day. The amount of time that a repair is in each of these processes cannot be seen, just the
quantity is visible. The problem with this is that Stryker cannot see if the time requirements for
each process are being met. One time requirement during the field service repair is when a call
is received from the customer or sales rep. to the time the repair is completed in the field. This
requirement is defined with a priority number when the call comes in. Once the call is received
12 | P a g e
the Stryker call center personnel and the customer work together to establish how quickly the
repair needs to be made. Once this time frame is established the call center personnel places a
priority level on the repair that is a P1(24 hours), P2(48 hours), P3 (at earliest convenience) or
P4(typically scheduled out 6 months for preventative maintenance). This is a very helpful
system for the customers so their repairs get completed but it cannot be monitored by Stryker.
Even though there is a requirement for time, Stryker cannot tell if it truly was completed
in that time or not. Currently the only way these time requirements are monitored is by the
customer response to the repair time. If there are many calls from customers stating they were
dissatisfied with the timeliness of their repair, then Stryker knows there were repairs that did not
fall within the timeframe they requested the repair to be done in. This is an unscientific way to
monitor the priority requirements and can be subjective if a customer is dissatisfied because there
is no proof to show the time frame customers get their repairs done. Also, another problem is if
a medical device malfunctioned in a way that could injure patients and is not reported in that
device’s medical record within 28 days of the reported problem per Stryker requirements and 30
days per FDA requirements it could be an FDA audit finding.
For this project one of our focuses is on the Stryker review and rejection section of
repaired work orders. The rejection section shows the accuracy of completed work orders from
the field service provider. If the documentation is rejected this means that the service providers
filled out the documentation incorrectly and it cannot proceed to the next step. Once
resubmitted, the rejection process requires the documentation to go through another review by
the provider and Stryker so this is a waste of everyone’s time. Currently this rejection rate does
not have a quality goal for percentage rejected per technician or service provider. This
13 | P a g e
percentage is randomly logged about once every two weeks. It is also a manual process in which
the coordinators fill out an Excel spreadsheet for how many rejects they have done for the day.
The second section we are focusing on is the Stryker “PER reviewed data”; this is how
many invoices that Stryker employees have to review. There are no goals of how many work
orders can be in each section of the spreadsheet so essentially there is not any goal besides the
employees do as much as they can throughout the day. The reason there is no goal is because the
process is not consistent, there are many reasons the documentation needs to be rejected and it is
hard to quantify how many work orders need to be reviewed a day. The field service manager
does a calculation to show how many days behind the review team is. This calculation will show
if the team is gaining or losing on the overall problem.

14 | P a g e
VI. Root Causes
The entirety of the process is large and complex, spanning multiple organizations in
many steps and sub steps. Potentially there is room for improvement in many areas, from the
systems and training of individual contractors to Stryker’s enterprise software and database
systems. In this case, we have identified the three most glaring issues contributing to the
unacceptably long throughput time. These parts of the process are lettered in Appendix A.
Invoice Processing Backlog
The first problem encountered in the process occurs after the repair has been conducted
and the invoice has been submitted to Stryker. Once received, the invoice joins a queue where it
awaits processing. This backlog creates a situation where an invoice must join the queue and
wait a significant amount of time before it can be processed. This certainly adds to the time of
the overall process and removing this wait could reduce throughput time tremendously.
The buildup of this backlog was coincident with the transition to Stryker’s current Oracle
Customer Relationship Management software system. Some of the related causes that were
posited by the staff were the learning process and associated high error percentage when the new
system was rolled out. Another was that the poor performance of the system, especially near the
beginning, reduced processing efficiency. Fortunately, and as evidenced by the relatively stable
size of the queue, most of the causes of this backlog lie in the past. However, the backlog itself
remains a root cause of the excessively high average throughput time, and clearing it should be a
priority.

15 | P a g e
An issue closely related to clearing this backlog is that of the processing staff’s capacity
to review and close the current number of invoices coming in. The first potential problem to be
investigated is the efficiency of the current staff. One of the things that stood out in our
discussion is the fact that many of the department employees take on many and various tasks and
serve other roles outside of invoice processing. While these other tasks are certainly valuable,
they do reduce the capacity of the staff to accomplish the review process. There are also several
other factors, such as error rates on submitted invoices and long waits for these errors to be fixed
that slow down the review process and reduce capacity, and these will be addressed separately.
In an interview with some of the invoice processing staff, they asserted that despite the fact that
there is significant room for improvement in efficiency, they feel the department is capable of at
least keeping pace with rate of incoming invoices.
The question as to whether or not the staffing level of the department is adequate to
accommodate the number of invoices it is being asked to process certainly needs to be addressed.
Even if the size of the queue were stable or slowly decreasing, the presence of the backlog and
its drag on the process means that in the current situation, even sufficient capacity may not be
good enough. The problem of the unacceptably large queue will persist until either staffing
levels or efficiency can be increased, even if temporarily.
Invoice Rejection Rate upon Submission
Another area of concern that has been identified is the high rejection rate of invoices
during the invoice quality review portion of the process. This is the point at which Stryker staff
reviews the invoice for errors or missing data in order to assure that is acceptable for closing and
release. At this point, nearly 50% of invoices submitted are rejected for errors or missing

16 | P a g e
information. This adds significantly to overall throughput time since the invoice must be
returned to the vendor, corrected and resubmitted to Stryker.
The obvious question here is why is the error rate so high? In speaking with the staff
responsible for review and processing, one of the common errors cited were typos being made in
the entrance of test data, such as numbers being transposed or decimal points being placed
incorrectly. Such errors result in data that can be outside of the normal range by factors of 10 or
100. While these errors are highly obvious, the current system allows these inputs to be
submitted to Stryker and the invoice to be subsequently rejected. Neither the Oracle CRM
system nor the electronic forms that are submitted by companies not using the system check that
the inputs are within a relevant range or in a proper format. This could reduce the number of the
simplest errors greatly.
Another reason for the high error rate is the lack training, both initial and remedial, for
the service technicians who are filling out the forms. The invoice review and processing staff
did mention that they had directly trained a new batch of technicians, but the results of that
process change have yet to be borne out in the field.
Additionally, there seems to have been little emphasis on correct invoice submission.
The problem of high error rates on submitted invoices has persisted despite the numerous
rejections. Not only does the error rate persist, but the same errors from the same people at the
same vendors persist. The problem is not one of lack of communication or capability, but one of
lack of caring. This problem is allowed to persist in part due to the fact that there are no
consequences, financial or otherwise, imposed upon those companies or individuals who
repeatedly submit faulty invoices.
17 | P a g e
Another reason this invoice rejection problem has been allowed to persist is that it is not
being measured. There is no metric that defines an acceptability range for invoice errors nor is
there any tracking of what errors are being made by whom and how often. This makes it
impossible to target remedial training or spotlight deficiencies. Consequently, neither is being
done and a long as this is the case, the error rates will not improve.
Return Time of Rejected Invoices
Another part of the process that seems to be excessively protracted is time it takes for a
contractor to correct and return a rejected invoice to Stryker. This takes up to 60 days to
accomplish. Given that the error and rejection rates are as high as they currently are, this
slowdown in the process is particularly crippling. Equally frustrating is that the errors requiring
correction are often very simple.
As in the case of errors themselves, there seems to be a lack of emphasis on speedy return
time of a rejected invoice. In areas of the process where there is an emphasis on supplier
performance, such as response time to the initial service request, service calls being made or the
submission of the initial invoice, performance typically occurs well within the established
timeframe. Once again, there are no consequences, financial or otherwise, to the vendors for not
resubmitting in a timely manner. There are also no established metrics to identify, or procedures
for correcting poor performance in this area.
A contributing factor to the sluggish response times to invoice correction is that there is
no system in place that supports that part of the process. An invoice that is resubmitted to a
contractor with a request to correct and resubmit can simply sit in a technician’s queue,
effectively ignored, indefinitely. No system is in place that forces the prioritization of these

18 | P a g e
invoice corrections, which results in them always being a second tier priority. There is also no
mechanism for reminding the technicians that they have outstanding rejected invoices to correct.
The result is a system where a rejected invoice can sit out of sight, out of mind with no
consequences indefinitely.
19 | P a g e
VII. Recommended process improvements
Capacity
The first recommended process improvement is to have all the field service providers
submit paperwork electronically through the CRM system. Without having to manually data
enter the information, the time saved per work order is about 4 minutes. Currently, about 65% of
the amount of submissions received are on paper and not electronically. Changing that one part
would save time and reduce the number of field service representatives required for the capacity
of the department, saving money.
Consistency
The second item recommended for a process improvement is to make the repair work
orders more consistent. The first item would be to follow-up on the training with the technicians
regularly, whether they are doing well or not with the submissions of paperwork. The ones doing
well deserve to be told that and thanked. Plus there might be helpful hints for others who are not
doing as well. This can be a process developed similar to market research with specific
questions, and utilized quarterly. The goal would be to assess if more training is necessary, or if
there are any other issues that would not be apparent without the call.
Results Oriented Metrics
Another recommendation is to create a goal for the field service technicians regarding the
rejection rate. The current process does not include any metrics for management to evaluate the
process and identify concerns. Without the metrics in place, the field service technicians and the
20 | P a g e
vendor companies do not have a reason to care about the new invoicing process. Creating a goal
and knowing there will be follow-up could help reduce the number of rejects the first time
through and reduce the amount of multiple submission errors. An example would be a tiered
billing process where paperwork correctly completed by a certain amount of days would mean a
greater payment to the vendor. The longer it takes, the less the hospital will owe, within a
reasonable time frame.
Smarter Forms
Updating the RWOs would help to limit some of the errors by not letting the field service
technicians make the submission without certain parts being filled out, for example, before
submitting. Also, the fields could be set up where the format or range has to be correct. Without
the required fields being filled out correctly, the submission would not be accepted by the
system, and the errors highlighted.
A second part to smarter forms is having some parts automated based on input. One of
the common items, for example, is mileage. Everyone is paid the same amount. A smart form
could include an automatic total based on the amount of miles entered. Another common item is
shipping cost per part. The cost is the same regardless of the distance shipped. A third item that
would also fit the criteria to be automated is freight. All of these would save calculation and
manual data entry time.
Visibility
Visibility of rejections is another important recommendation, and is in two parts. The
first is for Stryker. Currently, the amount of rejects are not monitored other than a total quantity.
21 | P a g e
Utilizing the reports in the CRM system would allow the field service manager to understand the
entire picture for the RWO process and specifically the rejects. Visibility means they would
know when there are bottlenecks as they occur, and if there are issues specific to any particular
Vendor or RWO. In addition, they could discuss these issues at the daily huddles in order to keep
everyone aware and gain feedback.
The second part to visibility is to the field service technicians. An repair work order is
assigned to a case, and in CRM, each case has an owner. When a repair work order is rejected, it
is assigned back to the field service technician’s queue or the company’s queue to delegate.
Some of the vendors resubmit them within the same day or next day while others may take
weeks. Without it being pointed out, they may not be aware anything was returned. A suggestion
is to send an automated weekly reminder to the vendors and bring it to their attention that they
have repair work orders to resubmit. The idea is to reduce the amount of time they are in the
system, and show that it is being monitored. This process could be tiered where the higher
priority issues are followed up within 24 hours, and lower priority items after a few weeks with
phone calls from the field service manager. It will reinforce the urgency and make sure there are
not any additional questions or concerns from the field representative.

22 | P a g e
VIII. Measurement of Improved Process
To establish a better way to have visibility of the whole process, Stryker could use the
report in the CRM system that has already been created. Currently the information needed can
be seen in the CRM system but it is not being utilized. This report allows the field service
coordinator the ability to see how many work orders are open and also shows the average amount
of time it has been in each step in the process (see Figure 2).
Figure 2
This information is similar to what the current report shows, with more detail on what the
average amount of time it takes for each step of the process. Having the ability to see how the
rejection rate for the service provider is going will allow Stryker to work with the suppliers to
decrease the amount of rejects over time. This is a report that was just released but needs to be
understood by the coordinators to be utilized.
23 | P a g e
Capacity Evaluation
An evaluation of the total capacity of the Field service coordinating team was done. The
reason this was important is because the team is behind by at least one month’s worth of work or
approximately 5000 Repair Work Orders. This evaluation examines the current state of the
system and then looks at what the improvements to the process will provide to the team as far as
time savings. This is a very critical tool because it allows us to look at the current state of the
team to see if they have the capacity to keep up with the current work load or if they are under
producing and need a little motivation.
The first step of the capacity evaluation was to determine how many working hours are
available for each employee. To do this we reviewed the employee’s normal daily and monthly
activities. On a normal day the employee works eight hours. During the day, an employee has
two paid fifteen minute breaks and one team huddle where the team talks about what they are
going to do for the day that takes about twenty minutes. Once those times are removed from the
day each individual will have about 7.17 hours to work a day. One additional daily variable is
that humans are on average only about 85% efficient. The 85% efficiency takes into account
bathroom breaks, worker fatigue, being able to have a short conversation with a coworker and
daily personal needs. Once the 85% efficiency is applied to the day, the average worker has
approximately 6.10 hours of true work that they give throughout the day. After the daily
working amount was established we looked into the month as a whole and subtracted monthly
activities for the hours that are worked. The activities that are done throughout the month that
take away from an employee’s time are: monthly department meetings which take about two
24 | P a g e
hours, monthly training that takes about ten hours, Cup of Joe meeting which is a meeting with a
community leader or executive at Stryker which last for about one hour, and finally other
miscellaneous things that take up about five hours from the month. With all the monthly
subtractions the total working hours per month, based on a 21 working day average is about 110
hours per person.
Also, a small snapshot in time of each employees day was logged to see how much of
their day is spent on reviewing Repair Work Orders. It was found that about 30% of their day is
spent on other activities that do not relate to the main function of the group. Given that 30% of
their time is spent on other activities the total monthly availability for one person is 77 hours. In
the proceeding sections calculations will be done to show what the capacity of the group is if
20%, 10% or 0% of the groups time is spent on just the Repair Work Order process because it is
unknown if 30% is a true number because the data could only be recorded for 1.5 days due to
time restrictions for the group.
The time standard used for this is as follows for each step. Step 1 is review the work
order which is a general review of the technician’s comments and a review of all the test results
to verify it is filled out correctly. Also, they enter the supplier’s charges for parts, freight, the
cost of miles driven and labor hours. The average for this step is approximately 4.47 minutes.
Step 2 is only needed if a customer does not use CRM, which is all of the manual data entry into
the CRM from the paper documents received from the field service vendors. Currently 65% of
the field service vendors do not use the data entry portion of CRM. This step typically takes
about 7 minutes but for the capacity study the time was weighted so it could be used as a total to
show the state of the current process. Step 3 is when the repair work order is closed and
25 | P a g e
documented and finally Step 4 is when the repair work order is released into the system which
was about 2 minutes.
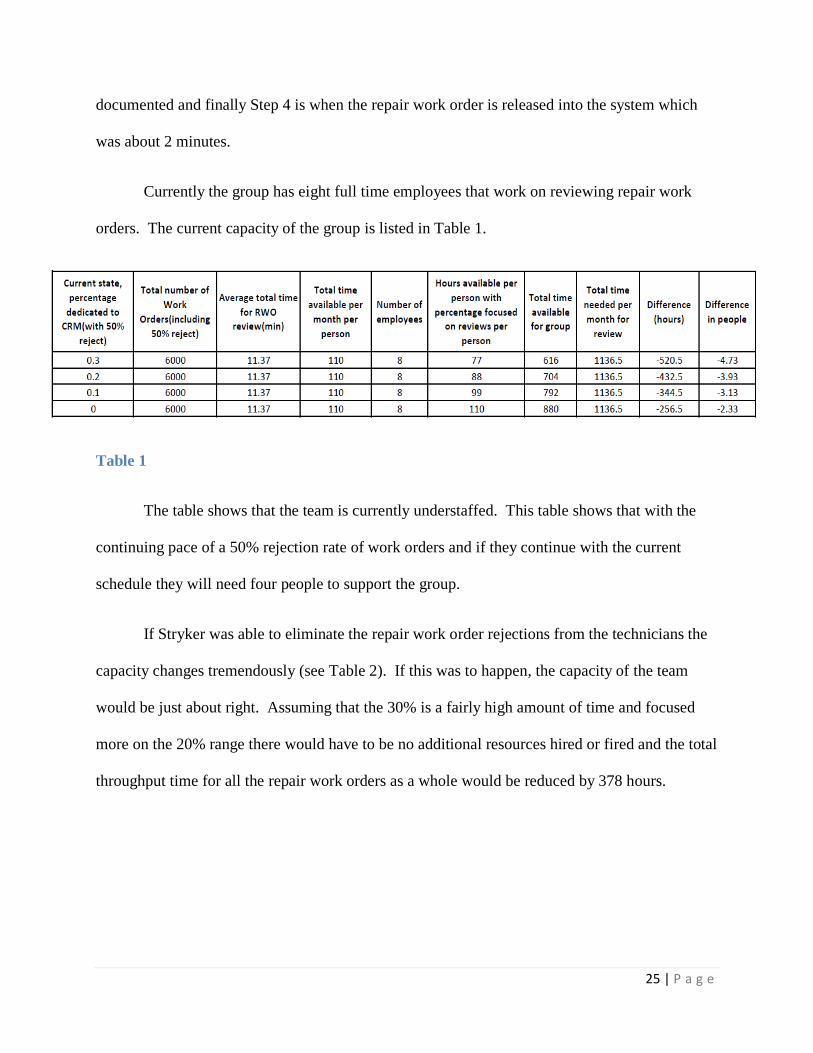
Currently the group has eight full time employees that work on reviewing repair work
orders. The current capacity of the group is listed in Table 1.
Table 1
The table shows that the team is currently understaffed. This table shows that with the
continuing pace of a 50% rejection rate of work orders and if they continue with the current
schedule they will need four people to support the group.
If Stryker was able to eliminate the repair work order rejections from the technicians the
capacity changes tremendously (see Table 2). If this was to happen, the capacity of the team
would be just about right. Assuming that the 30% is a fairly high amount of time and focused
more on the 20% range there would have to be no additional resources hired or fired and the total
throughput time for all the repair work orders as a whole would be reduced by 378 hours.
26 | P a g e
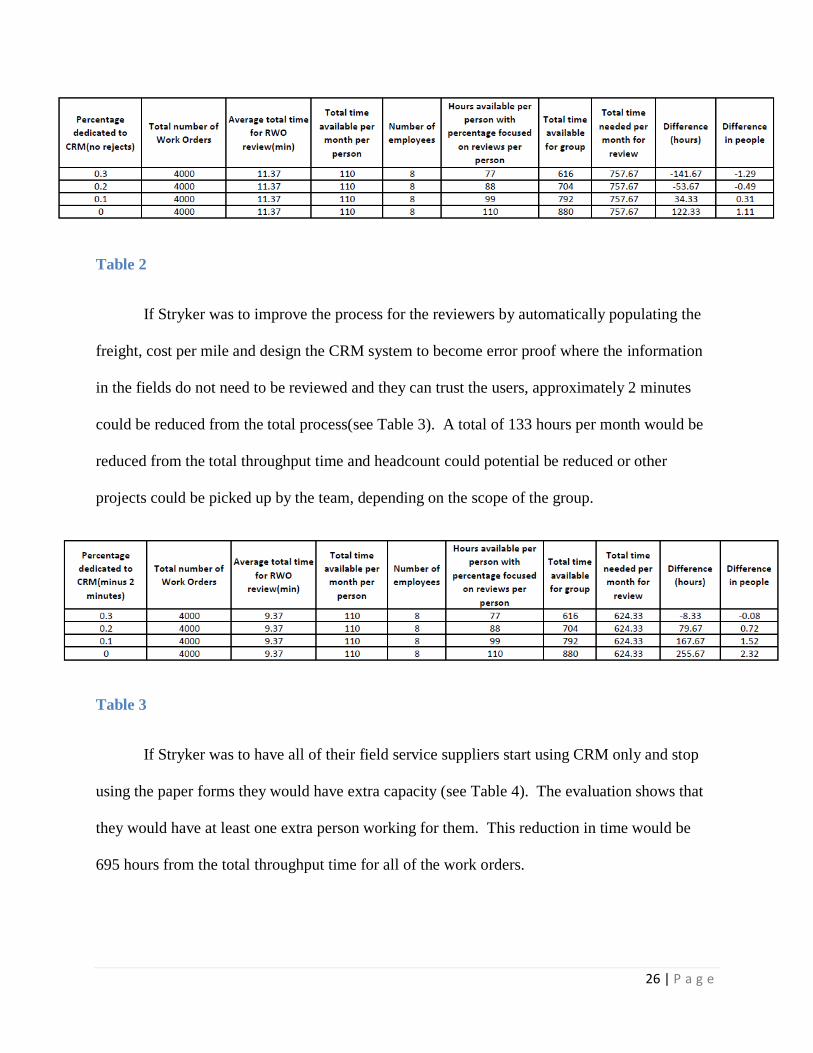
Table 2
If Stryker was to improve the process for the reviewers by automatically populating the
freight, cost per mile and design the CRM system to become error proof where the information
in the fields do not need to be reviewed and they can trust the users, approximately 2 minutes
could be reduced from the total process(see Table 3). A total of 133 hours per month would be
reduced from the total throughput time and headcount could potential be reduced or other
projects could be picked up by the team, depending on the scope of the group.
Table 3
If Stryker was to have all of their field service suppliers start using CRM only and stop
using the paper forms they would have extra capacity (see Table 4). The evaluation shows that
they would have at least one extra person working for them. This reduction in time would be
695 hours from the total throughput time for all of the work orders.

27 | P a g e
Table 4
Finally, if Stryker was able to have their suppliers use CRM and they could introduce the
cost saving ideas, the changes would be significant (see Table 5). The capacity for the group
shows that the headcount could be reduced by two or more employees and that the total time
saved during the throughput process is 828 hours. This is a substantial reduction in time which is
more than a 70% savings.
Table 5
28 | P a g e
IX: Recommended Reengineered Process
Reengineering is defined as “the fundamental rethinking and radical redesign of business
processes to achieve dramatic improvements in critical, contemporary measures of performance,
such as cost, quality, service, and speed.” The principles behind reengineering are consistent
with those of total quality management. It’s a way to redesign a process to focus only on steps
that bring value and quality. The seven principles are:
1. Organize around outcomes, not tasks
2. Have those who use the output of the process perform the process
3. Merge information-processing work into the real work that produces the
information
4. Treat geographically dispersed resources as though they were centralized
5. Link parallel activities instead of integrating their results
6. Put the decision point where the work is performed, and build control into the
process
7. Capture information once, at the source
If Stryker had the opportunity to recreate the wheel on their outsourced repairs and
maintenance, a good example to follow would be the common procedures used by large
cable/internet companies to do their installations. Let’s look at their procedures and then apply it
to Stryker using the reengineering principles:
Step 1: A customer calls requesting an installation.

29 | P a g e
Step 2: The customer service representative enters the information for a technician to
perform the work.
Step 3: The technician arrives at the customer’s location and performs the work.
Step 4: The technician leaves the customer temporarily to enter the data into their tablet.
Step 5: The technician shows the customer using the tablet all the information related to
the work completed. The customer signs directly on the tablet, which confirms the work
was complete as stated.
Step 6: The signed electronic form is uploaded to the companies invoicing software.
The steps after the completion of the work are where we identified the majority of the
problems in our earlier analysis of Stryker’s current flow chart; therefore, steps one through three
would remain unchanged for Stryker. Using principle number one for reengineering, the task at
hand after steps one through three is completing an invoice; however, the outcome desired is an
accurate and timely invoice. If all vendors were required to use tablets that were embedded with
smart invoicing forms that would check for common errors, the outcome desired could be more
feasible. Additionally, Stryker employees would save time from data entry on current manual
invoices.
Getting the customer’s signature the moment the work is completed can ensure better
accuracy for two reasons. In theory, a technician is most knowledgeable about a repair minutes
after the repair is completed. If the invoice is prepared on site then the information provided to
Stryker should be very accurate. Also, if the technician is required to show the customer the
inputs in order to get a signature, the technician can catch any mistakes while going over the
invoice. The signature can then be considered a check point by a third party in whom the results
30 | P a g e
of the invoice have a monetary impact. This relates back to principle number six of the
reengineering movement, where controls are built into the process.
Completing the invoice electronically immediately after the work is done and having
additional check points on the accuracy of the information significantly reduces the throughput
time of this process; however, one can’t forget the human aspect of a process. Although the
information would be easier for the technician to recollect and would be reviewed by the
customer, additional time savers put in place by Stryker for the vendors would be good for
business and highly appreciated. For example, some inputs in the invoice forms can
automatically be populated based on the vendor, such as mileage rate. Also, visible alerts for
information that is inaccurate like failing test results or unreasonable mileage would benefit the
vendor because they can fix their mistakes before showing a customer and having to go back and
repeat the process. It would also help them avoid any embarrassment or feelings of
incompetence in front of a customer. On the other hand, it’s also better that customers don’t see
the ease of making a mistake on an invoice. The more they can testify for the accuracy of the
invoicing process, the more they trust in the company they conduct business with.
Since a reengineered process is consistent with total quality management and Stryker is
currently launching a quality overhaul, the recommended process would fit nicely with the
company’s vision. The quality can be seen by the customer, the vendors, and the Stryker
employees. The customer would have more visibility and timelier invoices from Stryker. The
vendors would have better technology and forms to facilitate their process. Lastly, the Stryker
employees would see the quality of their workload improve with less rejections and backlogs.
31 | P a g e
X. Limitations of the Study
During the study of the Field Service Throughput project, we came across many
limitations. There were many things that we wanted to measure, but simply did not possess the
data. Some areas looked ripe for investigation, but the timetable of the project simply did not
allow for it. Still other areas seemed like obvious improvements were possible, but these
improvements were beyond our control or simply not feasible.
Perhaps the largest single limiting factor for the study was simply time. The compressed
nature of the summer semester meant that the project time table was extremely short. Not only
was the timeframe short, but everyone in the group was exceptionally busy with work, class, and
other outside commitments. Stryker was also going though the process of an FDA audit while
we were conducting our project, limiting the amount of time Stryker employees were available to
use as resources. The limiting factor of time forced the group to focus on what we saw as the
low hanging fruit in terms of process improvement. Thus we concentrated on the simplest
solutions to the most obvious problems. Although we believe there’s a big cost benefit to some
of our recommended improvements, the time constraint did not allow us to gather all the
information necessary to make an appropriate and useful cost benefit analysis. While these
improvements could potentially have the greatest yield from a cost/benefit standpoint, many
areas potentially containing problems could not be investigated, which results in several
unidentified solutions not being explored.
One of the specific data gathering strategies we looked into and indeed would have
pursued time permitting was telephone interviews with technicians. These conversations, with
those who were exceptionally good, exceptionally bad, and those who had shown a great degree
32 | P a g e
of improvement with regard to invoice accuracy could have yielded excellent insights and
supporting evidence for process improvements.
Limitations in data were also impactful to our measurement of the process. The process
of data gathering started by the identification of what data would be helpful to us. Then we had
to attempt to gather the data from various sources. In some cases, we found that the data did not
exist. In one case we found that the newness of the CRM system in conjunction with the length
of the entire process caused the data that that particular system provided to be skewed toward
only the most successful cases that had moved through the process. The biggest limitation in
regards to data was the fact that it often took well into the compressed timeframe the project for
data to become available, limiting our ability to perform analytics.
As mentioned previously, there were many problems with potential solutions that we
were forced to leave outside the scope of our project for various reasons. Some of the most
obvious of these were rooted in the IT systems. Some of Stryker’s largest contractors for field
service do not use the Oracle CRM module to enter their repair data. Invoices submitted outside
of the CRM system require manual data entry, a step which could otherwise be skipped. The
limitation here was that those large suppliers have significant power and simply demanding that
they use the Oracle system is neither feasible nor productive. The solutions to that particular
issue lie far outside the scope of our project.
Another issue that became apparent is that the newer Oracle CRM module is being used
in conjunction with an AS 400 legacy system, and the interaction between the two is not always
seamless. Indeed, part of the reason for the massive processing backlog lies in the interaction
between these two systems. One specific example we came across was that issues involving
changing the account to which a machine belonged had an unavoidable 24 hour waiting period to
33 | P a g e
deal with as the legacy system still relied on batch processing. The obvious solution for all of
the numerous interactional issues in the long term would be the installation of a fully integrated
ERP suite. However, the expense of this solution would be colossal and the project would dwarf
the scope of a field service throughput project.
Another improvement we had considered was automating all or portions of the product
experience review and the invoice quality review. Standardized keywords could be used to
identify potential FDA compliance issues and invoices with errors could be automatically tagged
for further review if needed. However, there was some uncertainty regarding the legality of
automating the review process and, given the current error rate, well founded concerns regarding
accuracy.
34 | P a g e
XI. Lessons Learned from the Project
Toby Moenke:
For this project I learned how to apply tools and techniques that I would typically use on
the manufacturing floor to office employees. I am very happy with how this process went, I did
not know how well it would go with a different type of employee but so far it has gone very well.
Obviously, we are not in the implementation stage to verify that everything worked as planned
but I would say so far so good. We found an area to improve a process and that was rewarding
to me. The interviews and discussion within the process felt very familiar to what I am used to
when I talk to the manufacturing floor which was great. To make it as simple as possible they
have problems, we went in and talked to them and created some good ideas and solutions to
make the employees job easier and in turn make the process faster and more efficient which
means there will be a cost savings as well.
I have always known that some companies hire and fire people and other companies just
make them work overtime. I now understand that these are strategies that companies use and
each are unique to the companies needs. For instance this project may require more manpower
to help them get through the current problem but when the process changes they may not need
the manpower and that makes me think of the Chase Strategy. It is nice to see a real example of
this strategy, the concepts in class were very clear but seeing it in real life was great too.
35 | P a g e
XI. Lessons Learned from the Project (continued)
Veronica Humpierres:
I learned that even large corporations like Stryker can benefit from the application of
concepts that have been around for some time. When implementing a new idea, the least value-
added steps are rarely looked at until later in the implementation process. Taking time to
evaluate and look for improvements in these areas can sometimes benefit even bigger areas like
FDA compliance regulations. Applying concepts from class like throughput time, capacity
calculations, and fishbone charts are a lot easier to do in a real work environment than it might
appear on paper.
The concept I benefitted from the most was reengineering. A lot of times I look at
processes and think of little things here and there that can be changed to make things easier;
however, it doesn’t usually cross my mind to do the entire process differently. The
brainstorming we did as a team to come up with a reengineered process for Stryker was very
insightful and I feel we came up with a really creative idea that in theory could actually be
implemented in some form in the long run.

36 | P a g e
XI. Lessons Learned from the Project (continued)
Stacy Burdette
What I learned most was how to apply concepts in class to an actual company. Almost
every class in the MBA program involves at least one class project. Most of them have revolved
around research and theory. Although that applies in this case, too, we had the chance to add
application. Our interviews were with actual employees and the research was based on company
information, including a large portion that would only be found through internal access.
I also learned that even “good” companies are subject to constant process improvements.
Analysis is continuous, and having the foresight to look ahead and at the bigger picture is
important. Without looking at the bigger picture, parts are forgotten or not thought of in the
beginning, and it causes higher workloads and more frustrations.
Our focus looked at the flow for the repair work order and narrowed down process
improvements. The ideas we discussed as a group was not only from different perspectives, there
are possibilities that our effort may be applied and ultimately improve the process, the
department and the Stryker to vendor relationship. I specifically liked this section because I have
seen and been a part of departments with similar issues. It is nice to know that whether our
group’s efforts help or not, that Stryker as a company is realizing where there are issues and
working towards overall improvement.
37 | P a g e
XI. Lessons learned from the project (continued)
Greg Skinner
This project was a great experience in that unlike so many group projects that I have
participated in for classes in the past, this one actually incorporated a real world situation. More
than just a case study or a research paper, this project has incorporated the actual experience. I
am currently in the middle of engineering a career change, with all of my professional experience
lying in flying, instruction and small airport operations. I have learned much in the accelerated
path I have taken toward my master’s degree in accounting over the past year and a half, but
while my head is full of excellent knowledge, the journey has so far lacked the opportunity to
apply concepts in the real world.
I have taken several classes in information technology and accounting information
systems which have resulted in quite a bit of book knowledge on ERP systems and their
modules. Having the chance to work on a project that revolves around, at least in part, the
Oracle CRM module and its interactions with a legacy database system has been quite
informative and has helped to cement the knowledge while also providing additional insights.
It is also very interesting to see that in the real word, these systems are not always the
perfect, airtight solutions to data transfer, analysis, and process management that they are often
portrayed as academically. As much as processes can be automated, this project has shown that
proper process design and much human shepherding are highly necessary to reap the benefits.
One point that has always been made in my academic introduction to these systems is that the
process of transition can cause enormous headaches in the short term, despite the long term
benefits. This project has certainly illustrated an example of just that.

38 | P a g e
XII. Sponsor Feedback

39 | P a g e
XIII. Conclusion
The throughput evaluation to reduce time for the Stryker field service process yielded
great results. An evaluation of the whole system was done from when the service request call
was placed to the time a Repair Work Order was completed. Currently the review process is one
of the larger bottlenecks and is easier to make changes to because it is a Stryker owned and
controlled process. The main focus of the review was figuring out why the Stryker coordinators
are approximately a month behind and have Repair Work Orders that are months old. The two
main factors for this large bottleneck is because under the current process the group is not staffed
properly or there is no mandatory overtime requirements to keep up with the work load.
There are three main areas that cause the Stryker review team to be so far behind and
they are the rejection rate back to the suppliers is currently about 50% which means half of their
day is non-value added. Also, the Stryker team spends non-value added time entering
information such as part freight cost, cost for miles traveled and cost per hour into the invoicing
system. Finally, only about 35% of the Field service providers use the Customer Relationship
Management (CRM) system which means the Stryker employees have to manually enter the
information into the CRM system.
Some of the process improvements ideas to reduce the rejection rate are to create an error
proof system for the suppliers by making smart forms for them to fill out which tells them if they
filled out something wrong and to establish a quality goal for the rejection rate for them. Also, if
Stryker was to auto populate the standard charges form the suppliers this would decrease the
review time. Finally, if all the providers used the CRM system the total time would be reduced
by half for these users because they would not have to retype something that is already typed. If
all of these changes were implemented the total time spent on the review process would be
reduced by about 70%.
40 | P a g e
Appendix A: Process Flow Chart
41 | P a g e
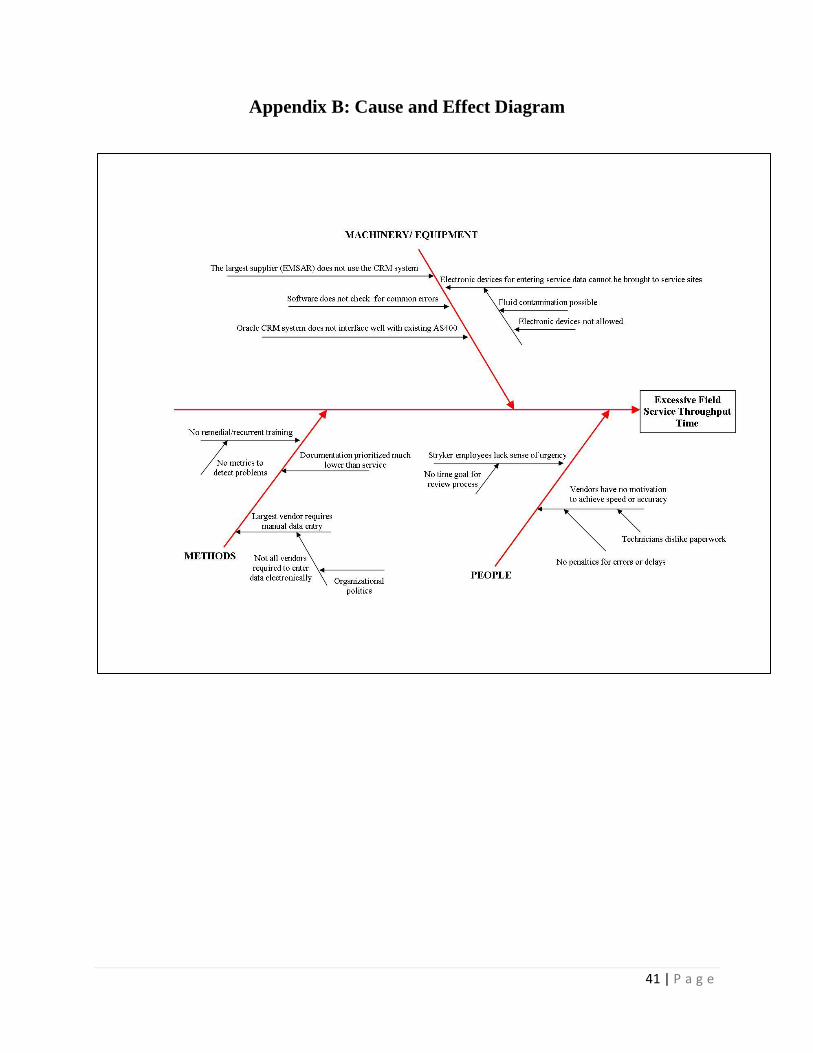
Appendix B: Cause and Effect Diagram


