
Student Financial Aid:A State and National
Perspective
September 29, 2011

Louisiana2011-2012 Appropriation
TOPS, $154,375,000
85%
SMFG, $1,000,000
1%
Go Grant, $26,429,108
14%
TOPS SMFG Go Grant
Need Based AidMerit Based Aid

*Total TOPS Awards to students since inception, including 23,616 awards in Academic Year 1998-99, 29,240 in 1999-2000, 35,812 in 2000-2001, 40,941 in 2001-2002, 40,182 in 2002-2003, 41,125 in 2003-2004, 42,539 in 2004-2005, 42,599 in 2005-2006, 43,692 in 2006-2007, 42,239 in 2007-2008, 42,261 in 2008-2009, 43,046 in 2009-2010, and 43,475 in 2010-2011 as of August 12, 2011.
**Includes TOPS Tech Early Start
TOPS Paid by School Type (Cumulative as of August 12, 2011)
School TypeCumulative Awards to Students*
Cumulative $
% of Total Awards
% of Total Dollars
2 & 4 Year Public Colleges and Universities
458,304 $1,257,662,719
87.0% 89.7%
LCTCS Schools 21,377 $21,436,206 4.1% 1.5%
Private Colleges and Universities
46,886 $122,124,849 8.9% 8.7%
Proprietary Schools 141 $89,127 0.0% 0.0%
Totals** 526,708* $1,401,312,900
100.0% 100.0%
3

TOPS FundingBy State Fiscal Year as of 8/4/2011
$-
$20
$40
$60
$80
$100
$120
$140
$160
54.067.4
90.0102.2
90.9 98.6 102.9 101.7 103.4 99.3 97.4112.6
128.4
46.2
0.2
1.8
13.711.9 14.1 15.1 17.1 17.3 22.3
17.3
16.0
15.9
3.3
92.3
Mil
lio
ns
State General Fund TOPS Fund Other
54.0 67.4 90.2 104.0 104.6 110.5 117.1 116.9 120.6 116.6 122.9 129.9 144.4 154.4
The 2011-12 data is current appropriation subject to change if a constitutional amendment passes in October 2011.

TOPS Academic Awards
Award Name
Minimum Required HS GPA
(Core)
Minimum ACT
Composite(Based on
State Average)
Required Curriculum
(Through HS AY
2012-13)
Required Curriculum
(Beginning w/ HS AY 2013-
14)
Award Value8 Semesters
or 12 Quarters
Opportunity 2.5 20 17.5 CreditsPrescribed College Prep
19 CreditsPrescribedWithin LA Core4
Amount equal to tuition and some fees
Performance 3.0 23 17.5 Credits Prescribed College Prep
19 CreditsPrescribedWithin LA Core4
Amount equal to tuition and some fees plus$400 stipend
Honors 3.0 27 17.5 CreditsPrescribed College Prep
19 CreditsPrescribedWithin LA Core4
Amount equal to tuition and some fees plus$800 stipend5

TOPS Technical Award
Award Name
Minimum Required
HS GPA (Core)Minimum ACT
Composite Required Curriculum
Award Value
2 Years
TOPS Tech 2.5 17or WorkKeys Silver level
score
Option 1 – 17 creditsTechnical Core
Option 2 - 19 creditsWith career option plan
Option 3 – 17.5 creditsRegular TOPS Academic Core
Tuition at an institution offering vocational or technical degrees (non-academic)
6

The Number of High School Graduates, By Class Year, That Took the ACT, Qualified for TOPS OPH and Were Actually Awarded
Total High School Graduates (Graduates of '97 and '98 Were First Awarded During Academic Year, 98-99)
Graduates Completing ACT
TOPS-Qualified Graduates (Excludes Graduates Qualifying for TOPS Tech, TOPS Teacher and Those Previously Awarded TAP and Honors Scholarships Who Were Continued Under TOPS)
Actual Awards Billed by Institutions to date (Excludes Graduates Qualifying for TOPS Tech, TOPS Teacher and Those Previously Awarded TAP and Honors Scholarship Who Were Continued Under TOPS)
* This is very preliminary data since billings for the Fall 2011 term are still being submitted by the schools.

*The High School GPA requirement for the Honors and Performance Award changed from 3.5 to 3.0.
TOPS Eligibles by Award Level and High School Graduation Year
Data as of 8/29/11

TOPS Expenditures and Recipients
$54.0
$67.5
$90.3
$104.0 $104.6$110.5
$117.1 $116.9 $120.6 $116.7$123.0
$130.7
$144.4$154.4
23,661
29,265
35,83340,983 40,199 41,464 42,573 42,621 43,716 42,254 42,282 43,048 43,288 43,341
0
10,000
20,000
30,000
40,000
50,000
60,000
70,000
80,000
90,000
$0
$20
$40
$60
$80
$100
$120
$140
$160
$180
1998-99 1999-00 2000-01 2001-02 2002-03 2003-04 2004-05 2005-06 2006-07 2007-08 2008-09 2009-10 2010-11 2011-12
TOPS Awards TOPS Recipients
Academic Year
As of October 30, 2009
Note: The 2011-12 Academic Year data shows the amount appropriated and projected to be expended for the year and the projected number of recipients.
$ in Millions Students

As of August 27, 2010
TOPS Recipients by Ethnicity and High School Graduation Year
AWARDS
High School Graduation Year

2011-12 Go Grant Eligibility– Apply by completing the FAFSA annually– Louisiana Resident as of the date the FAFSA is
filed– Certificate, diploma or degree seeking
undergraduate student at a Louisiana public or LAICU institution
– Must receive a Pell Grant
– Must have remaining financial need
– Must maintain Satisfactory Academic Progress (SAP) as defined by the institution

Go Grant Funding/Students
Year Appropriation Students Awarded2007- 2008
$2,000 annual award based on Estimated Cost Gap
$15,000,000 10,409
2008-2009$2,000 annual award based on
Estimated Cost Gap$24,226,000 15,973
2009-2010*Award Amount Changed to Accommodate Anticipated
Funding in Executive Budget
26,429,108 22,355
2010-2011$900 annual award
(New Framework proposed based on Cost of Attendance)
$26,429,108 30,738
2011-2012$1,000 annual award
$26,429,10830,000
(projected) 12

Ethnicity of Go Grant Recipients
3,8776,375
8,9803,052
5,205
8,394
1,784
3,482
676
492
848
1,620
0
5,000
10,000
15,000
20,000
25,000
2007-08 2008-09 2009-10
African American/Black Caucasian American/White Not Reported Other Minorities
13
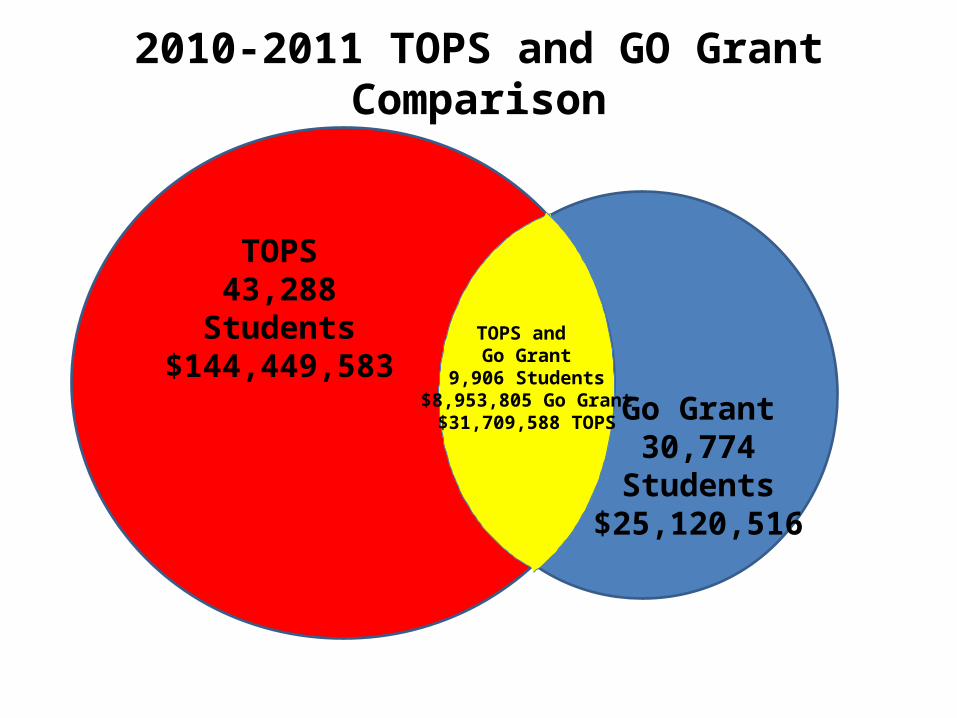
2010-2011 TOPS and GO Grant Comparison
TOPS43,288 Students
$144,449,583
Go Grant30,774 Students
$25,120,516
TOPS and Go Grant
9,906 Students$8,953,805 Go Grant
$31,709,588 TOPS

Federal Pell Grant EligibilityCertificate, diploma or degree seeking
undergraduate student attending public, private or proprietary (approved Title IV) Institution
Annually File the FAFSA and for AY 2011-12 must have an Expected Family Contribution of ($)5273 or less as determined by federal need analysis formula
Maintain Satisfactory Academic Progress (SAP) towards their credential (both qualitative and quantitative measures) to continue to receive award.

Pell Grant Maximum Payment

Pell Grants in Louisiana• 2009-10 Board of Regents Financial Aid Data
– 32% of undergraduate students received some amount of Pell
– Pell recipients were 49.9% Black, 38.2% White and 11.9% other/mixed race or did not report
– Average Pell award was $3900 at LA Public Institutions
• 2011-12 Pell Grant Maximum Award is $5500– Average tuition and fees at 4 year Public LA University
for 2011-12 is $4,915– For 2011-12, two universities have tuition and fee
amounts that will exceed maximum Pell

State Grant Aid• Louisiana Grant Aid* per Estimated
Population – 11th per total population ($36.08)– 16th per age 18-24 population ($339.46)– 9th per UG FTE in total grant aid ($883.04)– 36th per UG FTE in need based grant aid ($144.22)
• National average is $455• Highest is $1,125.42 (New Jersey)
*Grant Aid is aid that is not repaid and can be either or both need based and/or merit based

How Louisiana ComparesAcademic Year 2009-10
• Total all states’ expenditures on undergraduate aid programs– $9,722,273,000– Grant Aid Categories:
• 46.8% is Need only (9 states comprise 70% of this)• 16.3% is Need and Merit combination• 18.3% is Merit only• 12.0% is awarded for Special Purpose Programs (conditional
grants, state work study, loan repayment, etc)– 23 states spend in excess of $100,000,000 for student aid
programs• California was highest with $1,040,875,00• Louisiana ranked 17th at $162,092,000
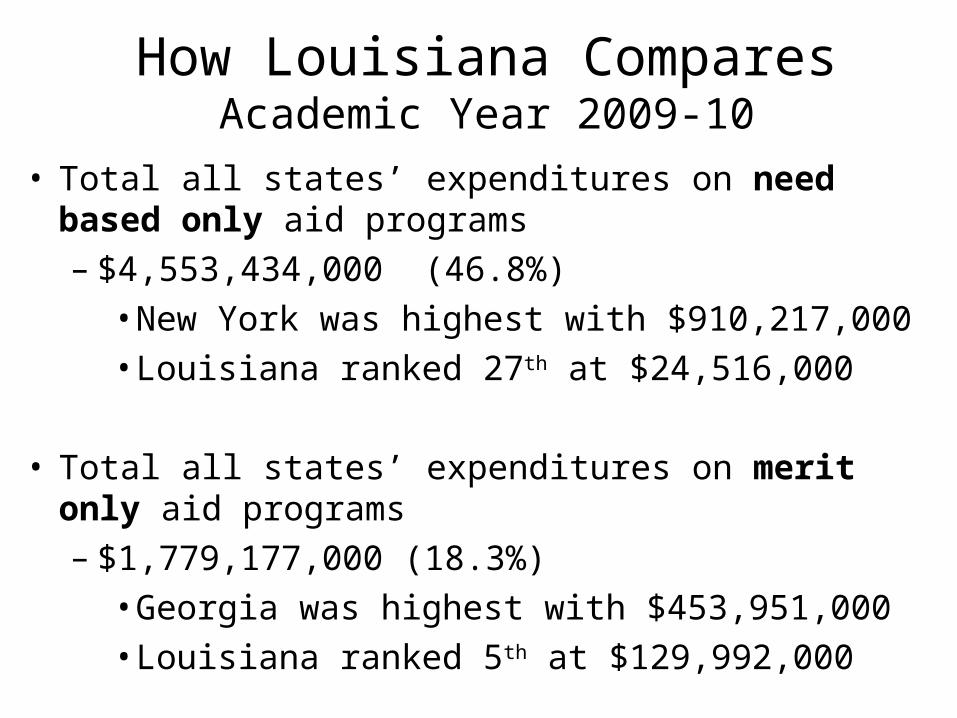
How Louisiana ComparesAcademic Year 2009-10
• Total all states’ expenditures on need based only aid programs– $4,553,434,000 (46.8%)
• New York was highest with $910,217,000• Louisiana ranked 27th at $24,516,000
• Total all states’ expenditures on merit only aid programs– $1,779,177,000 (18.3%)
• Georgia was highest with $453,951,000• Louisiana ranked 5th at $129,992,000

How Louisiana Compares• States with Merit-only Award Programs that comprise more than
50% of its aid dollars, where total aid dollars exceeds $100 Million (AY2009-10)
TOTAL AID MERIT- STATE EXPENDITURE BASED AID
– Louisiana $162.092 80.2%**– Tennessee* $338.685 70.3%– Georgia* $681.500 66.6%– Florida $663.456 63.8% – South Carolina $322.801 52.4%
*Funded by state lottery revenues**Estimate is 85% for 2010-11


