Download - Subnet Based Internet Topology Generation

Subnet Based Internet Topology Generation
Mehmet Burak AKGÜN
with Mehmet Hadi GÜNEŞ
ISMA 2011
Workshop on Active Internet Measurements

Outline
• Introduction
• Related Work
• Methodology
– Algortihm
• Results
• Future Work
2

Introduction
• Performance of network protocols are
dependent on the underlying topology
– network researchers use synthetic topologies in
simulations
• Researchers need realistic synthetic network
topologies
– which imitates the characteristics of the Internet
3
Literature Review
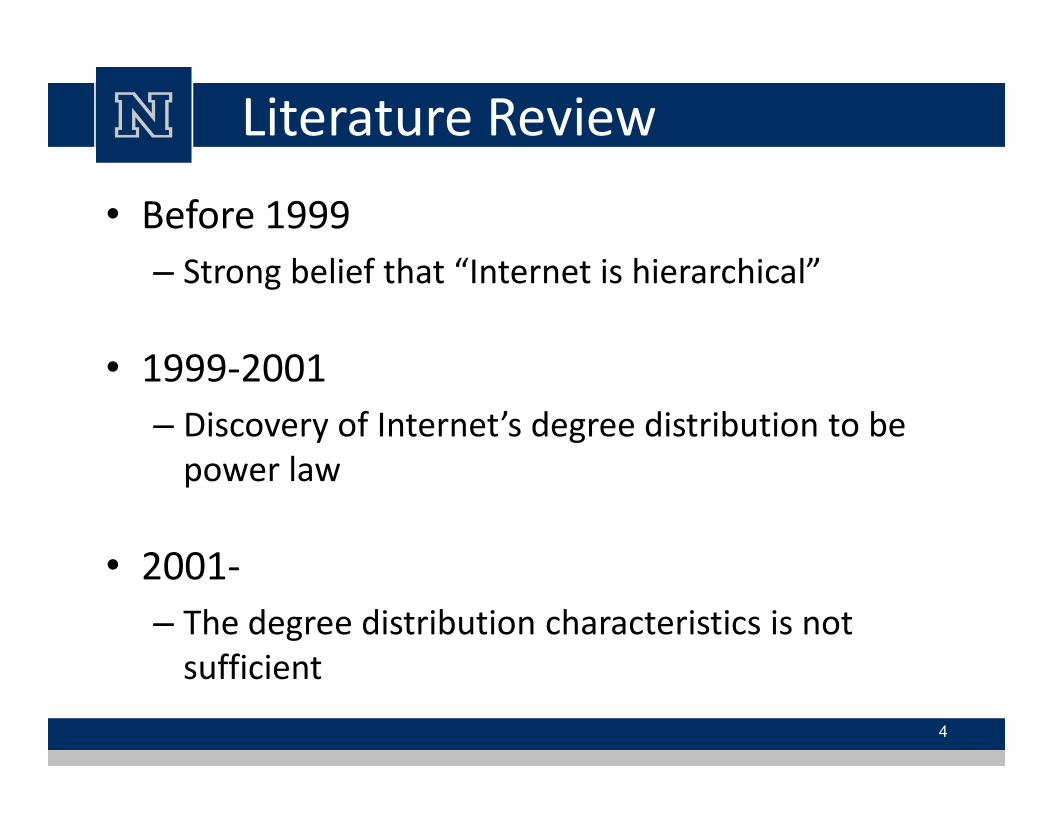
• Before 1999
– Strong belief that “Internet is hierarchical”
• 1999-2001
– Discovery of Internet’s degree distribution to be – Discovery of Internet’s degree distribution to be
power law
• 2001-
– The degree distribution characteristics is not
sufficient
4

GT-ITM [Zagura-96]
• Two types of hierarchical graphs(n-level, TS)
– Transit-stub reproduces the hierarchical structure
of Internet
1. A connected random graph is generated1. A connected random graph is generated
2. Each node is considered as a transit domain
– each transit domain is expanded to form another
connected random graph
3. A number of random graphs are generated
as stubs and connected to transit nodes5

BRITE [Medina01]
• Power law distribution due to
– preferential connectivity and incremental growth
• Skewed node placement
– area is divided into squaresarea is divided into squares
– nodes are distributed among squares
• Locality based preferential network
connections
– uses Waxman probabilistic function
• Node degree distribution is preserved
6

HOT [Mahadevan06]
• A systematic approach to analyze and
synthesize dK-series graphs
• Increasing k better models the Internet,
whereas increases computational complexitywhereas increases computational complexity
• 1K graphs model degree distribution
– is not sufficient
• 2K graphs match joint degree distribution
7

Outline
• Introduction
• Related Work
• Methodology
– Algorithm
• Results
• Future Work
8
Motivation
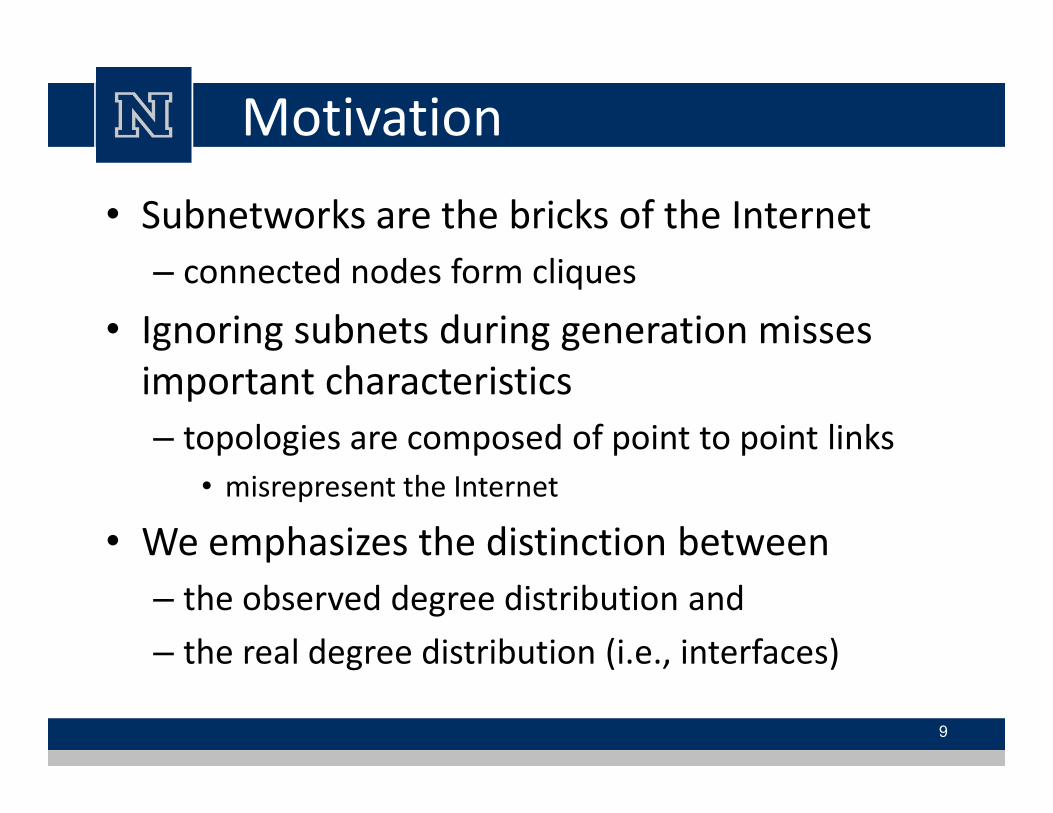
• Subnetworks are the bricks of the Internet
– connected nodes form cliques
• Ignoring subnets during generation misses
important characteristics
– topologies are composed of point to point links
• misrepresent the Internet
• We emphasizes the distinction between
– the observed degree distribution and
– the real degree distribution (i.e., interfaces)
9

Observed Degree vs. Alias
• Ignoring subnets results in a network of point-
to-point links only.
A C
C
10
A
B
C
A B
Network Topology Generation
• Objectives
– Subnet Distribution
– Observed Degree distribution
– Alias Distribution
11

Subnet Centric Approach
• Number of nodes (nuser)
• Subnet distribution for this many nodes
– Scale the values of the distribution with
nuser / nreferenceuser reference
– Large subnets may disappear in small networks
• distribute their ratio to closest subnet levels
• Create bins for each subnet
– place nodes into bins considering occupancy rate
12
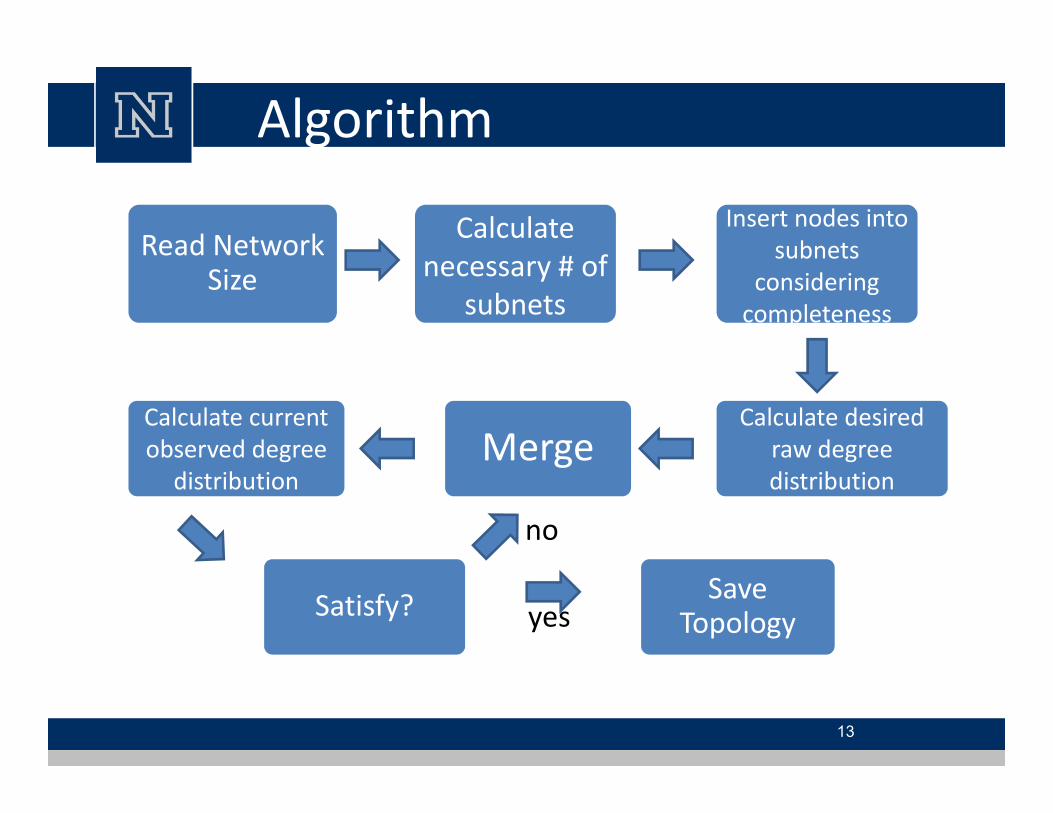
Algorithm
Read Network Size
Calculate
necessary # of
subnets
Calculate current Calculate desired
Insert nodes into
subnets
considering
completeness
yes
13
Calculate current
observed degree
distributionMerge
Calculate desired
raw degree
distribution
Satisfy?Save
Topology
no

Subnet Distribution
• Subnet distribution data is obtained from
Cheleby project
• For an 147K node network (nreference)
– 385K IP addresses (interfaces)– 385K IP addresses (interfaces)
14
/24 /25 /26 /27 /28 /29 /3X
Number of
Occurrence
4 36 184 1294 8836 93110 58011
Distribution (%) 0.002 0.022 0.11 0.80 5.47 57.66 35.92
Completeness (%) 26 30 28 27 27 39 100

Shifting Desired Degree Distribution
4
5
6
7
8
Nu
mb
er
of
No
de
s (L
og
sca
le)
Chart Title
0
1
2
3
4
1 10 100
Nu
mb
er
of
No
de
s (L
og
sca
le)
Oberved Node Degree
15

Shifting Desired Degree Distribution
4
5
6
7
8
Nu
mb
er
of
No
de
s (l
og
sca
le)
Chart Title
0
1
2
3
4
1 10 100
Nu
mb
er
of
No
de
s (l
og
sca
le)
Observed Node Degree
16

Example
Observed Degree Distribution
# of Nodesn=10, /29=2, /30=3, /31=4
Assume occupancy rates to be 100%167
1 14
17

ExampleRaw Degree Distribution
1
7 14
14 1
Continue until n=10
Consider power law distribution 1412
1 2
18

Outline
• Introduction
• Related Work
• Methodology
– Algortihm
• Results
• Future Work
19

Degree Distribution before Merging
100000
1000000
/24 /25 /26 /27 /28 /29 /3x
Completeness 0 0.33 0.21 0.31 0.51 0.54 1
# of nodes per subnet 0 41 13 9 7 3 2
1
10
100
1000
10000
100000
1 10 100 1000
20

Merging
• By merging 3 nodes of /25 , /26 and /27 we
can have a single node of degree:
– Raw Degree = 41+13+9 = 63
/27
21
A
/27
/25/26
! Merging can be performed
between nodes of distinct
subnets

Degree Distribution during Merging
CNL 2010 22

Degree Distribution during Merging
23

Degree Distribution during Merging
24

Degree Distribution during Merging
25
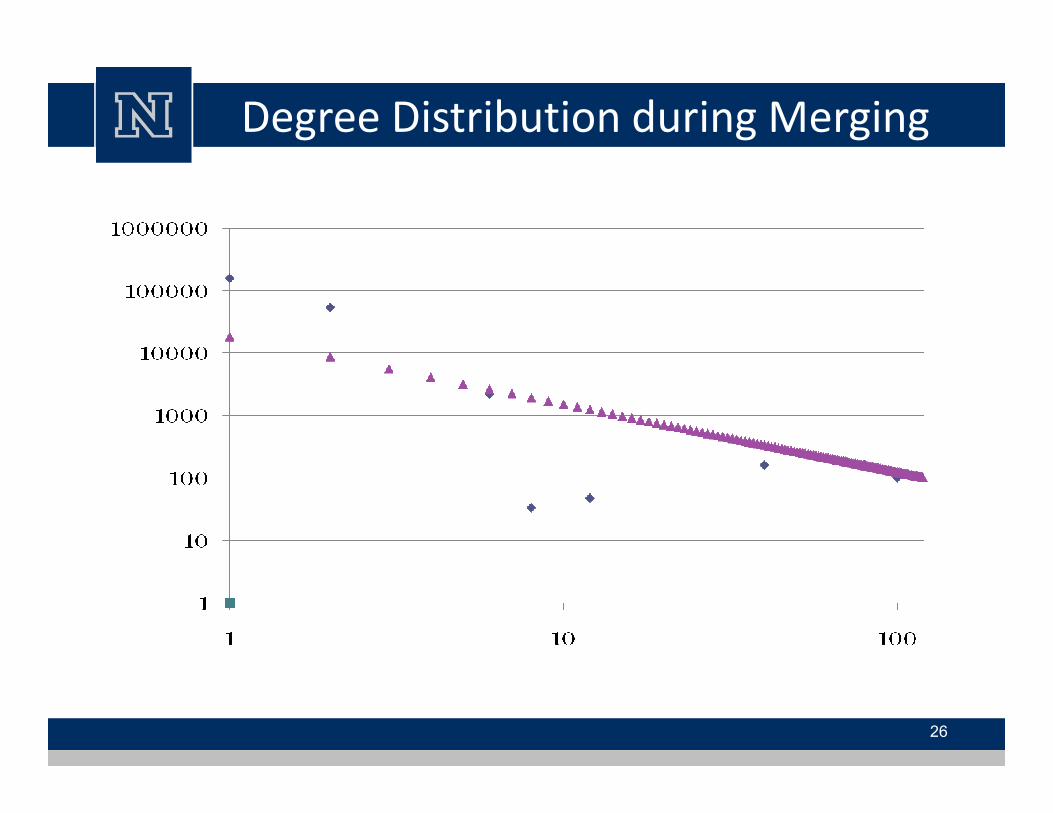
Degree Distribution during Merging
26

Degree Distribution during Merging
27

Degree Distribution during Merging
28

Subnet Distribution
• Although many merge operations are done,
subnet distribution is still satisfied.
/24 /25 /26 /27 /28 /29 /3X
29
/24 /25 /26 /27 /28 /29 /3X
Number of Occurence 0 9 51 128 313 18062 79674
Distribution(%) 0 0.01 0.05 0.13 0.32 18.39 81.10
Completeness(%) 0 33 21 31 51 54 100

1M node topology
10000
100000
1000000
10000000
initial
desired
final
30
1
10
100
1000
1 10 100

Size Distribution of Subnets
0.61
0.81
1.01
Fre
qu
en
cy o
f Su
bn
ets
/24
/25
/26
CNL 2010 31
0.01
0.21
0.41
1 10 100
Fre
qu
en
cy o
f Su
bn
ets
Number of Nodes in the subnet
/26
/27
/28
/29
/3x

Results
• Both subnet distribution and interface
distribution can be matched
– generates more realistic topologies
• Our method requires measurement data
– subnet distributions
– interface distribution
– exponent of observed degree distribution
32
Work in Progress
• Matching
– Characteristic path length
• rewring
– Assortativity
• subnet merging order• subnet merging order
• Same approach will be applied to satisfy
subnet and interface distributions
• Node centric approach
33

Thank you
Questions ?
34

Data Structure
SubnetLL *
Int Node id
Node Subnet Linked List
Other subnets
35
Subnet id
NodeLL *
Subnet
Node Linked List
Other nodes
Other subnets


