
Supercritical Water Mixture (SCWM)
Experiment
ISS Flight Experiment using the
High Temperature Insert – Re-flight (HTI-R)
in the DECLIC Facility
June 21, 2012
https://ntrs.nasa.gov/search.jsp?R=20120016851 2018-05-27T07:52:46+00:00Z


Supercritical Water Mixture (SCWM)Experiment
The sample-cell unit (SCU)
to be filled with a salt/water
mixture
The HTI to be returned
from ISS and which houses
the SCU
The Supercritical Water Mixture
(SCWM) experiment is a follow-on
experiment to the pure Supercritical
Water HTI experiment conducted on
the ISS in 2010
SCWM will use a modified Sample
Cell Unit (SCU) filled with a salt-
water solution inserted into the
refurbished High Temperature
Insert (HTI-R) and returned to ISS,
~ March 2013.

Supercritical Water Mixture (SCWM)Experiment
SCWM experiment time-line:
HTI returned to ground ULF-6 Mar 2011
HTI-R refurbishment completed Sep 2012
HTI-R transfer to KSC Dec 2012
HTI-R return to ISS Mar 2013
SCWM ISS testing commences Jul 2013

Supercritical Water Mixture (SCWM)Experiment
Outline:
Background
Motivation
SCWM Experiment
Objectives
Salt Selection Criteria
Proposed Test Sequences
Previous ISS Results
Modeling
Ground Based Testing
Acknowledgments

Supercritical Water Mixture (SCWM)Experiment
Background

Supercritical Water Mixture (SCWM)Experiment
P – T Diagram (pure water)
In a supercritical fluid
molecular cohesion is
liquid- like and
molecular diffusion is
gas-like.
Supercritical water
behaves as a dense,
non-polar gas
Tcr = 374.1 C
Pcr = 221 atm

Supercritical Water Mixture (SCWM)Experiment
Gases and organic
substances are
completely soluble in
supercritical water
Inorganic salts are
insoluble in supercritical
water and precipitate out
of solution
Oxidizer and
hydrocarbon (organic)
fuels are brought into
intimate single phase
contact during reactions
Tc
50
100
Temperature °C
Rel
ati
ve
solu
bil
ity
(%)
100 200 300 400 500
Organics Inorganic
salts

Supercritical Water Mixture (SCWM)Experiment
Between 350 °C and 400 °C (at a pressure of 250 bar)
• density decreases by 70%
• thermal conductivity decreases by 65%
• viscosity decreases by 80%
• mass diffusivity increases by a factor of 4
0.0
0.2
0.4
0.6
0.8
1.0
1.2
1.4
0 100 200 300 400 500 600 700 800
Temperature ( oC )
Density
Thermal Conductivity
Viscosity
Self Diffusivity
P = 250 bar

Supercritical Water Mixture (SCWM)Experiment
Motivation
Supercritical Water Mixture (SCWM)Experiment
NASA's Advanced Exploration
Overarching Goal: Develop technologies
that promote self sufficiency to enable human
exploration beyond low-earth orbit
Space Studies Board (2000)
Solid waste management: “Both systems
(incineration and supercritical water oxidation)
show promise for future spacecraft design,”
• water reclamation from liquid waste streams
• CO2 recovery for O2 generation and photosynthesis
requirements
• N2 recovery from bio-waste streams (plant nutrition
recovery for recycling to growth chambers)
• transform to beneficial products such as activated
carbon, food production substrate, and fuel (from
partial oxidation processes)

Supercritical Water Mixture (SCWM)Experiment
2011 NRC Decadal Survey - Super Critical Water Oxidation
(SCWO) is strategically aligned with many "high priority research
recommendations"
Hig
h p
riori
ty r
esea
rch
rec
om
men
dati
on
s
( w
/ S
CW
O r
elev
ancy
)
Prioritization criteria
(against which high priority research recommendations were assessed)

Supercritical Water Mixture (SCWM)Experiment
SCWO Unit for Bluegrass
Army Depot Richmond, KY
SCWO reactor for municipal
sludge: City of Orlando, FL (35
metric tons/day)
Terrestrial Applications of SCWO

Supercritical Water Mixture (SCWM)Experiment
A key technological hurdle is the control of
corrosion and fouling caused by deposition
of salt precipitates
This detrimentally impacts operational
efficiencies(e.g., heat transfer) and lifetime
Figure1 provides a dramatic illustration of
the rapid deposition on a heated surface
inserted into a flowing water/salt solution
and maintained at a temperature just above
that of the solubility limit in the bulk fluid
(NaSO4 at 4 wt % , TB = 356C, P = 250
atm)
Hodes, M., Marrone, P., Hong, G.T., Smith, K. A., Tester, J. W., Salt precipitation and scale control in supercritical water
oxidation—Part A: fundamentals and research; Journal of Supercritical Fluids; 29 (2004) 265–288

Supercritical Water Mixture (SCWM)Experiment
The SCWM experiment fits naturally in the scheme of
investigating supercritical water phenomena … particularly
in terms of advancing Supercritical Water Oxidation
(SCWO) technology
One -> two -> three
phase
reacting system
Super
Critical
Water
Oxidation
Super
Critical
Water-Salt
Super
Critical
Water
subcritical supercritical
Salt precipitate

Supercritical Water Mixture (SCWM)Experiment
ISS Rationale
• Sharp changes in density and resulting buoyant flow on
earth impact ability to study unit processes of salt
precipitation and transport
• Ground-based reduced-gravity facilities (drop towers,
low-g aircraft flights) do not provide sufficient low-g
time
Supercritical Water Mixture (SCWM)Experiment
SCWM Experiment
Objectives
Supercritical Water Mixture (SCWM)Experiment
Science Objectives:
The SCWM experiment is designed to study precipitation and transport phenomena of a solute as it precipitates from solution near the critical point of the salt/water mixture.
Observe/quantify the critical point of a liquid-gas phase
transition for a salt/water mixture
Observe/quantify the onset of precipitation in a supercritical homogeneous phase as a function of temperature
Observe/quantify the transport processes of the precipitate in the presence of temperature and/or salinity gradients

Supercritical Water Mixture (SCWM)Experiment
SCWM Experiment
Salt Selection Criteria

Supercritical Water Mixture (SCWM)Experiment
Substantial decrease in solubility near critical conditions
and below the DECLIC temperature limit (~ 405°C);
Compatible with HTI-R SCU material (Inconel 718)
Available solubility data in water near critical conditions

Supercritical Water Mixture (SCWM)Experiment
SCWM Experiment
Proposed Test Sequences

Supercritical Water Mixture (SCWM)Experiment
Time
Tem
per
atu
re Tc
Tc – (DT)1
Tc + (DT)2
Test Sequence 1
Salt Precipitation During Temperature Increase

Supercritical Water Mixture (SCWM)Experiment
Time
Tem
per
atu
re Tc
Tc – (DT)3
Tc + (DT)2
Test Sequence 2
Salt Solvation During Temperature Decrease

Supercritical Water Mixture (SCWM)Experiment
Tem
per
atu
re Tc
Tc – (DT)4
Tc + (DT)2
Test Sequence 3
Salt Agglomeration
Time

Supercritical Water Mixture (SCWM)Experiment
Time
Tem
per
atu
re
Tc
Test Sequence 4
Salt Transport in Near (Sub)-Critical and Supercritical Water
T1 (control point A)
T2 (control point B)
T4 (temperature control point 2)
T3 (temperature control point 1)

Supercritical Water Mixture (SCWM)Experiment
Previous ISS Results
Supercritical Pure Water Studies

Phase Distribution Below the Critical Point
1-g ISS
T= 624 K
Dark region between liquid and vapor
regions is the meniscus
L
V L
V
Supercritical Water Mixture (SCWM)Experiment
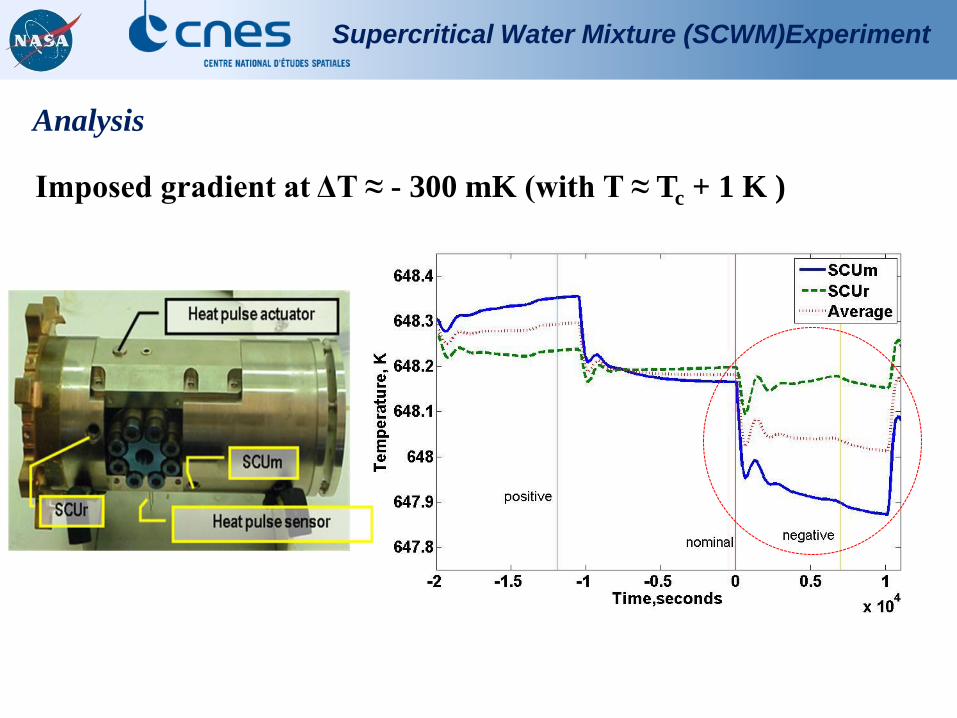
Analysis
Imposed gradient at ΔT ≈ - 300 mK (with T ≈ Tc + 1 K )
Supercritical Water Mixture (SCWM)Experiment
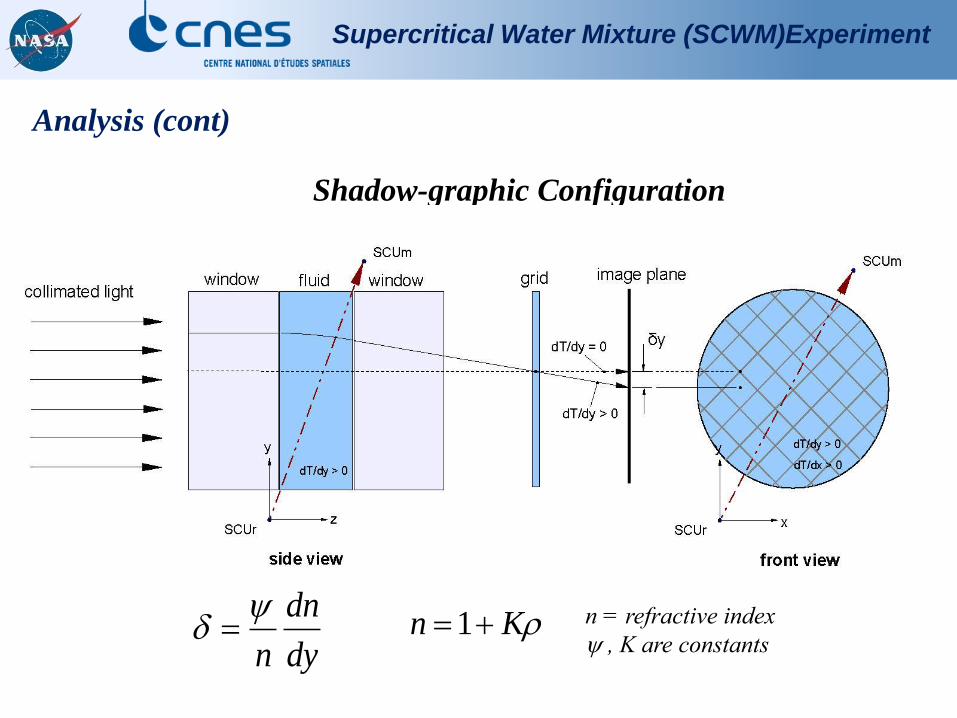
Shadow-graphic Configuration
Analysis (cont)
dy
dn
n
Kn 1 n = refractive index
, K are constants

Supercritical Water Mixture (SCWM)Experiment
Optical Grid Reference Image
T = 648.2 K (~ 1 K above critical point)
Note that there is no vapor/liquid phase difference
Points N, C, W, E, and S are chosen as reference points
for tracking the grid displacement under imposed
temperature gradients.
Supercritical Water Mixture (SCWM)Experiment
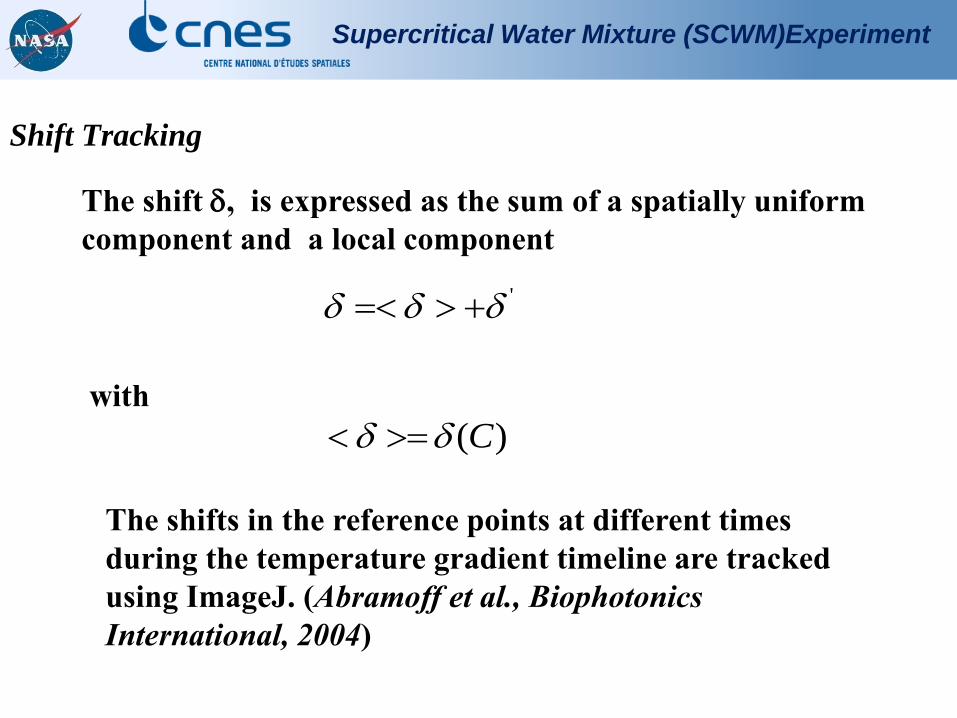
Shift Tracking
The shift , is expressed as the sum of a spatially uniform
component and a local component
'
with
)(C
The shifts in the reference points at different times
during the temperature gradient timeline are tracked
using ImageJ. (Abramoff et al., Biophotonics
International, 2004)

Supercritical Water Mixture (SCWM)Experiment
Shift of Reference Points with Time Negative Temperature Gradient
(a) Point N
(b) Point S
(c) Point C
The shift in the y-direction is
much greater than the shift in the
x-direction.
Shift near the center is delayed
compared to near-boundary
points.
This is a consequence of reduced
thermal diffusivity near the
critical point.

Supercritical Water Mixture (SCWM)Experiment
Grid Shift for Negative Temperature Gradient
Shifts in the grid first appear near the boundary as already noted.
The grid shifts in the direction of lower temperature, i.e., larger density.

Supercritical Water Mixture (SCWM)Experiment
Grid Shift Upon Removal of Uniform Shift
The shift in the center region is uniform for both
positive and negative temperature gradients.
Hence the experiment provides a uniform density
gradient in the bulk fluid (interior region).

Supercritical Water Mixture (SCWM)Experiment
Modeling

Supercritical Water Mixture (SCWM)Experiment
Numerical Results
Configuration: 1 cm dia fluid cell in an inconel block
Initial Condition: T =648 K
Temperature Gradient: Decrease temperature of top surface
by 0.1 K in 400 seconds
(a) 500 seconds (b) 1000 seconds (c) 2500 seconds
Cell block temperature equilibrates quickly

Supercritical Water Mixture (SCWM)Experiment
Numerical Results (contd.) : Temperature Field in the Fluid
(a) 400 seconds (b) 1000 seconds (c) 2500 seconds (d) 5000 seconds
Diffusive
boundary
layer + piston
effect in bulk
fluid
Diffusive
boundary
layer
extending into
bulk; piston
effect
diminished
Diffusive
equilibration
underway in
entire cell
Diffusive
equilibration
complete
The temperature gradient in the bulk fluid is negligible at the early stages. When
diffusive equilibration is complete there is a uniform temperature (and density)
gradient in the central region (nearly linear temperature profile).
At equilibration, temperature gradient in the y-direction is greater than the gradient
in the x-direction.
Supercritical Water Mixture (SCWM)Experiment
Ground Based Testing

Supercritical Water Mixture (SCWM)Experiment
SCWM Lab Test Cell 1

Supercritical Water Mixture (SCWM)Experiment
Liquid water-vapor regions near the critical temperature
Liquid water-vapor regions during heat-up for a 10% Na2SO4 -water solution
605 K 615 K 625 K

Supercritical Water Mixture (SCWM)Experiment
Pure water 10%-w sodium sulfate
Summary - Preliminary Observations
The precipitated salt particulates/agglomerates are on the order of a 10-
20 microns.
Stratification/banding, suggesting a salinity concentration “inversion”,
occurs during quenching
Stratification during cool-down

ACKNOWLEDGMENTS
NASA HQ (Exploration Science Mission Directorate)-
F. Chiaramonte, Program Executive
NASA GRC (Space Flight Systems Directorate)-
F. Kohl, ISS Research Project Manager
National Center for Space Exploration Research-
D. Gotti, J. Owens, W. Yanis


