
Purdue University Purdue University
Purdue e-Pubs Purdue e-Pubs
International High Performance Buildings Conference School of Mechanical Engineering
2021
Superheat Prediction & Fault Diagnostics of HVAC from Simple Superheat Prediction & Fault Diagnostics of HVAC from Simple
Temperature Measurements Using Big Data Approach Temperature Measurements Using Big Data Approach
Mehari Tesfay University of Nebraska - Lincoln, [email protected]
Fadi Alsaleem University of Nebraska - Lincoln
Kevin Sinkar DunAn Microstaq,Inc
Parthiban Arunasalam DunAn Microstaq,Inc
Follow this and additional works at: https://docs.lib.purdue.edu/ihpbc
Tesfay, Mehari; Alsaleem, Fadi; Sinkar, Kevin; and Arunasalam, Parthiban, "Superheat Prediction & Fault Diagnostics of HVAC from Simple Temperature Measurements Using Big Data Approach" (2021). International High Performance Buildings Conference. Paper 375. https://docs.lib.purdue.edu/ihpbc/375
This document has been made available through Purdue e-Pubs, a service of the Purdue University Libraries. Please contact [email protected] for additional information. Complete proceedings may be acquired in print and on CD-ROM directly from the Ray W. Herrick Laboratories at https://engineering.purdue.edu/Herrick/Events/orderlit.html
3683, Page 1
Superheat Prediction & Fault Diagnostics of HVAC from Simple
Temperature Measurements Using Big Data Approach
Mehari K. Tesfay1*, Mostafa Rafaie1, , Kevin Sinkar2, Parthiban Arunasalam2, Dhaman Besarla2,
Fadi Alsaleem1
1Durham school of architectural and construction Engineering, University of Nebraska-Lincoln
2DunAn Microstaq, Inc., Austin, TX, 78723, United States
*Corresponding Author
ABSTRACT
New advancements in data & algorithms have pushed new techniques and methods to the forefront in
optimizing energy efficiency as well as keeping the thermal comfort of residents in intelligent buildings
research. HVAC elements, being ubiquitous and fundamental elements in buildings today, their
diagnostics maintenance, operational functionalities, and control are essential aspects in this regard.
The tremendous amount of data generated from buildings every day and recent developments with data
science tools have changed the control and monitoring of these units from exhausting physical
modeling and operation to data-driven techniques that are more reliable and efficient. The massive
streaming data generated by smart building sensors have inspired new ways of controlling and
diagnosing faults in comfort systems using machine learning and big data analytics. In this work, we
present a big-data driven approach to model the dynamic of two similar HVAC (but, healthy and faulty)
systems from simple temperature measurements collected over an extended period. The model showed
good accuracy in predicting the system superheat for both systems. This demonstrates the potential of
big data approach to substitute the need for having the expensive pressure sensor to measure superheat.
1. INTRODUCTION
It has been reported that HVACs currently consume more than 40% of total electricity use in the
U.S [1]–[6]. Due to their significant impact on system efficiency, energy consumption and
occupant comfort, faults in building HVAC systems need to be detected appropriately and hence
diagnostic measures are taken to restore it to ideal working states. Being responsible for
consuming
6th International High Performance Buildings Conference at Purdue, May 24-28, 2021

3683, Page 2
a significant portion of global energy, HVACs require a reliable Fault Detection and Diagnosis
(FDD) method to ensure an efficient equipment operation in order to achieve optimal energy usage
and deliver a good performance. The figure below shows the classification of FDD methods[7]
Figure 1: Different classifications of Automated Fault Detection and Diagnostics methods
FDD methods for buildings
~ ~ Data-driven
A model of the system is built from historical data and used to predict / validate data from the system itself. Common techniques:
- Machine learning
- Artificial neural networks
- Support vector machines
Model-based
A model of the system is built from first principles and used to predict / validate data from the system itself. Common techniques:
- Parity equations
- Observers
- Kalman filters
Rule-based
A set of mles are defined from expert knowledge and used to determine whether the system is working as expected . Common techniques:
- Expert systems
- Pattern classifications
- Limits and alarms
This study categorizes AFDD methods in HVAC areas into three main categories— namely
process history-based, qualitative model-based, and quantitative model-based methods.
Rule-based & qualitative physics-based modeling techniques use a priori knowledge to set up
thresholds and rules to identify fault symptoms and make a final decision about the state of a
system. On the other hand, quantitative model-based methods rely on established & explicit
mathematical models to represent each component of the plant and simulate the steady and
transient behaviors of the system to reach an analytical outcome to detect and diagnose the cause
of faults[8]. This analytical result is followed by experimental data for validation. Process history-
based methods, such as black-box models, rely on the relationship between inputs and outputs of
a process without any consideration for physical significance. Those models include Bayesian
networks [7]–[12] and artificial neural networks (ANNs) [13]–[19]
Another work in [20] relies on experimental data-driven approaches and algorithms for modeling,
optimizing, and controlling HVAC systems. In this work, supply air duct static pressure and
supply air temperature are used as control variables to improve energy efficiency and maintain
thermal comfort. Data-driven approaches are used in [21] to estimate HVAC specific energy
6th International High Performance Buildings Conference at Purdue, May 24-28, 2021
3683, Page 3
6th International High Performance Buildings Conference at Purdue, May 24-28, 2021
consumption in buildings using an improved Fourier series decomposition. Having no prior
knowledge about abnormal phenomena that occurred in the system, researchers in [22] designed a
semi-supervised data-driven approach, namely Principal Component Analysis (PCA). The PCA
was employed for fault detection and isolation by distinguishing anomalies from normal operation
variability as well as isolating variables related to faults.
2. METHODOLOGY
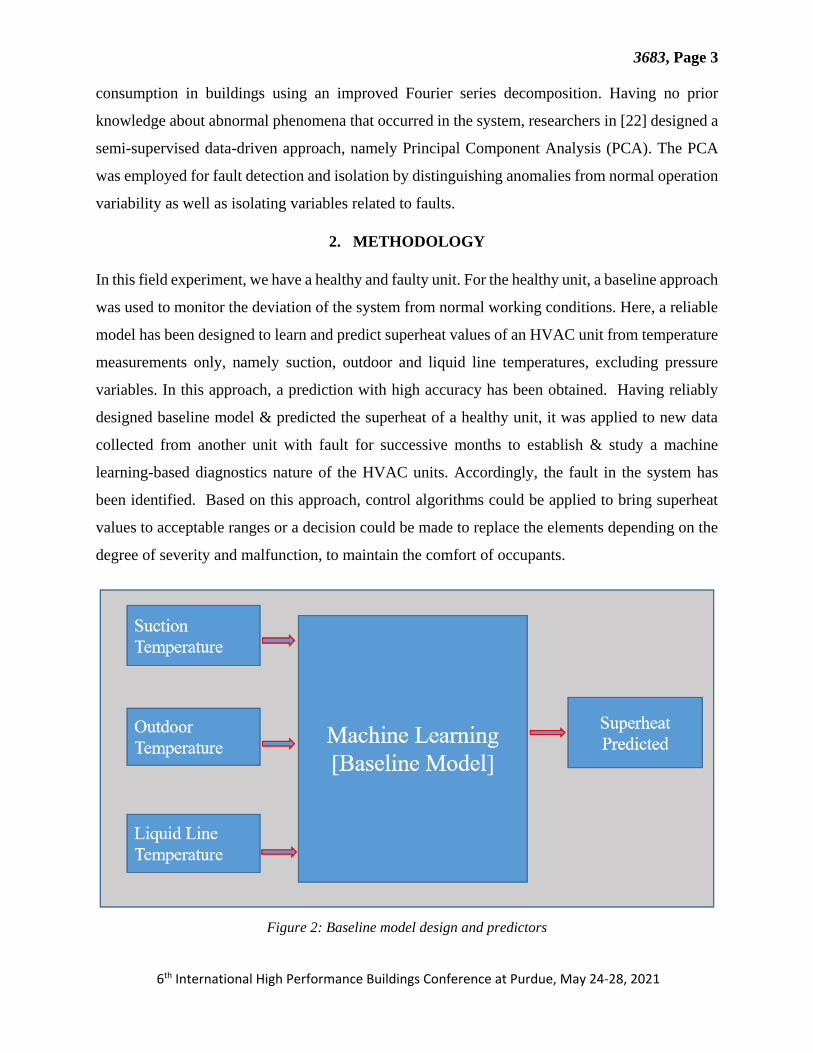
In this field experiment, we have a healthy and faulty unit. For the healthy unit, a baseline approach
was used to monitor the deviation of the system from normal working conditions. Here, a reliable
model has been designed to learn and predict superheat values of an HVAC unit from temperature
measurements only, namely suction, outdoor and liquid line temperatures, excluding pressure
variables. In this approach, a prediction with high accuracy has been obtained. Having reliably
designed baseline model & predicted the superheat of a healthy unit, it was applied to new data
collected from another unit with fault for successive months to establish & study a machine
learning-based diagnostics nature of the HVAC units. Accordingly, the fault in the system has
been identified. Based on this approach, control algorithms could be applied to bring superheat
values to acceptable ranges or a decision could be made to replace the elements depending on the
degree of severity and malfunction, to maintain the comfort of occupants.
Figure 2: Baseline model design and predictors
Suction Temperature
Outdoor Temperature
Liquid Line Temperature
Superheat Predicted
3683, Page 4
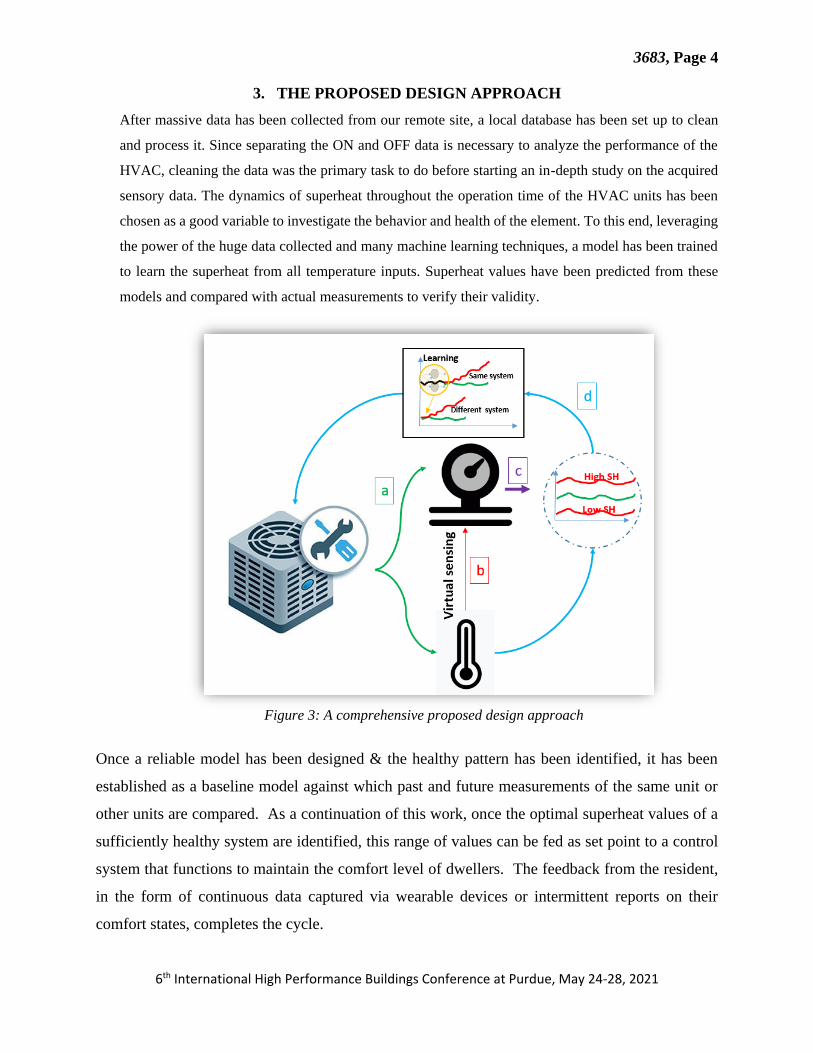
3. THE PROPOSED DESIGN APPROACH
After massive data has been collected from our remote site, a local database has been set up to clean
and process it. Since separating the ON and OFF data is necessary to analyze the performance of the
HVAC, cleaning the data was the primary task to do before starting an in-depth study on the acquired
sensory data. The dynamics of superheat throughout the operation time of the HVAC units has been
chosen as a good variable to investigate the behavior and health of the element. To this end, leveraging
the power of the huge data collected and many machine learning techniques, a model has been trained
to learn the superheat from all temperature inputs. Superheat values have been predicted from these
models and compared with actual measurements to verify their validity.
6th International High Performance Buildings Conference at Purdue, May 24-28, 2021
Figure 3: A comprehensive proposed design approach
g
Samesyste
ifferent syst
., / · , ·r ! ~ '. I I
-, ~ ; . . ' I ,
Once a reliable model has been designed & the healthy pattern has been identified, it has been
established as a baseline model against which past and future measurements of the same unit or
other units are compared. As a continuation of this work, once the optimal superheat values of a
sufficiently healthy system are identified, this range of values can be fed as set point to a control
system that functions to maintain the comfort level of dwellers. The feedback from the resident,
in the form of continuous data captured via wearable devices or intermittent reports on their
comfort states, completes the cycle.

3683, Page 5
The existing approach in HVAC performance characteristics is mainly virtual sensing where
pressures values at the inlet and outlets of compressors are estimated from temperatures. In another
case, expensive equipment and sensors are deployed in the field to acquire real-time data to analyze
HVAC behavior and performance. This is economically demanding and complicates the work of
personnel. Though it is neither easy to calculate nor cheap to measure, superheat of a system, and
sometimes Subcooling, is known as a very important indicator whether a system is healthy or
faulty.
In this work, leveraging the availably of big data and many machine learning methods, we have
come up with a novel way of estimating the superheat from simple temperature measurements.
Utilizing this superheat and other predictor variables, a comprehensive baseline model has been
designed for one of our healthy units, against which future and previous measurements on the state
of the system are compared & hence detect whether faulty or not. Moreover, this same model can
be used to identify & diagnose faults in other units where their data is unreliable to build models,
cross-unit detection.
4. MACHINE LEARNING ALGORITHMS USED
Decision tree
The decision tree algorithm, specifically rpart function, is a non-parametric supervised learning
method and is one of the simplest and yet most successful forms of machine learning for
classification and regression. It has a tree-like graph representation that can be trained as a
classifier to decide from multiple possible choices. The depth of the tree is one of the main
parameters that can be tuned to enhance learning performance.
Gradient Boosting Regressor
The Gradient Boosting Regressor, XGBoost, is another ensemble learning technique used for
classification and regression. This algorithm is known as a robust method to avoid overfitting[23].
Random Forest Regressor
Random Forest is based on utilizing the aggregation of decision trees built from various sub-
samples of the datasets and their averages to improve the predictive accuracy Similar to the
previous classifiers, it was employed while varying the estimator count to achieve better
accuracy
6th International High Performance Buildings Conference at Purdue, May 24-28, 2021

3683, Page 6
5. RESULTS AND DISCUSSION
On a complete departure from previous trends, in this approach we devised a mechanism to
depend on a system that we know is healthy from other previous studies and build a model based
on which current and future data gathered from that system are measured against to detect fault.
Figure 4: Predicting superheat of the healthy unit using the baseline model[ ℃ ]
In this model, the accepted ranges of variables of a properly functioning HVAC are learnt and in
a later use the model takes field measured values of important predictors and predicts the superheat
values. These values are then compared to the actual measured values of superheat to determine
the drift in performance of the system and hence its health. In this study, the model exhibited
excellent prediction accuracy and the mean error values are very small. Fig4 below shows, the
actual prediction residual levels.
6th International High Performance Buildings Conference at Purdue, May 24-28, 2021
15 -
10 -
5 -
o-0 5000 10000 15000 20000
15 - variable <I) :::,
SH ro >
predSH
10 -
o-5000 5100 5200 5300 5400 5500
id
3683, Page 7
6th International High Performance Buildings Conference at Purdue, May 24-28, 2021
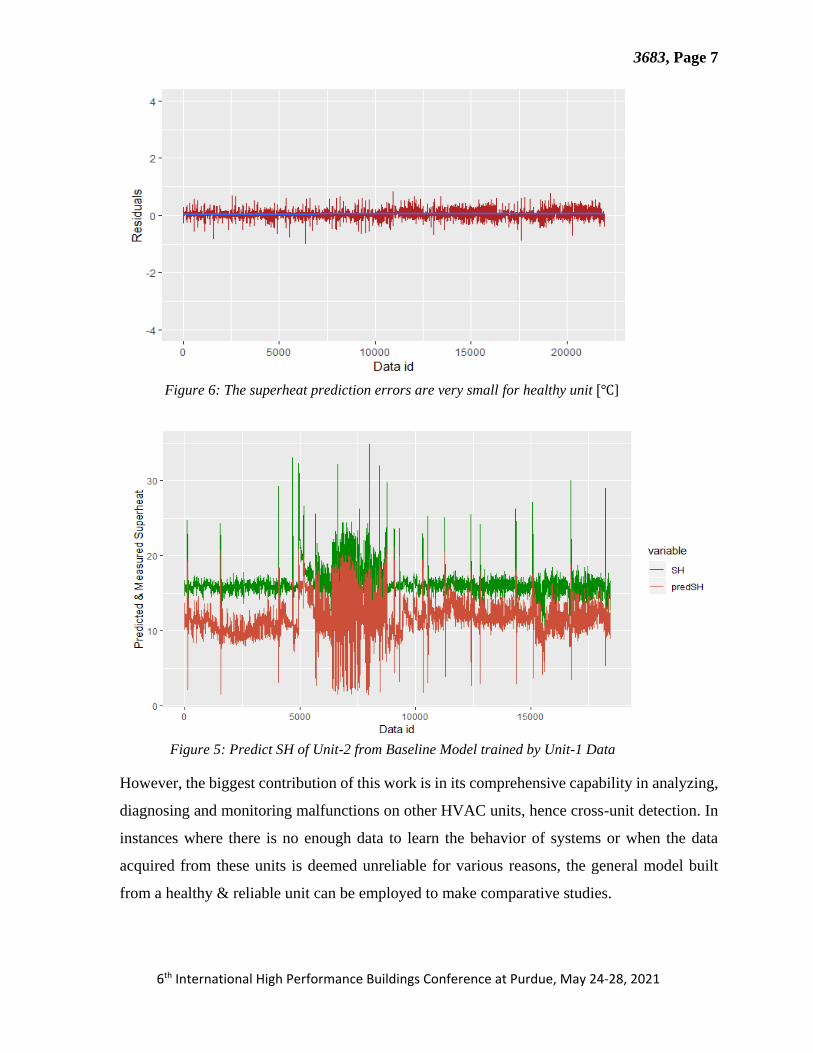
Figure 6: The superheat prediction errors are very small for healthy unit [℃]
However, the biggest contribution of this work is in its comprehensive capability in analyzing,
diagnosing and monitoring malfunctions on other HVAC units, hence cross-unit detection. In
instances where there is no enough data to learn the behavior of systems or when the data
acquired from these units is deemed unreliable for various reasons, the general model built
from a healthy & reliable unit can be employed to make comparative studies.
Figure 5: Predict SH of Unit-2 from Baseline Model trained by Unit-1 Data
ro <I)
.s::: Q) a. :::, (/)
-0
-2 -
30 -
; 20 -
"' "' <I)
;;;; olJ -0 <I)
0 ~ 10 -0::
' 0
o- ' 0
' 5000
5000
' ' ' 10000 15000 20000 Data id
variable
- SH
- predSH
' ' 10000 15000
Data id

3683, Page 8
Figure 7: Actual Computed mean Residuals[℃]
This is exactly what we have implemented in this work. Figures 6 and 7 demonstrates the
superheat values predicted for a faulty system using the baseline model. The predicted values
are 5-10 degrees lower than those predicted, indicating that the HVAC unit had operational
malfunction.
The two figures above show the comparative performance of the models for both the healthy and
faulty systems. The mean superheat prediction error for the unit based on which the model was
designed is approximately in the range of [1 to 1.6]. On the other hand, the error for the defective
unit upon which the base-model was applied is within the ranges of [3.5 to 4.5]
6th International High Performance Buildings Conference at Purdue, May 24-28, 2021
Figure 8: Mean prediction errors of unhealthy and healthy units
Unit-2
performance
Unit-1
performance
15 -
10 -
"' ro :::,
"O ·u; 5 -Q)
a:::
o-
0 5000
~
=
10000 Data id
0,20
0,00
15000
lu~/
Ml)\I IHS
D
3683, Page 9
6th International High Performance Buildings Conference at Purdue, May 24-28, 2021
6. CONCLUSION
In this work, by using a simple temperature sensor, we were able to build reliable machine learning
models that successfully detect and diagnose faults in HVAC systems. Moreover, the accuracy of
predictions of these models was investigated for both the defective and healthy units. These results
confirmed the preliminary assessment that was conducted based on few superheat and subcooling
values. Among the machine learning algorithms applied, Gradient Boosting Regressor showed
better performance.
REFERENCES
[1] T. Wei, Y. Wang, and Q. Zhu, “Deep Reinforcement Learning for Building HVAC Control,” in Proceedings -
Design Automation Conference, 2017, vol. Part 12828, pp. 1–6, doi: 10.1145/3061639.3062224.
[2] H. Hao, A. Kowli, Y. Lin, P. Barooah, and S. Meyn, “Ancillary service for the grid via control of commercial
building HVAC systems,” in 2013 American control conference, 2013, pp. 467–472.
[3] T. Wei, Q. Zhu, and M. Maasoumy, “Co-scheduling of HVAC control, EV charging and battery usage for
building energy efficiency,” in 2014 IEEE/ACM International Conference on Computer-Aided Design (ICCAD),
2014, pp. 191–196.
[4] B. Balaji, J. Xu, A. Nwokafor, R. Gupta, and Y. Agarwal, “Sentinel: Occupancy based HVAC actuation using
existing wifi infrastructure within commercial buildings,” in SenSys 2013 - Proceedings of the 11th ACM
Conference on Embedded Networked Sensor Systems, 2013, pp. 1–14, doi: 10.1145/2517351.2517370.
[5] M. Avci, M. Erkoc, and S. S. Asfour, “Residential HVAC load control strategy in real-time electricity pricing
environment,” in 2012 IEEE Energytech, Energytech 2012, 2012, pp. 1–6, doi:
10.1109/EnergyTech.2012.6304636.
[6] L. Pérez-Lombard, J. Ortiz, and C. Pout, “A review on buildings energy consumption information,” Energy
Build., vol. 40, no. 3, pp. 394–398, 2008, doi: 10.1016/j.enbuild.2007.03.007.
[7] C. G. Mattera, J. Quevedo, T. Escobet, H. R. Shaker, and M. Jradi, “A method for fault detection and diagnostics
in ventilation units using virtual sensors,” Sensors (Switzerland), vol. 18, no. 11, 2018, doi: 10.3390/s18113931.
[8] W. Kim and S. Katipamula, “A review of fault detection and diagnostics methods for building systems,” Sci.
Technol. Built Environ., vol. 24, no. 1, pp. 3–21, Jan. 2018, doi: 10.1080/23744731.2017.1318008.
[9] A. L. Dexter and D. Ngo, “Fault diagnosis in air-conditioning systems: A multi-step fuzzy model-based
approach,” HVAC R Res., vol. 7, no. 1, pp. 83–102, 2001, doi: 10.1080/10789669.2001.10391431.
[10] C. G. Mattera, J. Quevedo, T. Escobet, H. R. Shaker, and M. Jradi, “A Method for Fault Detection and
Diagnostics in Ventilation Units Using Virtual Sensors †,” 2018, doi: 10.3390/s18113931.
[11] F. Xiao, Y. Zhao, J. Wen, and S. Wang, “Bayesian network based FDD strategy for variable air volume
3683, Page 10
6th International High Performance Buildings Conference at Purdue, May 24-28, 2021
terminals,” Autom. Constr., vol. 41, pp. 106–118, 2014, doi: 10.1016/j.autcon.2013.10.019.
[12] Z. Wang, L. Wang, Y. Tan, and J. Yuan, “Fault detection based on Bayesian network and missing data imputation
for building energy systems,” Appl. Therm. Eng., vol. 182, Jan. 2021, doi: 10.1016/j.applthermaleng.2020.116051.
[13] S. Wang and Y. Chen, “Fault-tolerant control for outdoor ventilation air flow rate in buildings based on neural
network,” Build. Environ., vol. 37, no. 7, pp. 691–704, Jul. 2002, doi: 10.1016/S0360-1323(01)00076-2.
[14] Z. Du, B. Fan, X. Jin, and J. Chi, “Fault detection and diagnosis for buildings and HVAC systems using combined
neural networks and subtractive clustering analysis,” Build. Environ., vol. 73, pp. 1–11, Mar. 2014, doi:
10.1016/j.buildenv.2013.11.021.
[15] Z. Du, B. Fan, J. Chi, and X. Jin, “Sensor fault detection and its efficiency analysis in air handling unit using the
combined neural networks,” Energy Build., vol. 72, pp. 157–166, Apr. 2014, doi: 10.1016/j.enbuild.2013.12.038.
[16] Y. Zhu, X. Jin, and Z. Du, “Fault diagnosis for sensors in air handling unit based on neural network pre-processed
by wavelet and fractal,” Energy Build., vol. 44, no. 1, pp. 7–16, Jan. 2012, doi: 10.1016/j.enbuild.2011.09.043.
[17] B. Fan, Z. Du, X. Jin, X. Yang, and Y. Guo, “A hybrid FDD strategy for local system of AHU based on artificial
neural network and wavelet analysis,” Build. Environ., vol. 45, no. 12, pp. 2698–2708, Dec. 2010, doi:
10.1016/j.buildenv.2010.05.031.
[18] Z. Wang, R. S. Srinivasan, and J. Shi, “Artificial intelligent models for improved prediction of residential space
heating,” J. Energy Eng., vol. 142, no. 4, Dec. 2016, doi: 10.1061/(ASCE)EY.1943-7897.0000342.
[19] Z. Du, X. Jin, and Y. Yang, “Fault diagnosis for temperature, flow rate and pressure sensors in VAV systems
using wavelet neural network,” Appl. Energy, vol. 86, no. 9, pp. 1624–1631, 2009, doi:
10.1016/j.apenergy.2009.01.015.
[20] G. Xu, “HVAC system study: a data-driven approach.” University of Iowa, pp. xii, 87 pages.
[21] F. Niu, Z. O’Neill, and C. O’Neill, “Data-driven based estimation of HVAC energy consumption using an
improved Fourier series decomposition in buildings,” in Building Simulation, 2018, vol. 11, no. 4, pp. 633–645,
doi: 10.1007/s12273-018-0431-2.
[22] A. Beghi, R. Brignoli, L. Cecchinato, G. Menegazzo, M. Rampazzo, and F. Simmini, “Data-driven Fault
Detection and Diagnosis for HVAC water chillers,” Control Eng. Pract., vol. 53, pp. 79–91, 2016, doi:
10.1016/j.conengprac.2016.04.018.
[23] A. Almaghrebi, F. Aljuheshi, M. Rafaie, K. James, and M. Alahmad, “Data-Driven Charging Demand Prediction
at Public Charging Stations Using Supervised Machine Learning Regression Methods,” Energies, vol. 13, no. 16,
p. 4231, 2020, doi: 10.3390/en13164231.


