Molecular Cell, Volume 53
Supplemental Information
Phosphorylation of p53 by TAF1
Inactivates p53-Dependent Transcription
in the DNA Damage Response Yong Wu, Joy C. Lin, Landon G. Piluso, Joseph M. Dhahbi, Selene Bobadilla, Stephen R. Spindler, and Xuan Liu
p53 T55-Phos p53
-‐ -‐
Free DNA
p53-DNA
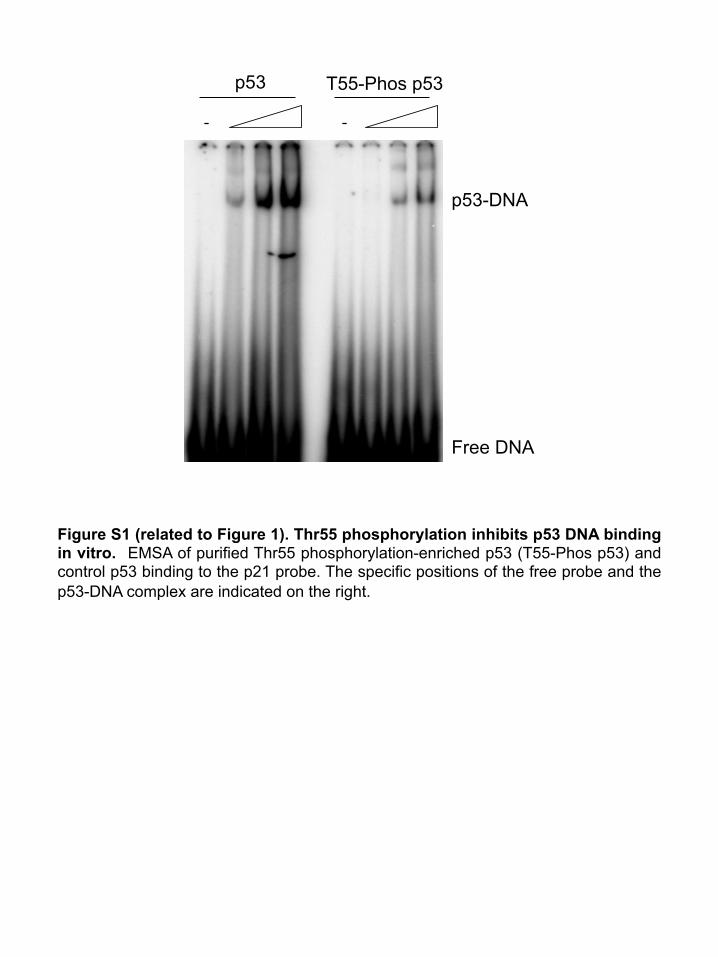
Figure S1 (related to Figure 1). Thr55 phosphorylation inhibits p53 DNA binding in vitro. EMSA of purified Thr55 phosphorylation-enriched p53 (T55-Phos p53) and control p53 binding to the p21 probe. The specific positions of the free probe and the p53-DNA complex are indicated on the right.

Figure S2 (related to Figure 2). (A) U2OS cells were pre-treated with the PARP-1 inhibitor NU1025 prior to UV treatment and cellular ATP levels and PARP-1 activity were determined. Bars represent average of triplicate experiments ± S.E. (B, C) U2OS cells were treated with bleomycin. PARP-1 activity, AMPK activation (indicated by AMPK-P) and p53 Thr55 and Ser15 phosphorylation were determined. Bars represent average of triplicate experiments ± S.E. (D) U2OS cells were infected with a recombinant adenovirus expressing a dominant negative mutant of AMPK (Ad-DN-AMPK). AMPK activation and phosphorylation of p53 at Thr55 was analyzed by western blot. Bars represent average of triplicate experiments ± S.E.
B
A
D
C
ATP
(fold
ove
r con
t.)
0
0.5
1
1.5
2
2.5
UV: M 2 8 12 16 M 2 8 12 16 h
AMPK-P
AMPK
Thr55-P
p53
0
1
2
3
4
5
6
PAR
P A
ct (f
old
over
con
t.) DMSO
4-AN
Bleomycin: M 0.5 1 1.5 2 3 4 5 6 8 12 16 h
UV: M 0.5 1 1.5 2 2.5 3 4 6 8 12 16 h 0
0.5
1
1.5
2
2.5 AT
P le
vels
(fol
d ov
er c
ont.)
0
1
2
3
4
5
6
7
PAR
P A
ct (f
old
over
con
trol) DMSO NU1025 DMSO NU1025
UV: M 0.5 1 1.5 2 2.5 3 4 6 8 12 16 h
PARP-1
Bleomycin: M 1 3 5 8 12 M 1 3 5 8 12 h
DMSO 4-AN
AMPK-P
AMPK
Vinculin S15-P
Bleomycin: M 3 5 8 12 M 3 5 8 12 h
DMSO Compound C
Thr55-P
AMPK-P
AMPK
p53
Ad-null Ad-DN-AMPK

Figure S3 (related to Figure 3). (A) U2OS cells were treated with 2 mM AICAR for 30 min. ATP levels as well as activation of AMPK (as indicated by AMPK-P), phosphorylation of ACC (acetyl-CoA carboxylase), p53 phosphorylation at Thr55 were tested. (B) U2OS cells were treated with high glucose at various concentrations (10-25 mM) for 6 hr. ATP levels as well as p53 phosphorylation were determined. (C) ATP levels were determined before (open bar) and after (close bar) incubation of affinity-purified TAF1 and p53 in the presence of apigenin. (D) In vitro TAF1 kinase assay was conducted using purified p53 proteins and immunoprecipitated TAF1 from U2OS cells, infected with a recombinant adenovirus expressing a dominant negative mutant of AMPK (Ad-DN-AMPK), before (M) or after UV. p53 and TAF1 phosphorylation was determined by autoradiography. p53 Thr55 phosphorylation was also determined by IB. (E) In vitro ATM assay was conducted using purified p53 proteins and immunoprecipitated wild-type ATM (WT), kinase-dead ATM (KD), at various ATP concentrations. Activation of ATM (as indicated by S1981-P) and ATM-mediated p53 Ser15 phosphorylation (S15-P) were analyzed by IB.
B C
0 0.2 0.4 0.6 0.8 1
1.2 1.4 1.6 1.8 2
2.2
0.5 mM 2 mM
ATP: 0.2 0.5 1 1.5 2 2 2 mM
S1981-P
S15-P
ATM
p53
ATM: WT WT WT WT WT WT KD Wortmannin: - - - - - + -
D E
A
5 10 15 20 25 mM
Glucose
0 0.5
1 1.5
2 2.5
3
ATP
leve
ls
(fold
ove
r con
t)
T55-P
p53
S15-P
S392-P
ATP
ATP
conc
entra
tion
Thr55-P
p53
AMPK-P
AMPK
0
0.5
1
1.5
2
2.5
3 AT
P le
vels
(fo
ld o
ver c
ont.)
AICAR: - +
ACC-P
TAF1-P
p53-P
UV: M 2 8 12 M 2 8 12 12 h
TAF1 pull-down IgG
Ad-null Ad-DN-AMPK
0 0.5
1 1.5
2 2.5
ATP
leve
ls
(fold
ove
r con
t.)
TAF1
T55-P
Aut
orad
iogr
aph
p53
IB
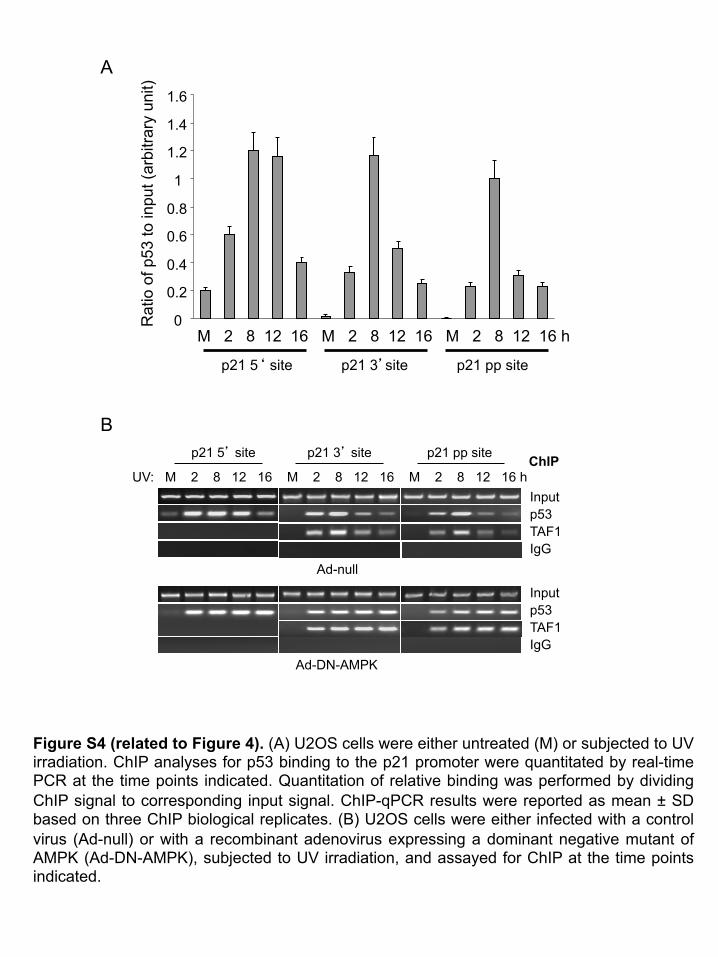
Figure S4 (related to Figure 4). (A) U2OS cells were either untreated (M) or subjected to UV irradiation. ChIP analyses for p53 binding to the p21 promoter were quantitated by real-time PCR at the time points indicated. Quantitation of relative binding was performed by dividing ChIP signal to corresponding input signal. ChIP-qPCR results were reported as mean ± SD based on three ChIP biological replicates. (B) U2OS cells were either infected with a control virus (Ad-null) or with a recombinant adenovirus expressing a dominant negative mutant of AMPK (Ad-DN-AMPK), subjected to UV irradiation, and assayed for ChIP at the time points indicated.
M 2 8 12 16 M 2 8 12 16 M 2 8 12 16 h
p21 5‘ site p21 3’site p21 pp site
0
0.2
0.4
0.6
0.8
1
1.2
1.4
1.6
Rat
io o
f p53
to in
put (
arbi
trary
uni
t)
A
B
Ad-null
Input p53 TAF1 IgG
Ad-DN-AMPK
Input p53 TAF1 IgG
UV: M 2 8 12 16 M 2 8 12 16 M 2 8 12 16 h
p21 5’ site p21 3’ site p21 pp site ChIP
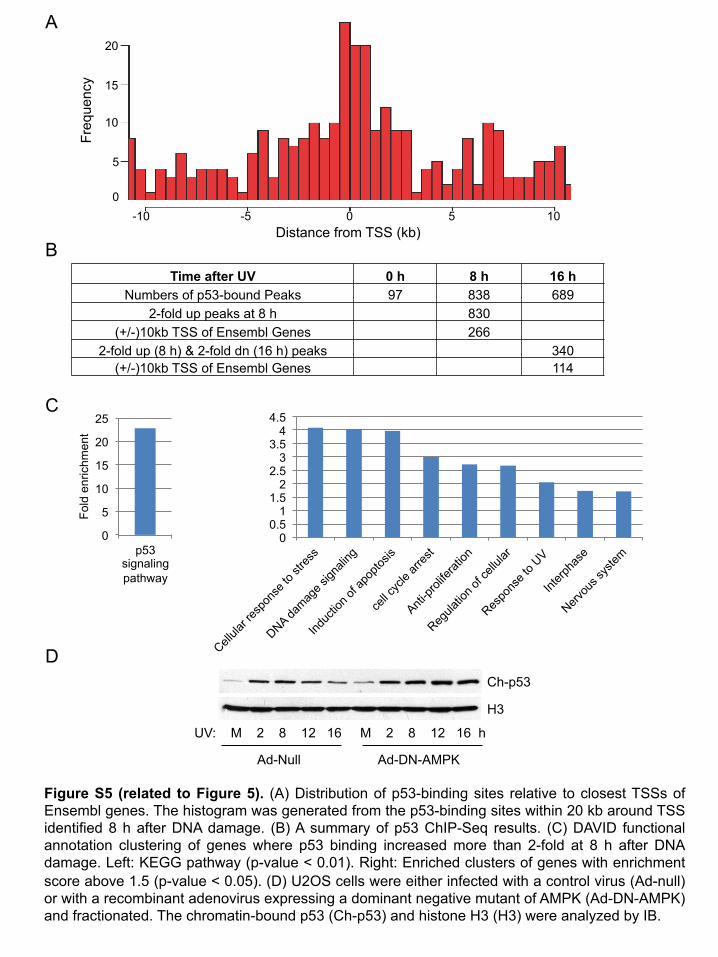
Figure S5 (related to Figure 5). (A) Distribution of p53-binding sites relative to closest TSSs of Ensembl genes. The histogram was generated from the p53-binding sites within 20 kb around TSS identified 8 h after DNA damage. (B) A summary of p53 ChIP-Seq results. (C) DAVID functional annotation clustering of genes where p53 binding increased more than 2-fold at 8 h after DNA damage. Left: KEGG pathway (p-value < 0.01). Right: Enriched clusters of genes with enrichment score above 1.5 (p-value < 0.05). (D) U2OS cells were either infected with a control virus (Ad-null) or with a recombinant adenovirus expressing a dominant negative mutant of AMPK (Ad-DN-AMPK) and fractionated. The chromatin-bound p53 (Ch-p53) and histone H3 (H3) were analyzed by IB.
Time after UV 0 h 8 h 16 h Numbers of p53-bound Peaks 97 838 689
2-fold up peaks at 8 h 830 (+/-)10kb TSS of Ensembl Genes 266
2-fold up (8 h) & 2-fold dn (16 h) peaks 340 (+/-)10kb TSS of Ensembl Genes 114
B
C
D
A
Freq
uenc
y
0
5
10
15
20
-10 10 -5 5 0 Distance from TSS (kb)
0 0.5
1 1.5
2 2.5
3 3.5
4 4.5
0
5
10
15
20
25
p53 signaling pathway
Fold
enr
ichm
ent
UV: M 2 8 12 16 M 2 8 12 16 h
Ch-p53
Ad-Null Ad-DN-AMPK
H3
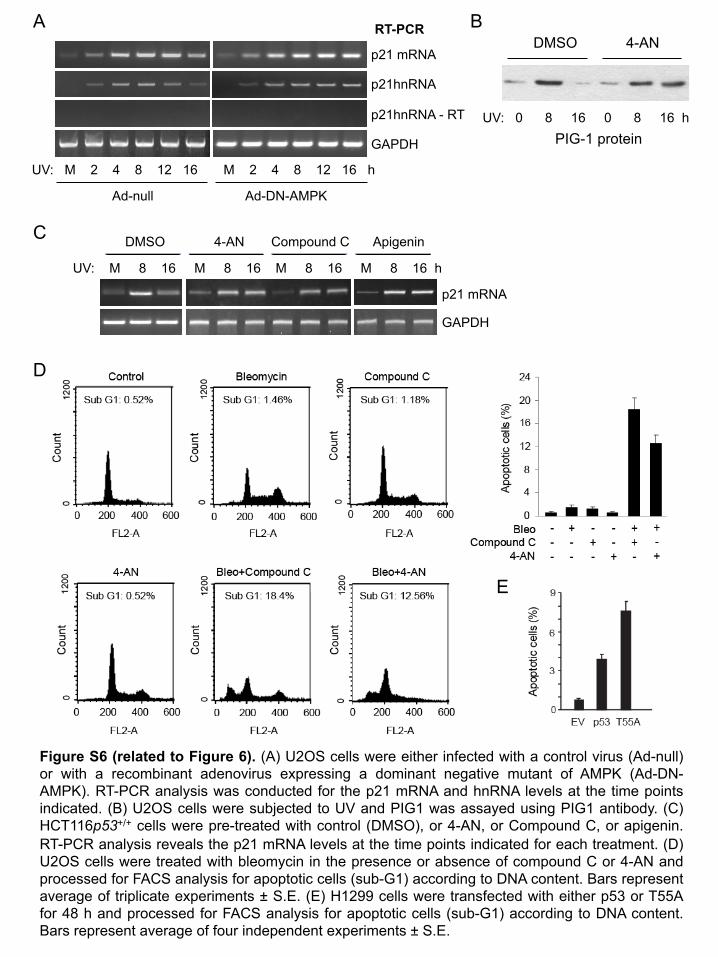
Figure S6 (related to Figure 6). (A) U2OS cells were either infected with a control virus (Ad-null) or with a recombinant adenovirus expressing a dominant negative mutant of AMPK (Ad-DN-AMPK). RT-PCR analysis was conducted for the p21 mRNA and hnRNA levels at the time points indicated. (B) U2OS cells were subjected to UV and PIG1 was assayed using PIG1 antibody. (C) HCT116p53+/+ cells were pre-treated with control (DMSO), or 4-AN, or Compound C, or apigenin. RT-PCR analysis reveals the p21 mRNA levels at the time points indicated for each treatment. (D) U2OS cells were treated with bleomycin in the presence or absence of compound C or 4-AN and processed for FACS analysis for apoptotic cells (sub-G1) according to DNA content. Bars represent average of triplicate experiments ± S.E. (E) H1299 cells were transfected with either p53 or T55A for 48 h and processed for FACS analysis for apoptotic cells (sub-G1) according to DNA content. Bars represent average of four independent experiments ± S.E.
DMSO
UV: M 8 16 M 8 16 M 8 16 M 8 16 h
p21 mRNA
GAPDH
4-AN Compound C Apigenin
A
C
UV: 0 8 16 0 8 16 h
DMSO 4-AN
PIG-1 protein
B
D
E
UV: M 2 4 8 12 16 M 2 4 8 12 16 h
Ad-null Ad-DN-AMPK
RT-PCR
p21 mRNA
p21hnRNA
p21hnRNA - RT
GAPDH
Table S1: List of p53 peaks at 0, 8, and 16 h after DNA damage Table S2: List of p53-bound Ensembl genes (within +/- 10 kb of TSS) at 8 h after DNA damage
Supplemental Experimental Procedures
Library Generation and Illumina Sequencing
ChIP experiments were performed as described previously (Li et al., 2007). Briefly,
chromatin from fixed cells was sheared with Diagenode Bioruptor to a size range
approximately 200-400 bp. Clarified nuclear lysate was pre-cleared with BSA-pre-
blocked Protein A agarose (Pierce) and Protein G Sepharose (GE Healthcare) beads at
1:1 ratio (the A/G beads) to remove nonspecific binding. 5 µg of the pre-cleared lysate
was set aside as Input DNA while 45 µg of the lysate was immunoprecipitated with anti-
p53 polyclonal antibody (FL-393, Santa Cruz) and pulled down by the A/G beads,
washed and eluted. After reversal of cross-link and RNase A treatment (Qiagen), five
independent IPs were combined, ethanol precipitated and purified using QIAquick PCR
Purification Kit. The purified ChIP DNA was quantified by Nanodrop.
DNA was amplified with the Illumina-compatible NEXTflex ChIP-Seq Kit according to
the manufacturer’s instructions (Bioo Scientific). In brief, 10 to 30 ng of ChIP DNA were
end-repaired, 3’ end-adenylated and ligated to barcoded adapters. Four cycles of PCR
was performed to enrich the ligated inserts using primers complementary to the
adapters prior to size selection on agarose gel. Since adapters add ~120 bp to each
insert, a gel slice of 320 to 520 bp was cut out and purified. The purified ligated inserts
were enriched by 14 cycles of PCR using the same primers and purified using
Agencourt AMPure XP beads (Beckman Coulter). The resulting DNA libraries were
validated and quantified by checking the size, purity, and concentration of the amplicons
on the Agilent Bioanalyzer High Sensitivity DNA chip. The libraries were pooled in
equimolar amounts, and sequenced on an Illumina HiSeq 2000 instrument to generate
50 base reads. Image deconvolution and quality values calculation were performed
using the modules of the Illumina pipeline.
Functional classification of p53 target genes
The genes where p53 binding increased more than 2-fold at 8 h after DNA damage
were functionally annotated with DAVID (Huang et al. 2009). This algorithm measures
the similarities among GO terms or KEGG pathways based on the extent of their
associated genes and assembles the similar terms or pathways into annotation clusters.
Each cluster is assigned an enrichment score to rank its biological significance. The
resulting clusters were further curated to keep only GO terms with p-values < 0.05.
References:
Li, A.G. et al. (2007). An acetylation switch in p53 mediates holo-TFIID recruitment.
Mol. Cell 28, 408-421.
Huang, da W., Sherman, B.T., and Lempicki, R.A. (2009). Systematic and integrative
analysis of large gene lists using DAVID bioinformatics resources. Nat. Protoc. 4,
44-57.


