
In the format provided by the authors and unedited.
© 2017 Macmillan Publishers Limited, part of Springer Nature. All rights reserved.
SUPPLEMENTARY INFORMATIONDOI: 10.1038/NMAT5029
NATURE MATERIALS | www.nature.com/naturematerials 1
1
Supplementary information
A step toward safer and recyclable lithium-ion capacitors using sacrificial organic lithium
salt
Authors:
P. Jeżowski1, O. Crosnier2,3, E. Deunf2, P. Poizot2,4, F. Béguin1, T. Brousse2,3*
1. Poznan University of Technology, Institute of Chemistry and Technical Electrochemistry, ul.
Berdychowo 4, 60-965 Poznan, Poland.
2. Institut des Matériaux Jean Rouxel, CNRS UMR 6502 – Université de Nantes, 2 rue de la
Houssinière BP32229, 44322 Nantes Cedex 3 , France.
3. Réseau sur le Stockage Électrochimique de l’Énergie, FR CNRS 3459, 80039 Amiens Cedex,France.
4. Institut Universitaire de France (IUF), 1 rue Descartes, 75231 Paris Cedex 05, France
© 2017 Macmillan Publishers Limited, part of Springer Nature. All rights reserved.
NATURE MATERIALS | www.nature.com/naturematerials 2
SUPPLEMENTARY INFORMATIONDOI: 10.1038/NMAT5029
2
S1. Characterisation of 3,4–dihydroxybenzonitrile dilithium salt (Li2DHBN)
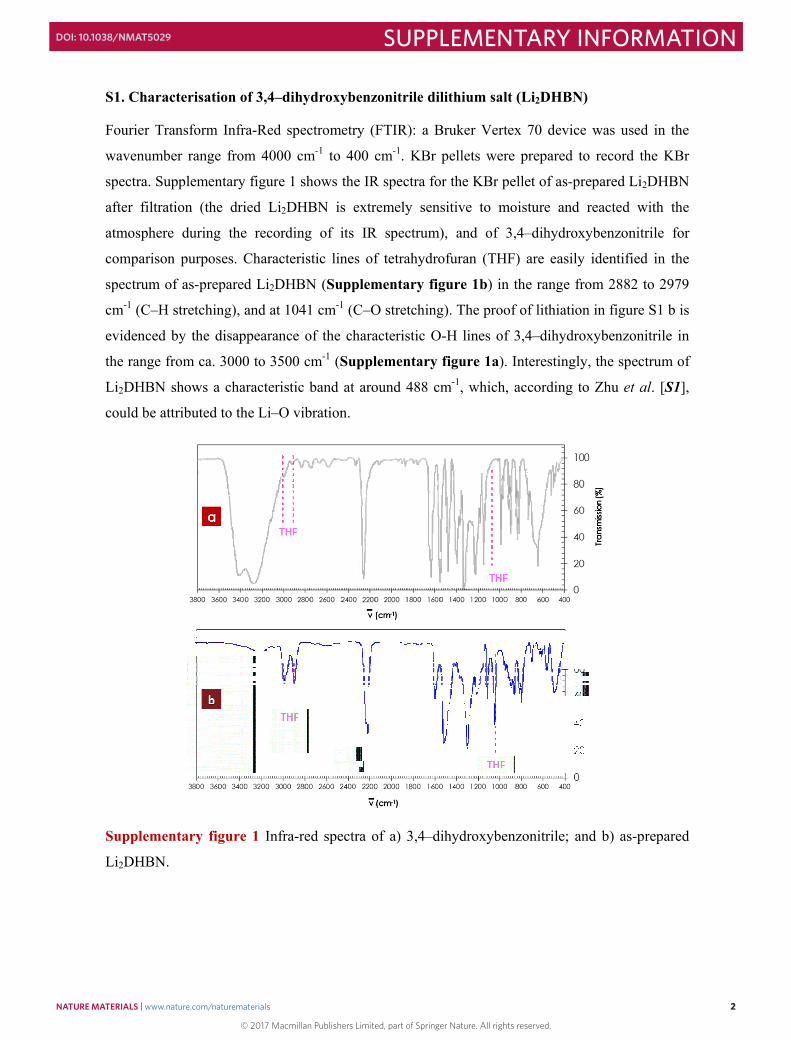
Fourier Transform Infra-Red spectrometry (FTIR): a Bruker Vertex 70 device was used in the
wavenumber range from 4000 cm-1 to 400 cm-1. KBr pellets were prepared to record the KBr
spectra. Supplementary figure 1 shows the IR spectra for the KBr pellet of as-prepared Li2DHBN
after filtration (the dried Li2DHBN is extremely sensitive to moisture and reacted with the
atmosphere during the recording of its IR spectrum), and of 3,4–dihydroxybenzonitrile for
comparison purposes. Characteristic lines of tetrahydrofuran (THF) are easily identified in the
spectrum of as-prepared Li2DHBN (Supplementary figure 1b) in the range from 2882 to 2979
cm-1 (C–H stretching), and at 1041 cm-1 (C–O stretching). The proof of lithiation in figure S1 b is
evidenced by the disappearance of the characteristic O-H lines of 3,4–dihydroxybenzonitrile in
the range from ca. 3000 to 3500 cm-1 (Supplementary figure 1a). Interestingly, the spectrum of
Li2DHBN shows a characteristic band at around 488 cm-1, which, according to Zhu et al. [S1],
could be attributed to the Li–O vibration.
Supplementary figure 1 Infra-red spectra of a) 3,4–dihydroxybenzonitrile; and b) as-prepared
Li2DHBN.
© 2017 Macmillan Publishers Limited, part of Springer Nature. All rights reserved.
NATURE MATERIALS | www.nature.com/naturematerials 3
SUPPLEMENTARY INFORMATIONDOI: 10.1038/NMAT5029
3
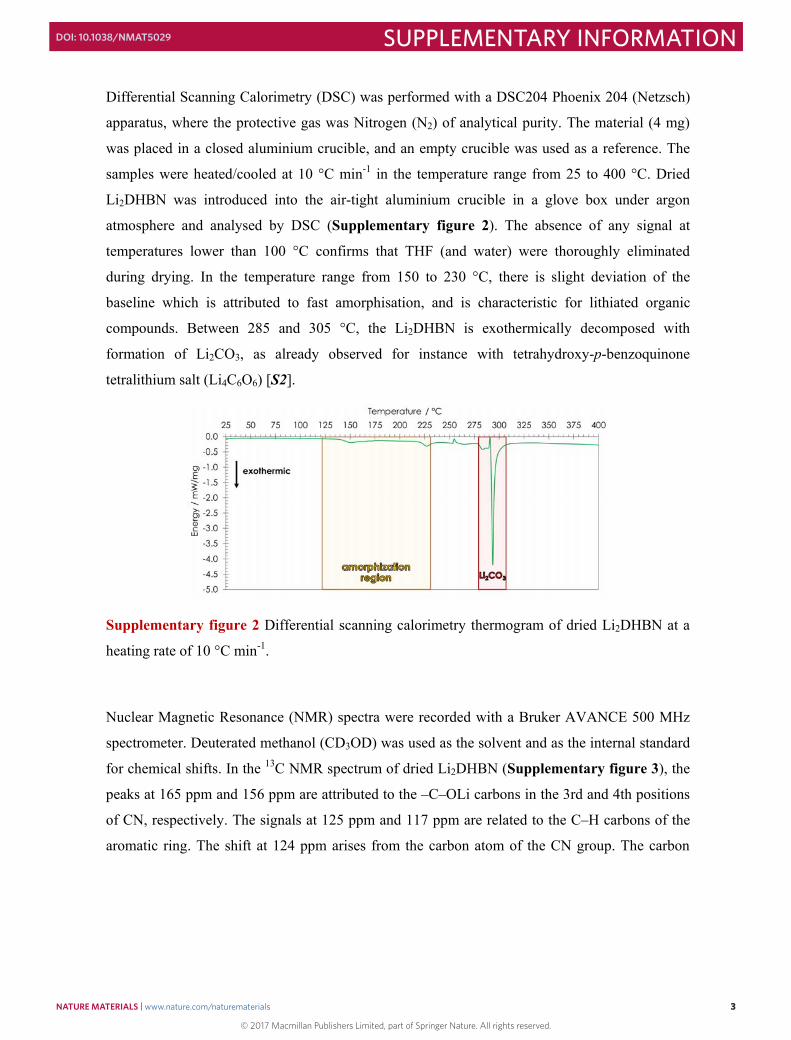
Differential Scanning Calorimetry (DSC) was performed with a DSC204 Phoenix 204 (Netzsch)
apparatus, where the protective gas was Nitrogen (N2) of analytical purity. The material (4 mg)
was placed in a closed aluminium crucible, and an empty crucible was used as a reference. The
samples were heated/cooled at 10 °C min-1 in the temperature range from 25 to 400 °C. Dried
Li2DHBN was introduced into the air-tight aluminium crucible in a glove box under argon
atmosphere and analysed by DSC (Supplementary figure 2). The absence of any signal at
temperatures lower than 100 °C confirms that THF (and water) were thoroughly eliminated
during drying. In the temperature range from 150 to 230 °C, there is slight deviation of the
baseline which is attributed to fast amorphisation, and is characteristic for lithiated organic
compounds. Between 285 and 305 °C, the Li2DHBN is exothermically decomposed with
formation of Li2CO3, as already observed for instance with tetrahydroxy-p-benzoquinone
tetralithium salt (Li4C6O6) [S2].
Supplementary figure 2 Differential scanning calorimetry thermogram of dried Li2DHBN at a
heating rate of 10 °C min-1.
Nuclear Magnetic Resonance (NMR) spectra were recorded with a Bruker AVANCE 500 MHz
spectrometer. Deuterated methanol (CD3OD) was used as the solvent and as the internal standard
for chemical shifts. In the 13C NMR spectrum of dried Li2DHBN (Supplementary figure 3), the
peaks at 165 ppm and 156 ppm are attributed to the –C–OLi carbons in the 3rd and 4th positions
of CN, respectively. The signals at 125 ppm and 117 ppm are related to the C–H carbons of the
aromatic ring. The shift at 124 ppm arises from the carbon atom of the CN group. The carbon

© 2017 Macmillan Publishers Limited, part of Springer Nature. All rights reserved.
NATURE MATERIALS | www.nature.com/naturematerials 4
SUPPLEMENTARY INFORMATIONDOI: 10.1038/NMAT5029
4
atom of the aromatic ring close to the C≡N group produces the signal at 95 ppm. The peak at 50
ppm is assigned to the deuterated solvent (CD3OD).
Supplementary figure 3 13C Nuclear magnetic resonance spectrum of dried Li2DHBN at 500
MHz. Deuterated methanol (CD3OD) was used as the solvent.
The 1H nuclear magnetic resonance (NMR) spectrum of dried Li2DHBN is presented in
supplementary figure 4. The peak at 6.4 ppm, with an integration ratio of 1, characterises the
single aromatic proton in the ortho position of –CN. The multiplet at around 6.7 ppm, with an
intensity ratio of 2, is attributed to the two other aromatic protons. The peak at 3.2 ppm is due to
protons of the incompletely deuterated methanol. The peak at 4.8 ppm is characteristic of HDO
and is attributed to the partial decomposition of Li2DHBN into 3,4–dihydroxybenzonitrile due to
moisture present in the atmosphere or the deuterated methanol.

© 2017 Macmillan Publishers Limited, part of Springer Nature. All rights reserved.
NATURE MATERIALS | www.nature.com/naturematerials 5
SUPPLEMENTARY INFORMATIONDOI: 10.1038/NMAT5029
5
Supplementary figure 4 1H nuclear magnetic resonance spectrum of dried Li2DHBN at
500 MHz. Deuterated methanol (CD3OD) was used as the solvent.
© 2017 Macmillan Publishers Limited, part of Springer Nature. All rights reserved.
NATURE MATERIALS | www.nature.com/naturematerials 6
SUPPLEMENTARY INFORMATIONDOI: 10.1038/NMAT5029
6
S2. Solubility measurement of Li2DHBN and electrochemical/thermal behaviours of both
the positive and negative electrodes in an LIC cell
Solubility evaluation of Li2DHBN in the relevant liquid electrolyte
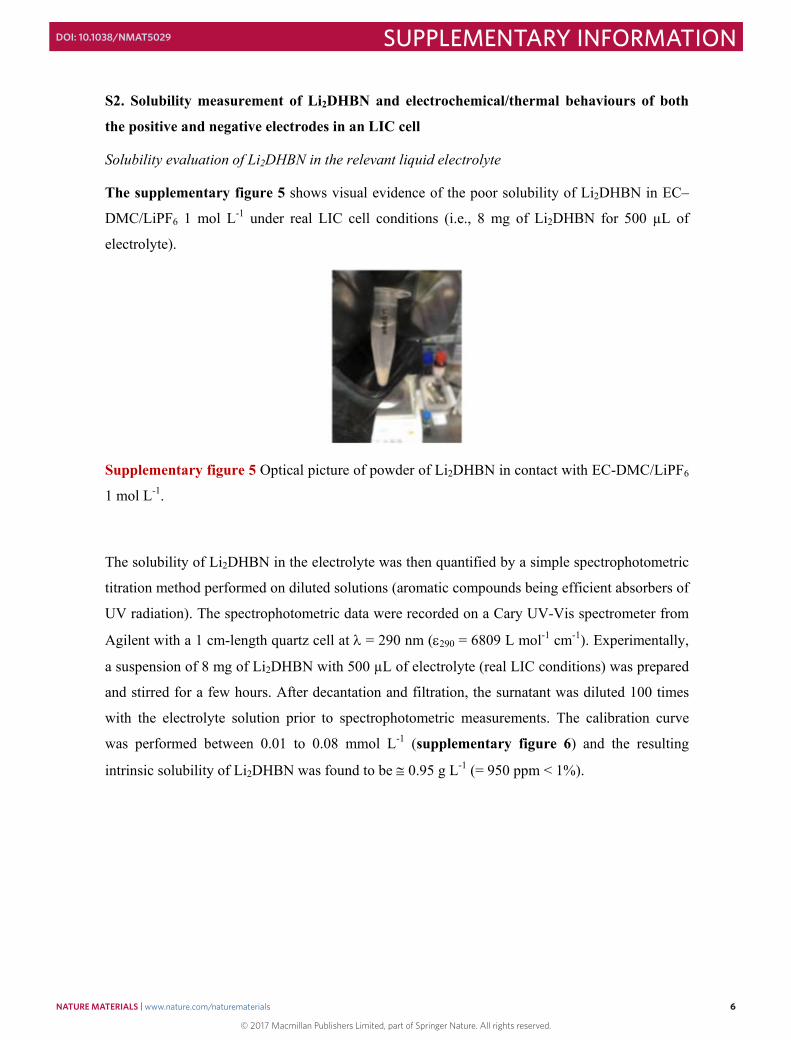
The supplementary figure 5 shows visual evidence of the poor solubility of Li2DHBN in EC–
DMC/LiPF6 1 mol L-1 under real LIC cell conditions (i.e., 8 mg of Li2DHBN for 500 µL of
electrolyte).
Supplementary figure 5 Optical picture of powder of Li2DHBN in contact with EC-DMC/LiPF6
1 mol L-1.
The solubility of Li2DHBN in the electrolyte was then quantified by a simple spectrophotometric
titration method performed on diluted solutions (aromatic compounds being efficient absorbers of
UV radiation). The spectrophotometric data were recorded on a Cary UV-Vis spectrometer from
Agilent with a 1 cm-length quartz cell at = 290 nm (290 = 6809 L mol-1 cm-1). Experimentally,
a suspension of 8 mg of Li2DHBN with 500 µL of electrolyte (real LIC conditions) was prepared
and stirred for a few hours. After decantation and filtration, the surnatant was diluted 100 times
with the electrolyte solution prior to spectrophotometric measurements. The calibration curve
was performed between 0.01 to 0.08 mmol L-1 (supplementary figure 6) and the resulting
intrinsic solubility of Li2DHBN was found to be 0.95 g L-1 (= 950 ppm < 1%).

© 2017 Macmillan Publishers Limited, part of Springer Nature. All rights reserved.
NATURE MATERIALS | www.nature.com/naturematerials 7
SUPPLEMENTARY INFORMATIONDOI: 10.1038/NMAT5029
7
Supplementary figure 6 UV-Vis calibration line together with the corresponding value defining
the intrinsic solubility of Li2DHBN in EC-DMC/LiPF6 1 mol L-1 (red dot).
Electrochemical behaviour
A free-standing positive electrode material with PTFE as the binder was prepared inside an
argon-filled glove box under the same conditions as described in the paragraph Methods of the
article. In order to estimate the oxidation limit of the positive electrode material, the anodic
polarisation of the composite electrode was prolonged to higher potentials. As evidenced in
supplementary figure 7, after the first irreversible lithium extraction plateau, there is a potential
rise followed by another endless irreversible plateau at a potential higher than 4.5 V vs. Li+/Li0,
which might be associated to electrolyte oxidation (Supplementary figure 7b). The exact value
of irreversible lithium extraction capacity was thus determined by the position of the inflexion
point, at ca. 360 mAh g-1 in supplementary figure 7a, thereby demonstrating that all the lithium
present in Li2DHBN (theoretical value of 365 mAh g-1) is available for graphite lithiation.

© 2017 Macmillan Publishers Limited, part of Springer Nature. All rights reserved.
NATURE MATERIALS | www.nature.com/naturematerials 8
SUPPLEMENTARY INFORMATIONDOI: 10.1038/NMAT5029
8
Supplementary figure 7 Galvanostatic charge/discharge profiles of 3,4-dihydroxybenzonitrile
dilithium salt at C/10. The lithium extraction takes place until ca. 4.0 V vs. Li+/Li0. The second
plateau at ca. 4.5 V vs. Li+/Li0 is attributed to side reactions such as electrolyte oxidation. The
electrode was composed of 65 wt.% Li2DHBN, 30 wt.% carbon black and 5 wt.% PTFE binder.
The experiments were performed in a 1 mol L-1 LiPF6 dissolved in EC: DMC (vol. ratio 1:1)
electrolyte with metallic lithium as the counter/reference electrodes.
Operando spectroelectrochemical measurements of pure Li2DHBN were also performed using a
miniature fibre-optic spectrophotometer (FLAME-S-XR1-ES, Ocean Optics) in glove box. The
sacrificial organic salt was deposited by dip-coating onto an Indium tin oxide (ITO) electrode
using DMC as the dispersive solvent (supplementary figure 8 top), and then placed in a 1-cm-
long quartz cell filled with EC-DMC/LiPF6 1 mol L-1 (1.5 mL). The coated ITO electrode was
then oxidized to 4.4 V vs. Li+/Li0 using the Potentiostatic Intermittent Titration Technique (PITT)
(supplementary figure 9), and removed from the electrolyte. No deposit is to be seen on the ITO
electrode (supplementary figure 8 bottom), thus demonstrating the dissolution of the delithiated
form of Li2DHBN (i.e., DOBN) in the electrolyte. The presence of dissolved molecules was
further assessed by monitoring the UV-visible response (supplementary figure 10), which
clearly shows a change in the electrolyte spectrum after first oxidation of the Li2DHBN-coated
ITO electrode.

© 2017 Macmillan Publishers Limited, part of Springer Nature. All rights reserved.
NATURE MATERIALS | www.nature.com/naturematerials 9
SUPPLEMENTARY INFORMATIONDOI: 10.1038/NMAT5029
9
Supplementary figure 8 Optical pictures of the ITO electrode (0.5 cm wide) covered by
Li2DHBN in the initial state (top) and after oxidation (bottom).
Supplementary figure 9 PITT charge profile of pure Li2DHBN deposited onto the ITO
electrode, measured during the in-operando spectroelectrochemical experiment in an argon-filled
glove box: 1-cm-long quartz cell filled with EC-DMC/LiPF6 1 mol L-1 (1.5 mL) and recorded
versus lithium metal.

© 2017 Macmillan Publishers Limited, part of Springer Nature. All rights reserved.
NATURE MATERIALS | www.nature.com/naturematerials 10
SUPPLEMENTARY INFORMATIONDOI: 10.1038/NMAT5029
10
Supplementary figure 10 Corresponding UV-Vis response of the electrolyte after oxidation of
Li2DHBN deposited onto the ITO electrode to 4.4 V vs. Li+/Li0 by Potentiostatic Intermittent
Titration Technique. The concentration of DOBN is so great that the measured signal is saturated
in the UV region.
The same experiment was carried out in a Swagelok cell with a custom-made Teflon ring (11 mm
in diameter, 5 mm thick) where the amount of electrolyte was exactly 500 µL, which is the same
amount as in the separator of a full cell. After oxidation of the composite electrode (40 wt.% AC,
40 wt.% Li2DHBN, 15 wt.% Super C65 and 5wt.% PTFE) at 4.5V vs. Li+/Li0, the electrolyte was
removed from the cavity inside the Swagelok cell. As can be seen in supplementary figure 11,
the electrolyte turned a brownish colour.
Supplementary figure 11 Optical pictures of the electrolyte after oxidation of a composite
electrode (40 wt.% AC, 40 wt.% Li2DHBN, 15 wt.% Super C65 and 5wt.% of PTFE) at 4.5V vs
Li+/Li0

© 2017 Macmillan Publishers Limited, part of Springer Nature. All rights reserved.
NATURE MATERIALS | www.nature.com/naturematerials 11
SUPPLEMENTARY INFORMATIONDOI: 10.1038/NMAT5029
11
The ionic conductivity of the electrolyte was measured after oxidation. No noticeable change was
observed between the ionic conductivity of the electrolyte in contact with the Li2DHBN-loaded
positive electrode, either at 293 K (10.4 ± 1.0 mS cm-1) or after oxidation (9.9 ± 1.0 mS cm-1).
Thus the oxidized form of Li2DHBN (i.e., DOBN), although completely dissolved in the
electrolyte, does not have significant influence on the ionic conductivity of the medium and
subsequently will not affect the power capability of our LIC.
Concomitantly, SEM images (supplementary figure 12) of electrodes, before a), b) and after
extraction of lithium from the organic molecule c), d), show that after the prelithiation process
using Li2DHBN (first charge) there are visible holes in surface of the electrode (one of the
regions with visible holes is marked with a red circle in supplementary figure 12c). This
observation is in agreement with the mass loss measured before and after lithium extraction
(solubilized DOBN molecules). Higher magnifications (b and d) show that the texture of the
electrode has changed after the lithium extraction process, including some holes and cracks,
which are not, however, detrimental to the cycling ability.
Supplementary figure 12 SEM images of composite positive electrodes (40 wt.% AC, 40
wt.% Li2DHBCN, 15 wt.% Super C65 and 5wt.% PTFE) before a), b) and after extraction of
lithium from the organic molecule Li2DHBN, which is the part of the positive composite
electrode c), d), at magnifications 100x a), c) and 200x b), d).

© 2017 Macmillan Publishers Limited, part of Springer Nature. All rights reserved.
NATURE MATERIALS | www.nature.com/naturematerials 12
SUPPLEMENTARY INFORMATIONDOI: 10.1038/NMAT5029
12
Self-discharge measurements were performed on a two-electrode LIC cell, where the positive
electrode was loaded with Li2DHBN. A lithium reference electrode was added to monitor the
behaviour of individual electrodes (supplementary figure 13). After the first oxidation of the
composite positive electrode, the cell was polarized at 4 V for 2 hours, and then the open-circuit
voltage and potential were recorded.
Supplementary figure 13: Self-discharge plot of an LIC with a sacrificial composite positive
electrode based on Li2DHBCN. The composition of the positive electrode is 40 wt.% AC, 40
wt.% Li2DHBCN, 15 wt.% Super C65 and 5wt.% PTFE. The electrolyte is 1 mol L-1 LiPF6 in
EC: DMC. The black solid line represents the cell voltage; the red and the blue lines are the
potential profiles of the positive and negative electrodes, respectively.
According to supplementary figure 13, the positive electrode is mainly responsible for the
voltage decrease during the 20-hour OCV period. The potential fade of the positive electrode is
equal to 16% after 20 hours, i.e. it drops from 4.0 V vs. ref. Li+/Li0 to 3.6 V vs. ref. Li+/Li0.
Correspondingly, the potential of the negative electrode increased from 90 mV vs. ref. Li+/Li0 to
135 mV vs. ref. Li+/Li0 during the same OCV period. From the supplementary figure 13, it is
clear that there is no redox shuttle effect due to the dissolved DOBN molecules. Indeed, a 0.4V
loss over 20 hours is a commonly measured value for lithium-ion capacitors with an LP30
electrolyte [S3], and for symmetrical activated carbon electrochemical capacitors [S4].

© 2017 Macmillan Publishers Limited, part of Springer Nature. All rights reserved.
NATURE MATERIALS | www.nature.com/naturematerials 13
SUPPLEMENTARY INFORMATIONDOI: 10.1038/NMAT5029
13
Thermal behaviour of the Li2DHBN/AC composite positive electrode in an LIC cell
DSC measurements of both the positive and the negative electrodes of LIC cells were performed
before (OCP state) and after the first charge (supplementary figure 14). These experiments were
conducted using a Q20 DSC (TA instruments) heat-flux differential calorimeter at a heating rate
of 10 K/min in a temperature range of 25–400 °C under a constant argon flow of 200 mL/min.
Experimentally, the LIC cells were carefully dismantled in a glove box and the recovered
samples (studied material with its electrolyte) were introduced into an aluminium crucible, which
was then sealed. The loaded DSC crucibles were pierced prior to measurement.
Supplementary figure 14 Galvanostatic profile upon the first charge of an LIC cell using 66
wt% Li2DHBN mixed with 33 wt% carbon black (Super C65, Imerys) as the composite positive
electrode, and graphite (SLC 1512P, Superior Graphite) as the negative electrode, recorded at a
cycling rate of C/10 using EC–DMC/LiPF6 1 mol L-1 as the electrolyte.

© 2017 Macmillan Publishers Limited, part of Springer Nature. All rights reserved.
NATURE MATERIALS | www.nature.com/naturematerials 14
SUPPLEMENTARY INFORMATIONDOI: 10.1038/NMAT5029
14
Supplementary figure 15 Typical DSC traces of the positive electrode (66 wt% Li2DHBN and
33wt% carbon black) and negative electrode (graphite), gathered a) before cycling the cell and b)
after the first charge, without rinsing the electrodes after battery dismantling. All DSC
measurements were recorded under Ar flow (200 mL min-1) in a pierced crucible.
After the first charge, both electrodes exhibited a weak exothermic peak at 120°C and 150°C for
the positive and negative electrodes, respectively (supplementary figure 15b). The heat
generated at the charged positive electrode soaked in the electrolyte was a mere 63 J g-1. That at
the charged negative electrode is in the same order of magnitude (79 J g-1). These values are well
below those reported in literature for lithiated graphite electrodes in lithium-ion batteries using
different graphite electrodes, where it was found that the exothermic peak corresponds to 725 J g-
1 [S5].
S3. Alternative prelithiation conditions of the graphite negative electrode
Supplementary figure 16 shows the electrochemical prelithiation of graphite achieved by
galvanostatic cycling, where the S.E.I. was formed at C, and intercalation at C/10 (C is the
theoretical capacity of graphite, i.e. 372 mAh g-1). The potential limits were fixed at 4.00 vs.
Li+/Li0 for the positive electrode and at 0.01 V vs. Li+/Li0 for the negative one, in order to prevent
electrolyte oxidation and lithium plating, respectively. When the potential of the negative
electrode reached 0.20 V vs. Li+/Li0 (at which point it can be considered that the S.E.I. is totally
formed), the potential of the positive electrode was ca. 3.95 V vs. Li+/Li0, which is very close to

© 2017 Macmillan Publishers Limited, part of Springer Nature. All rights reserved.
NATURE MATERIALS | www.nature.com/naturematerials 15
SUPPLEMENTARY INFORMATIONDOI: 10.1038/NMAT5029
15
the positive electrode limit. Therefore, at this point, the cell was left at open circuit potential for 2
h, after which the lithium was intercalated at C/10. These conditions were already optimised
through our former research dedicated to the use of Li5ReO6 as the irreversible lithium source for
LICs [S6]. In supplementary figure 16 it can be seen that the total capacity is around 250 mAh
g-1, which is much lower than the expected 360 mAh g-1 found in figure 3b, when the current is
fixed at C/10. Hence, it seems that the presence of Li2DHBN modifies the optimal conditions of
the prelithiation step. This thus implies that a certain amount of Li2DHBN might have been
dissolved, probably due to the use of an excessively high current (C) during the S.E.I. formation.
Supplementary figure 16 Profiles for the electrodes potential and cell voltage during
galvanostatic S.E.I. formation and graphite lithiation facilitated by a composite positive
electrode composed of 40 wt.% AC, 40 wt.% Li2DHBN, 15 wt.% carbon black and 5 wt.%
PTFE. The S.E.I. was formed at C until reaching a potential of 0.2 V vs. Li+/Li0 (area highlighted
in green); then, after a rest period of 2 h, the lithium was intercalated into the graphite at C/10
(area highlighted in yellow). The potential limits for the positive and negative electrodes are 4.0
V and 0.01 V vs. Li+/Li0, respectively. Colour of the curves: dashed red for the potential of the
positive electrode; dotted blue for the potential of the negative electrode; black for the cell
voltage profile. The electrolyte is 1 mol L-1 LiPF6 in EC: DMC.

© 2017 Macmillan Publishers Limited, part of Springer Nature. All rights reserved.
NATURE MATERIALS | www.nature.com/naturematerials 16
SUPPLEMENTARY INFORMATIONDOI: 10.1038/NMAT5029
16
S4. Optimisation of cell voltage range for an LIC cell obtained after graphite prelithiation
at C/10
In order to enhance the energy of the LIC based on the renewable lithium source, we tried
slightly increasing the maximum voltage value to 4.1 V. The prelithiation was performed under
the conditions shown in figure 3b. Unfortunately, as shown in supplementary figure 17, there is
a slight but visible continuous capacitance decay, which might be connected to electrolyte
oxidative decomposition, and this decay accelerates when the current is set to 0.65 A g-1 after
1350 cycles. Hence, to promote the stable operation of the LIC based on a positive electrode
containing delithiated Li2DHBN, it is necessary to restrict the upper voltage limit to 4 V, as
confirmed by supplementary figure 17. This value seems to be even slightly higher than that of
3.8 V put forward by JM Energy for the ULTIMO system [S7].
Supplementary figure 17 Cycle life of an LIC with a sacrificial composite positive electrode
based on Li2DHBN where S.E.I.. formation and prelithiation was performed at C/10. The LIC
was cycled at 0.25 A g-1 (blue squares), 0.50 A g-1 (green circles) and 0.65 A g-1 (red diamonds)
in the voltage range from 2.2 to 4.1 V. The electrolyte was 1 mol L-1 LiPF6 in EC:DMC.
In order to avoid possible plating at higher currents, the upper voltage limit should be decreased,
which can be achieved by using a system such as the ULTIMO (constructed by JM Energy) that
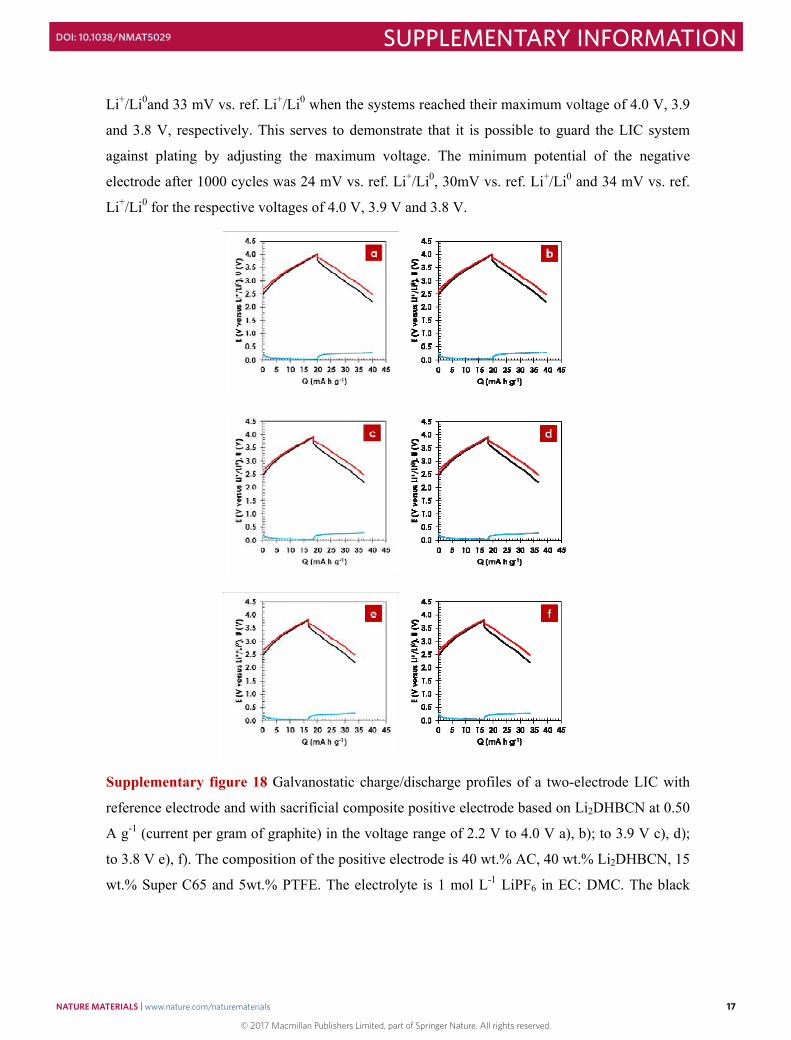
is operated within a 2.2 to 3.8 V voltage range. Three separate two-electrode cells with reference
electrode were assembled and tested in different voltage ranges seen in supplementary figure 18
a), b) 2.2 – 4.0 V, c), d) 2.2 – 3.9 V and e), f) 2.2 – 3.8 V at current 0.5 A g-1. The plots a), c) and
e) present the initial galvanostatic charge/discharge cycles, whereas plots b), d), f) show those
recorded after 1000 cycles at corresponding voltage ranges. A noticeable difference was observed
in the lowest values of potential for the negative electrode: 23 mV vs. ref. Li+/Li0, 29 mV vs. ref.
© 2017 Macmillan Publishers Limited, part of Springer Nature. All rights reserved.
NATURE MATERIALS | www.nature.com/naturematerials 17
SUPPLEMENTARY INFORMATIONDOI: 10.1038/NMAT5029
17
Li+/Li0and 33 mV vs. ref. Li+/Li0 when the systems reached their maximum voltage of 4.0 V, 3.9
and 3.8 V, respectively. This serves to demonstrate that it is possible to guard the LIC system
against plating by adjusting the maximum voltage. The minimum potential of the negative
electrode after 1000 cycles was 24 mV vs. ref. Li+/Li0, 30mV vs. ref. Li+/Li0 and 34 mV vs. ref.
Li+/Li0 for the respective voltages of 4.0 V, 3.9 V and 3.8 V.
Supplementary figure 18 Galvanostatic charge/discharge profiles of a two-electrode LIC with
reference electrode and with sacrificial composite positive electrode based on Li2DHBCN at 0.50
A g-1 (current per gram of graphite) in the voltage range of 2.2 V to 4.0 V a), b); to 3.9 V c), d);
to 3.8 V e), f). The composition of the positive electrode is 40 wt.% AC, 40 wt.% Li2DHBCN, 15
wt.% Super C65 and 5wt.% PTFE. The electrolyte is 1 mol L-1 LiPF6 in EC: DMC. The black

© 2017 Macmillan Publishers Limited, part of Springer Nature. All rights reserved.
NATURE MATERIALS | www.nature.com/naturematerials 18
SUPPLEMENTARY INFORMATIONDOI: 10.1038/NMAT5029
18
solid line represents the cell voltage; the red and the blue lines are the potential profiles of the
positive and negative electrodes, respectively. For the purpose of monitoring the potential of each
electrode, it was necessary to use a1550-μm-thick separator.
References
[S1] Cai, W., Wang, H., Sun, D., Zhang, Q., Yao, X. & Zhu, M. Destabilization of LiBH4
dehydrogenation through H+–H- interactions by cooperating with alkali metal hydroxides. RSC
Adv. 4, 3082–3089 (2014).
[S2] Chen, H., Armand, M., Courty, M., Jiang, M., Grey, C.P., Dolhem, F., Tarascon, J.-M. &
Poizot, P. Lithium salt of tetrahydroxybenzoquinone: toward the development of a sustainable Li-
ion battery. J. Am. Chem. Soc. 131, 8984–8988 (2009).
[S3] Decaux, C., Lota, G., Raymundo-Piñero, E., Frackowiak, E. & Béguin F. Electrochemical
performance of a hybrid lithium-ion capacitor with a graphite anode preloaded from lithium
bis(trifluoromethane)sulfonimide-based electrolyte, Electrochim. Acta 86, 282–286 (2012).
[S4] Hao, C., Wang, X., Yin, Y., & You, Z. Analysis of Charge Redistribution During Self-
discharge of Double-Layer Supercapacitors, J. Electron. Mater. 45, 2160–2171 (2016).
[S5] Eshetu, G., Grugeon, S., Gachot, G., Mathiron, D., Armand, M., & Laruelle, S. LiFSI vs.
LiPF6 electrolytes in contact with lithiated graphite: Comparing thermal stabilities and
identification of specific SEI-reinforcing additives. Electrochim. Acta 102, 133–141 (2013).
[S6] Jeżowski, P., Fic, K., Crosnier, O., Brousse, T. & Béguin, F. Lithium rhenium(VII) oxide as
a novel material for graphite prelithiation in high performance lithium-ion capacitors. J. Mater.
Chem. A 4, 12609–12615 (2016).
[S7] http://www.jmenergy.co.jp/en/, accessed January 2017.


![Bibliography - Springer978-3-322-80039-8/1.pdf · Bibliography [1] L. Abdelouhab. ... Linear Operators, Part 1: ... Sur les operateurs de Green des problemes Cauchy ab](https://cdn.vdocuments.net/doc/165x107/5b787f207f8b9a703b8ba1d4/bibliography-springer-978-3-322-80039-81pdf-bibliography-1-l-abdelouhab.jpg)